Abstract
There exists an intermediate group of individuals whose glucose levels do not meet the criteria for diabetes yet are higher than those considered normal (prediabetes mellitus (preDM)). Those people have a higher risk of developing diabetes in the future. Gynura bicolor (GB) is a red-purple-colored vegetable, which is common in Taiwan. GB has shown antioxidant, anti-inflammatory and anti-hyperglycemic effects in previous studies. The aim of this study was to assess the effects of serving two serving sizes of GB every day on the glycemic control and antioxidant ability of preDM subjects. According to the age and anthropometry data of the participates, we assigned them into a control or GB group for the 8-week intervention and 4-week washout period. Data of anthropometry and biochemical analysis were collected at 0, 8 and 12 weeks. Oral glucose tolerance tests were performed, and we collected dietary records on the baseline and Week 8. Both groups received nutrition education and a diet plan individually. After intervention, the fasting glucose and malondialdehyde (MDA) values were significantly decreased in the GB group. HOMA-IR and QUICKI values were improved, and antioxidant activity was increased in the GB group. GB could improve glycemic control and decrease oxidative stress because of its large amounts of polyphenols.
1. Introduction
According to The American Diabetes Association (ADA), people whose fasting plasma glucose (FPG) level is 100 to 125 mg/dL were defined as impaired fasting glucose (IFG), or whose 2 h value in the oral glucose tolerance test (OGTT) is 140 to 199 mg/dL were defined as impaired glucose tolerance (IGT), or individuals with glycated hemoglobin (HbA1c) of 5.7–6.4%. People who meet one of three diagnosis criteria were called “prediabetes (preDM)” []. Individuals with both IFG and IGT have more severe dysglycemic condition and are especially at high-risk for type 2 diabetes []. According to the International Diabetes Federation (IDF), in 2019, there were 463 million people with preDM, and this number is expected to reach 700 million by 2045 []. In total, 5–10% of individuals with preDM develop diabetes annually, with up to 70% eventually developing diabetes. Several trials have reported on the risk of diabetes development in preDM individuals after lifestyle and drug-based interventions. PreDM can convert back to normoglycaemia [,].
Under hyperglycemia or IR condition, oxidative stress will be increased and endothelial dysfunction will occur []. The endothelium is a key regulator of vascular function [], when dysfunction will cause inflammation, vasoconstriction, thrombosis and platelet activation, which are linked with atherosclerosis []. Evidence from prospective studies suggest that cardiovascular disease (CVD) may be associated with preDM []. Lifestyle intervention includes diet modification, weight reduction or moderate physical activity. Some studies reported that intensive lifestyle interventions such as achieving and maintaining ideal body weight may prevent the progression to type 2 diabetes in IGT or IFG subjects []. In the Da Qing trial in China, 577 individuals with IGT were randomized to dietary counseling, increased exercise, diet plus exercise or control (general recommendations). The cumulative 6-year incidence of diabetes was significantly lower in the diet group (43.8%), the exercise group (41.1%) and diet plus exercise group (46.0%) than the control group (67.7%). In a proportional hazards analysis adjusted for differences in baseline BMI and fasting glucose, the diet, exercise, and diet-plus-exercise interventions were associated with 31% (p < 0.03), 46% (p < 0.0005), and 42% (p < 0.005) reductions in risk of developing diabetes, respectively []. In a meta-analysis, it was reported that consuming large amounts of vegetables and fruits may reduce the risk of diabetes and associate to inflammation and oxidative stress []. Giugliano reported that diets containing vegetables and fruits, n-3 fatty acids and fiber attenuate the inflammation []. Phytochemicals such as vitamin C, vitamin E, carotenoids, phytosterols, anthocyanins and alkaloids showed anti-inflammation and antioxidant effects [].
Anthocyanins belong to the widespread class of phenolic compounds collectively named flavonoids. Mechanic studies support the beneficial effects of flavonoids, including anthocyanins, on the biomarkers of CVD risk such as NO, inflammation and endothelial dysfunction. The role of anthocyanins in CVD prevention is strongly related to against oxidative damage []. Red-purple vegetables are rich in anthocyanins, the common vegetables in Taiwan such as purple-leaved sweet potato, Gynura bicolor (GB) and purple-leaved celosia. GB is widely distributed in Asia and common cuisine in Taiwan. The leaves of GB distinctively show a reddish purple color on the abxial side and a green color on the adaxial side. Gynura is used as traditional Chinese medicine for treatment of inflammation, fever, hypertension and diabetes [,]. GB has been shown to have antioxidant, anti-inflammatory and anti-hyperglycemic effects [,,]. However, limited clinical human studies have examined the effects on glycemic control and antioxidant ability in preDM subjects.
The aim of this study was to assess the effects of serving two exchanges of GB per day on glycemic control and antioxidant ability on preDM subjects.
2. Materials and Methods
2.1. GB Extract Preparation
Fresh GB was obtained from Taiwan Seed Improvement and Propagation Station, COA, Taiwan. Leaves of GB were removed, washed, dried and ground to fine powder. The extract was produced from 100 mg of the lyophilized vegetable powder with a 10-fold volume of 70% methanol (0.1% of HCl) in the shaker for 30 min at room temperature, then centrifuged at 1400× g for 10 min at 4 °C, adjusted the volume of supernant and repeated extraction for 3 times. The collected extracts were kept at −20 °C until used for total polyphenol and total anthocyanin analysis.
2.2. Total Polyphenol and Total Anthocyanin Analysis of GB Extracts
Total polyphenol contents were determined by the colorimetric method using Folin–Ciocalteau reagent []. Briefly, the extracts, blank or standard (galic acid), were added to 2 mL of 2% Na2CO3. After 2 min, 100 μL of 50% Folin–Ciocalteau reagent was added. The mixture was left at room temperature in the absence of light for 30 min. The absorbance of the colored product was measured at 750 nm. The standard curve of gallic acid was used for calculating the polyphenol contents.
Total anthocyanins were determined by using the pH differential method []. Before analysis, two dilutions of the sample were prepared, one for pH 1.0 using potassium hydroxide buffer (0.025 M, KOH) and the other for pH 4.5 using sodium acetate buffer (0.4 M, 54.4 g CH3COONa). Samples were diluted 100 times and waited 15 min. The absorbance was measured at 520 and 700 nm. The concentration (mg/L) of each anthocyanin was calculated according to the following formula and expressed as cyanidin-3-glucoside equivalent (CGE):
where A is the absorbance =, MW is the molecular weight (g/mol) = 449.2 g/mol for cyanidin-3-glucoside, DF is the dilution factor = 100, and ε is the extinction coefficient = 26,900, where L (path length in cm) was 1.
2.3. Subjects
Subjects were recruited from the neighborhood near by Taipei Medical University. Inclusion criteria include whose blood glucose data meet the preDM diagnosis: FPG 100–125 mg/dL or 2 h values in the OGTT 140–190 mg/dL or HbA1c 5.7–6.4% and 20–70 years old. Exclusion criteria were individuals with a history of diabetes or use hypoglycemic agents/insulin in past 3 months, hepatic or renal disease, history of cardiovascular disease or cancer, pregnancy, breast feeding, or intending to become pregnant during the study period, thyroid or pituitary disease, gastrointestinal disease, hematological disorders or neurological disease, drinking alcohol or smoker. Written informed consent was obtained from all subjects, and the study was approved by the Joint Institutional Review Board at Taipei Medical University in Taiwan (JIRB number: 201307030).
2.4. Study Design
The 12-week study consisted of an 8-week intervention period (Week 0 to Week 8) and a 4-week washout period (Week 8 to Week 12). Subjects were assigned to the control group (prohibit eating red-purple food) or GB group (diet including 2 serving sizes of GB, equivalent to 200 g of edible portion (E.P)). The experimenter weighed GB, and asked the participants to take it home every week and cook it it by themselves. Both groups received dietary counseling based on the guideline of the Taiwanese Association of Diabetes Educators. Subjects were asked to do a 3-day dietary record (2 weekdays and 1 weekend) at Week 0 and 8, and the compliance was checked by dietary record. Every 4 weeks of the intervention period (Week 0, 4 and 8) and 4 weeks washout period (Week 12), anthropometric data and blood pressure were measured. Anthropometric data included height, weight, body composition, body mass index (BMI), waist and hip circumference and waist to hip ratio. Body composition was measured by Inbody 3.0 (Biospace, Seoul, Korea) according to the principle of biochemical impedance analysis (BIA). At Week 0 and Week 8, blood samples were collected after they had fasted overnight.
2.5. Blood Sample Analysis
Plasma collected by centrifugation at 1500× g for 10 min at 4 °C was stored at −80 °C until further analysis. Fasting glucose, fasting insulin and glycated hemoglobin (HbA1c), total cholesterol (TC), high-density lipoprotein cholesterol (HDL-C), low-density lipoprotein cholesterol (LDL-C), aspartate transaminase (AST) and alanine transaminase (ALT) levels were analyzed at the laboratory of Taipei Medical University Hospital. Homeostatic model assessment-insulin resistance (HOMA-IR) was calculated according to the formula insulin (µU/mL) × glucose (mmol/L)/22.5, and the quantitative insulin sensitivity check index (QUICKI) was calculated according to the formula 1/[log (fasting insulin) + log (fasting glucose)]. Total polyphenol levels in plasma were measured by the method described by Serafini et al. [] using Folin–Ciocalteau reagent. Absorption at 750 nm was measured spectrophotometrically. The other blood measurements included the ferric reducing ability of plasma (FRAP), vitamin C and malondialdehyde (MDA), which involved standardized methods. Glutahione peroxidase (GSH-Px) and IL-6 were measured using Cayman standard glutathione assay kit and R&D human IL-6 high sensitivity ELISA kit, respectively. The total polyphenol content was expressed as gallic acid equivalent (GAE).
2.6. Dietary Nutrient Intake Analysis
Daily nutrient intake was calculated as the mean daily intake from a 3-day dietary record using the nutrient analysis software (E-kitchen, Taichung, Taiwan). Nutrient assessment included total caloric intake, dietary macronutrient intake (protein, fat and carbohydrate), dietary fiber, vitamin C and vitamin E.
2.7. Statistical Analysis
All data were expressed as the mean ± SEM. The data were analyzed using one-way ANOVA followed by Duncan’s multiple range test, Mann–Whitney U test and paired t-test. A value of p < 0.05 was used to indicate statistical significance.
3. Results
3.1. Total Polyphenols and Total Anthocyanins of GB
The total polyphenol of GB extract was 25.54 ± 1.77 mg GAE/g DW. The total anthocyanin of GB extract was 1.53 ± 0.15 mg CGE/g DW.
3.2. Baseline Characteristics and Dietary Intake of Subjects
Nine subjects (two male and seven female) assigned to the control group and nine subjects (two male and seven female) assigned to the GB group completed the whole study period. General baseline characteristics were shown in Table 1. There were no differences in age or height. Although the dietary fiber intake of both groups did not show significant differences at baseline, the intake in the GB group was significantly increased (36%) after intervention (Table 2).

Table 1.
Baseline subject characteristics.
Table 2.
Dietary intake during study period.
3.3. Glycemic-Control-Related Markers
Glycemic-control-related markers were shown in Table 3. At baseline, there was no difference in FPG, fasting insulin, HOMA-IR and QUICKI between groups. After an 8-week intervention, FPG and HOMA-IR were significantly decreased in the GB group when compared with baseline. In addition, the results remain maintain after the 4-week washout period (Week 12). The changes of fasting insulin, HOMA-IR and QUICKI in the GB group were significant when compared with the control group (Δ0–8 week).
Table 3.
Effects of Gynura bicolor on glycemic control profile.
3.4. Anthropometric Measures, Blood Pressure, Lipid Profile and Liver Function
Anthropometric measures included weight, BMI, body fat, fat-free mass, waist circumference, hip circumference and waist:hip ratio. There were no differences at baseline, Week 4, Week 8 and Week 12 between groups or within groups (Table 4). Blood pressure, TC, HDL-C, LDL-C, AST, and ALT levels did not differ between groups or within groups at baseline, Week 4, Week 8 and Week 12 (Table 5 and Table 6).
Table 4.
Effects of Gynura bicolor on anthropometric and body composition measures.
Table 5.
Effects of Gynura bicolor on blood pressures.
Table 6.
Effects of GB on blood lipid profile and liver function 1–3.
3.5. Oxidative-Stress-Related Markers
Oxidative-stress-related markers were shown in Figure 1. At baseline, vitamin C (Figure 1a), total polyphenol (Figure 1b) and MDA (Figure 1e) in the GB group were significantly different when compared with the control group. The baseline total polyphenol level in the GB group was significantly lower when compared to the control group (0.39 ± 0.01 vs. 0.43 ± 0.01). After asking clients to avoid red-purple food for 8 weeks, the total polyphenol level in the control group was significantly decreased when comparing Week 8 to Week 0, though neither group showed any differences at Week 8. Although FRAP was significantly increased in both control and GB groups after 8 weeks, the delta value from Week 0 to Week 8 in the GB group was significantly higher than the control group (3.92 ± 0.56 vs. 1.80 ± 0.19) (Figure 1c). At Week 8, GSH-Px activity in the GB group was significantly higher than baseline (Figure 1d). At baseline, the levels of MDA in the GB group were significantly higher than in the control group (9.32 ± 0.62 vs. 5.88 ± 0.65). After the intervention, the MDA levels of the GB group were significantly decreased when comparing Week 8 to Week 0, and there were no significant differences between Week 0 and Week 8 of the control group (Figure 1e). Moreover, the differences of MDA levels between Week 8 and Week 0 were significantly higher in the GB group when compared to the control group (−5.23 ± 0.66 vs. −0.81 ± 0.43). There were no differences in IL-6 between groups or within groups (Figure 1f).
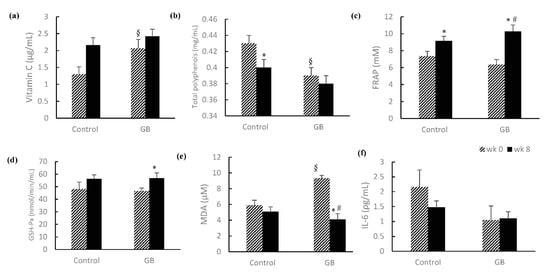
Figure 1.
Effects of Gynura bicolor on antioxidants, antioxidant capacity and inflammation marker. (a) Vitamin C (μg/mL), (b) total polyphenols (mg/mL), (c) FRAP (mM), (d) GSH-Px (nmol/min/mL), (e) MDA (μM), and (f) IL-6 (ρg/mL). Values are mean ± SEM (n = 9). § p < 0.05 between groups by Mann–Whitney U test; * p < 0.05 compared with Week 0 by Mann–Whitney U test; # the difference value of Week 0 and Week 8 with a significant difference between groups by Mann–Whitney U test (p < 0.05) FRAP, ferric reducing ability of plasma; GSH-Px, glutathione peroxidase; MDA, malondialdehyde; IL-6, interlukin-6.
4. Discussion
In 1988, Reaven described a cluster of risk factors for DM and CVD as “syndrome X”, the former name of “metabolic syndrome (Mets)” []. Mets have several definitions. In Taiwan, Mets is defined as any three of the following five features: waist circumference >90 cm in men or >80 cm in women, HDL-C < 40 mg/dL in men or <50 mg/dL in women, FPG ≥ 100 mg/dL, TG ≥ 150 mg/dL and BP ≥ 130/85 mmHg. Insulin resistance (IR) is considered one of the main pathophysiology that caused Mets. IR causes abnormal nutrient metabolism such as hepatic gluconeogenesis, lipid peroxidation and TG synthesis. Moreover, vasoconstriction, oxidative stress and inflammation happened. Under this condition, it increases the risk of developing CVD []. In previous studies, it showed that IR and β-cell dysfunction were already happening before developing to diabetes []. Ford et al. performed a meta-analysis; it concluded that IFG and IGT are associated with modest increases in the risk of cardiovascular disease. Therefore, preDM is related to Mets []. In our study, all subjects’ FPG levels were over 100 mg/dL and have a large waist circumference. We considered the subjects in this study to be at a higher risk of developing Mets and CVD than others.
HOMA-IR was proposed as a simple and inexpensive alternative to more sophisticated techniques by Matthew et al., and had been evaluated to be reliably used in large-scale or epidemiological studies [,]. QUICKI was first performed by Katz et al. QUICKI is a novel, simple, accurate and reproductive method for determining insulin sensitivity in humans []. HOMA-IR and QUICKI can only use FPG and fasting insulin to assess the levels of insulin resistance (IR) and insulin sensitivity. The higher the HOMA-IR, the higher the levels of IR. QUICKI is the reverse to HOMA-IR. Several studies showed the different cutoff point of HOMA-IR and QUICKI. Ascaso et al. observed 65 subjects aged 30–60 years in Spain, showing that subjects had IR when HOMA-IR > 2.6 and QUICKI < 0.33 []. Keskin et al. described that the cutoff point for diagnosis of IR is >2.5 for adults and >3.15 for adolescents []. In China, a total of 2217 subjects were observed. It increases the risks of developing Mets and diabetes when the quartile1 (Q1) of HOMA-IR > 2.8. No matter which cutoff point they are based on, HOMA-IR and QUICKI in both groups were abnormal before the intervention period. After an 8-week intervention of GB and a 4-week washout period, HOMA-IR in the GB group were significantly decreased when compared with baseline. The difference of QUICKI between baseline and the 8-week intervention was significantly decreased when compared to the control group. Therefore, we speculated that an intake of GB may improve the insulin resistance and elevate the insulin sensitivity. Furthermore, the efforts of improving insulin resistance can be maintained.
Increased consumption of vegetables, whole grains, and soluble and insoluble fiber is recommended to treat preDM and diabetes individuals. Wolfram and Ismail-Beigi collected 14 randomized clinical trials on diabetes from the past decade. They concluded that improving insulin sensitivity and glucose homeostasis on a plant-based diet is more effective than other commonly used diets, because plant-based diets contain fiber, micronutrients (potassium, folate and magnesium) and phytochemicals such as anthocyanins, flavonoids and chlorophyll [,,]. The PREDIMED study (PREvencio’n con DIetaMEDiterra’nea) conducted a 3-month clinical trial. It showed increasing dietary fiber intake with natural food (22 g per day) on risk factors for CVD in subjects at high risk decreased FPG, TC and increased HDL-C, which is associated with CVD risk factors []. Another randomized clinical trial suggested that a moderate amount of dietary fiber intake (7 g per day) may be beneficial for managing the FPG but no effects on weight and BMI in Japanese men with hyperglycemia and visceral fat obesity []. According to “2005–2008 Nutrition and Health Survey in Taiwan (NAHSIT)”, the dietary fiber intake in men was 13.7 g and 14 g in women, both of which were less than 25–35 g, the recommended intake from the Ministry of Health and Welfare (MHW). In our study, the dietary intake (13–14 g) in the control and GB groups was no different at baseline. After an 8-week intervention of GB, the dietary intake in the GB group was increased 6 g/day and FPG was decreased when compared with baseline. One exchange of GB contained dietary fiber (3.1 g). Although not reaching the recommended intake from the MHW, it did indeed raise the dietary intake. We speculated that decreased FPG was associated with an increasing intake of dietary fiber, which is from GB. In addition, total polyphenols and total anthocyanins of GB extract were 25.54 ± 1.77 mg GAE/g DW and 1.53 ± 0.15 mg CGE/g DW, respectively. A previous study showed that the main chemical components of GB are phenolic acids, flavonoids, carotenoids and anthocyanins []. Using UPLC-MS/MS analysis, 53 phenolics were identified []. Most polyphenols exist in the form of glycosylated derivatives in GB. These polyphenols must undergo digestive enzymes and intestinal microbiota metabolism to become bioactive in the human body []. Clinical study in obese healthy subjects did not support the use of dietary supplementation with dried purple carrot (259.2 mg/day of phenolic acids) to achieve weight loss, improvements in body composition, LDL-C and blood pressure []. The same results were also observed in our study, because the total polyphenol was much lower.
Several antioxidants exist in plasma, such as ascorbic acid, vitamin E, carotenoid and polyphenols. The ability of dietary polyphenols to reduce inflammation is related to acting as antioxidants, interfering with oxidative stress signaling, suppressing the pro-inflammatory signaling transductions. The biological significance of phenolic compounds is not only in direct reaction with ROS, but also in activation of cell signaling pathways []. FRAP is presented as a method for assessing total antioxidant power. Ferric ferrous ion (Fe3+) reduction at low pH causes a navy blue ferrous-tripyridyltriazine (Fe2+-TPTZ) complex form. The deeper the color, the better the antioxidant power []. We observed that FRAP both in the GB group and control group were increased after an 8-week experimental period. It meant that total antioxidant power was both enhanced. Moreover, the change between baseline and Week 8 in the GB group was more significant than in the control group. MDA is an intermediate product of lipid peroxidation, which usually uses thiobarbituric acid-reactive substances (TBARS) to quantify. One study showed that smoking and alcohol consumption were confounding factors of MDA []. GSH-Px is the important enzyme of the cell defense system. GSH-Px could breakdown peroxide to oxygen and water. The activity of GSH-Px would decrease when peroxidant increases []. A previous study observed that Aronia extract results from the influence of anthocyanins and possibly other flavonoids on decreasing MDA and catalase and increasing GSH-Px and superoxide dismutase activities []. In our study, we excluded smoker and alcohol consumption subjects. MDA and GSH-Px in the GB group were decreased/increased in Week 8 when compared with baseline, respectively. It showed that, after an 8-week intervention, the oxidative stress in subjects was decreased.
Because of increasing oxidative stress, the pathophysiology of preDM and T2D were considered as a chronic inflammation. IL-6 is an important mediator of inflammatory response []. Lucas et al. observed that TNF-α and IL-6 were significantly higher in overweight/obese young subjects with preDM (BMI > 33 kg/m2) than healthy overweight/obese ones []. It is not consistent with our study. We speculated that this is because the study population consisted of all overweight individuals (BMI > 25 kg/m2). The inflammation generated from adipocytes was fewer than obesity.
The bioavailability of polyphenols was influenced by the molecular weight, conjugated form (methyl, glucuronide or sulphate) and cooking method. For most flavonoids absorbed in the small intestine, the plasma concentration then rapidly decreases (elimination half-life period of 1–2 h). The maintenance of a high concentration in plasma thus requires a repeated ingestion of the polyphenols over time. Anthocyanins are quite rapidly absorbed, but their bioavailability seems to be the lowest of all flavonoids []. Nielsen et al. concluded that urinary flavonoids may be useful as a new biomarker for vegetables and fruits []. In the GB group, there were no differences in total polyphenols of plasma. It could be associated with the fact that the blood sample collection of subjects was not conducted all at the same time. When all were finished to collect, it already passed the half-life time of polyphenols. In the control group, total polyphenols of plasma were significantly decreased. It might be associated with prohibiting eating red-purple food for 8 weeks. We suggested that future studies must use urine tests to assess total polyphenol intake.
Our study was the first interventional trial using GB for preDM, by using natural ingredients and at least eating two exchanges of vegetables every day. GB is not only rich in fiber; it also contains higher polyphenols than other green-leafy vegetables. This might have resulted in improvement of glycemic control and reducing oxidative stress in preDM subjects. Although the beneficial effects of GB could be observed, some limitations needed be addressed. (1) PreDM without medication subjects are difficult to find, because people pay less attention to their own blood report. (2) The intervention period was 8 weeks. We did not consider that the half-life of HbA1c is about 3 months. (3) The baseline characteristics had biases between the control group and GB group. This is because we did not assign randomly, but based on subjects’ dietary habit. Further studies, we suggest, should consider expanding the intervention time and the allocations of groups.
In conclusion, the subjects in our study were overweight and preDM subjects. After intervention of two serving sizes of GB for 8 weeks, FPG and MDA were decreased, FRAP and GSH-Px were increased in the intervention group and HOMA-IR and QUICKI were improved. We concluded that GB could improve glycemic control and decrease oxidative stress because of its large amounts of polyphenols. In addition, GB not only has health-care functions, but its pigments also show potential uses as natural food colorings. Therefore, GB extract can be used to make functional foods, such as adding to fruit mousse or yogurt.
Author Contributions
C.-H.H. and Y.-W.C. were involved in the conceptualization and the design of this study. C.-H.H. conducted this study and biochemical analyses. C.-H.H. wrote the original draft preparation. C.-H.H. and Y.-T.T. reviewed and edited this study. Y.-S.Y. supervised this study. Y.-W.C. visualized and supervised this study. All authors provided critical inputs to data analyses and the interpretation of the data. All authors have read and agreed to the published version of the manuscript.
Funding
This research received no external funding.
Institutional Review Board Statement
The study was conducted according to the guidelines of the Declaration of Helsinki, and approved by the Institutional Review Board of Taipei Medical University in Taiwan.
Informed Consent Statement
Informed consent was obtained from all subjects involved in the study.
Data Availability Statement
No new data were created or analyzed in this study. Data sharing is not applicable to this article.
Acknowledgments
We thank all subjects for participating in this study.
Conflicts of Interest
The authors declare no conflict of interest.
References
- American Diabetes Association. Diagnosis and classification of diabetes mellitus. Diabetes Care 2021, 44, S15–S33. [Google Scholar]
- DeFronzo, R.A.; Abdul-Ghani, M.A. Preservation of beta-cell function: The key to diabetes prevention. J. Clin. Endocrinol. Metab. 2011, 96, 2354–2366. [Google Scholar] [CrossRef]
- International Diabetes Federation. IDF Diabetes Atlas, 9th ed.; International Diabetes Federation: Brussels, Belgium, 2019. [Google Scholar]
- Tabák, A.G.; Herder, C.; Rathmann, W.; Brunner, E.J.; Kivimäki, M. Prediabetes: A high-risk state for diabetes development. Lancet 2012, 379, 2279–2290. [Google Scholar] [CrossRef]
- Shaw, J.; Sicree, R.; Zimmet, P. Global estimates of the prevalence of diabetes for 2010 and 2030. Diabetes Res. Clin. Pract. 2010, 87, 4–14. [Google Scholar] [CrossRef]
- Su, Y.; Liu, X.-M.; Sun, Y.-M.; Jin, H.-B.; Fu, R.; Wang, Y.-Y.; Wu, Y.; Luan, Y. The relationship between endothelial dysfunction and oxidative stress in diabetes and prediabetes. Int. J. Clin. Pract. 2008, 62, 877–882. [Google Scholar] [CrossRef]
- Antoniades, C.; Shirodaria, C.; Crabtree, M.; Rinze, R.; Alp, N.; Cunnington, C.; Diesch, J.; Tousoulis, D.; Stefanadis, C.; Leeson, P.; et al. Altered plasma versus vascular biopterins in human atherosclerosis reveal relationships between endothelial nitric oxide synthase coupling, endothelial function, and inflammation. Circulation 2007, 116, 2851–2859. [Google Scholar] [CrossRef] [PubMed]
- Schafer, A.; Bauersachs, J. Endothelial dysfunction, impaired endogenous platelet inhibition and platelet activation in diabetes and atherosclerosis. Curr. Vasc. Pharmacol. 2008, 6, 52–60. [Google Scholar] [CrossRef] [PubMed]
- Milman, S.; Crandall, J.P. Mechanisms of Vascular Complications in Prediabetes. Med. Clin. N. Am. 2011, 95, 309–325. [Google Scholar] [CrossRef]
- Glechner, A.; Keuchel, L.; Affengruber, L.; Titscher, V.; Sommer, I.; Matyas, N.; Wagner, G.; Kien, C.; Klerings, I.; Gartlehner, G. Effects of lifestyle changes on adults with prediabetes: A systematic review and meta-analysis. Prim. Care Diabetes 2018, 12, 393–408. [Google Scholar] [CrossRef] [PubMed]
- Pan, X.-R.; Li, G.-W.; Hu, Y.-H.; Wang, J.-X.; Yang, W.-Y.; An, Z.-X.; Hu, Z.-X.; Lin, J.-; Xiao, J.-Z.; Cao, H.-B.; et al. Effects of Diet and Exercise in Preventing NIDDM in People with Impaired Glucose Tolerance: The Da Qing IGT and Diabetes Study. Diabetes Care 1997, 20, 537–544. [Google Scholar] [CrossRef] [PubMed]
- Salas-Salvadó, J.; Martinez-González, M.; Bulló, M.; Ros, E. The role of diet in the prevention of type 2 diabetes. Nutr. Metab. Cardiovasc. Dis. 2011, 21, B32–B48. [Google Scholar] [CrossRef] [PubMed]
- Giugliano, D.; Ceriello, A.; Esposito, K. The effects of diet on inflammation: Emphasis on the metabolic syndrome. J. Am. Coll. Cardiol. 2006, 48, 677–685. [Google Scholar] [CrossRef]
- Zhao, C.; Yang, C.; Wai, S.T.C.; Zhang, Y.; Portillo, M.P.; Paoli, P.; Wu, Y.; Cheang, W.S.; Liu, B.; Carpéné, C.; et al. Regulation of glucose metabolism by bioactive phytochemicals for the management of type 2 diabetes mellitus. Crit. Rev. Food Sci. Nutr. 2018, 59, 830–847. [Google Scholar] [CrossRef]
- Kimble, R.; Keane, K.M.; Lodge, J.K.; Howatson, G. Dietary intake of anthocyanins and risk of cardiovascular disease: A systematic review and meta-analysis of prospective cohort studies. Crit. Rev. Food Sci. Nutr. 2018, 59, 3032–3043. [Google Scholar] [CrossRef] [PubMed]
- Shimizu, Y.; Maeda, K.; Kato, M.; Shimomura, K. Isolation of anthocyanin-related MYB gene, GbMYB2, from Gynura bicolor leaves. Plant Biotechnol. 2010, 27, 481–487. [Google Scholar] [CrossRef][Green Version]
- Lu, C.-H.; Yang, H.-C.; Chang, W.-L.; Chang, Y.-P.; Wu, C.-C.; Hsieh, S.-L. Development of beverage product from Gynura bicolor and evaluation of its antioxidant activity. Genom. Med. Biomark. Health Sci. 2012, 4, 131–135. [Google Scholar] [CrossRef][Green Version]
- Lin, J.-Y.; Liu, Y.-L.; Lin, B.-F.; Hsiao, C.-C.; Tsai, S.-J. Antioxidant, Antimutagenic and Immunomodulatory Potentials of Gynura Bicolar and Amaranthus Gangetcaue. Taiwan J. Agric. Chem. Food Sci. 2004, 42, 231–241. [Google Scholar]
- Wu, C.-C.; Lii, C.-K.; Liu, K.-L.; Chen, P.-Y.; Hsieh, S.-L. Antiinflammatory Activity of Gynura bicolor (紅鳳菜 Hóng Fèng Cài) Ether Extract Through Inhibits Nuclear Factor Kappa B Activation. J. Tradit. Complement. Med. 2013, 3, 48–52. [Google Scholar] [CrossRef]
- Li, W.-L.; Ren, B.-R.; Zhuo, M.-; Hu, Y.; Lu, C.-G.; Wu, J.-L.; Chen, J.; Sun, S. The Anti-Hyperglycemic Effect of Plants in Genus Gynura Cass. Am. J. Chin. Med. 2009, 37, 961–966. [Google Scholar] [CrossRef]
- Singleton, V.L.; Rossi, J.A. Colorimetry of Total Phenolics with Phosphomolybdic-Phosphotungstic Acid Reagents. Am. J. Enol. Vitic. 1965, 16, 144–158. [Google Scholar]
- Hosseinian, F.; Li, W.; Beta, T. Measurement of anthocyanins and other phytochemicals in purple wheat. Food Chem. 2008, 109, 916–924. [Google Scholar] [CrossRef]
- Serafini, M.; Maiani, G.; Ferro-Luzzi, A. Alcohol-free red wine enhances plasma antioxidant capacity in humans. J. Nutr. 1998, 128, 1003–1007. [Google Scholar] [CrossRef]
- Reaven, G.M. Banting lecture 1988. Role of insulin resistance in human disease. Diabetes 1988, 37, 1595–1607. [Google Scholar] [CrossRef]
- Mendrick, D.L.; Diehl, A.M.; Topor, L.S.; Dietert, R.R.; Will, Y.; A La Merrill, M.; Bouret, S.; Varma, V.; Hastings, K.L.; Schug, T.T.; et al. Metabolic Syndrome and Associated Diseases: From the Bench to the Clinic. Toxicol. Sci. 2018, 162, 36–42. [Google Scholar] [CrossRef] [PubMed]
- Tabák, A.G.; Jokela, M.; Akbaraly, T.N.; Brunner, E.J.; Kivimäki, M.; Witte, D.R. Trajectories of glycaemia, insulin sensitivity, and insulin secretion before diagnosis of type 2 diabetes: An analysis from the Whitehall II study. Lancet 2009, 373, 2215–2221. [Google Scholar] [CrossRef]
- Ford, E.S.; Li, C.; Sniderman, A. Temporal changes in concentrations of lipids and apolipoprotein B among adults with diagnosed and undiagnosed diabetes, prediabetes, and normoglycemia: Findings from the National Health and Nutrition Examination Survey 1988–1991 to 2005–2008. Cardiovasc. Diabetol. 2013, 12, 26. [Google Scholar] [CrossRef]
- Bonora, E.; Targher, G.; Alberiche, M.; Bonadonna, R.C.; Saggiani, F.; Zenere, M.B.; Monauni, T.; Muggeo, M. Homeostasis model assessment closely mirrors the glucose clamp technique in the assessment of insulin sensitivity: Studies in subjects with various degrees of glucose tolerance and insulin sensitivity. Diabetes Care 2000, 23, 57–63. [Google Scholar] [CrossRef] [PubMed]
- Matthews, D.R.; Hosker, J.P.; Rudenski, A.S.; Naylor, B.A.; Treacher, D.F.; Turner, R.C. Homeostasis model assessment: Insulin resistance and beta-cell function from fasting plasma glucose and insulin concentrations in man. Diabetologia 1985, 28, 412–419. [Google Scholar] [CrossRef]
- Katz, A.; Nambi, S.S.; Mather, K.; Baron, A.D.; Follmann, D.A.; Sullivan, G.; Quon, M.J. Quantitative insulin sensitivity check index: A simple, accurate method for assessing insulin sensitivity in humans. J. Clin. Endocrinol. Metab. 2000, 85, 2402–2410. [Google Scholar] [CrossRef]
- Ascaso, J.F.; Pardo, S.; Real, J.T.; Lorente, R.I.; Priego, A.; Carmena, R. Diagnosing insulin resistance by simple quantitative methods in subjects with normal glucose metabolism. Diabetes Care 2003, 26, 3320–3325. [Google Scholar] [CrossRef]
- Keskin, M.; Kurtoglu, S.; Kendirci, M.; Atabek, M.E.; Yazici, C. Homeostasis Model Assessment Is More Reliable Than the Fasting Glucose/Insulin Ratio and Quantitative Insulin Sensitivity Check Index for Assessing Insulin Resistance Among Obese Children and Adolescents. Pediatrics 2005, 115, e500–e503. [Google Scholar] [CrossRef] [PubMed]
- Wolfram, T.; Ismail-Beigi, F. Efficacy of High-Fiber Diets in the Management of Type 2 Diabetes Mellitus. Endocr. Pract. 2011, 17, 132–142. [Google Scholar] [CrossRef] [PubMed]
- Kaur, J. A Comprehensive Review on Metabolic Syndrome. Cardiol. Res. Pract. 2014, 2014, 943162. [Google Scholar] [CrossRef]
- Castro-Barquero, S.; Ruiz-León, A.M.; Sierra-Pérez, M.; Estruch, R.; Casas, R. Dietary Strategies for Metabolic Syndrome: A Comprehensive Review. Nutrients 2020, 12, 2983. [Google Scholar] [CrossRef] [PubMed]
- Estruch, R.; A Martinez-Gonzalez, M.; Corella, D.; Basora, J.; Ruiz-Gutierrez, V.; I Covas, M.; Fiol, M.; Gomez-Gracia, E.; López-Sabater, M.C.; Escoda, R.; et al. Effects of dietary fibre intake on risk factors for cardiovascular disease in subjects at high risk. J. Epidemiol. Community Health 2009, 63, 582–588. [Google Scholar] [CrossRef]
- Kobayakawa, A.; Suzuki, T.; Ikami, T.; Saito, M.; Yabe, D.; Seino, Y. Improvement of Fasting Plasma Glucose Level After Ingesting Moderate Amount of Dietary Fiber in Japanese Men With Mild Hyperglycemia and Visceral Fat Obesity. J. Diet. Suppl. 2013, 10, 129–141. [Google Scholar] [CrossRef] [PubMed]
- Do, T.V.T.; Suhartini, W.; Mutabazi, F.; Mutukumira, T.N. Gynura bicolor DC. (Okinawa spinach): A comprehensive review on nutritional constituents, phytochemical compounds, utilization, health benefits, and toxicological evaluation. Food Res. Int. 2020, 134, 109222. [Google Scholar] [CrossRef]
- Chen, J.; Mangelinckx, S.; Lü, H.; Wang, Z.T.; Li, W.L.; De Kimpe, N. Profiling and elucidation of the phenolic compounds in the aerial parts of Gynura bicolor and G. divaricata collected from different Chinese origins. Chem. Biodivers. 2015, 12, 96–115. [Google Scholar] [CrossRef] [PubMed]
- Marín, L.; Miguélez, E.M.; Villar, C.J.; Lombó, F. Bioavailability of Dietary Polyphenols and Gut Microbiota Metabolism: Antimicrobial Properties. BioMed Res. Int. 2015, 2015, 905215. [Google Scholar] [CrossRef]
- Wright, O.R.; Netzel, G.A.; Sakzewski, A.R. A randomized, double-blind, placebo-controlled trial of the effect of dried purple carrot on body mass, lipids, blood pressure, body composition, and inflammatory markers in overweight and obese adults: The QUENCH Trial. Can. J. Physiol. Pharmacol. 2013, 91, 480–488. [Google Scholar] [CrossRef]
- Zhang, H.; Tsao, R. Dietary polyphenols, oxidative stress and antioxidant and anti-inflammatory effects. Curr. Opin. Food Sci. 2016, 8, 33–42. [Google Scholar] [CrossRef]
- Benzie, I.F.; Strain, J.J. The ferric reducing ability of plasma (FRAP) as a measure of “antioxidant power”: The FRAP assay. Anal. Biochem. 1996, 239, 70–76. [Google Scholar] [CrossRef] [PubMed]
- Nielsen, F.; Mikkelsen, B.B.; Nielsen, J.B.; Andersen, H.R.; Grandjean, P. Plasma malondialdehyde as biomarker for oxidative stress: Reference interval and effects of life-style factors. Clin. Chem. 1997, 43, 1209–1214. [Google Scholar] [CrossRef] [PubMed]
- Ursini, F.; Maiorino, M.; Gregolin, C. The selenoenzyme phospholipid hydroperoxide glutathione peroxidase. Biochim. Biophys. Acta 1985, 839, 62–70. [Google Scholar] [CrossRef]
- Broncel, M.; Kozirog, M.; Duchnowicz, P.; Koter-Michalak, M.; Sikora, J.; Chojnowska-Jezierska, J. Aronia melanocarpa extract reduces blood pressure, serum endothelin, lipid, and oxidative stress marker levels in patients with metabolic syndrome. Med. Sci. Monit. 2010, 16, CR28–CR34. [Google Scholar]
- McCracken, E.; Monaghan, M.; Sreenivasan, S. Pathophysiology of the metabolic syndrome. Clin. Dermatol. 2018, 36, 14–20. [Google Scholar] [CrossRef] [PubMed]
- Lucas, R.; Parikh, S.J.; Sridhar, S.; Guo, D.-H.; Bhagatwala, J.; Dong, Y.; Caldwell, R.; Mellor, A.; Caldwell, W.; Zhu, H.; et al. Cytokine profiling of young overweight and obese female African American adults with prediabetes. Cytokine 2013, 64, 310–315. [Google Scholar] [CrossRef] [PubMed]
- Nielsen, S.E.; Freese, R.; Kleemola, P.; Mutanen, M. Flavonoids in human urine as biomarkers for intake of fruits and vegetables. Cancer Epidemiol. Biomark. Prev. 2002, 11, 459–466. [Google Scholar]
Publisher’s Note: MDPI stays neutral with regard to jurisdictional claims in published maps and institutional affiliations. |
© 2021 by the authors. Licensee MDPI, Basel, Switzerland. This article is an open access article distributed under the terms and conditions of the Creative Commons Attribution (CC BY) license (https://creativecommons.org/licenses/by/4.0/).