1. Introduction
Phonation is the result of complex nonlinear coupling between aerodynamic and physiological parameters. Glottal geometry parameters play an important role during this process [
1]. The glottal geometry parameters include glottal angle [
2], glottal inferior and superior vocal fold surfaces [
3], glottal entrance and exit radii [
4,
5], and the symmetry and obliquity of the glottis [
1]. These time-variant glottal geometry parameters not only significantly affect the glottal volume velocity but also affect the spectral shape of the output acoustics [
6].
Another important vocal fold geometry parameter is the vertical glottal duct length, which may have important influence on the driving pressures on the vocal folds during the phonatory cycle. Here it is described as “the axial length of the glottis or the upstream-to-downstream length of the glottis” [
7]. The word “vertical” is used due to the fact that, for a standing or sitting individual, the inferior-to-superior duct of the glottis is in a vertical orientation. This term is similar to another vocal fold geometry parameter called the “vocal fold thickness” reported by Hollien and Colton in 1969 [
8] and defined as the cross-sectional area of the vocal fold (seen in the frontal view) divided by the vocal fold width. These two parameters are both “vertical” in their definition. The vocal fold thickness typically would be slightly longer than the vertical glottal duct length [
7].
Two laryngeal muscles, the vocalis (VOC) and the cricothyroid (CT) muscles, have a primary influence on the determination of the vertical glottal duct length. Contraction of the VOC muscle tends to increase the vertical glottal duct length, creating a more rectangular glottal shape or medial bulging of the vocal folds [
9,
10,
11,
12,
13,
14,
15,
16,
17,
18] associated with the chest voice (or modal register). Contraction of the CT muscles lengthens the vocal folds and thereby reduces the vertical glottal duct length, creating a more convergent glottal shape and typically a higher fundamental frequency. The vertical glottal duct length is shorter in the adult female compared with the adult male [
8,
19].
Both van den Berg and Tan (1959) [
20] and Z. Zhang (2017) [
21] have suggested that the vertical glottal duct length influences the glottal closure pattern and spectral shape of the output acoustics. In addition, van den Berg (1968) [
22] indicated that an increase of the vertical glottal duct length would lead to a large vertical phase difference and result in the glottis remaining closed longer. Z. Zhang (2009) [
23] indicated that an increased vertical glottal duct length may help to maintain the adductory position against the subglottal pressure leading to longer glottal closure. Y. Zhang (2005) [
24] also indicated that increasing vertical glottal duct length and subglottal pressure might be able to increase the aerodynamic forces acting on the vocal folds, further increasing vocal fold adduction, shortening the distance between the two vocal folds, enhancing vocal fold collision, increasing vibratory amplitude, and reducing voiced breathiness. Z. Zhang (2016) [
25] also suggested that the highest closed quotient (CQ) can be obtained for long vertical glottal duct lengths when the vocal folds are tightly approximated and both the intraglottal and subglottal pressures are relatively low.
In addition to influencing the aerodynamic forces acting upon the vocal folds, the vertical length of the glottis is also a determining factor of phonatory threshold pressure (PTP) [
6,
24,
26,
27,
28]. Z. Zhang (2016) [
25] reported that PTP first decreases as the vertical glottal duct length increases from very thin vocal folds to a thickness of 2 mm, and then increases with increasing medial surface thickness. Fulcher et al. (2014) [
29] suggest that the PTPs for divergent glottal angles should be lower than those measured for convergent glottal angles or for the uniform glottis. Chan et al. (1997) [
26] also suggest that PTP is lowest for the divergent glottis and highest for the convergent one. Their results suggest that highly convergent or divergent prephonatory glottal geometries are associated with higher phonation threshold pressures and should be carefully avoided during phonosurgery. In the clinic, increasing vertical glottal duct length via greater vocal fold thickness might represent an additional physiologic source of improvement for Parkinsonian vocal impairment and thus may increase vibratory amplitude and reduce vocal breathiness in patients as well as potentially lowering an abnormally high PTP [
24]. The vocal fold thickness can be increased by injection of collagen or other substances, a procedure that might increase vibratory amplitude and reduce vocal breathiness, to improve the quality of speech among patients with Parkinson’s disease [
30,
31,
32]. Interestingly, vocal fold thickness may be decreased for chronic hemodialysis patients, who may experience transient post-dialysis hoarseness resulting from dehydration [
33].
The change of the vertical glottal duct length should have significant effects on the intraglottal aerodynamic parameters such as intraglottal air pressure distributions and velocity profiles as well as the bulk glottal flow and glottal airflow resistance. Glottal duct length changes should affect the airflow resistive losses of the duct. Our previous study [
7] suggests that, for the uniform glottal duct (zero degree glottal angle), increasing the vertical glottal duct length increases the intraglottal and transglottal pressures, increases the transglottal pressure coefficient, and increases the value of PTP according to Titze’s equation.
The current report is on research that continues the theme to explore the effects of the vertical glottal duct length on the intraglottal aerodynamic parameters and the entrance and transglottal pressure coefficients for convergent glottal angles. The convergent glottis is the glottal shaping that occurs during glottal opening, when the positive intraglottal pressures literally push the vocal folds to separate, widening the glottis, against the force of vocal fold tissue recoil. If the intraglottal air pressure forces are highly sensitive to different vertical glottal duct lengths, this initial and critical phase of the vocal fold motion may vary significantly with duct length. In addition, since higher pitches are associated with longer vocal folds and thus shorter vertical glottal duct lengths, understanding the aerodynamic effects of the vertical glottal duct length change is a basic aspect to understanding phonation and fundamental frequency.
3. Results
3.1. Intraglottal Pressures
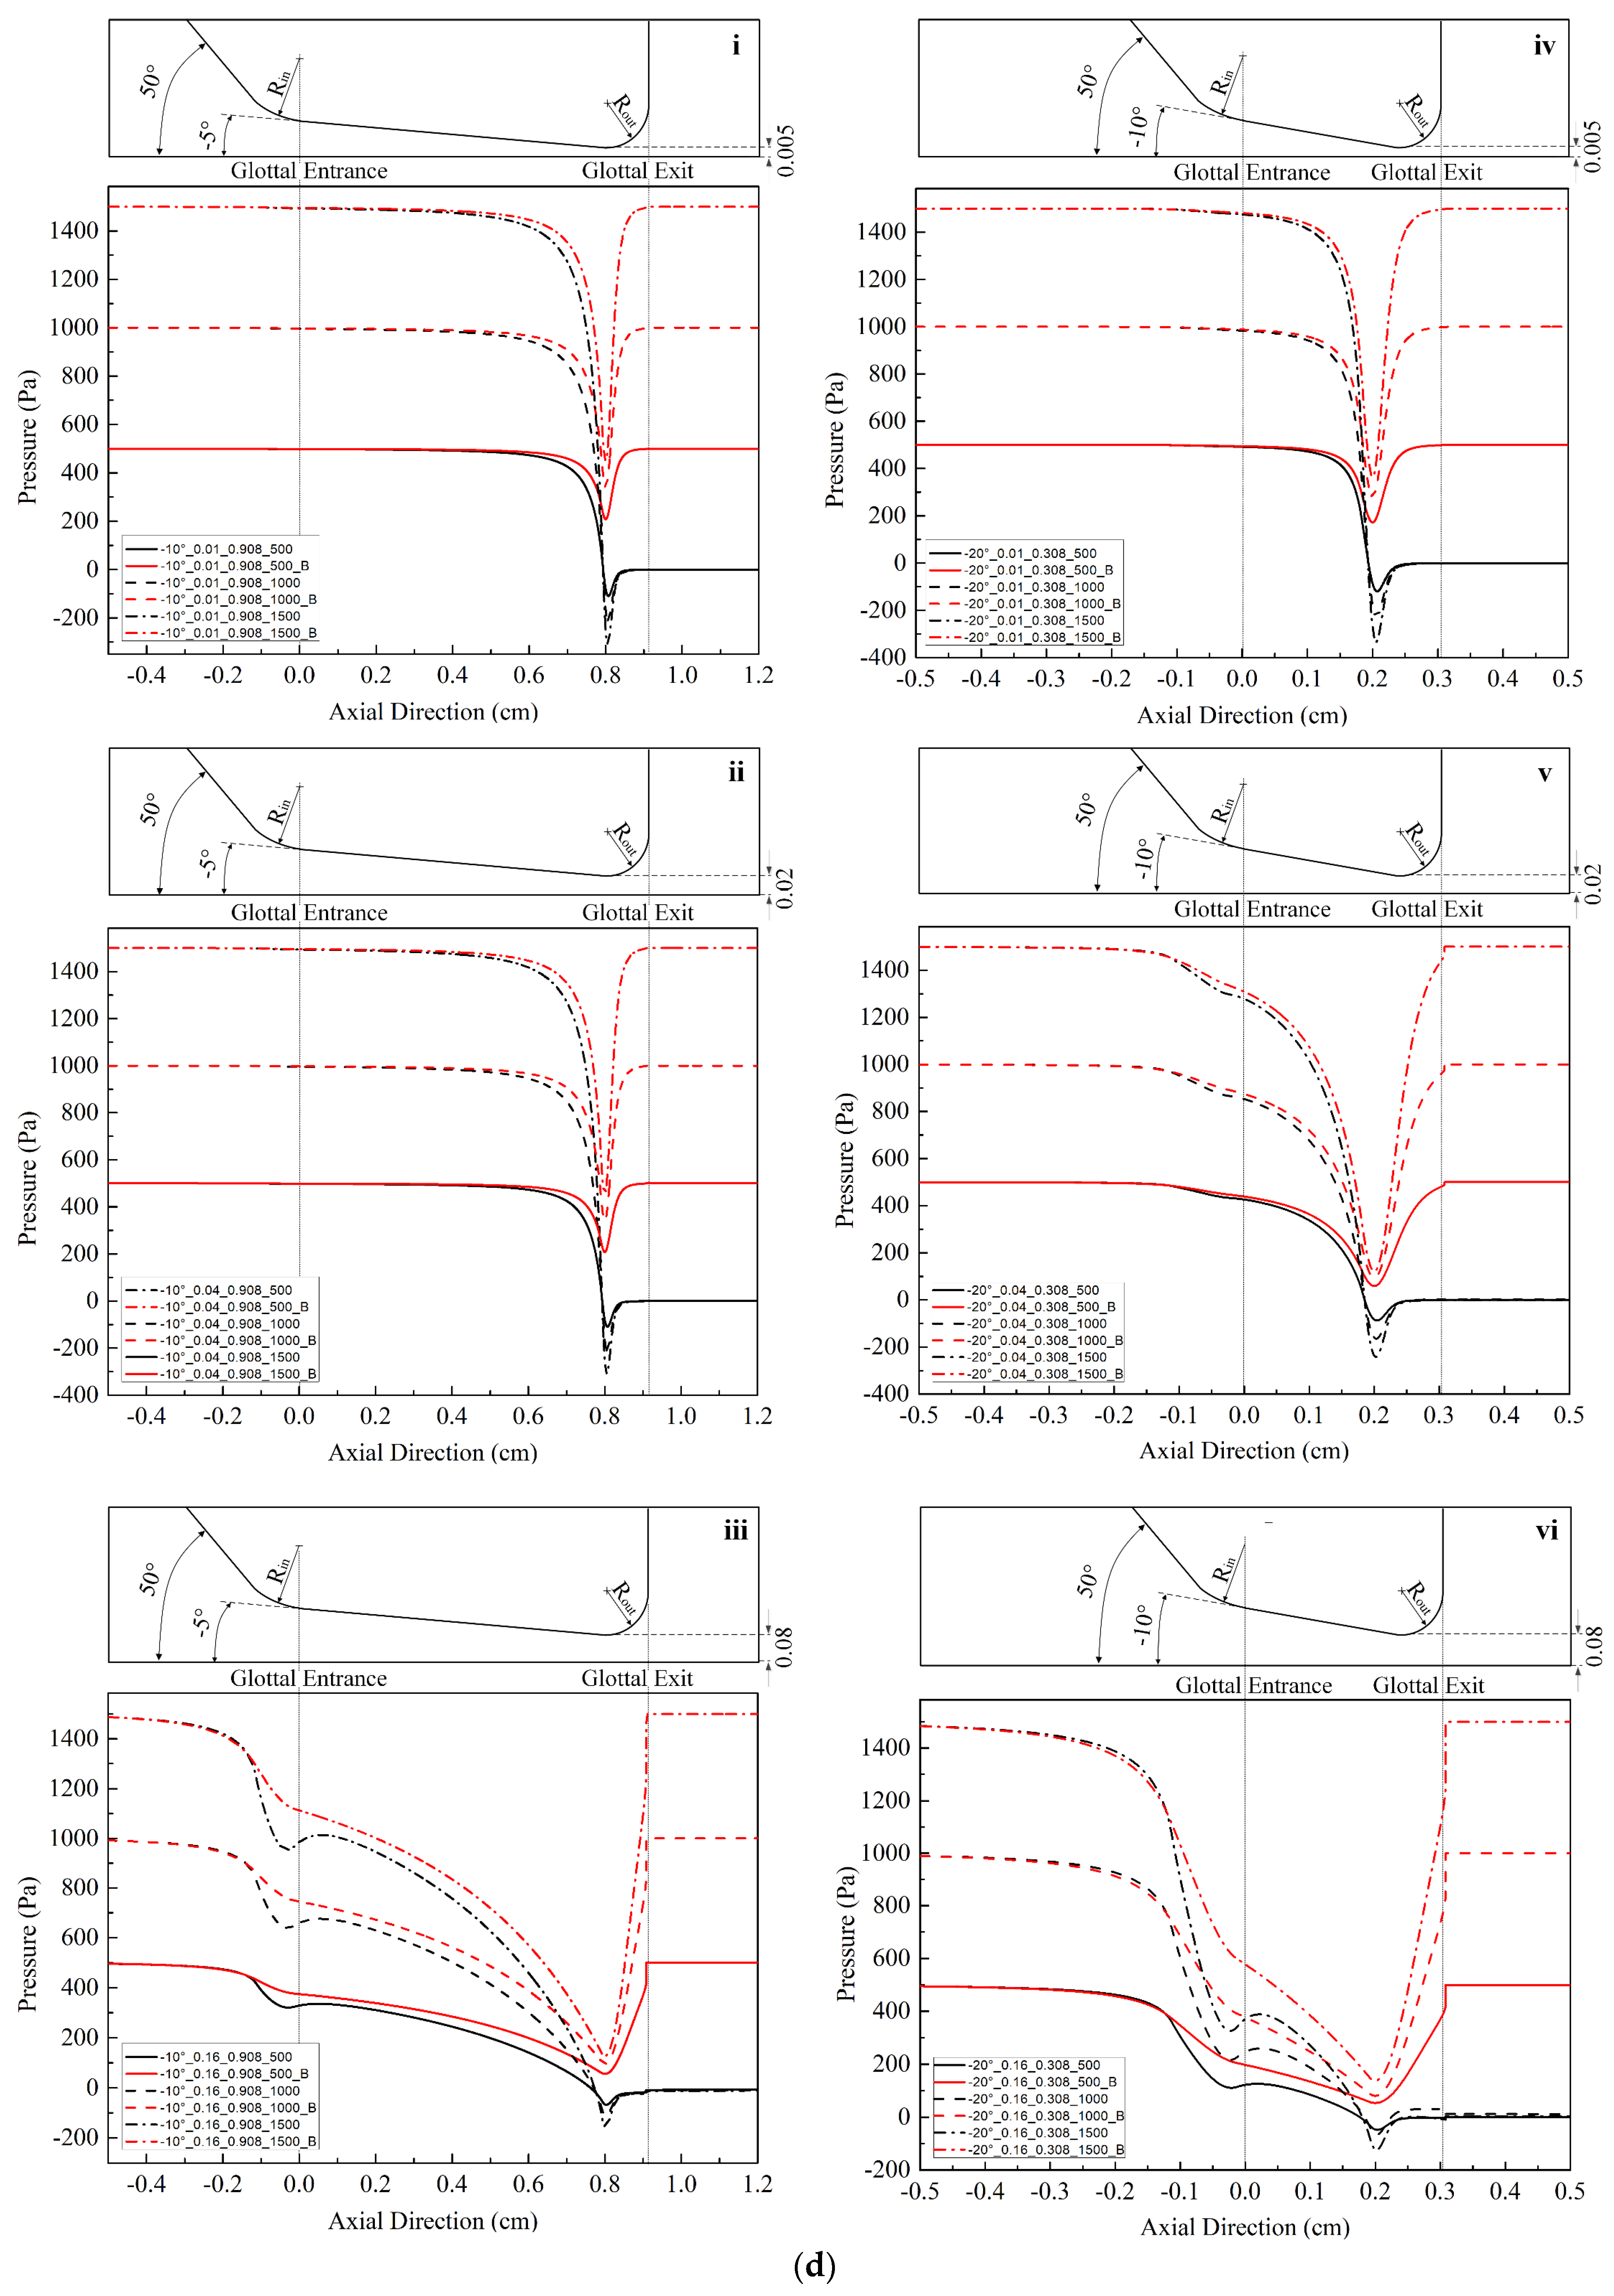
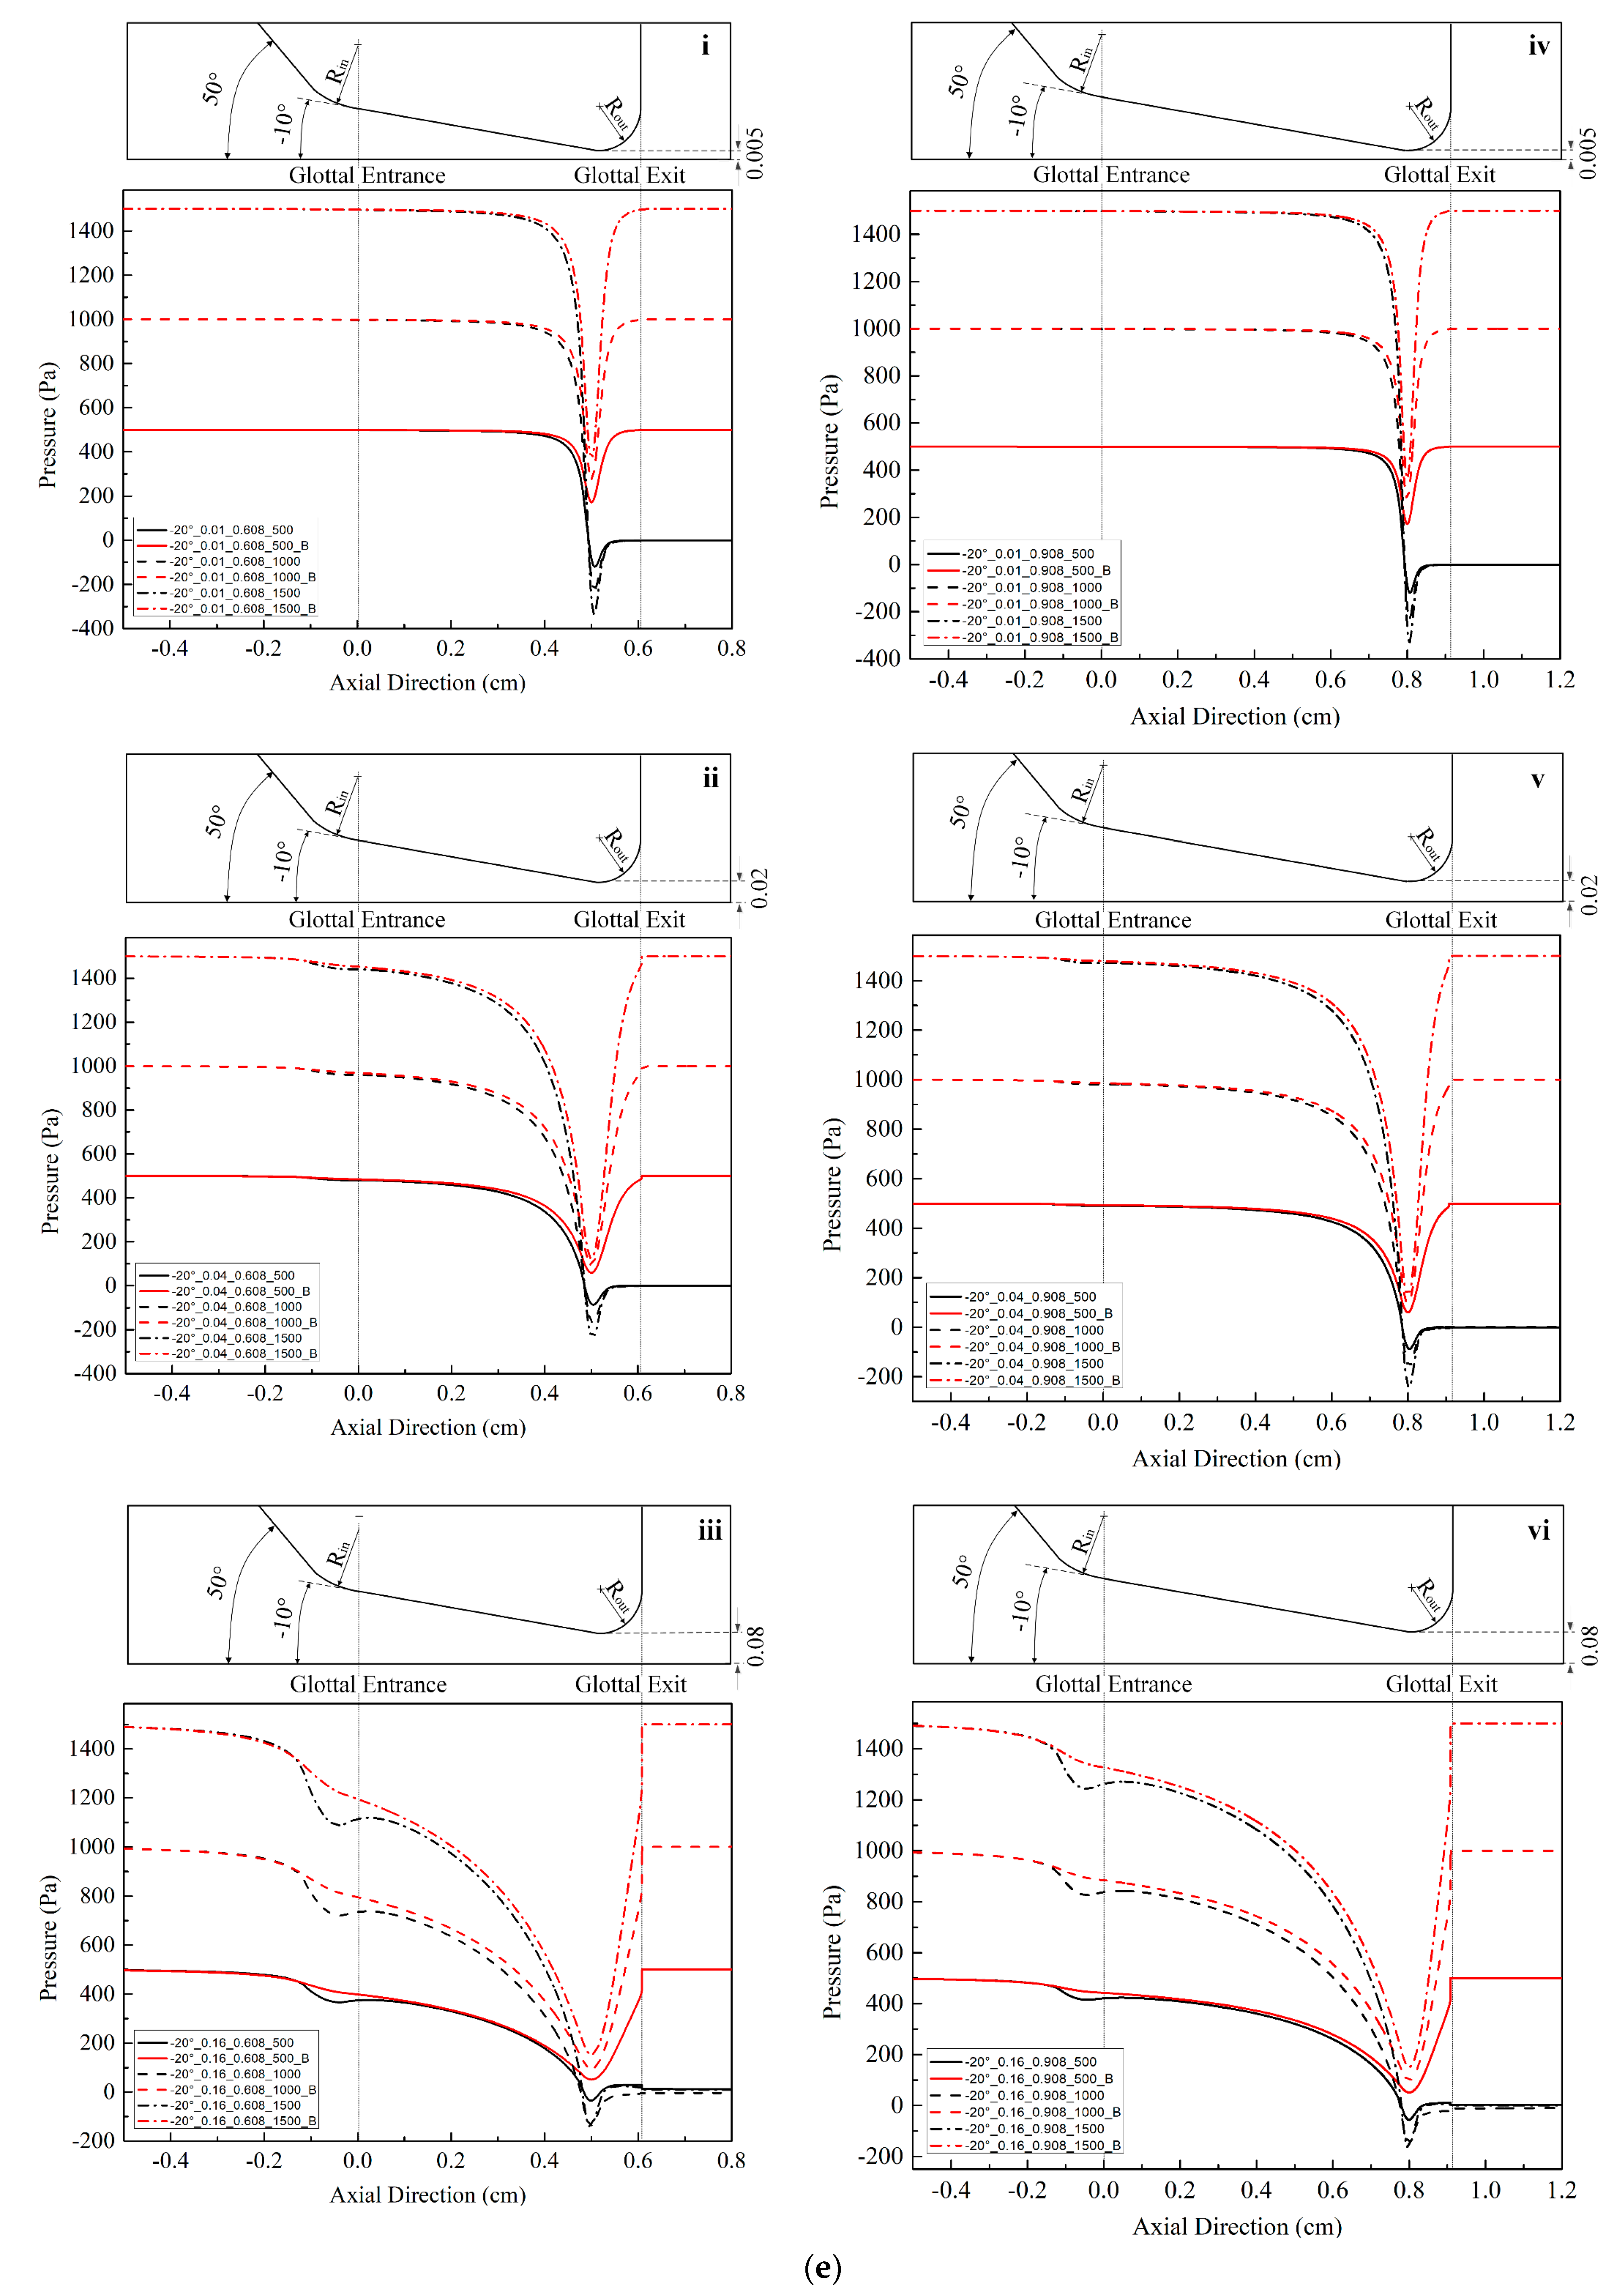
Figure 2 shows the intraglottal pressure distributions for the various conditions, where the variables are glottal angle, minimal glottal diameter, and vertical glottal duct length.
Table 2 indicates where any specific condition is located in
Figure 2. The outlines of the convergent glottal configurations are shown in the upper portion of the figures. The results of the lossless Bernoulli equation for the same cases are also shown for comparison purpose (the lines that return to the original 500, 1000, and 1500 Pa at the glottal exit in each figure).
Figure 2 shows that the intraglottal pressures decrease as the glottal cross-sectional area reduces following the glottal convergence shape. The pressure decrease would be due to flow acceleration within the glottis, with the pressure reduction reaching minimum values (and the largest velocities) essentially at the minimum diameter position near the end of the glottal duct. In addition, the larger the transglottal pressure, the greater the minimal pressure dip. The pressures near the pressure dip positions are negative (less than atmospheric). Past this location, the pressure recovers (increases) as the cross-sectional area expands at the rounded glottal exit position.
Lengthening the vertical glottal duct acts to produce a primary and important change in the driving pressures on the vocal folds. As shown in
Figure 2, as the length of the vertical glottal duct increases, the surface air pressures in the region of the glottal entrance increase, and they increase more so for larger diameters and larger transglottal pressures. The longer the vertical glottal duct length, the closer the glottal entry region pressure comes to the upstream (tracheal) pressure. For example, the pressure at the glottal entrance increases from 125.94 Pa to 663.82 Pa (an increase of 427.09%) between diameters 0.308 cm and 0.908 cm for the following case: 0.16 cm minimal diameter, 1500 Pa, and −10° glottal angle. The effect is less as the minimal diameter is decreased. For example, from
Figure 2, the increase is 1324.14 Pa to 1480.51 Pa (an increase of 11.81%) for the 0.01 cm minimal diameter, 1500 Pa transglottal pressure, and −10° glottal angle case. Similarly, the increase in pressure at the glottal entrance for the −20° glottal angle for an increase of the vertical glottal duct length from 0.308 cm to 0.908 cm is 1.55% and 81.89% for the 0.01 cm and 0.16 cm minimal diameters, respectively, for the 1500 Pa transglottal pressure case.
Because the minimal pressure at the minimal cross-sectional area near the glottal exit did not change appreciably with glottal duct length, the higher pressures at glottal entry for longer vertical glottal duct lengths created higher pressures within the glottal duct over a longer length of the vertical duct. This finding suggests that the outward force acting upon the medial vocal fold surfaces would be greater for longer vertical glottal ducts, especially over the first half of the duct (from the glottal entrance). The larger pressures would drive the lower portion of the glottal surface outward using more force at the beginning (opening phase) of the glottal cycle. This vertical glottal duct lengthening effect may therefore contribute to reducing the threshold pressure for phonation [
6] (see below for a discussion that indicates inconsistencies in this regard). Also, the increased intraglottal outward pressure force may tend to push the vocal folds open wider, thus creating a larger glottal airflow waveform peak, as well as transfer more aerodynamic energy to the vocal folds. Thus, a longer vertical glottal duct length may aid in generating vocal fold oscillation.
In
Figure 2, the smaller the glottal minimal diameter, the more negative the minimum pressure dip. For example, the pressures drop to minimum pressures of −333.61 Pa and −123.93 Pa (an increase of 62.8%) for 0.01 cm and 0.16 cm minimal diameter cases, respectively, for the same 1500 Pa transglottal pressure and −20° convergent glottal angle. With the greater pressure drop, the pressure rise (recovery) is also faster in this example.
The convergent glottal angle also has effects on increasing the intraglottal pressure distributions.
Figure 2 indicates that the intraglottal pressure increases when the convergent glottal angle increases, and the larger the glottal angle, the higher the intraglottal pressure and the lower the pressure dips near the glottal exit. For example, the pressures at the glottal entrance increased from 1324.14 Pa to 1425.43 Pa and then to 1475.18 Pa (an increase of 11.41%) when the convergent angle increased from −5° to −10° and then to −20°, for the case of 0.01 cm minimal diameter, 0.308 cm glottal duct length, and 1500 Pa transglottal pressure. The effect is less as the glottal duct length is increased. For example, the percent change decreases from 11.41% to 1.18% (1480.54 Pa to 1498.09 Pa) when the glottal duct length increases from 0.308 cm to 0.908 cm for the above cases. These results suggest that the glottal angle has important potential effects on the intraglottal pressure distributions, especially for short glottal duct lengths.
The lossless Bernoulli pressures are also shown in
Figure 2. The difference between the lossless Bernoulli pressure distributions and the Fluent pressure distributions increased as the glottal diameter increased, transglottal pressure increased, or the glottal angle decreased. The pressure distributions for the lossless Bernoulli condition are always higher than for the Fluent distributions, indicating that the pressures are too high if one were to follow the Bernoulli approach to the end of the glottal duct, especially for smaller convergent angles. That is, following a lossless Bernoulli pressure distribution creates driving air pressure forces that are too high for the convergent glottis, and these most likely would make the vocal folds vibrate more easily than they might otherwise.
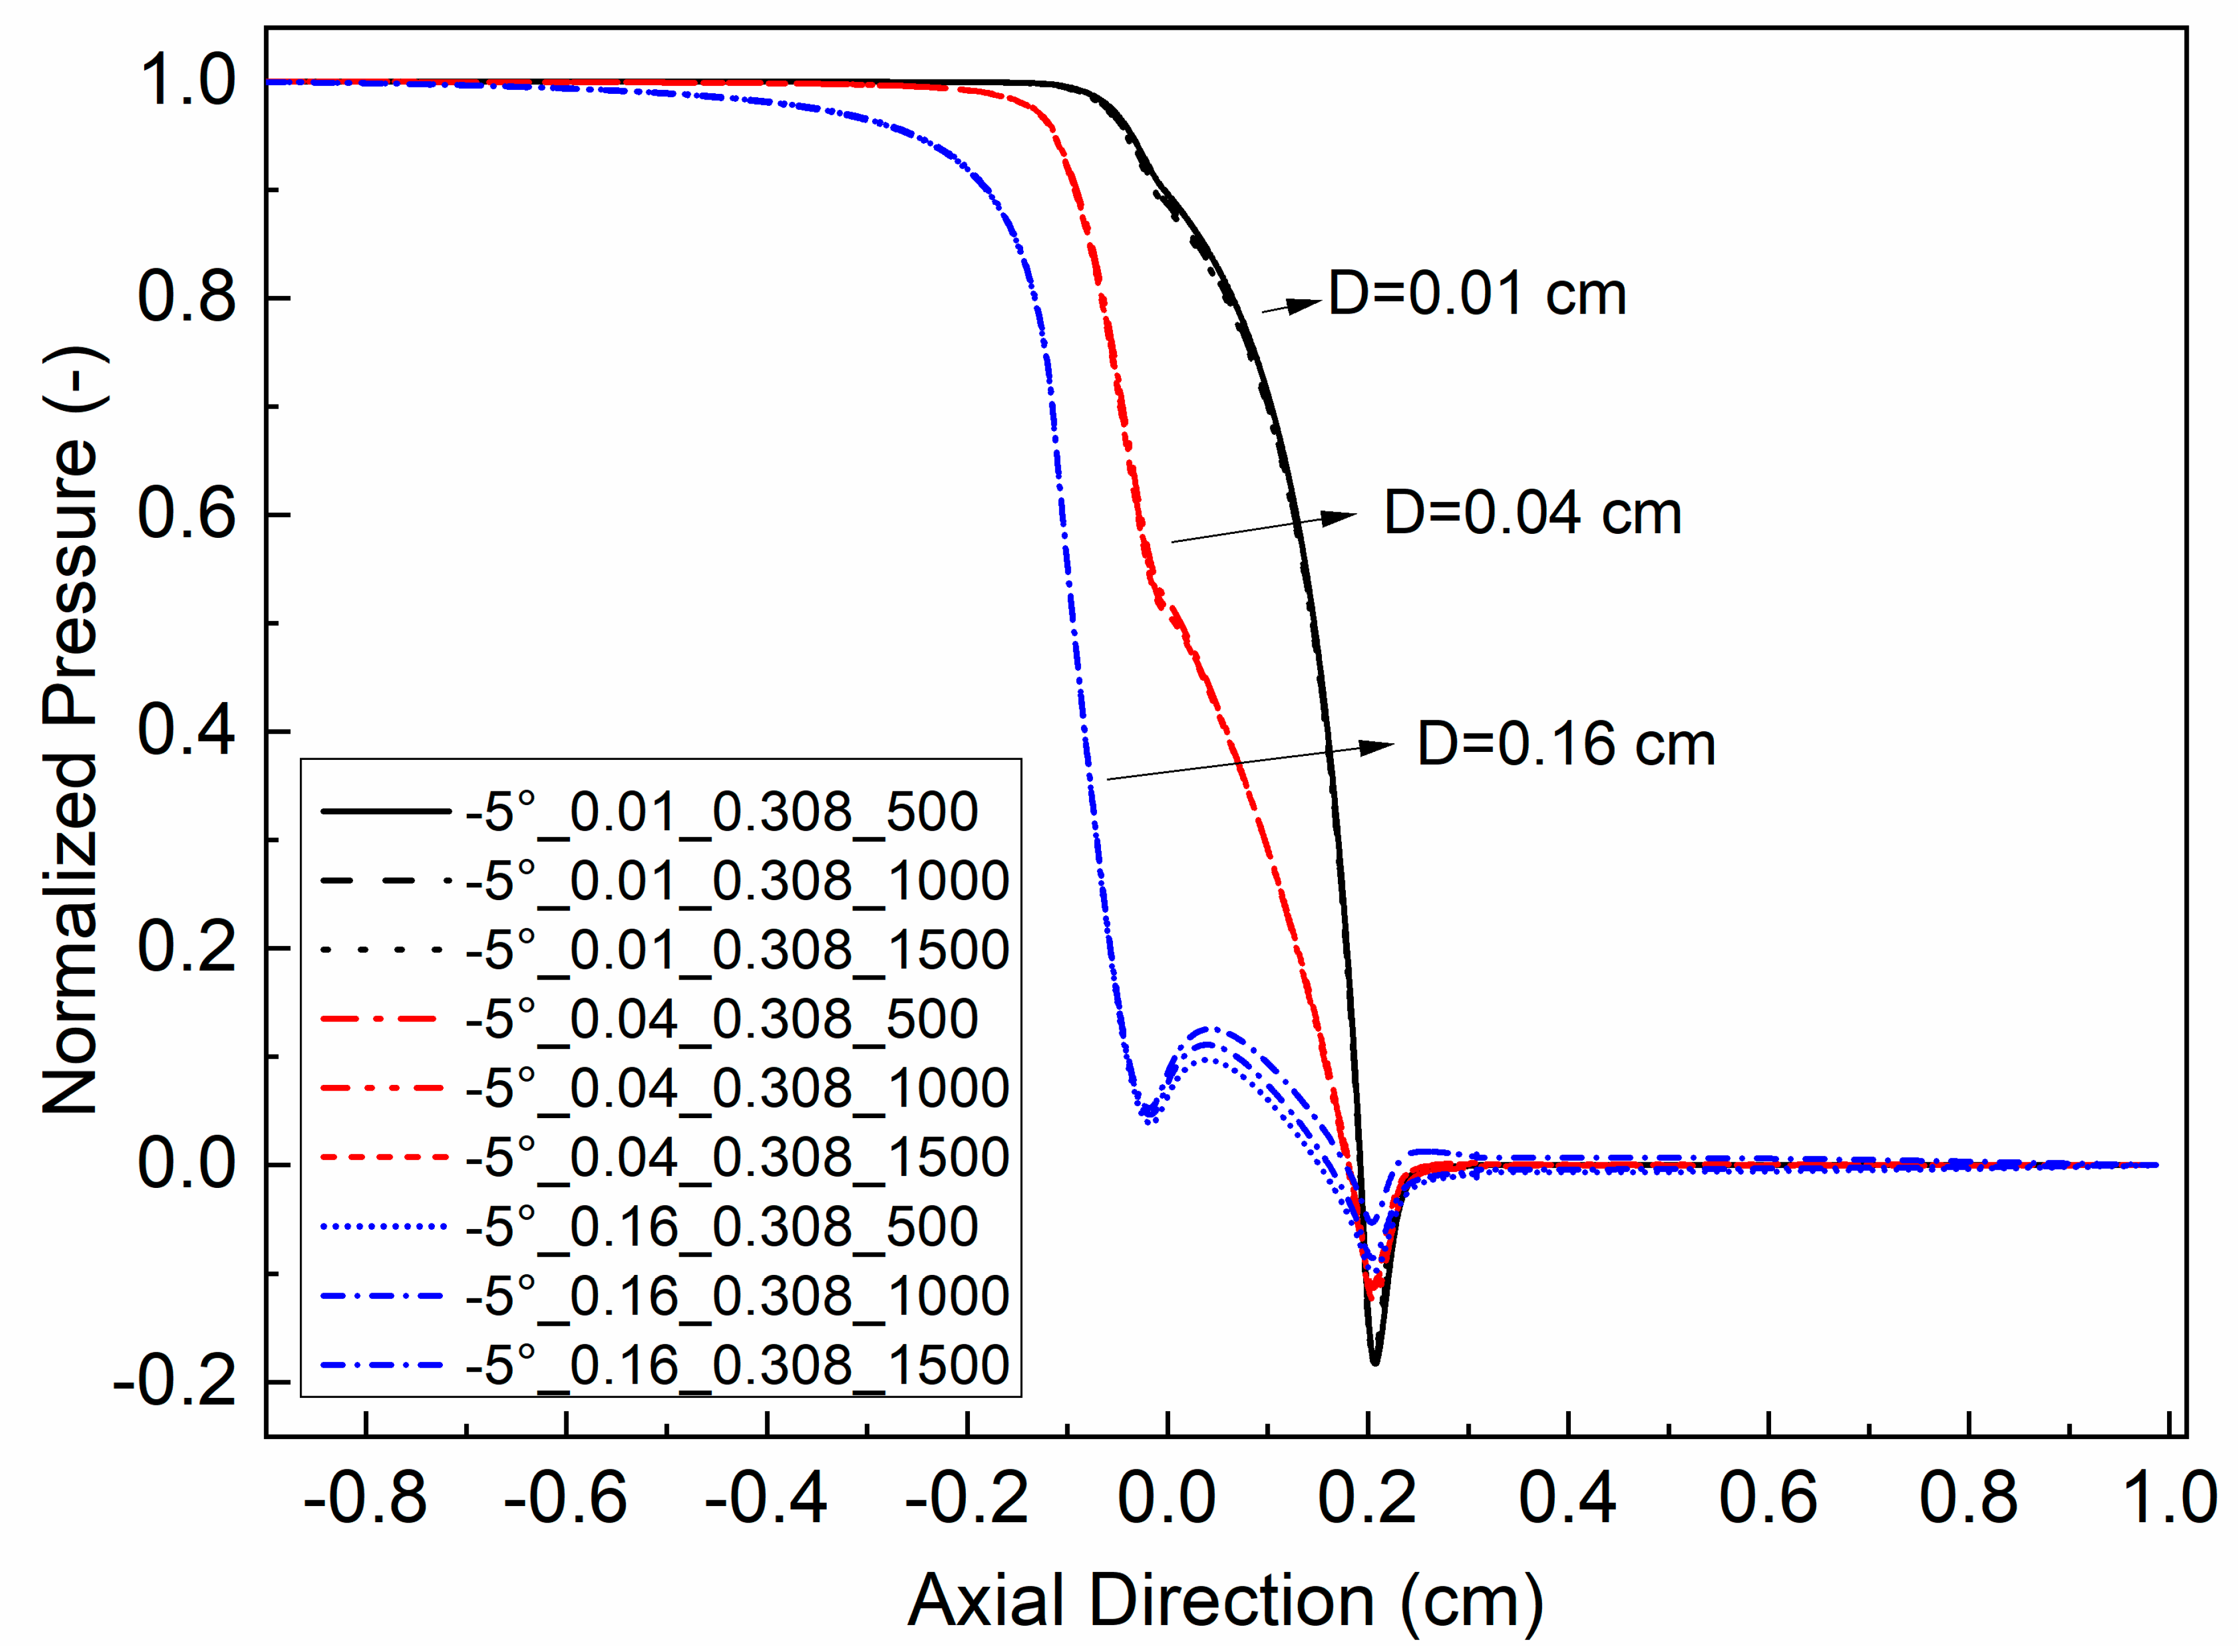
The pressure distributions for a particular glottal geometry typically collapse to nearly one distribution when the surface air pressures are normalized to the transglottal pressures (as shown, for example, in Scherer et al. (2010) [
43]). That is the case in this study as well. As an example, the dimensionless format intraglottal pressure distributions for the −5° convergent glottal angle, the 0.308 cm vertical glottal duct length, and the three minimal diameters (0.01, 0.04, and 0.16 cm), are shown in
Figure 3 for three transglottal pressures (∆
pT = 500 Pa, 1000 Pa, and 1500 Pa). The dimensionless pressure was calculated as
P =
p/∆
pT. It can be seen from the figure that the pressures are quite similar when intraglottal pressures are normalized by the transglottal pressure and are highly dependent on the minimal glottal diameter. Thus, in static models, the shape of the intraglottal pressure distribution is not dependent on the transglottal pressure magnitude per se.
3.2. Glottal Entrance Loss Coefficient
The glottal entrance loss coefficient
ke can be used to evaluate the magnitude of the pressure drop from the trachea to the entrance of the glottis for a given transglottal pressure and glottal airflow [
29,
44]. This coefficient can provide a non-dimensional quantitative measure of how the pressure difference from the trachea to the glottal entrance differs from lossless Bernoulli pressures. The glottal entrance loss coefficient is given by
where
Pe is the pressure difference between the trachea and the entrance to the glottis,
is the density of the air,
is the volume flow, and
is the cross-sectional area
LgDe at the glottal entrance location, where
Lg is the length of the vocal folds (1.2 cm here) and
De is the diameter of the glottis at the glottal entry.
The glottal entrance loss coefficient is usually graphed as a function of Reynolds number
Re, which is given by
where
V is the average velocity obtained by dividing the volume flow by the minimal cross-sectional area of the glottis,
v is the kinematic viscosity of air,
Dh is the hydraulic diameter,
Dh = 4Ag/S,
Ag is the minimal glottal area, and
S is the perimeter of the glottis cross-section at the minimal glottal diameter location.
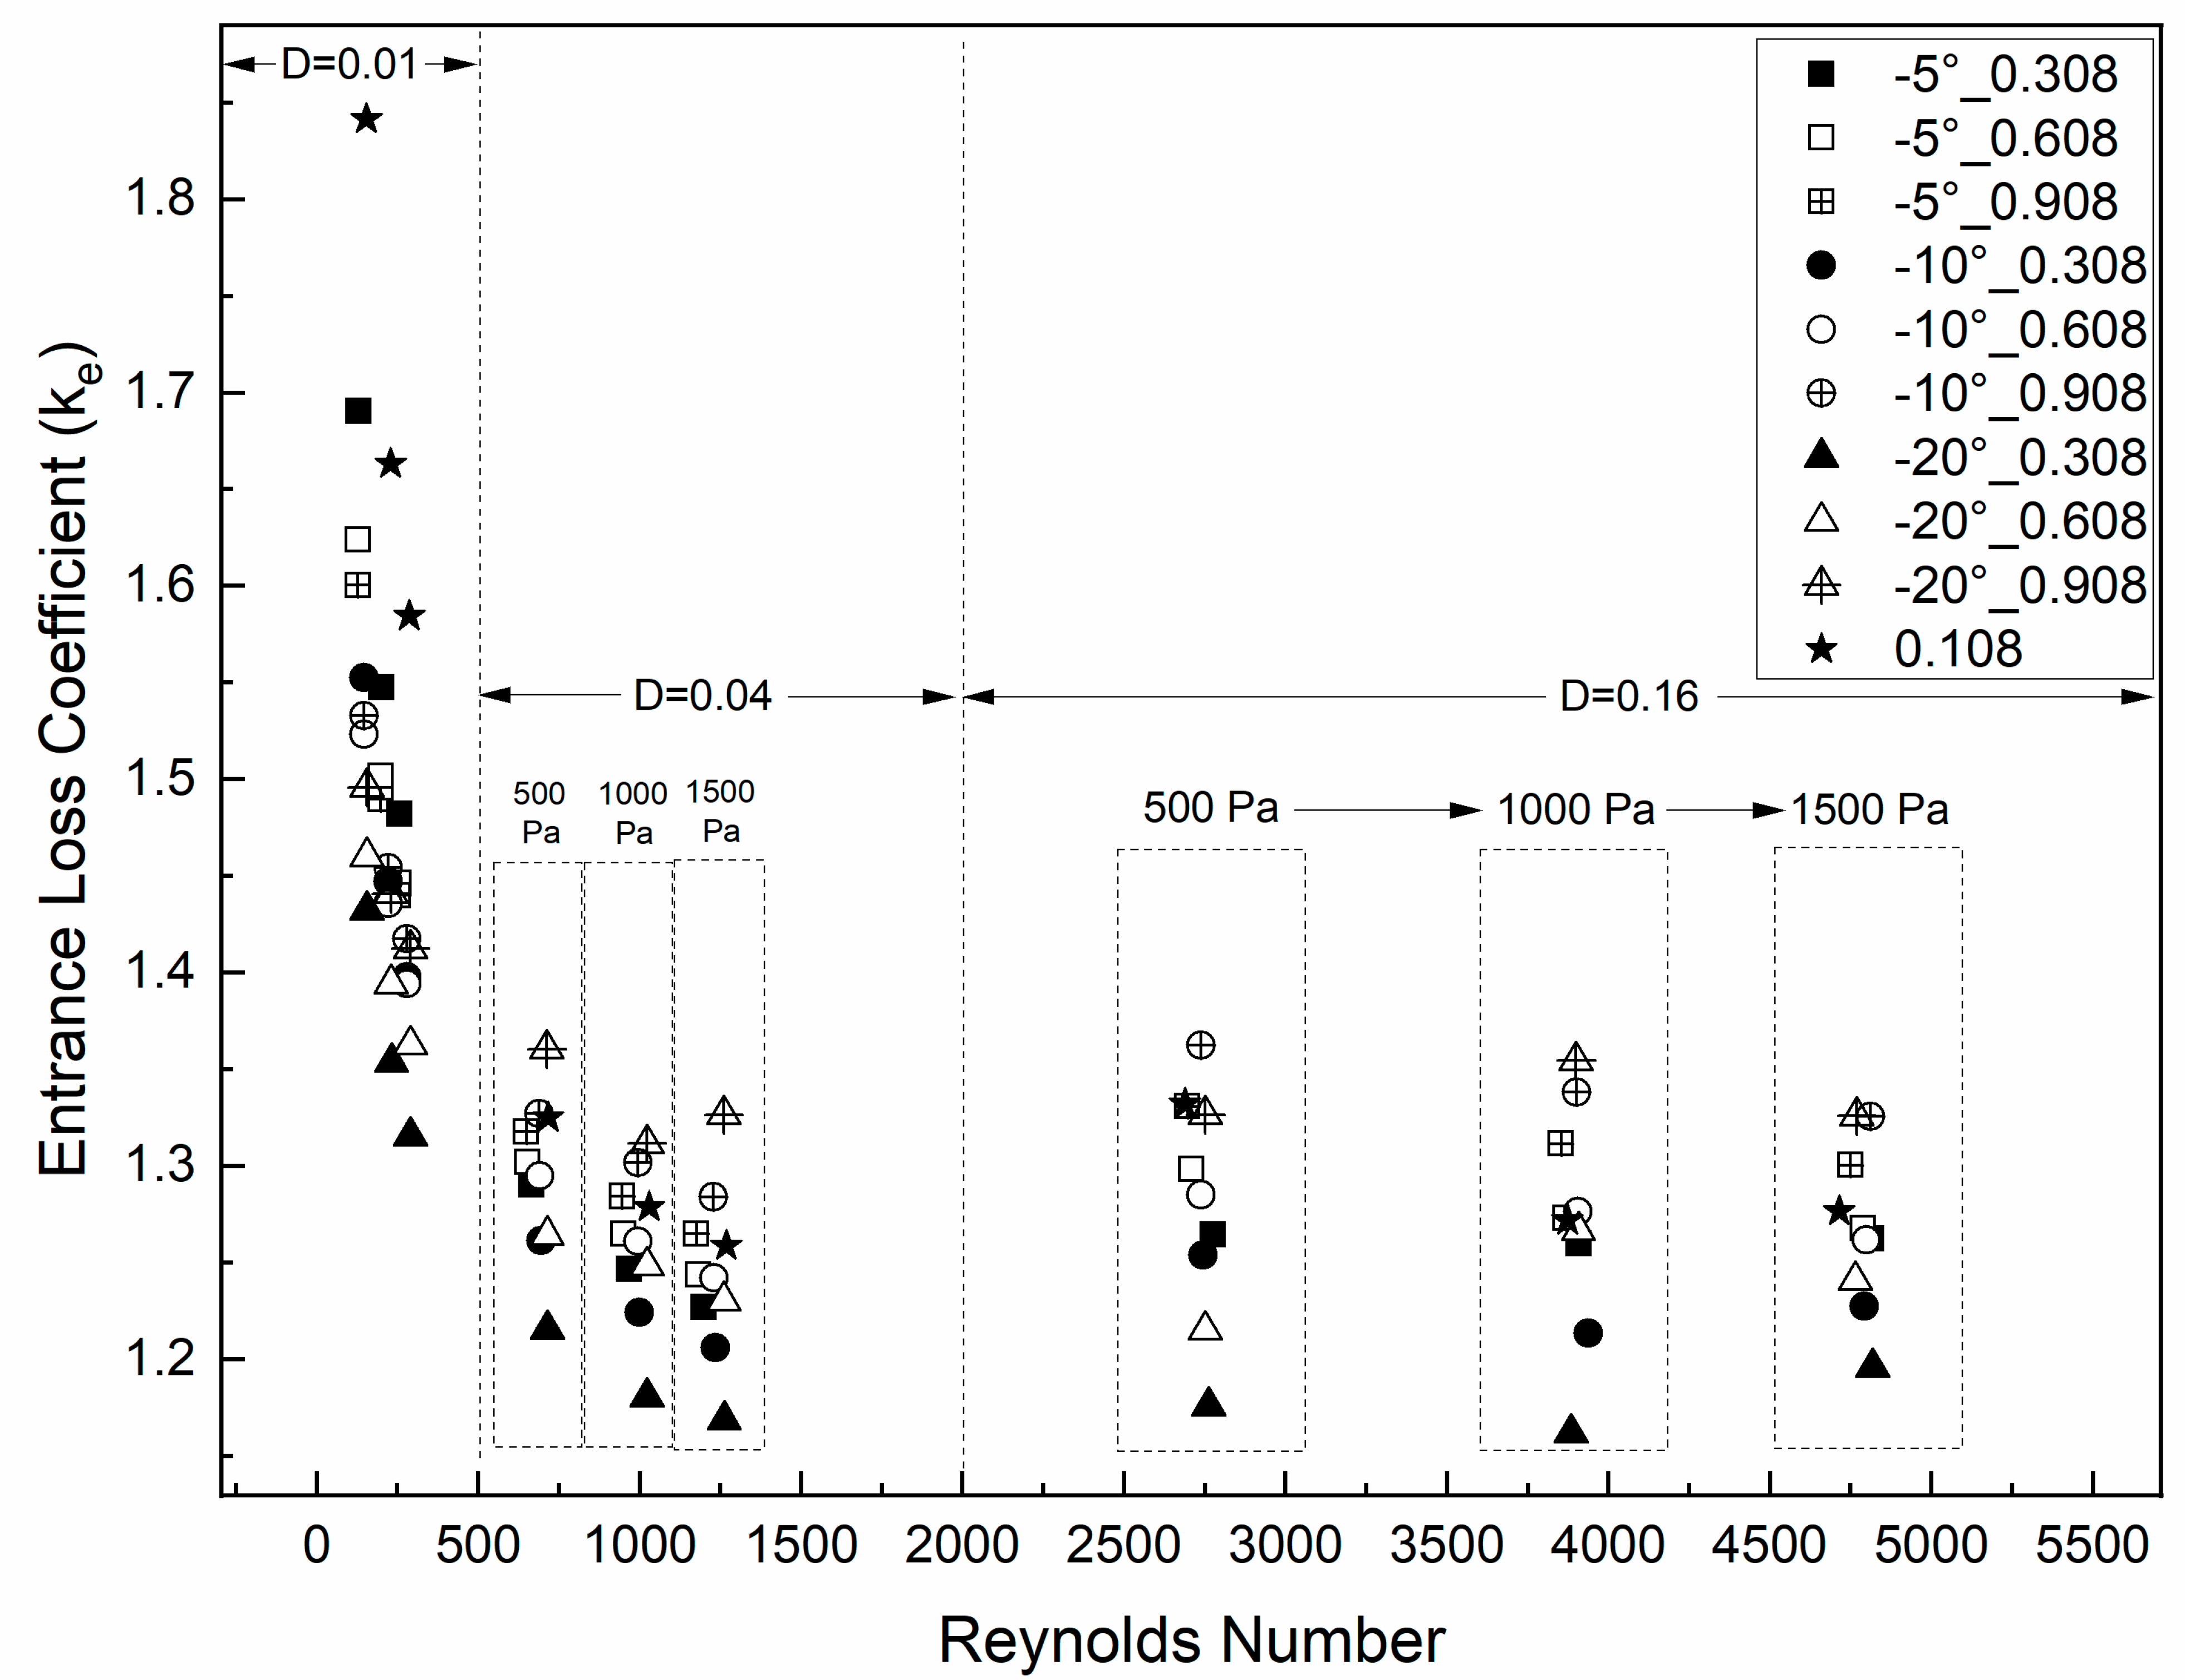
Figure 4 shows the results of
ke for different vertical lengths of the glottis, glottal diameter, convergent glottal angle, and transglottal pressure. The entrance coefficient
ke varied from values near 1.16 to 1.84, with an overall mean value of 1.34. This value is smaller than in our previous study for the uniform glottis (
ke varied from 1.21 to 20.66, with a mean of 2.48) [
7] and is also slightly smaller than the average number from van den Berg et al. (1.375) for their rectangular glottis [
45].
As
Figure 4 shows, the entrance coefficient differs between the cases for the minimal diameter of 0.01 cm compared to the cases for the other two diameters, 0.04 cm and 0.16 cm. For the diameter of 0.01 cm,
ke has a steep (decreasing) relation with
Re (and therefore also with transglottal pressure) up to a value of 500, with the highest values (c. 1.6 to 1.7) for the smallest convergent angle (−5°) and the lowest values (c. 1.3 to 1.4) for the largest convergent angle (−20°). For this small diameter, except for the smallest convergent angle, the entrance coefficient values have a tendency to increase with a longer glottal duct length.
For the other two minimal diameters, 0.04 cm and 0.16 cm, the entrance coefficient increased as the vertical glottal duct length increased, but it was not dependent on diameter nor angle, being in the range of c. 1.28 to 1.36 for the length 0.908 cm, in the range of c. 1.15 to 1.25 for the length 0.308 cm, and between these two ranges for the length 0.608 cm. It is noted that a change from 1.15 to 1.36 is a change of 18%.
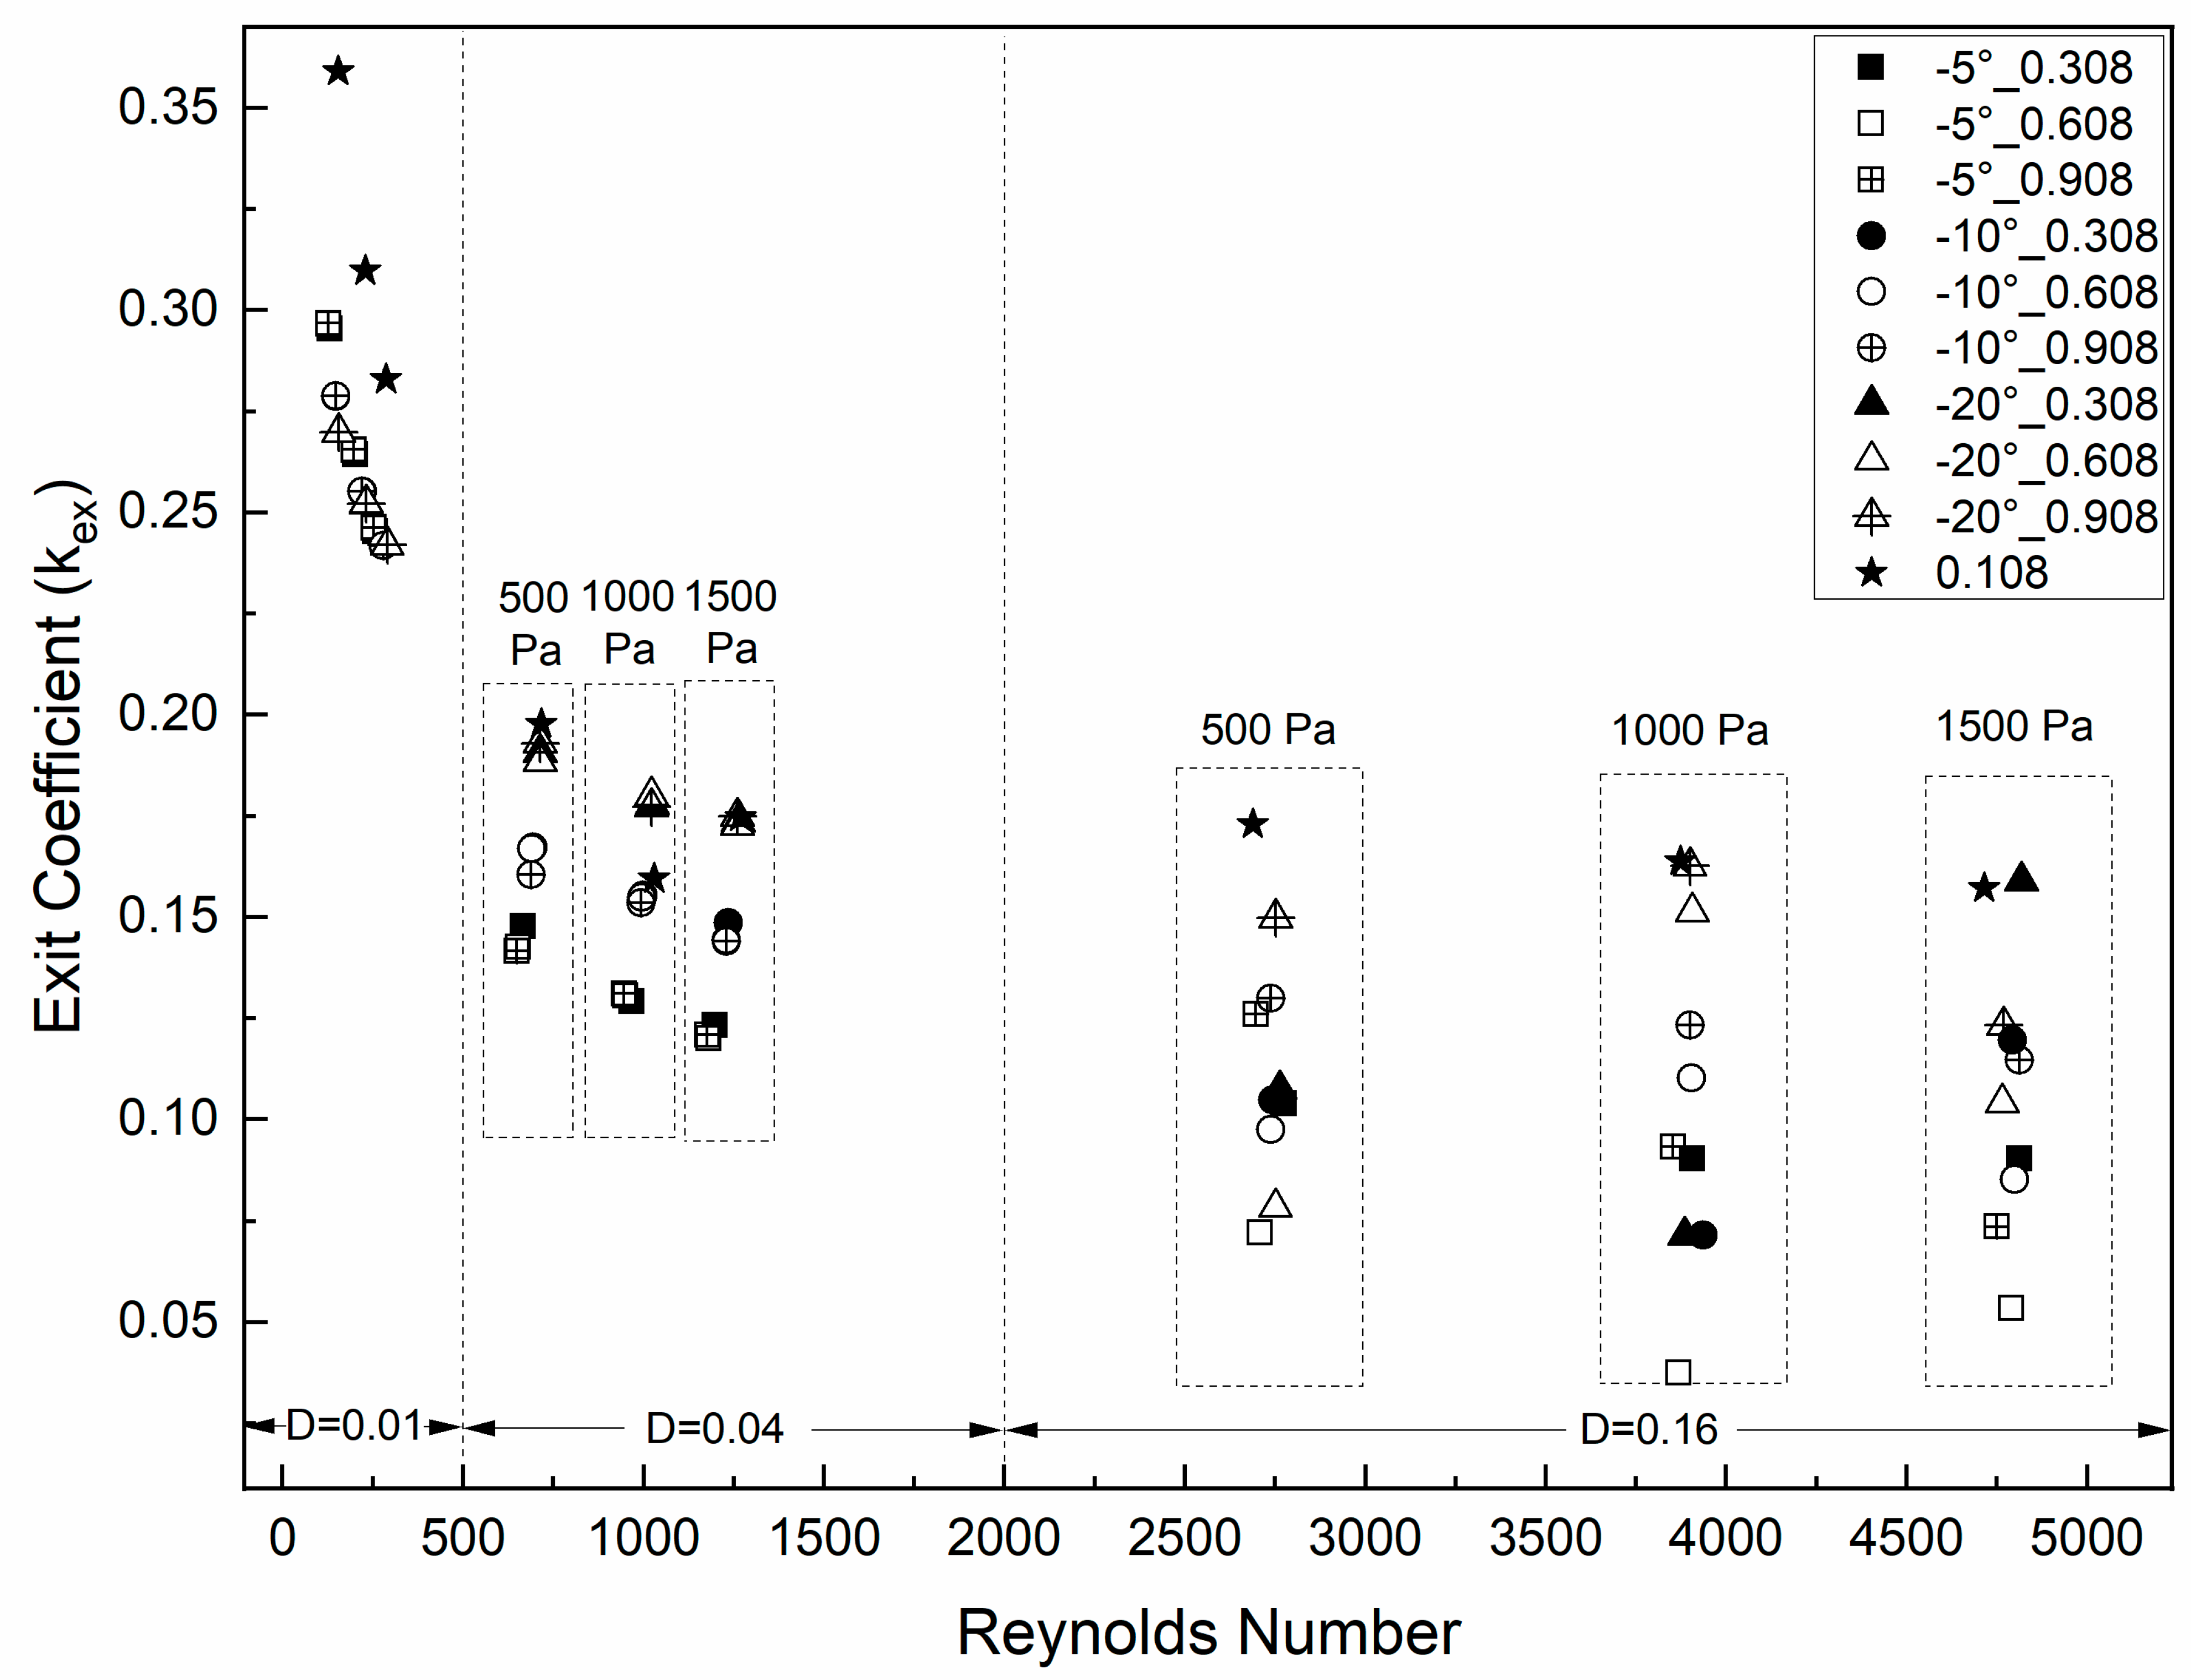
3.3. Exit Coefficient
The exit coefficient represents the effect of intraglottal pressure recovery (increase) from the glottal exit to the hypopharyngeal cavity for a given transglottal pressure [
29,
45]. It provides a nondimensional quantitative measure of how the pressures in the glottis differ from the lossless Bernoulli condition.
The exit coefficient is calculated as follows:
where
Aex is the glottal area at the glottal minimal diameter location (just prior to the exit rounding) and
Pex is the pressure recovery (increase) from the glottal minimal diameter location to the supraglottal region (pharynx) (assumed to be atmospheric or zero pressure in this study).
and
have the same meaning as for the entrance loss coefficient.
Figure 5 shows the exit coefficient values versus Reynolds number for all of the cases in this study. The exit coefficient value is relatively small (between 0.04 and 0.36) and tended to decrease as the glottal minimal diameter increased. For example,
decreased from 0.295 to 0.141 and then to 0.126 as the minimal diameter increased from 0.01 cm to 0.04 cm and then to 0.16 cm, respectively, for the condition of the 0.308 cm duct length, −5° glottal angle, and 500 Pa transglottal pressure.
also tended to decrease as the transglottal pressure increased for the smallest diameter, but not for the larger diameters. There was essentially no relation between
and the length of the vertical glottal duct. These results (
being inversely related to the minimal diameter and transglottal pressure) are consistent with results of Fulcher et al. [
44] and Sheng et al. [
40]. These results suggest that the pressure recovery from the glottal exit is relatively independent of the vertical glottal duct length and convergent glottal angle and more dependent on minimal diameter and transglottal pressure.
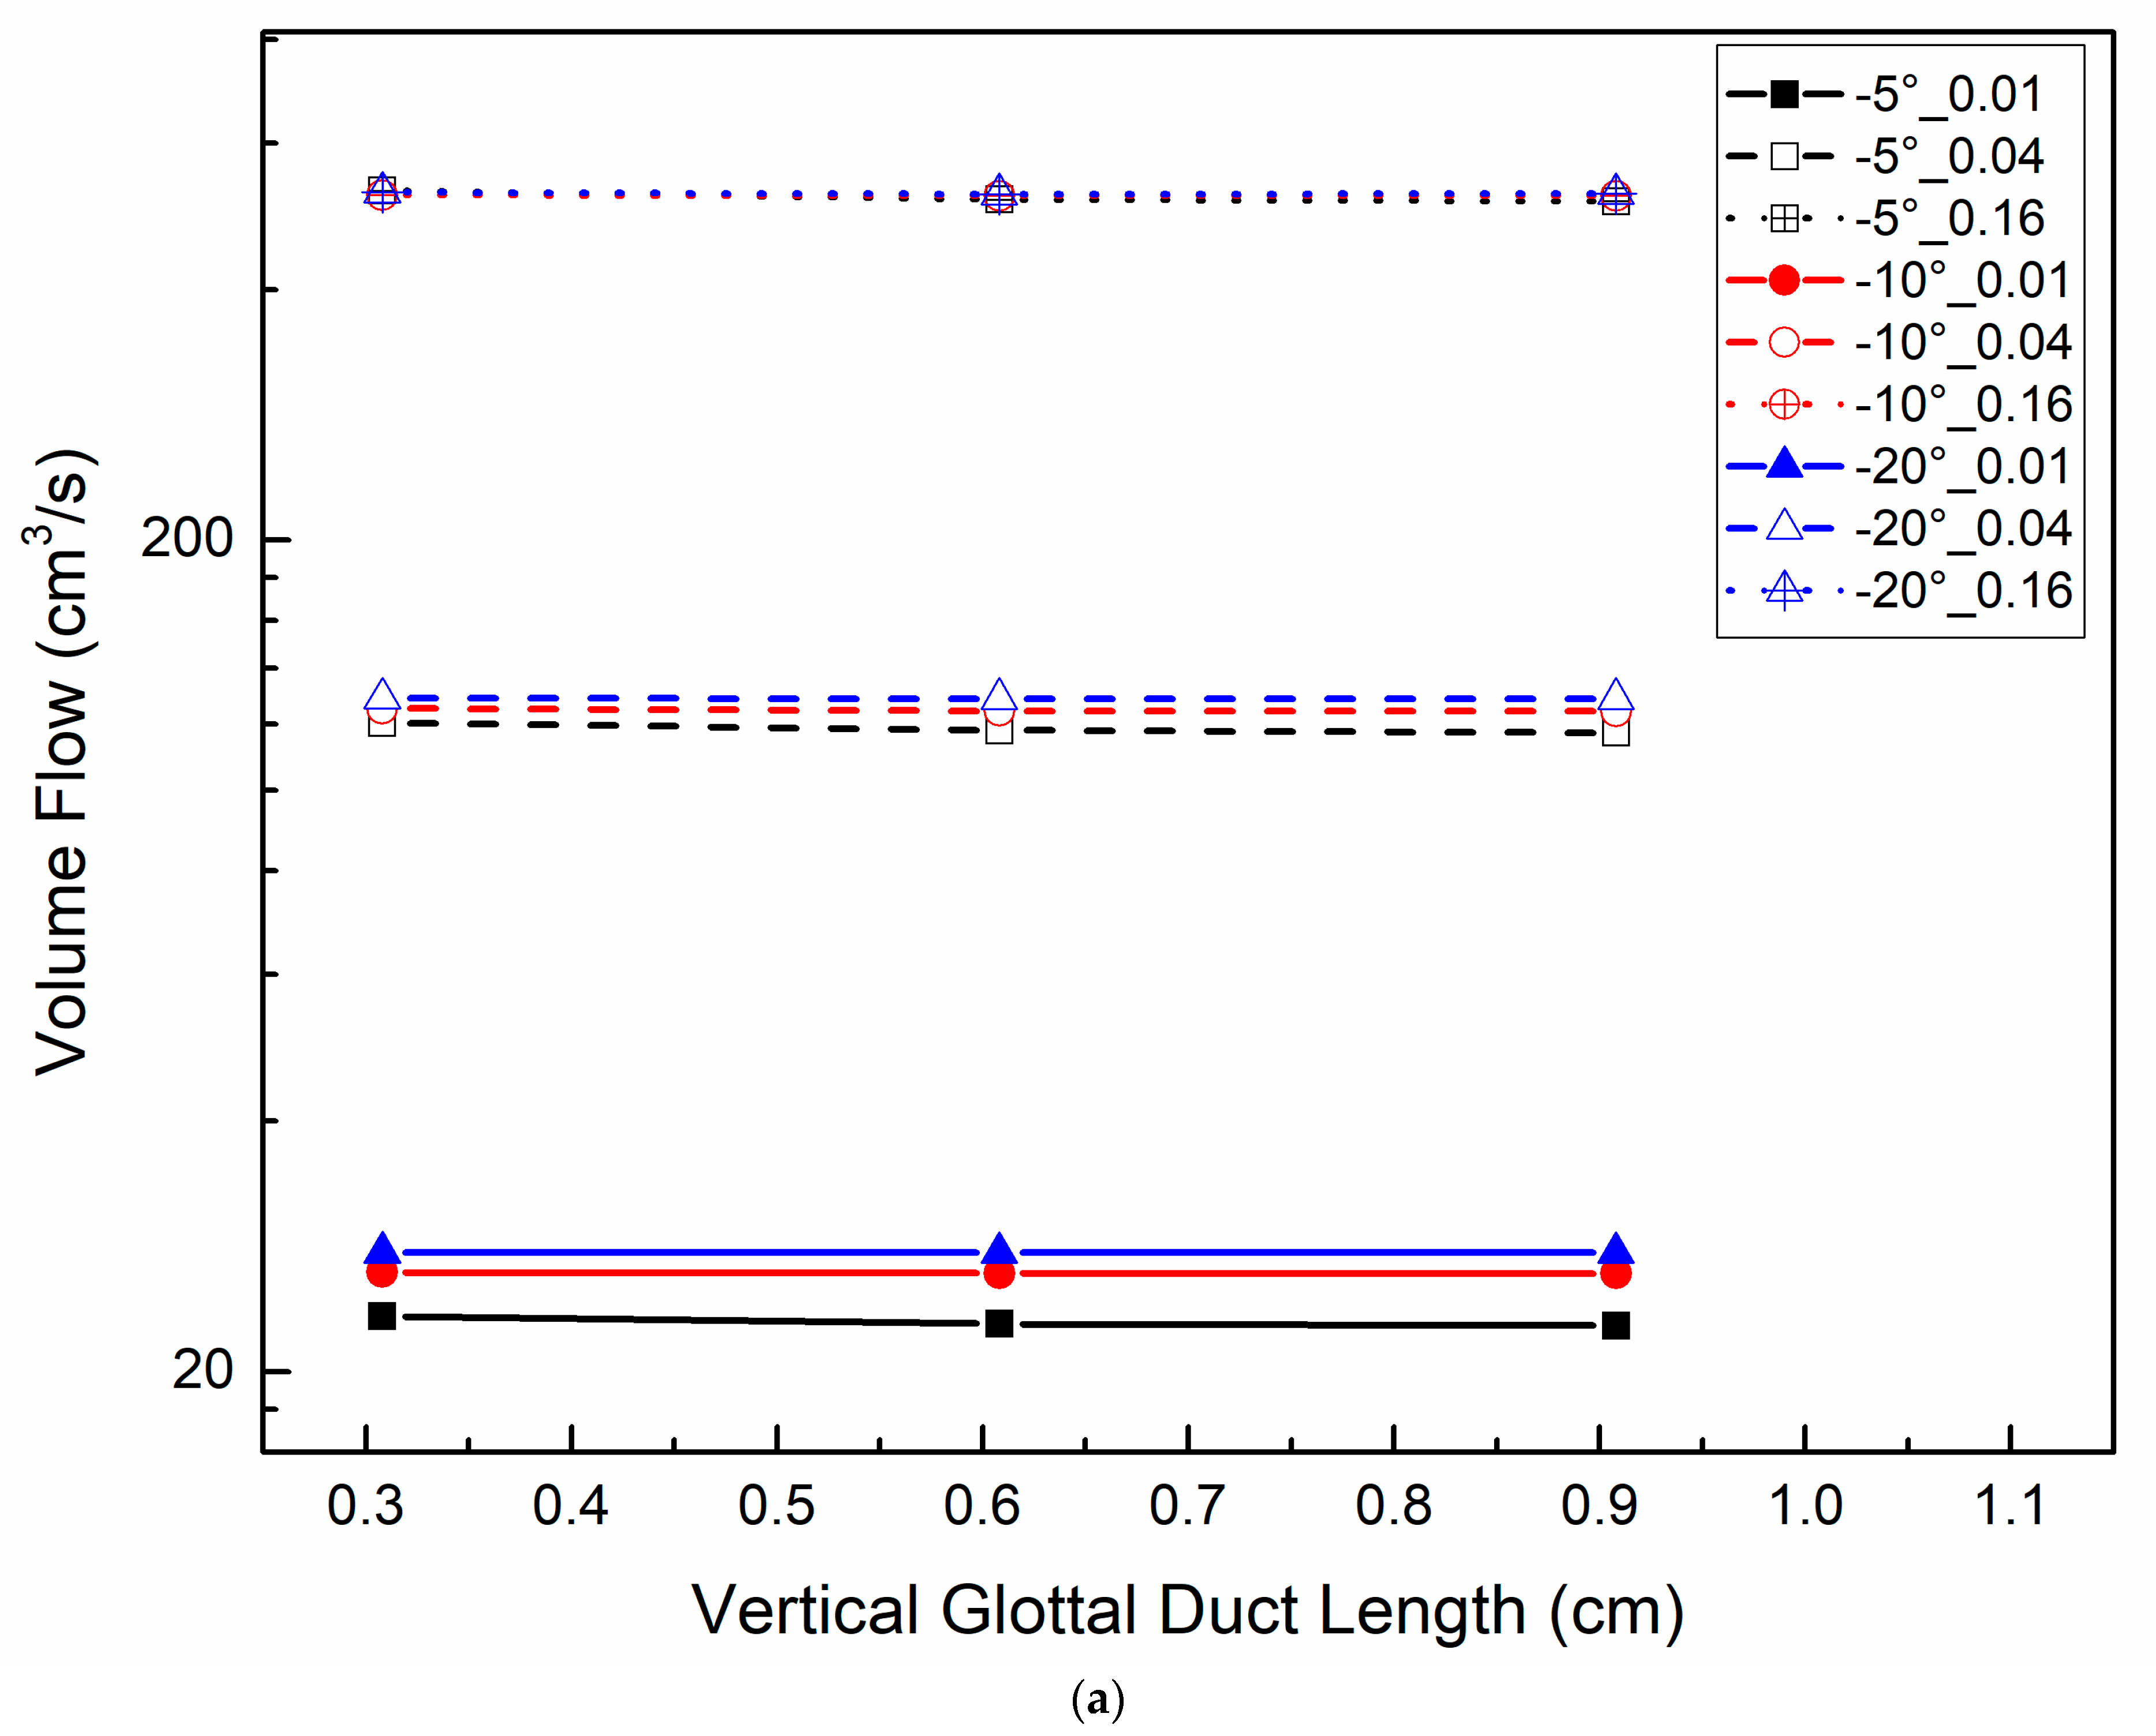
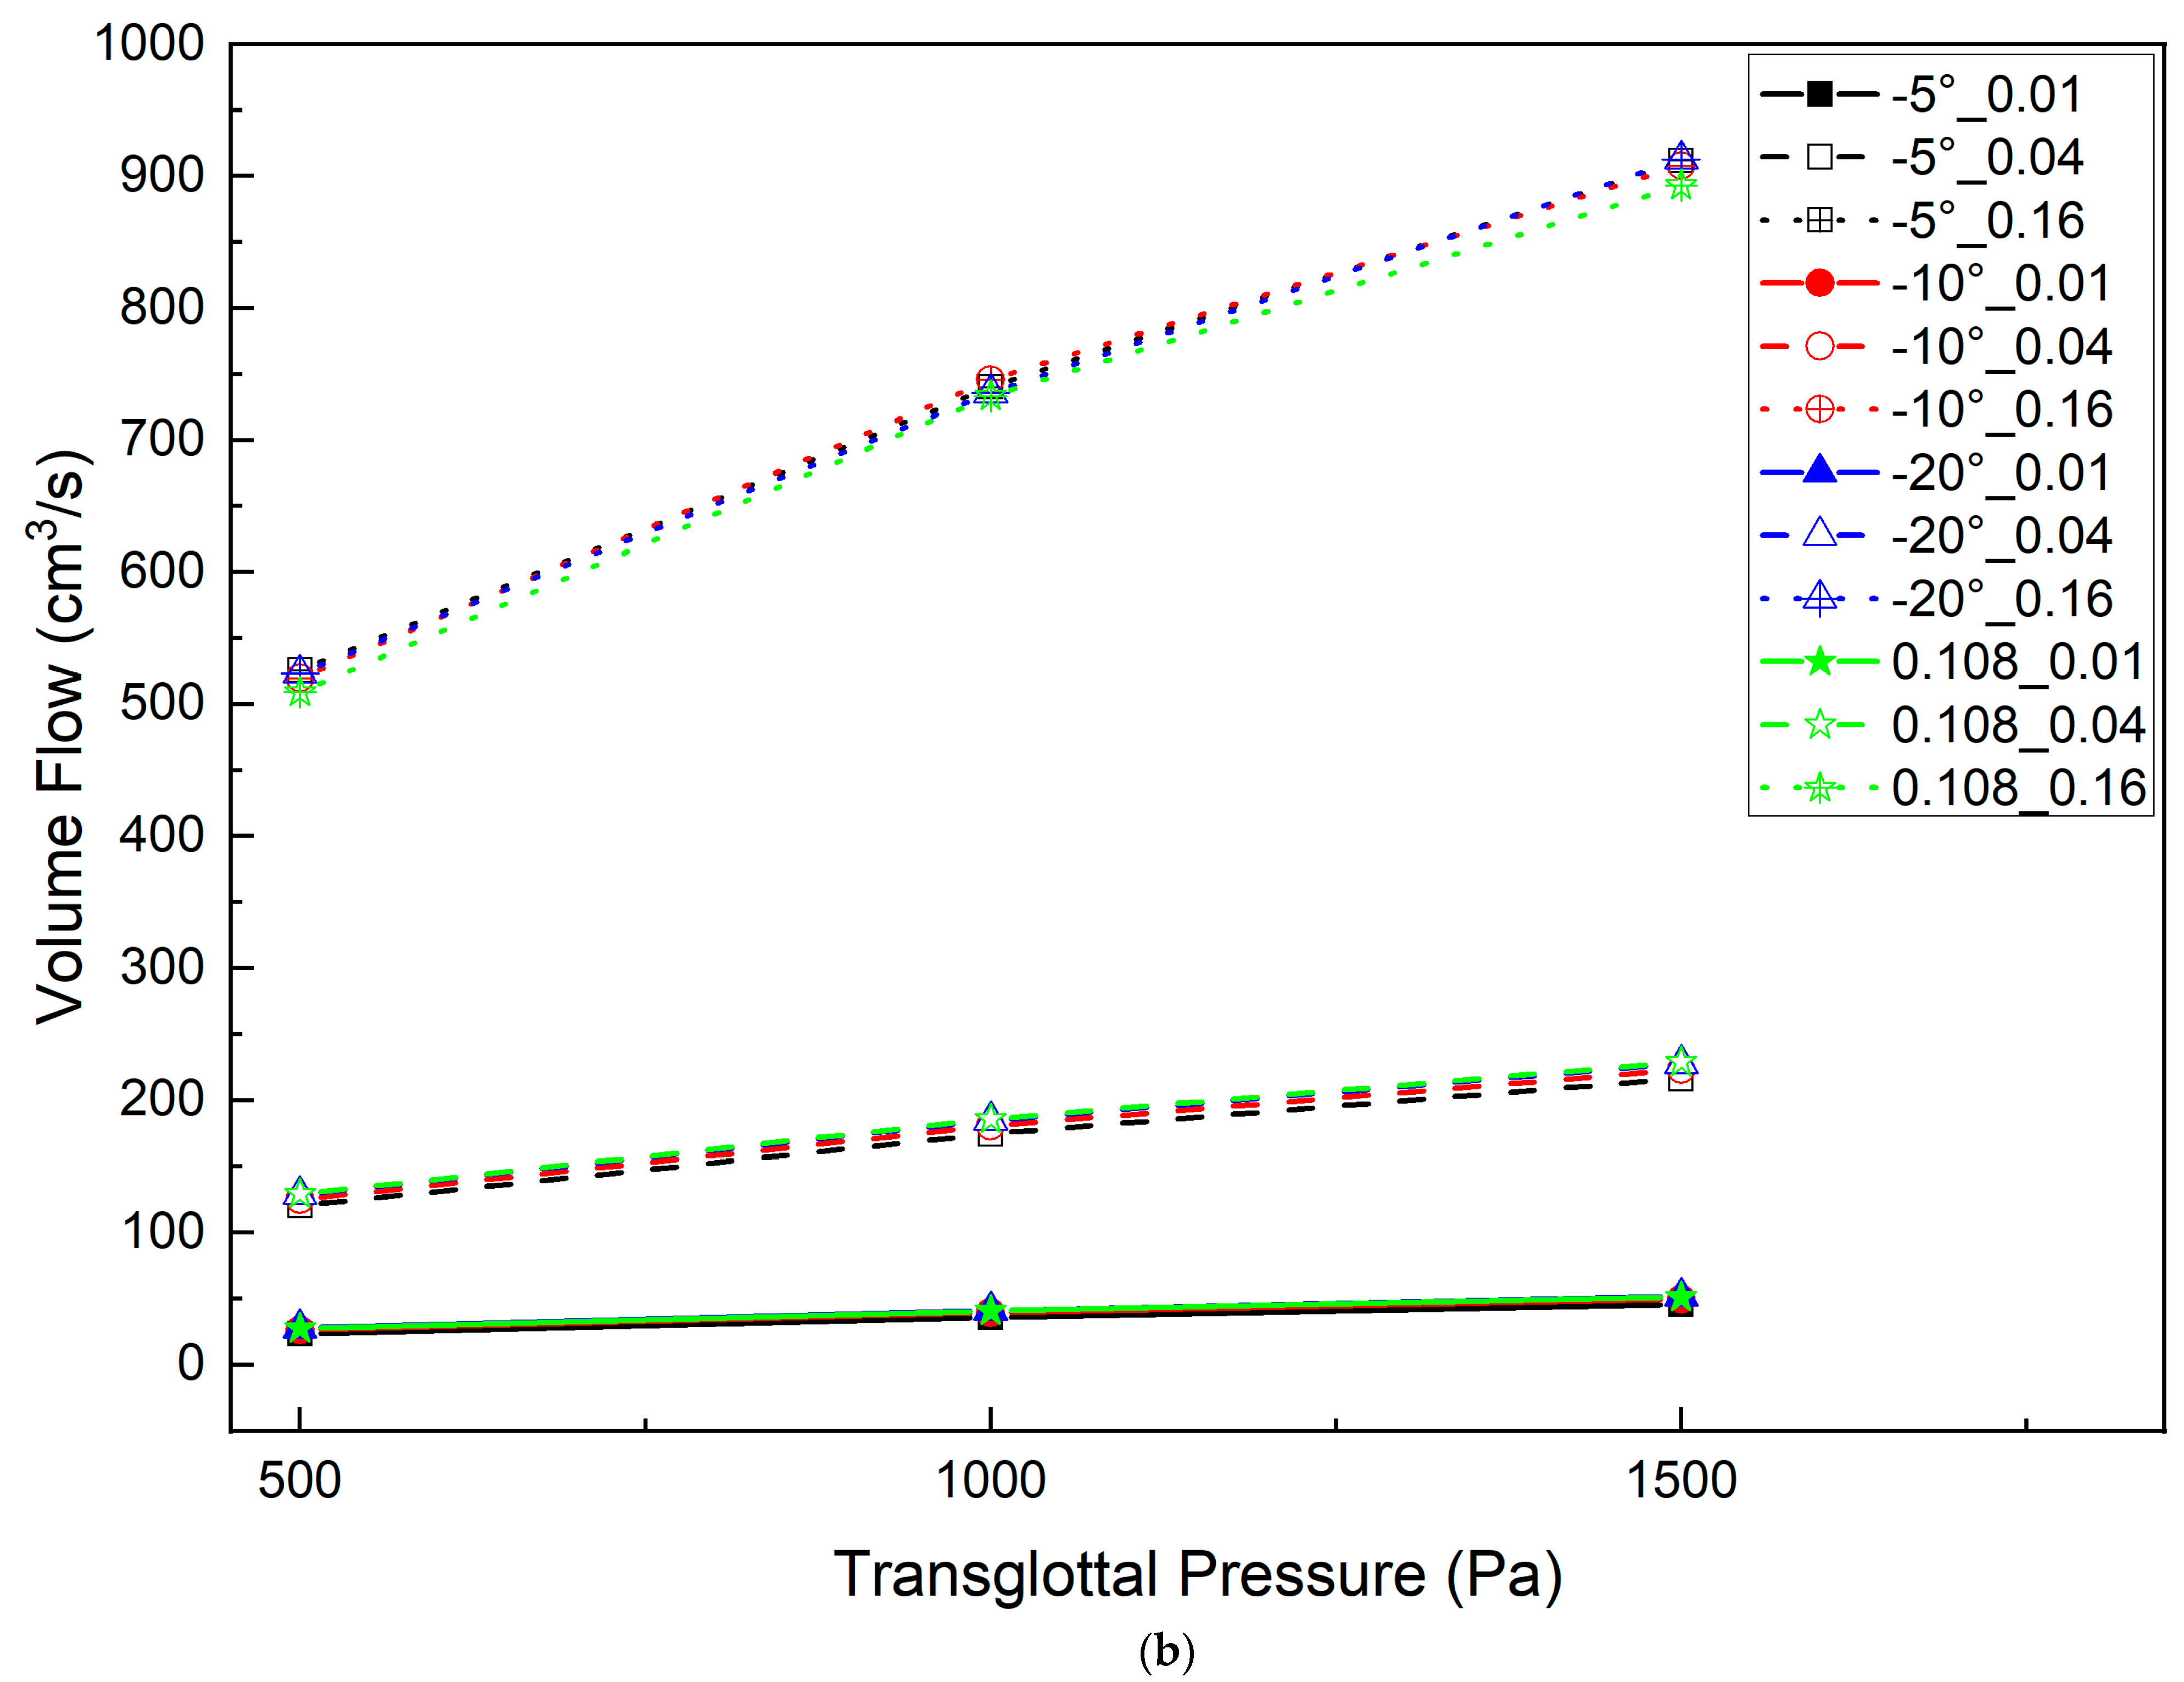
3.4. Volume Flow
Figure 6 shows the volume flow relative to the vertical glottal duct length (
Figure 6a) and transglottal pressure (
Figure 6b), with parameters of minimal diameter and glottal angle for 500 Pa transglottal pressure. The volume flow increased with minimal diameter increase and transglottal pressure increase, but was not sensitive to the glottal duct length, and only weakly to the convergent glottal angle (being higher for a larger convergent angle). The volume flow increased from 23.29 cm
3/s to 525.78 cm
3/s (an increase of 21.57 times) when the minimal diameter increased from 0.01 cm to 0.16 cm for the −5° glottal angle, the 0.308 cm minimal diameter, and the 500 Pa transglottal pressure. This flow difference reached 866.09 cm
3/s (an increase of 18.91 times) when the transglottal pressure increased to 1500 Pa (45.81 cm
3/s and 911.89 cm
3/s for 0.01 cm and 0.16 cm, respectively). The larger the minimal diameter, the larger the effect of transglottal pressure. These results suggest that the glottal minimal diameter and transglottal pressure are the primary controllers of volume flow (and therefore also glottal airflow resistance), and the vertical glottal duct length for convergent glottal shapes has relatively little effect on the volume flow.
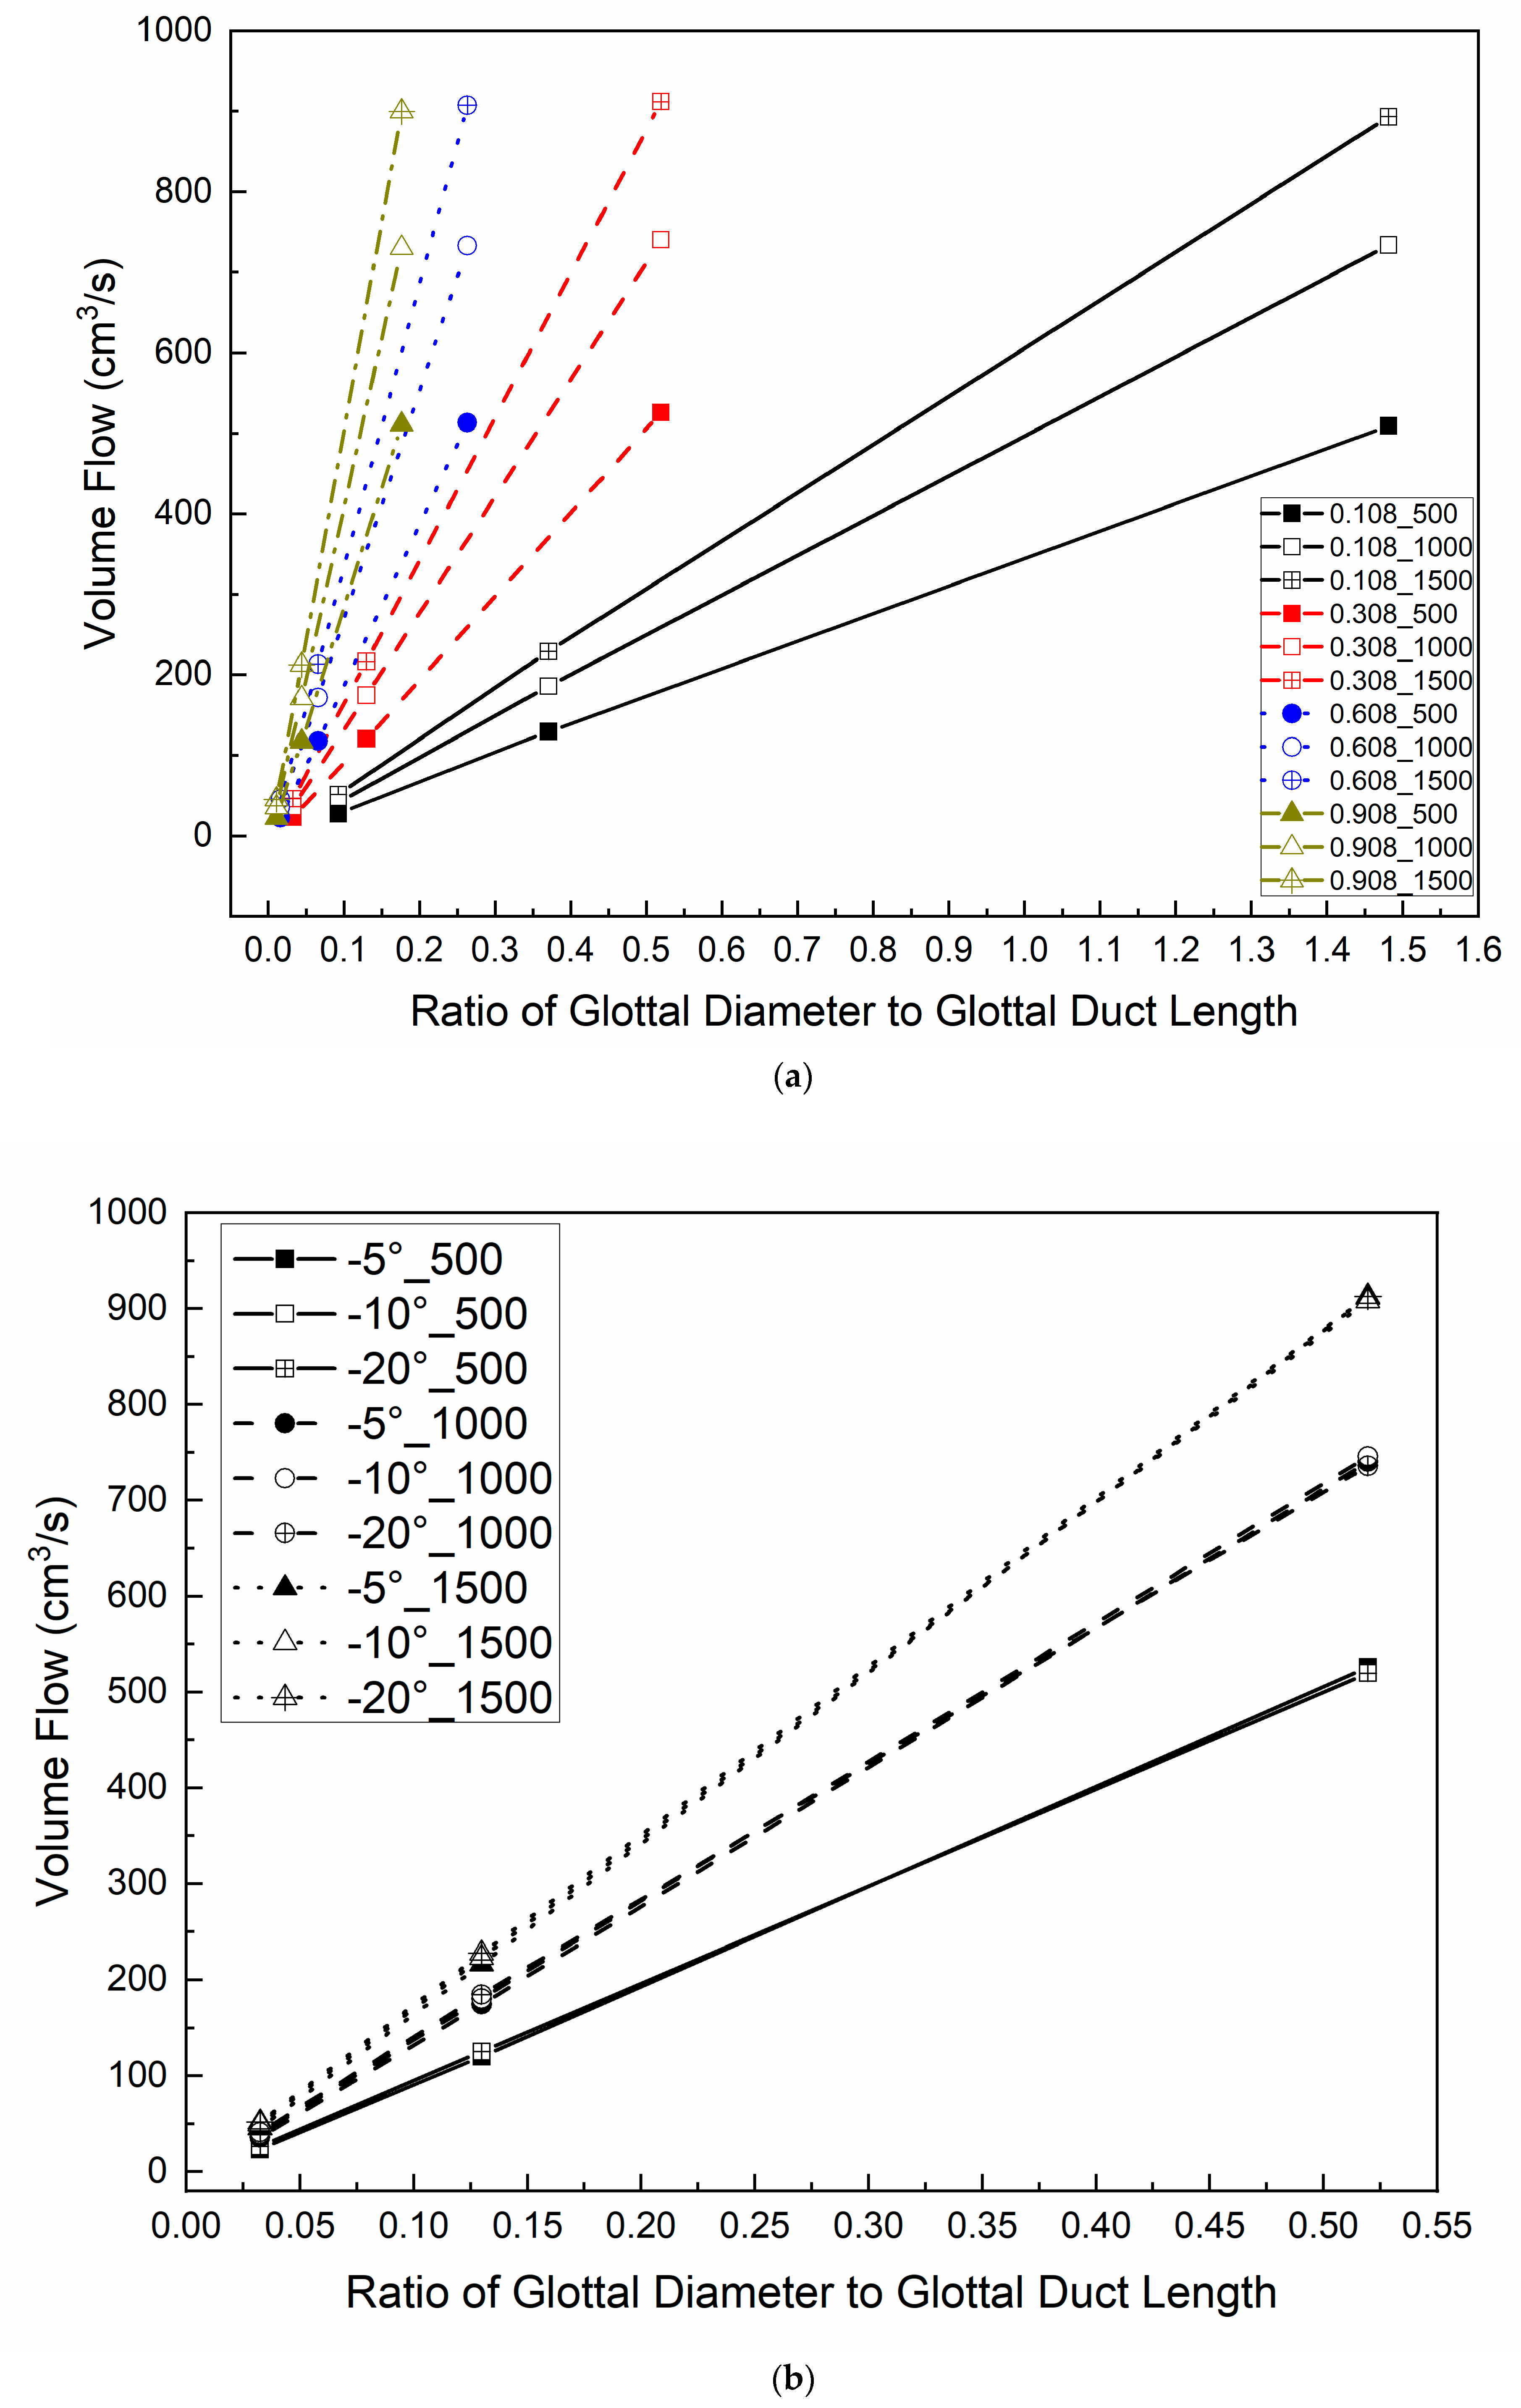
The ratio of the minimal glottal diameter to the vertical glottal duct length (approximately 0.01 to 0.53 in this study) is an important aspect ratio in the sense that there should be an increase in airflow resistance for either a reduction in glottal diameter or an increase in duct length due to added viscous effects within the duct [
46] or an increase in transglottal pressure.
Figure 7 shows the volume flow values in relation to this ratio for all of the 0.108 minimal diameter cases and −5° glottal angle cases (
Figure 7a) and for all of the 0.308 cm minimal diameter cases (
Figure 7b). The airflow has an essentially linear relationship with the ratio for each transglottal pressure, with increasing slope for increasing transglottal pressure and for increasing vertical glottal duct length. However, the change of the convergent glottal angle has negligible effect on the volume flow values relative to this ratio (
Figure 7b). These results are consistent with the results shown in
Figure 6 and are consistent with our previous results for the uniform glottis.
3.5. Transglottal Pressure Coefficient
The transglottal pressure coefficient provides a nondimensional quantitative measure of how the pressure drop from the trachea to downstream of the glottis differs from lossless Bernoulli pressure. Conversely, for a constant flow, a large transglottal pressure coefficient would correspond to a large pressure difference across the glottal region. The transglottal pressure coefficient is also a primary variable in Titze’s PTP expression [
6,
7,
46]. The nondimensional transglottal pressure coefficient
kt is given by
where
P is the transglottal pressure (the pressure drop between the trachea and a location downstream of the glottis),
is the density of the air, and
V is the average velocity in the glottis, given by the volume flow
divided by the minimal glottal cross-sectional area
LgDm, where
Lg and
Dm are the cross-sectional dimensions (anterior-posterior length and minimal diameter, respectively) of the glottal duct.
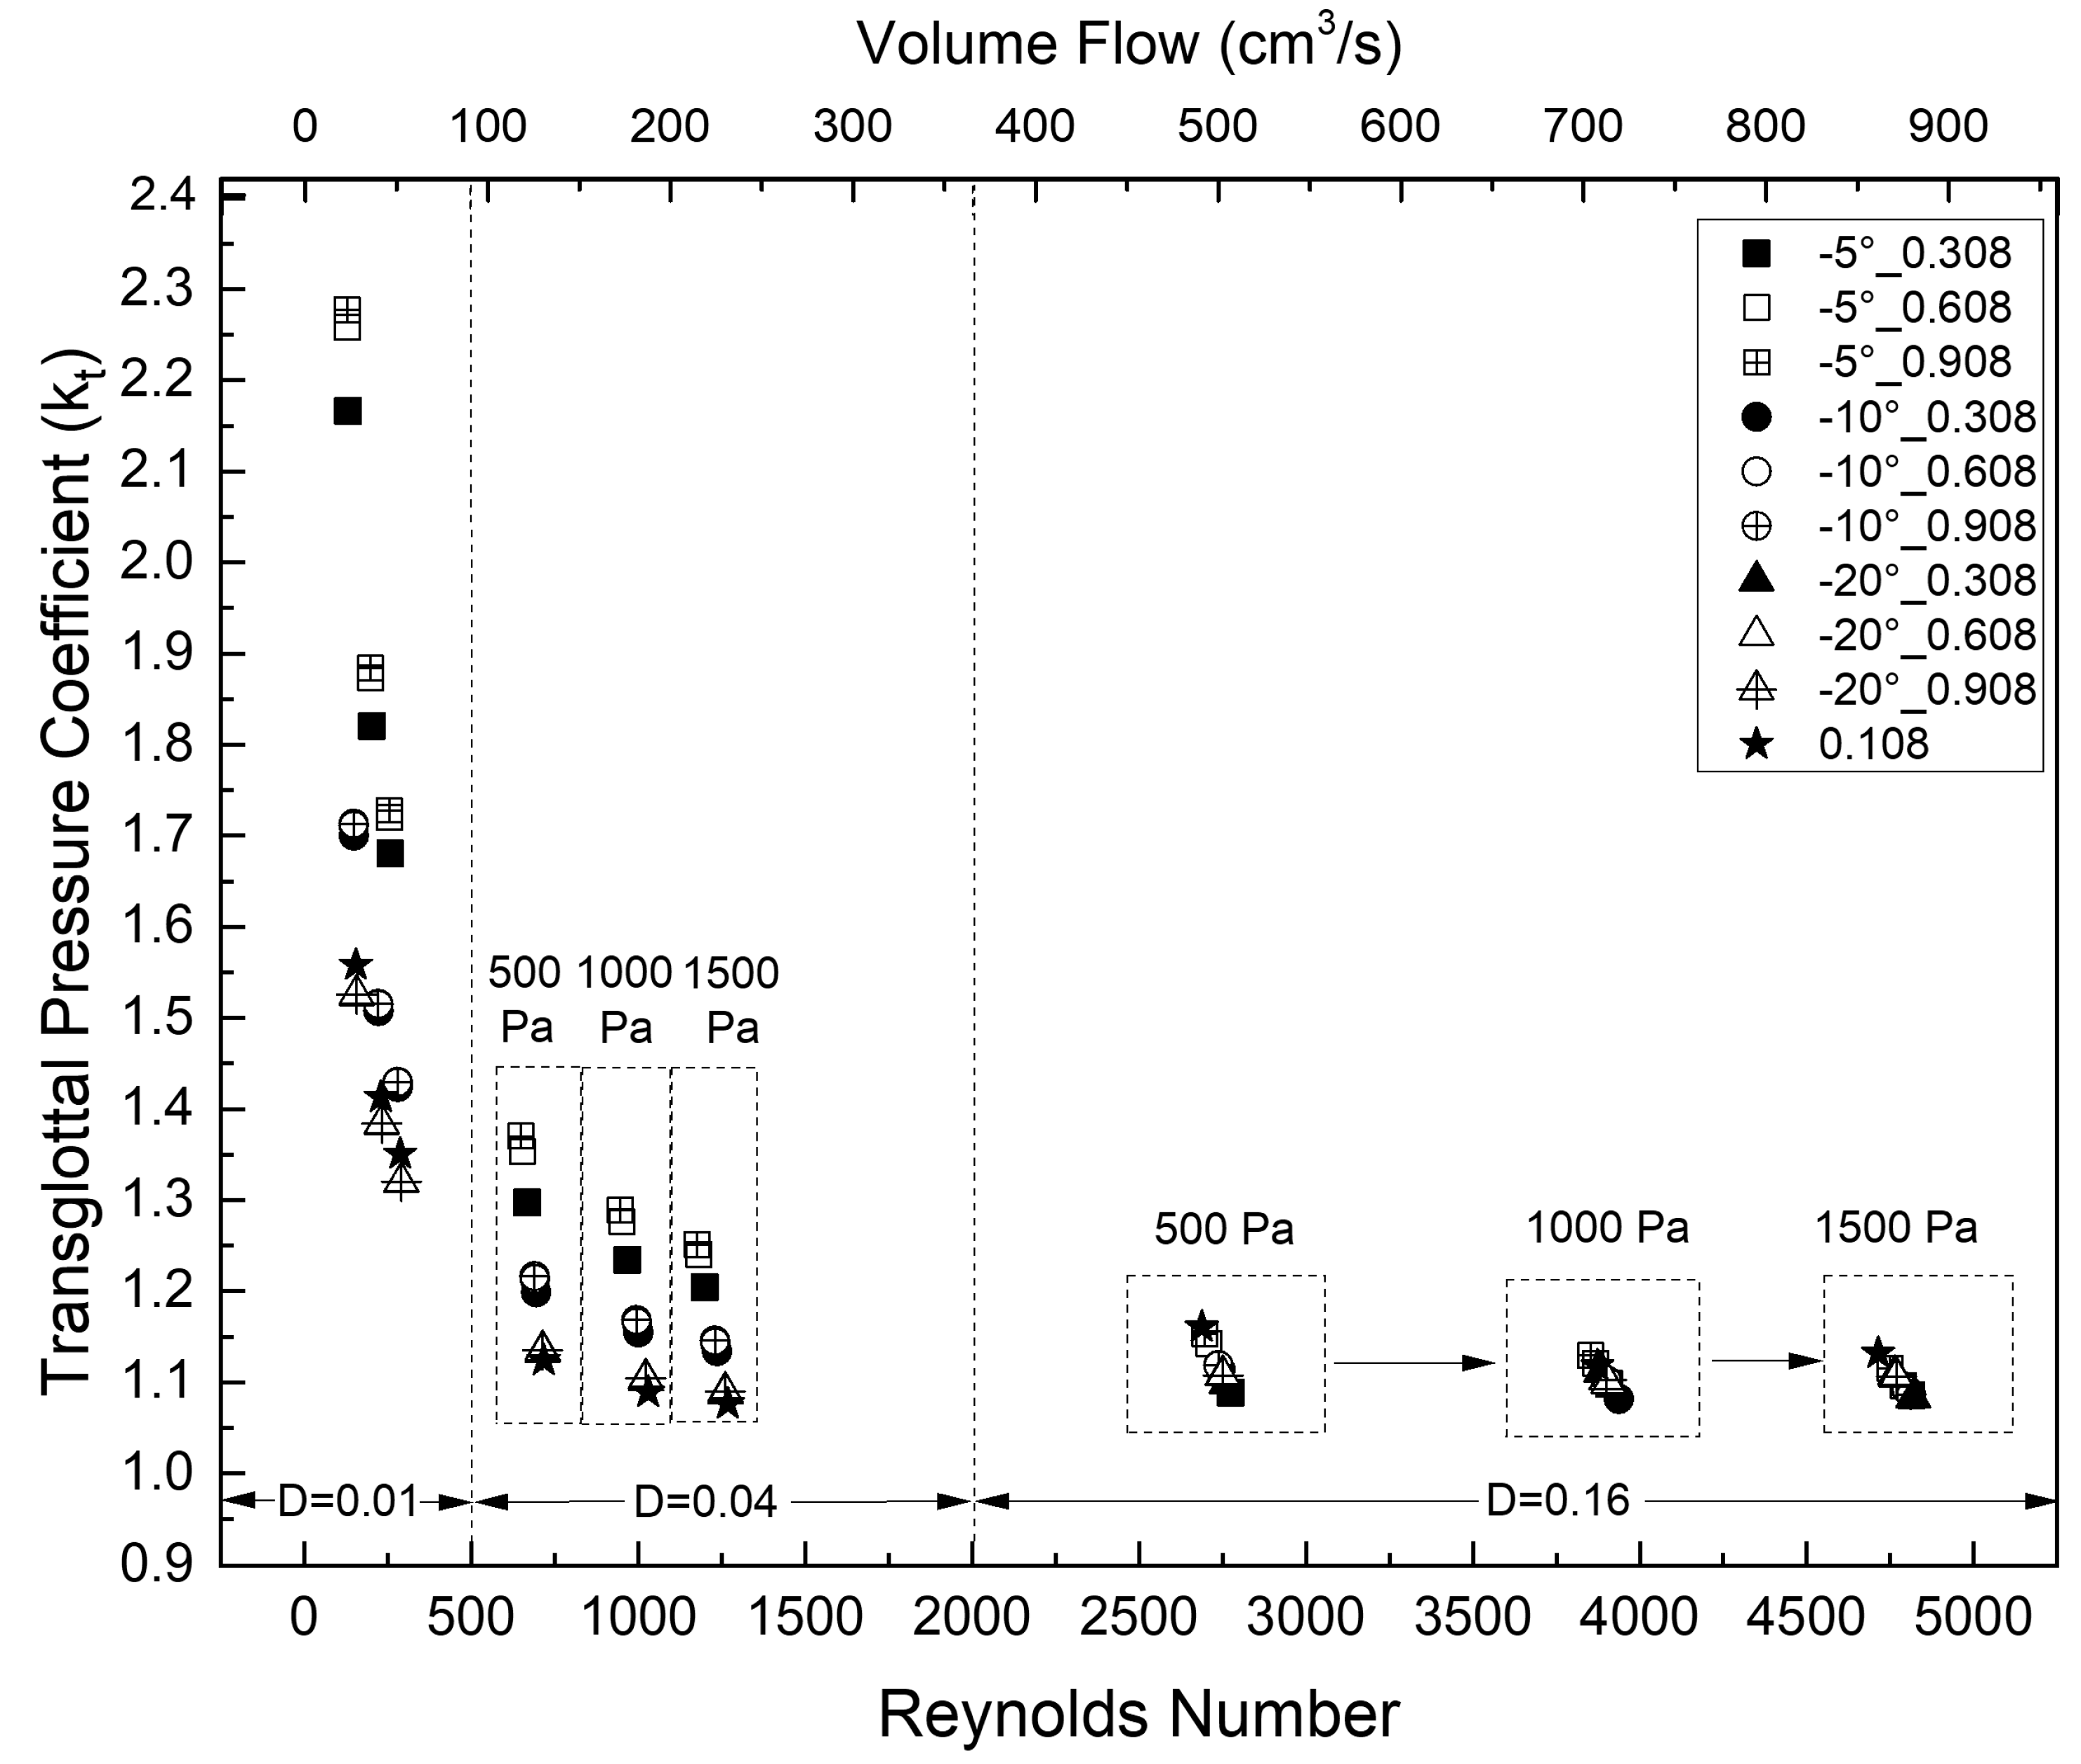
Figure 8 shows the transglottal pressure coefficient values for different vertical glottal duct lengths, glottal diameters, convergent glottal angles, and transglottal pressures. The longest duct (0.908 cm) had the largest transglottal pressure coefficient values when the convergent angle was smallest (−5°).
The value of kt was significantly higher for the smallest diameter (0.01 cm) compared to the other diameters, ranging from approximately 1.3 to 2.3 across the convergent angles, duct lengths, and transglottal pressures, with values decreasing within that range as the convergent angle increased or the transglottal pressure increased. For that diameter, the longest duct (0.908 cm) also had the lowest values, which were for the largest convergent angle of −20°.
The minimal glottal diameter is a major factor for the transglottal pressure coefficient. For any glottal convergent angle, vertical glottal duct length, and transglottal pressure, decreasing the minimal glottal diameter increased the transglottal pressure coefficient value. For example, kt increased from 1.15 to 1.37 and then to 2.28 for minimal diameters of 0.16 cm, 0.04 cm, and then 0.01 cm, respectively, for the −5° glottal angle, 0.908 cm duct length, and 500 Pa transglottal pressure condition. The transglottal pressure coefficient kt also tended to slightly increase as the duct length increased. For example, kt increased from 1.09 to 1.15 (an increase of 5.5%) when the duct length increased from 0.308 to 0.908 cm for the −5° glottal angle, 0.16 cm minimal diameter, and 500 Pa transglottal pressure. If the 0.01 cm minimal diameter is chosen for those conditions, the kt value increased from 2.17 to 2.28, or 5.1%.
3.6. Intraglottal Velocity Distributions
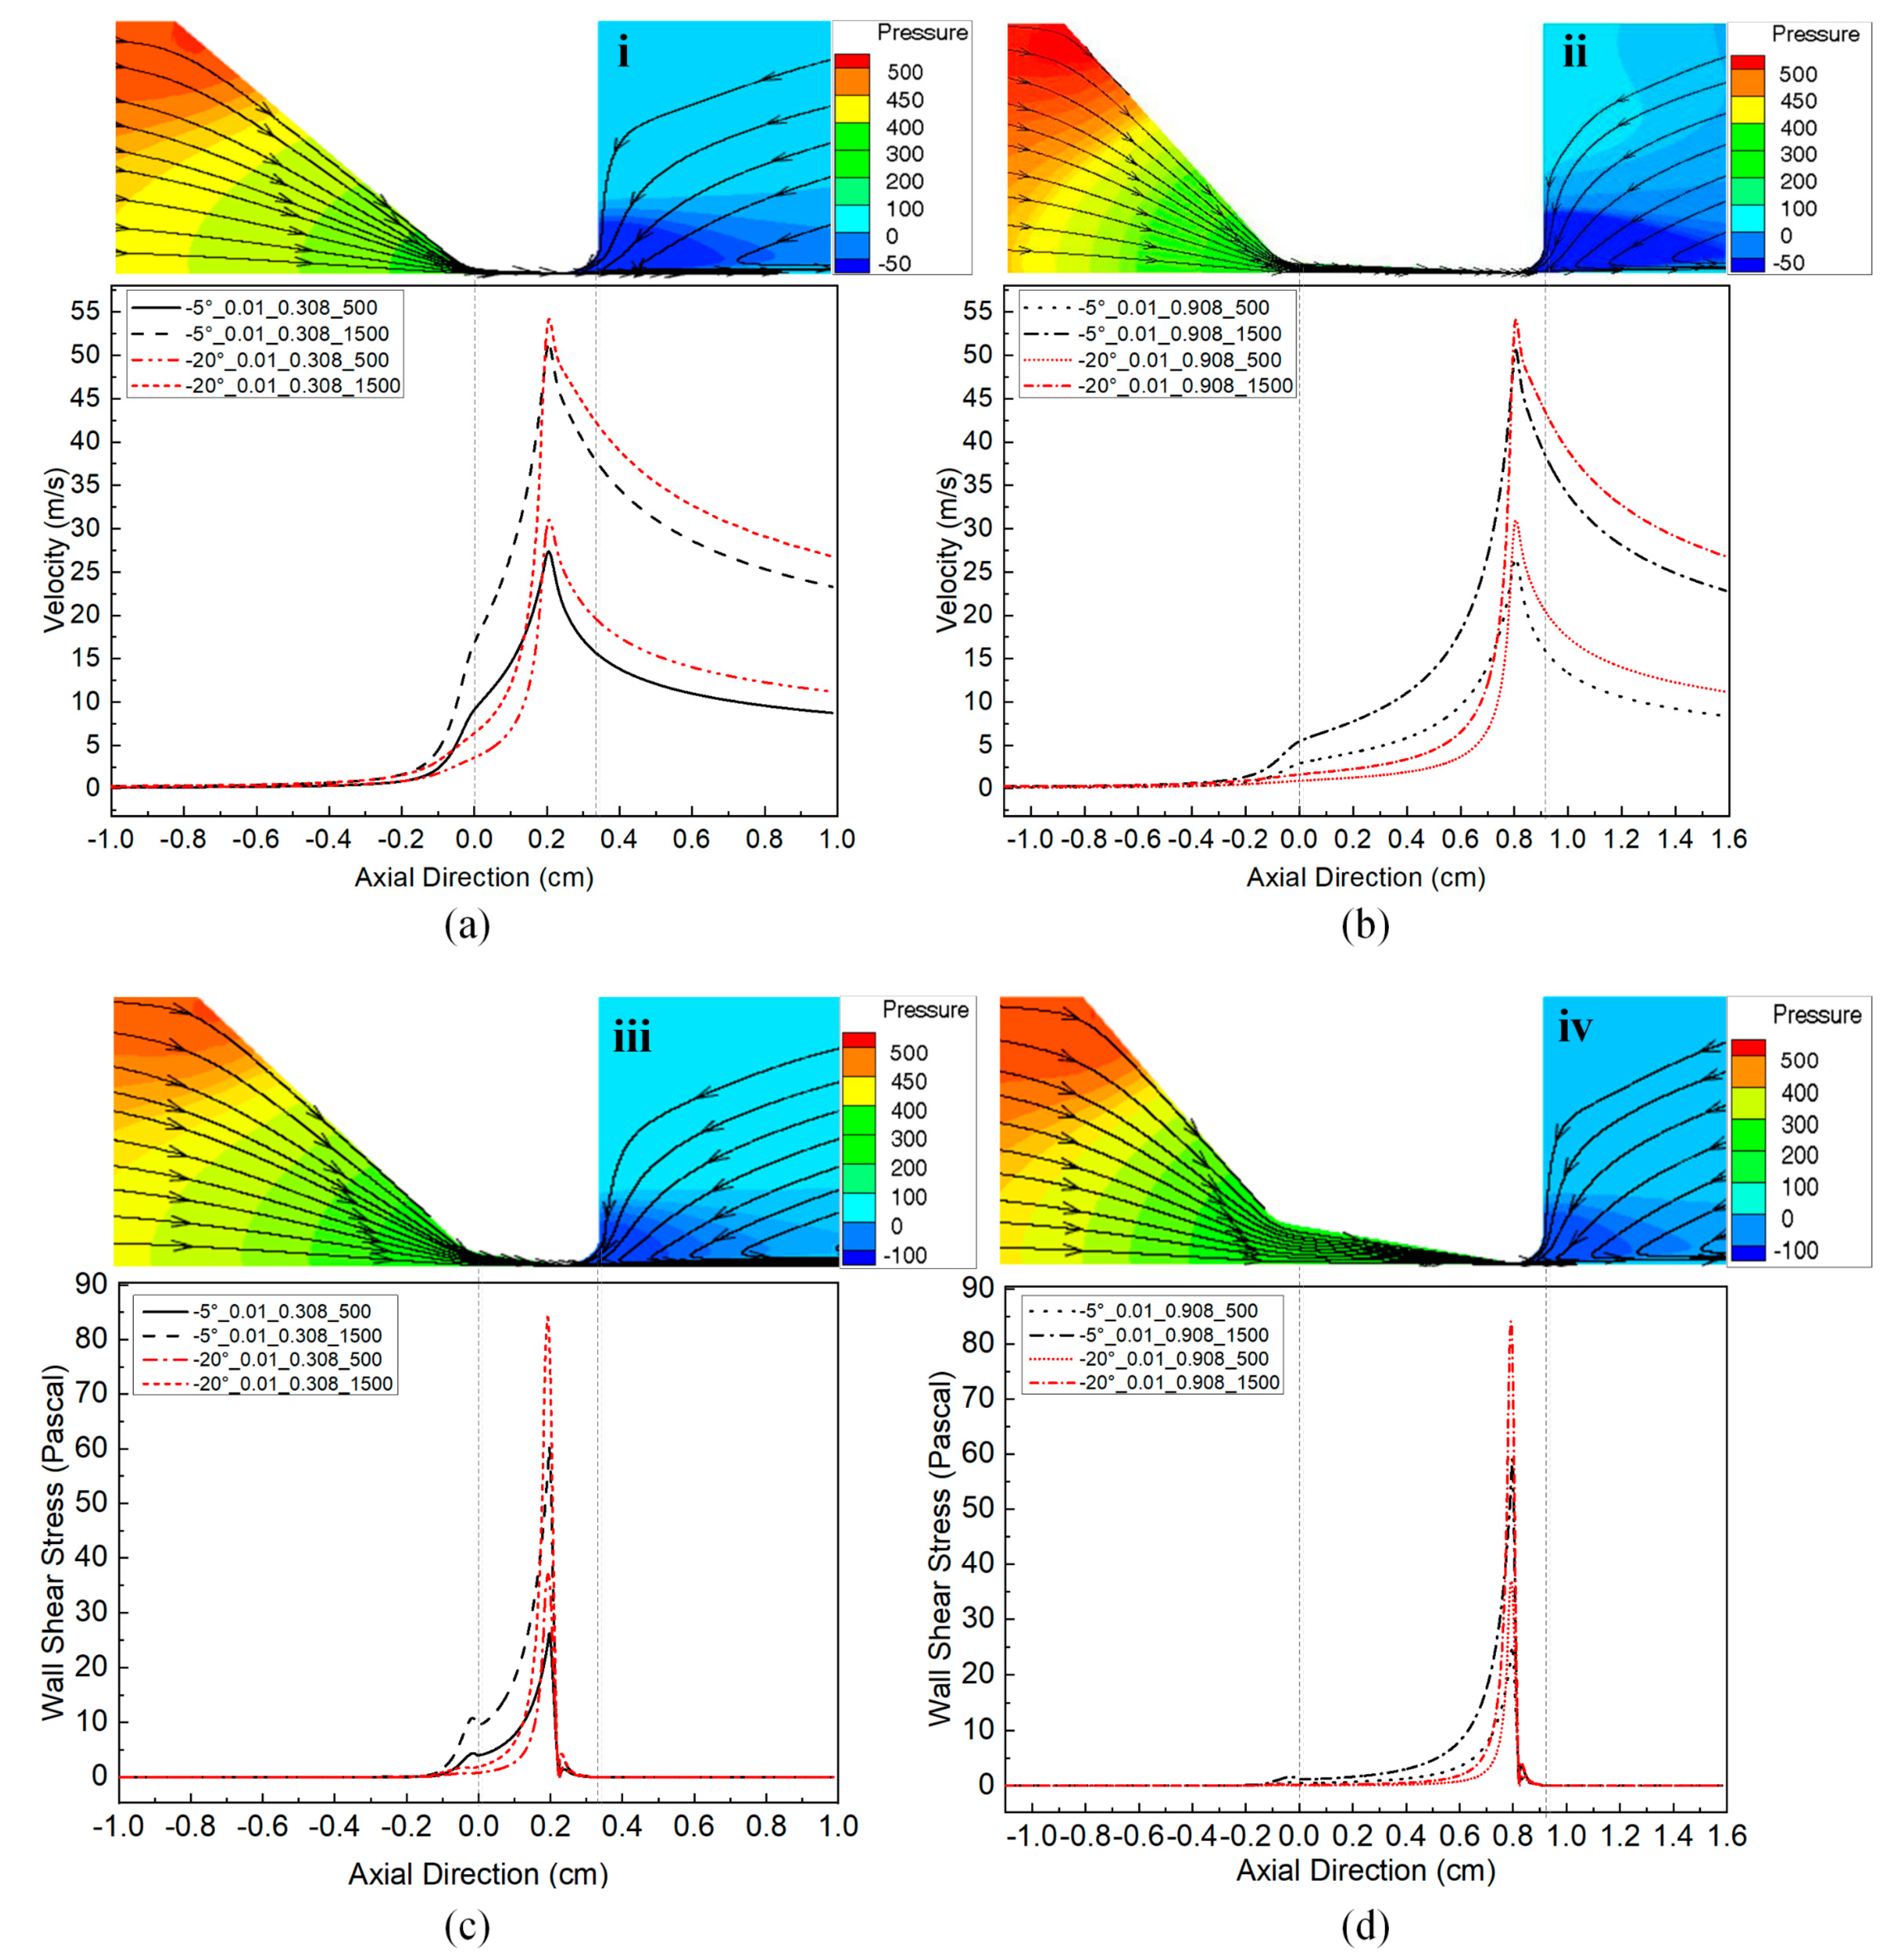
Figure 9 shows the schematic of the glottal configurations as well as the velocity vector streamtraces and the red-to-blue contour levels of intraglottal pressures (the upper portion of each small figure), the corresponding velocity magnitude distributions on the centerline of the glottis (
Figure 9a,b), and the corresponding wall shear stress distributions (
Figure 9c,d) for the 0.01 cm minimal glottal diameter for 0.308 cm and 0.908 cm vertical glottal duct lengths. The figure shows results for 500 Pa and 1500 Pa transglottal pressures for −5° and −20° convergent glottal angles (the lower portions of each small figures). It can be seen from
Figure 9a,b that when the convergent glottal angle increases, the larger glottal cross-sectional area at the glottal entrance location results in a slower increase of the flow velocity. This flow velocity, however, will accelerate rapidly and reach peak values close to the location of the smallest diameter. The peak velocity is slightly higher for the larger convergent angle than for the smaller glottal angle cases. Similar results are shown for the longer vertical glottal duct length. It is noted that the peak velocity in
Figure 9a,b of approximately 55 m/s is a Mach number of approximately 0.16, suggesting effectively incompressible flow.
In
Figure 9a,b, the increase of the transglottal pressure also results in a relatively fast increase of the flow velocity and causes a higher peak value. For example, the velocity peak increases from 27.21 to 51.52 m/s (an increase of 89.34%) when the transglottal pressure increased from 500 Pa to 1500 Pa for the −5° glottal angle, 0.01 cm minimal diameter, and 0.308 cm vertical glottal duct length. The peak velocities were quite similar between the cases for 0.308 and 0.908 cm duct lengths, suggesting that the peak velocity was dependent on the minimal glottal diameter and the transglottal pressure rather than vertical glottal duct length and glottal angle.
The faster increase of flow velocity in the convergent glottis caused a more rapid increase of wall shear stress; the larger the convergent glottal angle or the higher the transglottal pressure, the faster the wall shear stress increased, as shown in
Figure 9c,d. The shear stress is similar for both vertical duct lengths (0.308 cm and 0.908 cm) and thus is dependent more on the constriction size and location than on the vertical glottal duct length. It is noted, however, that the largest shear stress value of this study, approximately 85 Pa, is only 6% of the 1500 Pa that created it, so the shearing effect may be relatively small.
4. Discussion
The longer vertical glottal duct length caused by short vocal folds (low cricothyroid muscle contraction), higher levels of vocalis muscle contraction (to promote bulging), or greater excursion of vocal fold motion (via higher levels of subglottal pressure) should result in a more rectangular glottal shape, whereas a short vertical glottal duct length is caused by relatively high levels of cricothyroid muscle contraction (and for high falsetto, minimal activity of the vocalis muscle) and lower subglottal pressures, resulting in a more convergent glottal shape [
8,
35]. Thus, the vocal fold contour, glottal length, and glottal angles may vary over a wide range, even during conversational speech, as prosody changes follow the coordination of cricothyroid muscle contraction, vocalis muscle contraction, and subglottal pressure. In addition, as the size of the larynx increases developmentally and differs by sex post-puberty, the vertical length of the glottis should be longer for larger larynxes. This study suggests that vertical glottal duct length is an important variable that is part of the governing of intraglottal pressures during phonation. In general, an increase of the vertical glottal duct length should increase the intraglottal aerodynamic forces acting to separate the vocal folds during glottal opening and increase the entrance loss coefficient (
ke) for minimal glottal diameters smaller than 0.04 cm for the convergent glottis. The results also suggest that a change of the vertical glottal duct length appears to have only small effects on the exit coefficient (
kex), transglottal pressure coefficient, volume flow, and tangential forces that act upon the vocal folds.
The basic changes of the intraglottal pressure and the transglottal pressure coefficient with changes of the glottal minimal diameter, transglottal pressure, and the convergent glottal angle were consistent with prior modeling work with model M5. For example, both the entrance loss coefficient and the exit coefficient tend to decrease as the transglottal pressure increases and as the minimal diameter increases for convergent glottal angle cases [
29]. In addition, the transglottal pressure coefficient increases greatly as diameter and flow decrease (consistent with Scherer and Guo [
36,
37] and Fulcher et al. [
29]).
The four parameters studied in this paper—vertical glottal duct length, glottal minimal diameter, convergent glottal angle, and transglottal pressure—have complex and integrated effects on intraglottal aerodynamic parameters.
Table 3 shows the effects of these parameters on intraglottal aerodynamics. In general, compared to the other parameters, glottal minimal diameter has the greatest effect on the aerodynamic parameters. For some conditions, the change of minimal diameter may also synchronously increase (or induce) the effects of other parameters onto the aerodynamic parameters, thus creating complex integrated effects. For example, glottal angle and transglottal pressure have fewer effects on
kt and
ke when the minimal diameter is larger than 0.04 cm (and Reynolds number is larger than 500, especially larger than 2000), but these effects are induced (increased) for minimal diameters smaller than 0.04 cm (Reynolds number less than 500 conditions). Another example is the volume flow; the transglottal pressure has a small effect on volume flow for small minimal diameters but large effects on the flow for the larger (0.16 cm) minimal diameter (the volume flow increased by 74% when the transglottal pressure increased from 500 Pa to 1500 Pa). The effects of the vertical glottal duct length on the glottal aerodynamic parameters are smaller than those of the minimal glottal diameter but larger than those for the convergent glottal angle and transglottal pressure.
The results of this study appear to provide partial support for the equation for the phonatory threshold pressure, PTP, given by Titze [
6],
where
is the transglottal pressure coefficient [
37,
38,
39],
B is the damping factor for motion of the vocal fold,
is the speed of the mucosal wave,
is the glottal length (anterior-posterior direction),
is the glottal thickness (inferior-superior direction, the same as the vertical glottal duct length),
is the prephonatory inferior glottal half-width, and
is the prephonatory superior glottal half-width. In the study reported here, it was found that as the length of the vertical glottal duct increased, there was greater pressure applied to longer portions of the medial vocal fold surfaces from the glottal entrance, thus adding pressure to separate the vocal folds during glottal opening. This should be consistent with lowering the PTP value, as indicated by Equation (5), although it is recognized that the greater pressure may act against a greater mass. Increasing the minimal diameter in this study (equivalent to increasing
ξ02) reduced the intraglottal pressures, which should then tend to increase the PTP for phonation, which is contradicted by Equation (5). Equation (5) also predicts that increasing the convergent glottal angle should increase the PTP value. However, in this study, increasing the convergent angle increased the intraglottal pressures, which should tend to reduce the PTP value. Previous studies also found that there are both negative and positive relations between vocal fold thickness and phonation threshold pressure. Chan et al. (1997) [
26] found that a higher PTP was always obtained for a thinner vocal fold. They also found that PTP is lowest for the divergent glottis and highest for the convergent one. Yu Zhang (2005) [
24] also predicted that increases in vocal fold adduction and vocal fold thickness would decrease PTP. However, in a continuum vocal fold model study, Zhang (2010) [
28] showed that an increase in the medial surface thickness reduced the coupling strength and therefore led to increased phonation threshold pressure, which contradicts the prediction of Equation (5) and experimental observation by Chan et al. (1997) [
26]. In their two-layer physical model experimental study, Mendelsohn and Zhang (2011) [
27] further declared that a lower PTP can be achieved by reducing medial surface thickness or increasing the cover-layer depth. Overall, as pointed out in Zhang (2010) [
28], this seeming contradiction is “likely due to the multivariable dependence of phonation threshold”. The variety of values of other vocal fold properties (geometry, body-cover stiffness ratio, etc.) may not only vary the vocal fold thickness but also may have different or even opposite influence on the phonation threshold pressure. Further theory and experimental studies are needed to clarify these discrepancies.
The numerical model in this study used some simplifying assumptions that can be considered as limitations. This study is for static glottal geometries rather than dynamic modeling, and thus we ignored mass changes, stiffness changes, three-dimensional morphology changes, and muscle contraction changes that accompany changes of the glottal duct length. From a contour point of view, this study did not take into consideration covariation of vertical glottal duct length with changes in the anterior-posterior length of the vocal fold (held constant in this study at 1.2 cm). The increase of the vertical glottal duct length also may have resulted in medial bulging of the vocal fold or altered the inlet and outlet radii of the vocal fold geometry, which were held constant in this study. This study also assumed that the pressure profile along the anterior-posterior length of the vocal fold is constant, which is not consistent with the finding that the intraglottal pressure varies somewhat along the anterior-posterior direction due to three-dimensional flow effects [
43,
47]. It is also noted that contraction of the vocalis and cricothyroid muscles for changing the glottal duct length may vary the ant-post stiffness of the vocal fold, which is an important factor in determining the PTP and cannot be studied with static models.
The convergent glottal shape occurs during glottal opening, when the vocal folds are separating. The results of this study may give some indication of the intraglottal pressure magnitudes and effects during the glottal opening phase that drive the vocal folds to separate, assuming the quasi-steady assumption is maintained. The sequence of
Figure 2(a-iv,c-ii,d-vi) is the sequence for a vertical glottal duct length of 0.308 cm, a diameter increase of 0.01 cm to 0.04 cm to 0.16 cm, and a convergent glottal angle of −5° to −10° to −20°. That is, as the glottis opens, here it is assumed that as the vocal folds separate, the convergent glottal angle increases. The mentioned figures show that the pressures in the glottis are the greatest for the first configuration, less for the second, and least for the third. This decreasing pressure to move the vocal folds outward would be countered by the increasing recoil forces to bring the vocal folds back to the equilibrium position, eventually creating a maximum vocal fold excursion before the closing phase of the glottis begins. These results are consistent with pressure exchanges during a cycle of phonation shown in Figures 11–15 in Scherer (2017) [
48] for a three-mass model whose intraglottal driving pressures were obtained empirically from physical model M5.
5. Conclusions
In an earlier study, the vertical glottal duct length played an important role in determining intraglottal aerodynamic parameters for the uniform glottal angle [
7]. This study continues the examination of the effects of the length of the vertical convergent glottal duct on the transglottal and intraglottal pressures. The computational fluid dynamics code Fluent was used (for laminar, incompressible flow). Four vertical glottal duct lengths (0.108, 0.308, 0.608, 0.908 cm) were studied for three glottal minimal diameters (0.01, 0.04, 0.16 cm), three transglottal pressures (500, 1000, 1500 Pa), and three glottal angles (−5°, −10°, −20°). The results suggest that the vertical glottal duct length has significant effects on glottal aerodynamic parameters:
(1) A longer vertical glottal duct length increases the intraglottal pressures, causing greater aerodynamic forces that act upon the vocal fold medial surfaces, and more so for smaller glottal minimal diameters. (2) The vertical glottal duct length typically has a direct relation to the glottal entrance loss coefficient (ke). (3) For the smallest diameter, the entrance loss coefficient was the largest, and the coefficient value decreased as the Reynolds number or convergent glottal angle increased. (4) The transglottal pressure coefficient is somewhat increased as the vertical glottal duct length is increased, especially for low flows and small glottal minimal diameters. (5) The transglottal pressure coefficient was largest for the smallest diameter, ranging between approximately 1.1 and 2.2, and decreased as the diameter or Reynolds number increased. (6) Compared to other parameters such as the glottal minimal diameter, transglottal pressure, and the convergent glottal angle, the vertical glottal duct length has only small effects on the exit coefficient and volume flow. (7) A longer vertical glottal duct length results in a less abrupt increase of both the intraglottal flow velocity and the wall shear stress along the vertical glottal duct.
The results of this study suggest that current mathematical and physical models of glottal aerodynamics should take into consideration the vertical glottal duct length, especially under different conditions of normal voicing. For example, the chest voice (or modal register) corresponds to having a relatively long vertical glottal duct length, and the falsetto voice corresponds to having a relatively short vertical glottal duct length. The results are relevant to surgical interventions (reconstruction, injection, thyroplasty) of the vocal fold, where a longer glottal duct may be advantageous for a normal phonation threshold pressure, mucosal wave, and source acoustics, and are also relevant to why vocal fold atrophy may result in a shorter glottal duct and a higher phonation threshold pressure.


