Abstract
Background: In this study, an automatic scoring system for the functional movement screen (FMS) was developed. Methods: Thirty healthy adults fitted with full-body inertial measurement unit sensors completed six FMS exercises. The system recorded kinematics data, and a professional athletic trainer graded each participant. To reduce the number of input variables for the predictive model, ordinal logistic regression was used for subset feature selection. The ensemble learning algorithm AdaBoost.M1 was used to construct classifiers. Accuracy and F score were used for classification model evaluation. The consistency between automatic and manual scoring was assessed using a weighted kappa statistic. Results: When all the features were used, the predict model presented moderate to high accuracy, with kappa values between fair to very good agreement. After feature selection, model accuracy decreased about 10%, with kappa values between poor to moderate agreement. Conclusions: The results indicate that higher prediction accuracy was achieved using the full feature set compared with using the reduced feature set.
1. Introduction
The functional movement screen (FMS) is a screening tool widely used by sports medicine practitioners to evaluate fundamental movement patterns in competitive athletes at risk of but not currently experiencing signs or symptoms of musculoskeletal injury. The FMS comprises seven tests that require both mobility and stability for successful completion, namely deep squat, hurdle step, in-line lunge, shoulder mobility, active straight leg raise, trunk stability pushup, and rotary stability. Each test is scored on a scale of 0–3 points according to quality of movement, with a maximum total composite score of 21 [,,,]. When the total score is fewer than 14 points, injury risk increases by a factor of 2.74 (95% confidence interval 1.70–4.43) []. Similar to other fitness tests, the FMS must be manually administered and scored by professionally trained individuals [], challenging its wide implementation in gyms, sports studios, and other settings. In the present study, inertial measurement unit (IMU) sensors were used to record the movement data of participants performing six FMS tests. Artificial intelligence (AI) was used to perform automatic movement screening.
With advancements in science and technology, small, compact, portable, low-cost, multifunctional wearable sensors play increasingly important roles in the sports and medical fields. These sensors allow the acquisition of real-time movement data for analysis. IMUs are typically equipped with a three-axis gyroscope and accelerometer. Their applications include observing the movement patterns of athletes or the gait patterns of patients with a stroke [,]. IMU sensors have been used as movement indicators in studies of one-leg squat movements [], weight training [], running fatigue [], walking status [], skiing [], and tennis [], all of which indicated high correlations between IMU sensor signals and movement performance. However, in a 2014 study by Whiteside et al., discrepancies were observed between automatic FMS scoring (achieved with 17 IMU full-body sensors) and manual scoring []. These differences may be attributable to the use of a self-set kinematics threshold for FMS scoring; whether this threshold is objective for each test remains questionable. Various kinematic parameters have been applied in other studies on FMS assessment, (e.g., []), including the excursion angle of the limb relative to any plane (in degrees), whether the limb is aligned or passes through a certain plane, and the displacement or minimum distance between various landmarks (in cm). To simplify system analysis, in the present study, the quality of physical movement was considered based on mobility and stability, the essential elements of the FMS. Mobility, defined as the “ability of an individual to initiate, control, or sustain active movements of the body to perform motor tasks”, is essential for achieving sufficient range of motion (ROM). Stability, defined as the “ability to actively control one’s body within a limit of range”, refers to the degree of control over a movement []. Furthermore, to realize the objective of developing an automatic FMS system, no specific upper or lower ROM thresholds were set for either mobility or stability. The automated score results generated using AI were compared with manual scores for verification of classification accuracy.
AI involves various modeling methods, each with its own advantages, disadvantages, and suitable application areas. The size of the training data set and the number and type of parameters all affect the selection of the most suitable model []. The establishment of a good classification model is crucial []. In machine learning, an ensemble model denotes a single predictive model composed of submodels. Ensemble models often perform better than any single classifier. Numerous ensemble learning methods, including boosting [], bagging [], and stacking [] have been investigated. The purpose of the present study was to develop a boosting ensemble machine learning method, in which score and ROM are the dependent and independent variables, that assesses movement dysfunction by automatically detecting movement deviations during the FMS test from ROM data collected by IMU sensors.
Although sufficiently large data input may facilitate the determination of appropriate input combinations for improving outputs, the large number of IMUs measuring full-body movement greatly limits the applicability of wearable devices. To reduce the number of IMUs used for FMS score prediction, we used ordinal logistic regression as feature selection algorithm. After selecting a subset of candidate variables, models were built and validated. The relative change in prediction accuracy was compared to the accuracy using all features. In short, the aim of this study was to develop a highly accurate automatic scoring system with minimal human intervention, establish the optimal combination of prediction parameters, and determine whether the screening accuracy can be maintained after reduction of the number of sensors.
2. Materials and Methods
2.1. Participants
The participants comprised 35 healthy adults (20 men and 15 women, age: 24.9 ± 2.4 years, height: 166.82 ± 9.91 cm, and weight: 60.54 ± 14.35 kg). Individuals who had musculoskeletal diseases or who had experienced trauma of the upper or lower extremities (e.g., fractures) within the past 6 months that caused them pain or prevented them from performing the test normally were excluded. All subjects gave their informed consent for inclusion before they participated in the study. The study was conducted according to the principles of the Declaration of Helsinki, and the protocol was approved by the Institutional Review Board of Kaohsiung Medical University Chung-Ho Memorial Hospital (KMUHIRB-E(I)-20200146, 06/16/2020).
2.2. Experimental Equipment and Instruments
BoostFix 6-axis IMU sensors (Compal Electronics Inc., Taipei city, Taiwan) were used to measure the kinematic data for each limb. The corresponding BoostFix smartphone application was used to calculate the movement angle of each joint. According to the manufacturer’s specs, the BoostFix sensor measurement angle error was less than ±1° []. As shown in Figure 1, the 11 sensors were placed on the forehead, chest, sacrum, and the midpoints of the left and right upper arm, thigh, calf, and foot. They were positioned in similar orientations such that all were facing the same general direction in a three-dimensional space. Before FMS testing, the participants were asked to hold an A standing pose to calibrate the sensor orientations (by defining the zero angles for each joint). The raw data were entered into a quaternion algorithm to allow conversion of the relative angle changes captured by the sensors into three-dimensional visualizations of joint motion. Table 1 presents the 31 evaluated joint motions.
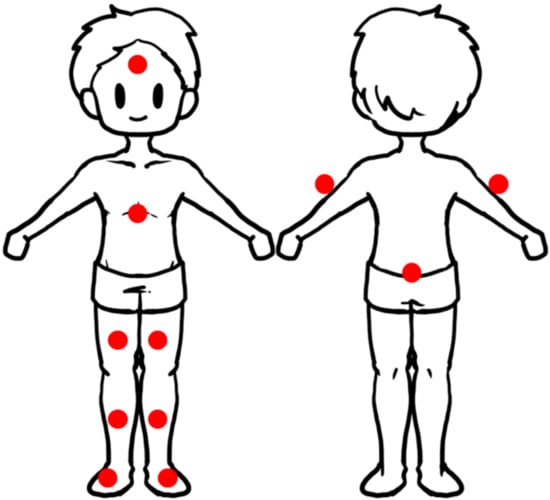
Figure 1.
The placement location of the 11 sensors.

Table 1.
The joint motion measured by the study.
2.3. FMS
The regular FMS comprises seven tests: deep squat, hurdle step, in-line lunge, shoulder mobility, active straight leg raise, trunk stability pushup, and rotary stability. Each test is scored between 0 and 3 points. A score of 3 means the movement is accomplished without compensatory movement. A 2 is given for a movement accomplished with some compensation, and a score of 1 is given for a movement that could not be performed according to the criteria. If pain is noted, the associated test is given a score of 0. Since all the participants were healthy adults, the scores ranged from 1 to 3. Since none of the participants were athletes, no one obtained a score of 3 on the rotary stability test; scores ranged between 1 and 2 points []. In addition, the shoulder mobility test was excluded because it was determined to be less suitable for measurement only by IMU sensors [], as this exercise already involves an objective measurement modality (a ruler) and the scoring standard is related to each person’s hand-length. Manual scoring was conducted by a trained scorer. Each participant performed the six tests (Figure 2) in a random order. In total, each participant performed the bilateral symmetrical exercises (i.e., the deep squat and the trunk stability pushup tests) twice. Each participant performed the bilateral asymmetrical exercises (i.e., the hurdle step, in-line lunge, active straight leg raise, and rotary stability tests) once on each side of the body; the raw score represents the results for the right and left side, respectively. The hurdle step, in-line lunge, straight leg raise, and rotary stability tests were scored from the side of the moving leg, front leg, side of the moving limb, and side of the upper moving limb, respectively. For simplicity, the results are discussed in terms of the scoring and non-scoring sides. For these bilateral asymmetrical exercises, 31 joint motion predictive variables (Table 1) were evaluated. For the two tests (i.e., the deep squat and trunk stability pushup tests) that do not have right and left side scores, we only analyzed the 20 joint motions (Table 1) that excluded the left side data and designated the right side as the scoring side. Finally, we used the FMS score and joint angle data from each test for subsequent model building.
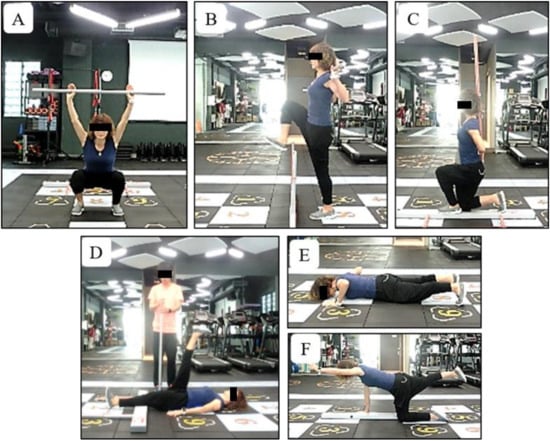
Figure 2.
The functional movement screen exercises appraised in this study. (A) Deep squat; (B) hurdle step; (C) in-line lunge; (D) active straight leg raise; (E) trunk stability push-up; and (F) rotary stability.
2.4. Data Acquisition and Preprocessing
The BoostFix application on the Apple iPhone 6s was used for data collection. After each test was complete, the program saved the data to iTunes and downloaded them to the computer for analysis. The data were entered into Microsoft Excel spreadsheets displaying the angular motion of each joint in each plane. The researcher then calculated the ROM of each joint on each test and recorded the manual scores. The min–max values of the ROM among all the participant’s recordings of the same exercise were also calculated. Prior to modeling, min–max normalization of ROM data was conducted, and the data were scaled to the interval [0, 1].
2.5. Feature Selection and Modeling
The ensemble machine learning algorithm AdaBoost.M1 was used to construct multiclass classifiers with a full set of features or the remaining features of the best predictors. Tenfold cross-validation was applied to the models (k = 10, mfinal = 50, coeflearn = Breiman, and maxdepth = 5) to improve reliability of model selection. To model the classification system, a training dataset of input–output pairs of main-joint ROM values and the manual scores was collected. Initially, nine folds were used for training and one fold was used for validation. The number of cross-validation folds was changed over each of 10 repetitions. This repeated cross-validation was used to estimate any error due to data partitioning. An automatic scoring system was then constructed and used to predict the most appropriate score for each test. To reduce the number of input variables, we used ordinal logistic regression for subset feature selection. Each test selected up to five statistically significant predictors (p < 0.05) into the model. Feature selection and modeling were performed using RStudio Cloud (Version 4.0.2, RStudio, Boston, MA, USA, 2020).
2.6. Model Evaluation
The general confusion matrix for binary classification models was not applicable to most of the tests because the dependent variables were divided into three categories. The methods used to calculate the models’ accuracy, recall rate, precision, and F scores are presented in Table 2 and Equations (1)–(4). In Table 2, actual and predicted class respectively represents the manual scores and model-estimated scores on the joint movement angles. After the multijoint angle values were entered, the algorithm yielded the classification results (scored as 1, 2, or 3). In good classifiers, these parameters should be close to 100%. To simplify the data display, only the accuracy and F scores, calculated by recall rate and precision, are shown. For the rotary stability test, because the dependent variables were only divided into two categories, the general confusion matrix for binary classification was used.
Accuracy = T1 + T2 + T3/(T1 + T2 + T3 + F1 + F2 + F3 + F4 + F5 + F6)
Table 2.
Confusion matrix for three classes.
Recall
Recall1 = T1/(T1 + F4 + F5)
Recall2 = T2/(T2 + F1 + F6)
Recall3 = T3/(T3 + F2 + F3)
Recall2 = T2/(T2 + F1 + F6)
Recall3 = T3/(T3 + F2 + F3)
Precision
Precision1 = T1/(T1 + F1 + F2)
Precision2 = T2/(T2 + F4 + F3)
Precision3 = T3/(T3 + F5 + F6)
Precision2 = T2/(T2 + F4 + F3)
Precision3 = T3/(T3 + F5 + F6)
F-Score = (2 × Precision × Recall)/(Precision + Recall)
2.7. Statistical Analysis
The consistency or level of agreement between automatic and manual scoring was assessed using a weighted kappa statistic, whose values range between −1 and 1. A kappa value of 1 and −1 represented complete agreement and disagreement, respectively. The level of agreement was further evaluated using the scales developed by Fleiss et al. []. Kappa values of <0.20, 0.21–0.40, 0.41–0.60, 0.61–0.80, and >0.80 were defined as poor, fair, moderate, good, and very good agreement, respectively.
3. Results
The average scores for the deep squat, hurdle step, in-line lunge, active straight leg raise, trunk stability pushup, and rotary stability tests, as graded by the professional athletic trainer and the automatic grading system, were 1.83 ± 0.85 and 1.79 ± 0.85, 1.81 ± 0.55 and 1.93 ± 0.43, 2.03 ± 0.48 and 1.96 ± 0.32, 2.33 ± 0.74 and 2.44 ± 0.69, 1.80 ± 0.93 and 1.86 ± 0.95, and 1.61 ± 0.49 and 1.69 ± 0.47 points, respectively (Table 3). Differences in scores were within 1 point, ranging from 0.04 to 0.12. Table 3 shows the number and classification rate for each class.
Table 3.
The average scores of the six functional movement screen (FMS) tests graded by the professional athlete trainer and automatic grading system (mean ± SD) and the number and classification rate in each class.
As demonstrated in Table 4, the Nagelkerke R2 values from the ordinal logistic regression analysis for the deep squat, hurdle step, in-line lunge, active straight leg raise, trunk stability pushup, and rotary stability tests were 82.5%, 18.9%, 44.1%, 78.6%, 40.1%, and 34.3%, respectively. Higher R2 values indicate better goodness of fit. The deep squat and hurdle step tests had the highest and lowest R2 values and were thus the best and worst models, respectively. In addition, the regression models, each of which contained 1–4 variables, determined the best predictor variables for each exercise. Table 4 presents the given subsets of predictor variables in each model. For the deep squat, hurdle step, in-line lunge, active straight leg raise, trunk stability pushup, and rotary stability tests, the best classifiers after feature selection were trained using the reduced feature sets of the selected M = 4 joint angles (shoulder horizontal abduction (S-SHAB), pelvic tilt (PT), scoring side thigh flexion (S-ThF), and trunk rotation (TR); Table 5), the M = 1 joint angle (head rotation (HR)), the M = 1 joint angle (trunk flexion (TF)), the M = 2 joint angle (S-ThF, PT), the M = 2 joint angles (TF and scoring shoulder rotation (S-SR)), and the M = 3 joint angles (non-scoring shoulder rotation (NS-SR), scoring side shoulder flexion (S-SF), and scoring thigh flexion (S-ThF)), respectively. The ROM parameters presented in bold in Table 4 indicate that the regression model coefficients are negative. A negative coefficient suggests that as the value of the independent variable increases, that of the dependent variable decreases as well. A positive coefficient indicates that as the value of the independent variable increases, the mean of the dependent variable also increases. Table 4 also presents the stepwise regression analysis of the ROM data (means ± standard deviations) for all participants who scored 1, 2, or 3 points on each test.
Table 4.
Ordinal logistic regression model of 6 FMS exercises: the selected range of motion variables and their angle values (mean (SD)) in each scoring grade.
Table 5.
The accuracy and F score of the classification, corresponding kappa values, and levels of agreement before feature selection and after feature selection.
As Table 5 shows, the best and worst classification results before feature selection were approximately 91% and 66% in the trunk stability pushup and active straight leg raise tests, respectively. The best and worst classification results after feature selection were approximately 79% and 57% in the in-line lunge and active straight leg raise tests, respectively. Following feature selection, the accuracy of the predictive model was reduced by 2%–20%. The degree of agreement of the deep squat, active straight leg raise, and trunk stability pushup tests dropped from good to moderate, moderate to fair, and very good to moderate, respectively. That of the hurdle step, in-line lunge, and rotary stability tests did not change. Poor classification accuracy was attained in certain score groups with fewer samples; for example, an F score of 0 was noted in the 3-point group for the hurdle step test. Only five participants (7.14%, Table 3) achieved a score of 3 on the hurdle step test, constituting a much lower proportion than that of the other score groups.
4. Discussion
Overall, the prediction accuracy (Table 4) was between 57% and 79% for the reduced feature set, corresponding to 66%–91% of the prediction accuracy achieved when the full feature set was used. It demonstrates that higher prediction accuracy was attained when the full feature set was used. The prediction accuracy for all tests decreased by 2%–20% when the reduced feature set was used.
4.1. In-Line Lunge
In the in-line lunge test, the accuracy achieved by using only one parameter (0.79) did not differ significantly from that achieved by using all of them (0.81; Table 5). TF (Table 4) is a key parameter for which the test can accurately assess whether the execution of this exercise meets the specified criteria. Excessive forward–backward trunk tilt leads to a larger ROM (41.62°) and indicates poor trunk stability (Table 4). We observed that movement quality in this test could be monitored using only one sensor, which provides convenience and reduces testing time considerably in real-world application.
4.2. Deep Squat and Trunk Stability Push Up
The highest accuracy was found for the symmetrical exercises, namely the deep squat and trunk stability pushup tests, with accuracy as high as 0.87 and 0.91 when all parameters were selected. The FMS essentially identifies imbalances in stability and mobility in fundamental movement patterns. After screening by regression analysis, these two tests were both screened out some stability and mobility factors. In the deep squat test, the stability factors were S-SHAB, PT, and TR, and the mobility factor was S-ThF. Excessive range of S-SHAB, PT, and TR indicated instability, whereas insufficient S-ThF indicated insufficient mobility, which is consistent with the findings of a past study [] in which the final thigh position was the completion index of deep squat. For example, 3-point scorers had a greater average thigh flexion (118.5°) than did 1-point scorers (101.34°; Table 4), indicating that they could perform deeper squats. The stability and mobility factors in the trunk stability pushup test were TF and S-SR, respectively. Good performance involves lifting the body as a unit with no lag in the spine; therefore, excessive trunk mobility, including excessive TF, indicates poor posture maintenance. However, some participants could not perform a complete full pushup because of insufficient shoulder rotation mobility. One-point scorers (i.e., poor performers) had a smaller average shoulder rotation ROM than did 3-point scorers (63.37° vs. 88.73°; Table 4).
4.3. Hurdle Step and Active Straight Leg Raise
Head rotation (HR) was the parameter selected for the hurdle step and S-ThF, PT were for active straight leg raise test (Table 4). The main problem that must be considered for the hurdle step test is its high difficulty. Poor stability of the stance leg may increase the difficulty of performing the exercise. Greater HR may be attributable to loss of stability during the exercise, causing the head—the body part farthest from the supporting foot—to shake visibly. In the active straight leg raise test, S-ThF is a key parameter. Whiteside et al. (2014) also demonstrated that peak hip flexion angle is a more sensitive indicator of flexibility in this test []. This finding and the test instruction to raise the scoring leg as high as possible were consistent with those of the present study. In addition, excessive range of PT might be able to, by the compensatory movements of pelvic, achieve more leg raise range.
4.4. Rotary Stability
The parameters selected by the rotary stability test were NS-SR and S-SF for the stability factors and S-ThF for the mobility factors. The test assesses multiplane stability of the pelvis, core, and shoulder girdle during performance of a combined upper- and lower-extremity movement. It represents the coordination of stability and mobility. To obtain a score of 2, the individual must flex the shoulder while extending the opposite-side hip and knee and then bring the elbow to the knee while maintaining spinal alignment with the board on the ground. Our results indicate that in the rotary stability test, 1-point scorers demonstrate obvious instability of the supporting hand on the nondominant side and more shaking of the raised hand on the dominant side, both of which involve larger shoulder ranges of motion. In contrast, instability of the supporting hand would restrict the tested leg ROM. We observed that 1-point scorers had a larger average ROM than 2-point scorers for NS-SR (90.66° vs. 66.37°) and S-SF (99.06° vs. 81.20°) and smaller average ROM for S-ThF (27.74° vs. 36.16°).
4.5. Consistency between Automatic and Manual Scoring
The kappa values between manually and automatically assigned scores for the six tests were computed in this study. A previous study showed only poor to moderate intermethod agreement (kappa coefficients 0.05 and 0.52) []. Their sensor-based semiautomatic system used manual setting kinematic thresholds to correspond to FMS grading criteria. In the present study, the kappa values before feature selection for the trunk stability pushup, deep squat, active straight leg raise, in-line lunge and rotary stability, and hurdle step tests displayed very good, good, moderate, fair, and poor agreement (kw = 0.85, 0.80, 0.42, 0.37 and 0.34, and 0.18), respectively. The overall kappa values were between 0.18 and 0.85, indicating that the machine learning method used to model the kinematic threshold was more accurate than the manual setting. Although we present suitable parameters, because of the large variations in body movement, we recommend using full-body IMU sensors for FMS assessment to obtain the most accurate evaluation.
4.6. Limitation
The test reliability and validity of the FMS and its prediction accuracy for future injury risk remain controversial. Nevertheless, as a movement-based diagnostic system, its theoretical relevance for quantifying movement control ability is indisputable. In view of the possibility of erroneous data labeling, we suggest using unsupervised machine learning (i.e., unlabeled data) for motor skill classification. This approach does not require manual score labeling in advance and allows the model to work independently to discover previously undetected information and data patterns. Thus, the approach maximizes the advantages of AI and helps realize the goal of implementing AI in healthcare.
5. Conclusions
An IMU sensor–based system can potentially be applied to the automatic screening of functional movement. In this study, the results indicate that higher prediction accuracy was achieved using the full feature set compared with using the reduced feature set. Future studies should collect more data and improve machine learning performance to attain more accurate prediction results.
Author Contributions
Conceptualization of the study, W.-L.W., W.-H.H., and H.-T.H.; methodology, software, and validation, W.-L.W., W.-H.H., and H.-T.H.; formal analysis, M.-H.L. and J.-M.L.; investigation and experimental work, M.-H.L. and J.-M.L.; resources, W.-L.W., and H.-T.H.; data curation and statistics, M.-H.L. and J.-M.L.; writing of the original draft preparation, W.-L.W., M.-H.L., and J.-M.L.; writing of review and editing, all authors; visualization, M.-H.L. and J.-M.L.; supervision, W.-L.W., W.-H.H. and H.-T.H.; project administration, W.-L.W. and H.-T.H. All authors have read and agreed to the published version of the manuscript.
Funding
The study was supported by a grant from the NSYSU-KMU Joint Research Project (#NSYSUKMU 109-P016) and the Ministry of Science and Technology (MOST) (#MOST 108-2410-H-037-016). This work was also supported in part by the “Intelligent Manufacturing Research Center” (iMRC) from the Featured Areas Research Center Program within the framework of the Higher Education Sprout Project by the Ministry of Education (MOE) in Taiwan.
Institutional Review Board Statement
The study was conducted according to the guidelines of the Declaration of Helsinki, and approved by the Institutional Review Board of Kaohsiung Medical University Chung-Ho Memorial Hospital (KMUHIRB-E(I)-20200146, 06/16/2020).
Informed Consent Statement
Informed consent was obtained from all subjects involved in the study.
Data Availability Statement
The data presented in this study are available on request from the corresponding author.
Conflicts of Interest
The authors declare no conflict of interest.
References
- Shimoura, K.; Nakayama, Y.; Tashiro, Y.; Hotta, T.; Suzuki, Y.; Tasaka, S.; Matsushita, T.; Matsubara, K.; Kawagoe, M.; Sonoda, T.; et al. Association Between Functional Movement Screen Scores and Injuries in Male College Basketball Players. J. Sport Rehabil. 2019, 1, 1–5. [Google Scholar] [CrossRef] [PubMed]
- Bonazza, N.A.; Smuin, D.; Onks, C.A.; Silvis, M.L.; Dhawan, A. Reliability, validity, and injury predictive value of the functional movement screen: A systematic review and meta-analysis. Am. J. Sports Med. 2017, 45, 725–732. [Google Scholar] [CrossRef] [PubMed]
- Dos Santos Bunn, P.; Rodrigues, A.I.; da Silva, E.B. The association between the functional movement screen outcome and the incidence of musculoskeletal injuries: A systematic review with meta-analysis. Phys. Ther. Sport 2019, 35, 146–158. [Google Scholar] [CrossRef] [PubMed]
- Garrison, M.; Westrick, R.; Johnson, M.R.; Benenson, J. Association between the functional movement screen and injury development in college athletes. Int. J. Sports Phys. Ther. 2015, 10, 21. [Google Scholar] [PubMed]
- Shultz, R.; Anderson, S.C.; Matheson, G.O.; Marcello, B.; Besier, T. Test-retest and interrater reliability of the functional movement screen. J. Athl. Train. 2013, 48, 331–336. [Google Scholar] [CrossRef] [PubMed]
- Caramia, C.; Torricelli, D.; Schmid, M.; Muñoz-Gonzalez, A.; Gonzalez-Vargas, J.; Grandas, F.; Pons, J.L. IMU-Based Classification of Parkinson’s Disease from Gait: A Sensitivity Analysis on Sensor Location and Feature Selection. IEEE J. Biomed. Health Inform. 2018, 22, 1765–1774. [Google Scholar] [CrossRef] [PubMed]
- Wittmann, F.; Held, J.P.; Lambercy, O.; Starkey, M.L.; Curt, A.; Höver, R.; Gassert, R.; Luft, A.R.; Gonzenbach, R.R. Self-directed arm therapy at home after stroke with a sensor-based virtual reality training system. J. Neuroeng. Rehabil. 2016, 13, 75. [Google Scholar] [CrossRef] [PubMed]
- Whelan, D.F.; O’Reilly, M.A.; Ward, T.E.; Delahunt, E.; Caulfield, B. Technology in rehabilitation: Evaluating the single leg squat exercise with wearable inertial measurement units. Methods Inf. Med. 2017, 56, 88–94. [Google Scholar] [PubMed]
- Crema, C.; Depari, A.; Flammini, A.; Sisinni, E.; Haslwanter, T.; Salzmann, S. IMU-based solution for automatic detection and classification of exercises in the fitness scenario. In Proceedings of the 2017 IEEE Sensors Applications Symposium (SAS), Glassboro, NJ, USA, 13–15 March 2017; pp. 1–6. [Google Scholar]
- Buckley, C.; O’Reilly, M.A.; Whelan, D.; Farrell, A.V.; Clark, L.; Longo, V.; Gilchrist, M.D.; Caulfield, B. Binary classification of running fatigue using a single inertial measurement unit. In Proceedings of the 2017 IEEE 14th International Conference on Wearable and Implantable Body Sensor Networks (BSN), Eindhoven, The Netherlands, 9–12 May 2017; pp. 197–201. [Google Scholar]
- Chen, W.-H.; Lee, Y.-S.; Yang, C.-J.; Chang, S.-Y.; Shih, Y.; Sui, J.-D.; Chang, T.S.; Shiang, T.Y. Determining motions with an IMU during level walking and slope and stair walking. J. Sports Sci. 2020, 38, 62–69. [Google Scholar] [CrossRef]
- Rindal, O.; Seeberg, T.; Tjønnås, J.; Haugnes, P.; Sandbakk, Ø. Automatic classification of sub-techniques in classical cross-country skiing using a machine learning algorithm on micro-sensor data. Sensors 2018, 18, 75. [Google Scholar] [CrossRef]
- Whiteside, D.; Cant, O.; Connolly, M.; Reid, M. Monitoring hitting load in tennis using inertial sensors and machine learning. Int. J. Sports Physiol. Perform. 2017, 12, 1212–1217. [Google Scholar] [CrossRef]
- Whiteside, D.; Deneweth, J.M.; Pohorence, M.A.; Sandoval, B.; Russell, J.R.; McLean, S.G.; Zernicke, R.F.; Goulet, G.C. Grading the functional movement screen: A comparison of manual (real-time) and objective methods. J. Strength Cond. Res. 2014, 30, 924–933. [Google Scholar] [CrossRef] [PubMed]
- Philp, F.; Blana, D.; Chadwick, E.K.; Stewart, C.; Stapleton, C.; Major, K.; Pandyan, A.D. Study of the measurement and predictive validity of the functional movement screen. BMJ Open Sport Exerc. Med. 2018, 4, e000357. [Google Scholar] [CrossRef]
- Kisner, C.; Colby, L.A.; Borstad, J. Therapeutic Exercise: Foundations and Techniques, 7th ed.; F.A. Davis: Philadelphia, PA, USA, 2017; p. 82. [Google Scholar]
- Larose, D.T. An introduction to data mining. In Discovering Knowledge in Data; John Wiley & Sons Publication: Hoboken, NJ, USA, 2005; pp. 1–25. [Google Scholar]
- Fayyad, U.M.; Piatetsky-Shapiro, G.; Smyth, P.; Uthurusamy, R. Advances in Knowledge Discovery and Data Mining; AAAI Press: Menlo Park, CA, USA, 1996; Volume 21. [Google Scholar]
- Xiao, F.; Wang, Y.; He, L.; Wang, H.; Li, W.; Liu, Z. Motion estimation from surface electromyogram using adaboost regression and average feature values. IEEE Access 2019, 7, 13121–13134. [Google Scholar] [CrossRef]
- Haider, F.; Salim, F.A.; Postma, D.B.; Delden, R.V.; Reidsma, D.; van Beijnum, B.-J.; Luz, S. A Super-Bagging Method for Volleyball Action Recognition Using Wearable Sensors. Multimodal Technol. Interact. 2020, 4, 33. [Google Scholar] [CrossRef]
- Pustina, D.; Coslett, H.B.; Ungar, L.; Faseyitan, O.K.; Medaglia, J.D.; Avants, B.; Schwartz, M.F. Enhanced estimations of post-stroke aphasia severity using stacked multimodal predictions. Hum. Brain Mapp. 2017, 38, 5603–5615. [Google Scholar] [CrossRef] [PubMed]
- BoostFix User Manual. Available online: https://boostfix.compal-health.com/user_manual.pdf (accessed on 13 December 2019).
- Skotnicka, M.; Karpowicz, K.; Bartkowiak, S.; Strzelczyk, R. The Impact of the Corrective and Stability Exercises Program on the Quality of Basic Movement Patterns among Dance Students. Trends Sport. Sci. 2017, 1, 31–38. [Google Scholar]
- Jensen, U.; Weilbrenner, F.; Rott, F.; Eskofier, B. Sensor-based mobile functional movement screening. In Proceedings of the International Conference on Wireless Mobile Communication and Healthcare, Paris, France, 21–23 November 2012; pp. 215–223. [Google Scholar]
Publisher’s Note: MDPI stays neutral with regard to jurisdictional claims in published maps and institutional affiliations. |
© 2020 by the authors. Licensee MDPI, Basel, Switzerland. This article is an open access article distributed under the terms and conditions of the Creative Commons Attribution (CC BY) license (http://creativecommons.org/licenses/by/4.0/).