Flexural Behavior of a 30-Meter Full-Scale Simply Supported Prestressed Concrete Box Girder


Abstract
1. Introduction
2. Engineering Background and Materials
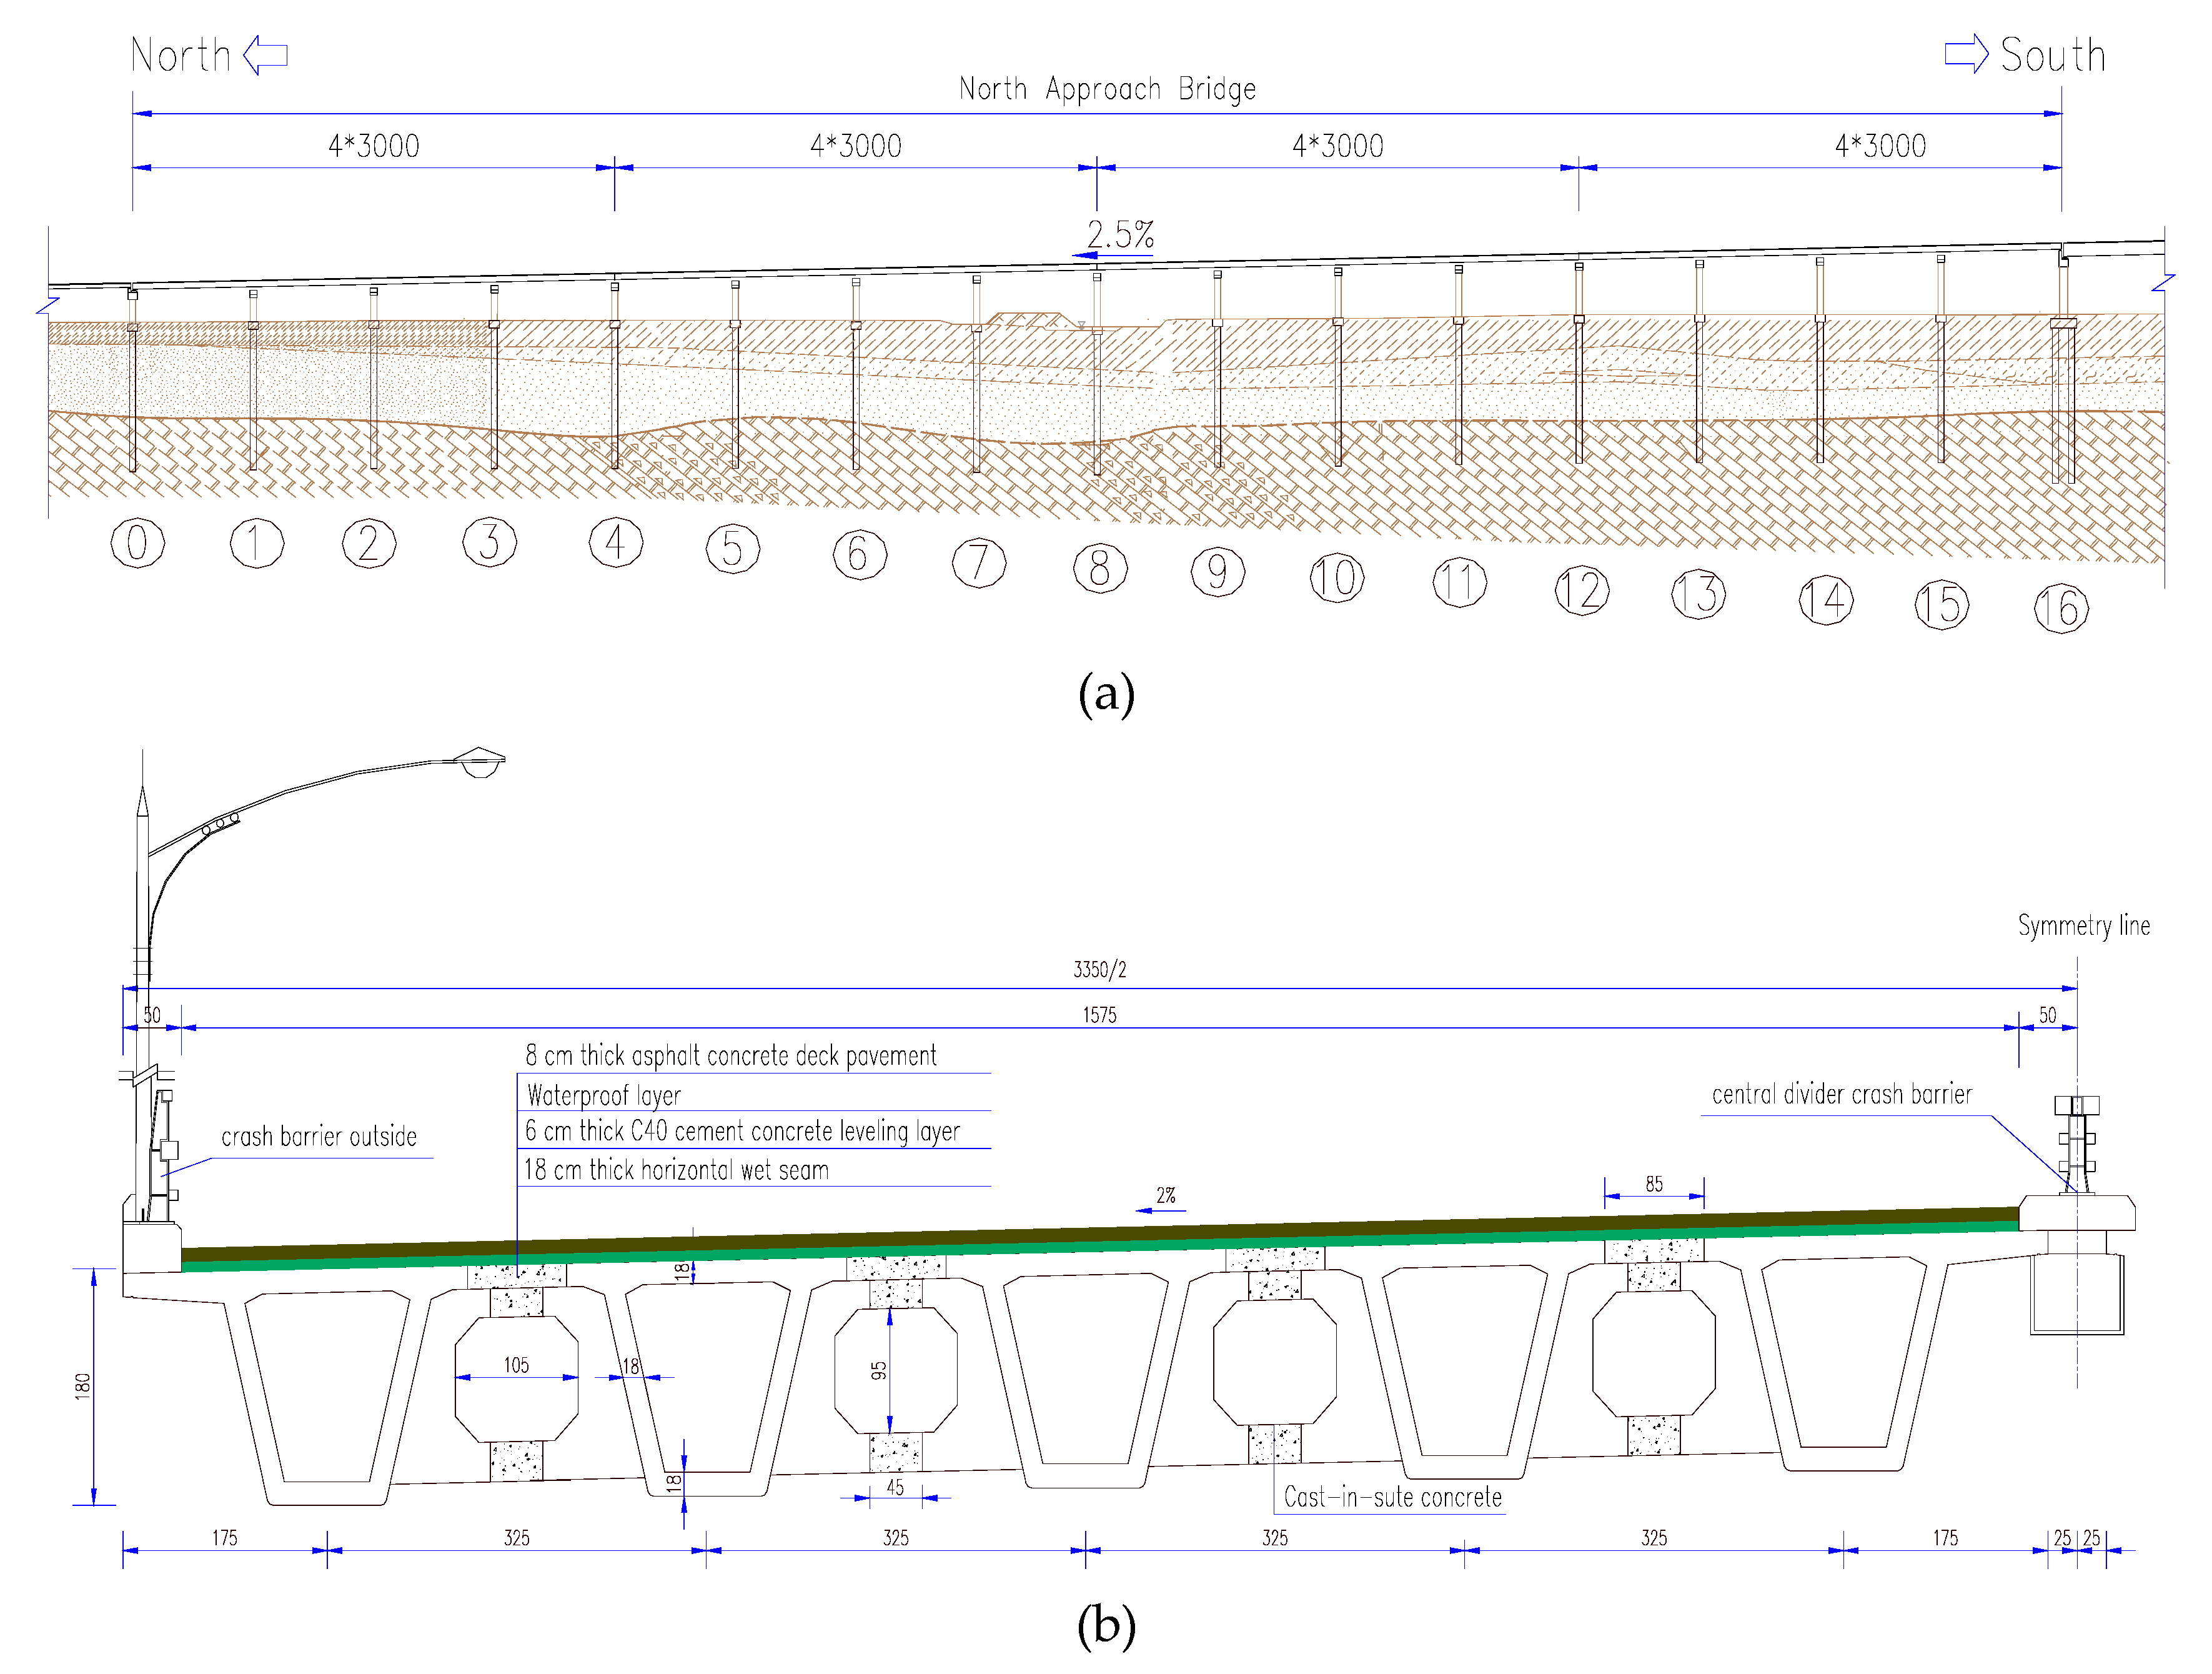
2.1. Details of the Engineering Background
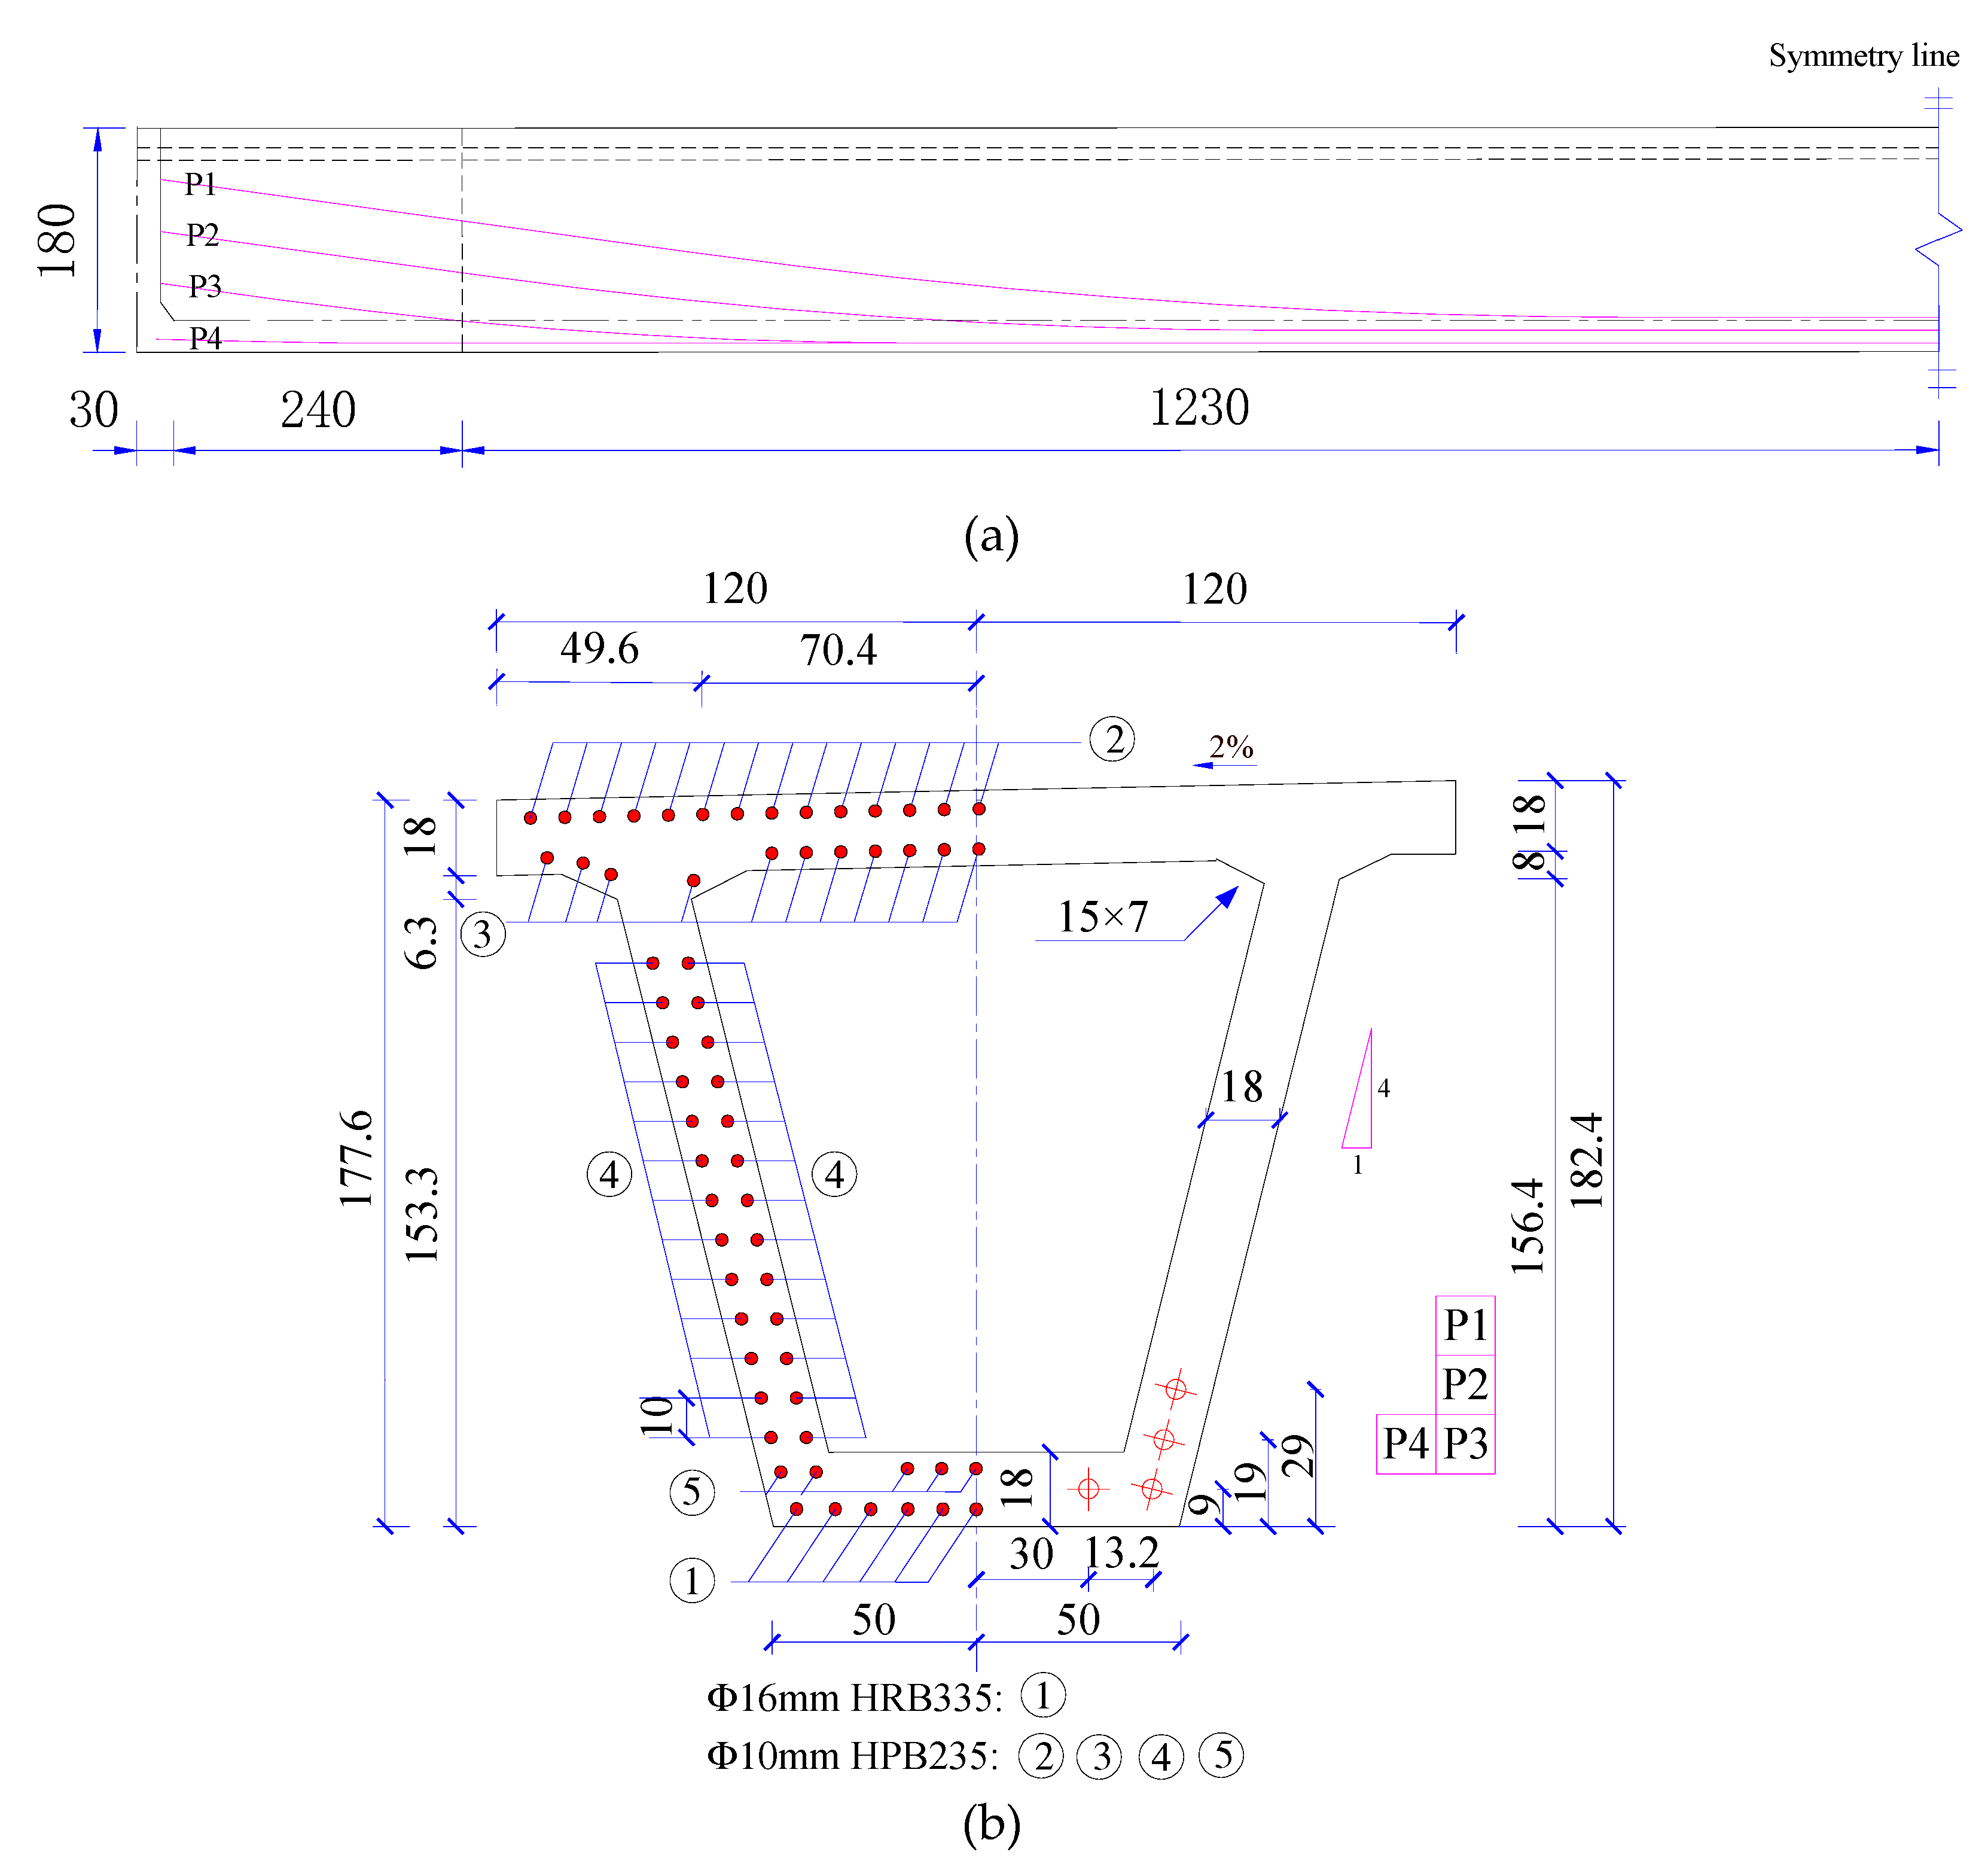
2.2. Details of the Tested Girder
2.3. Material Properties
3. Full-Scale Destructive Experiment
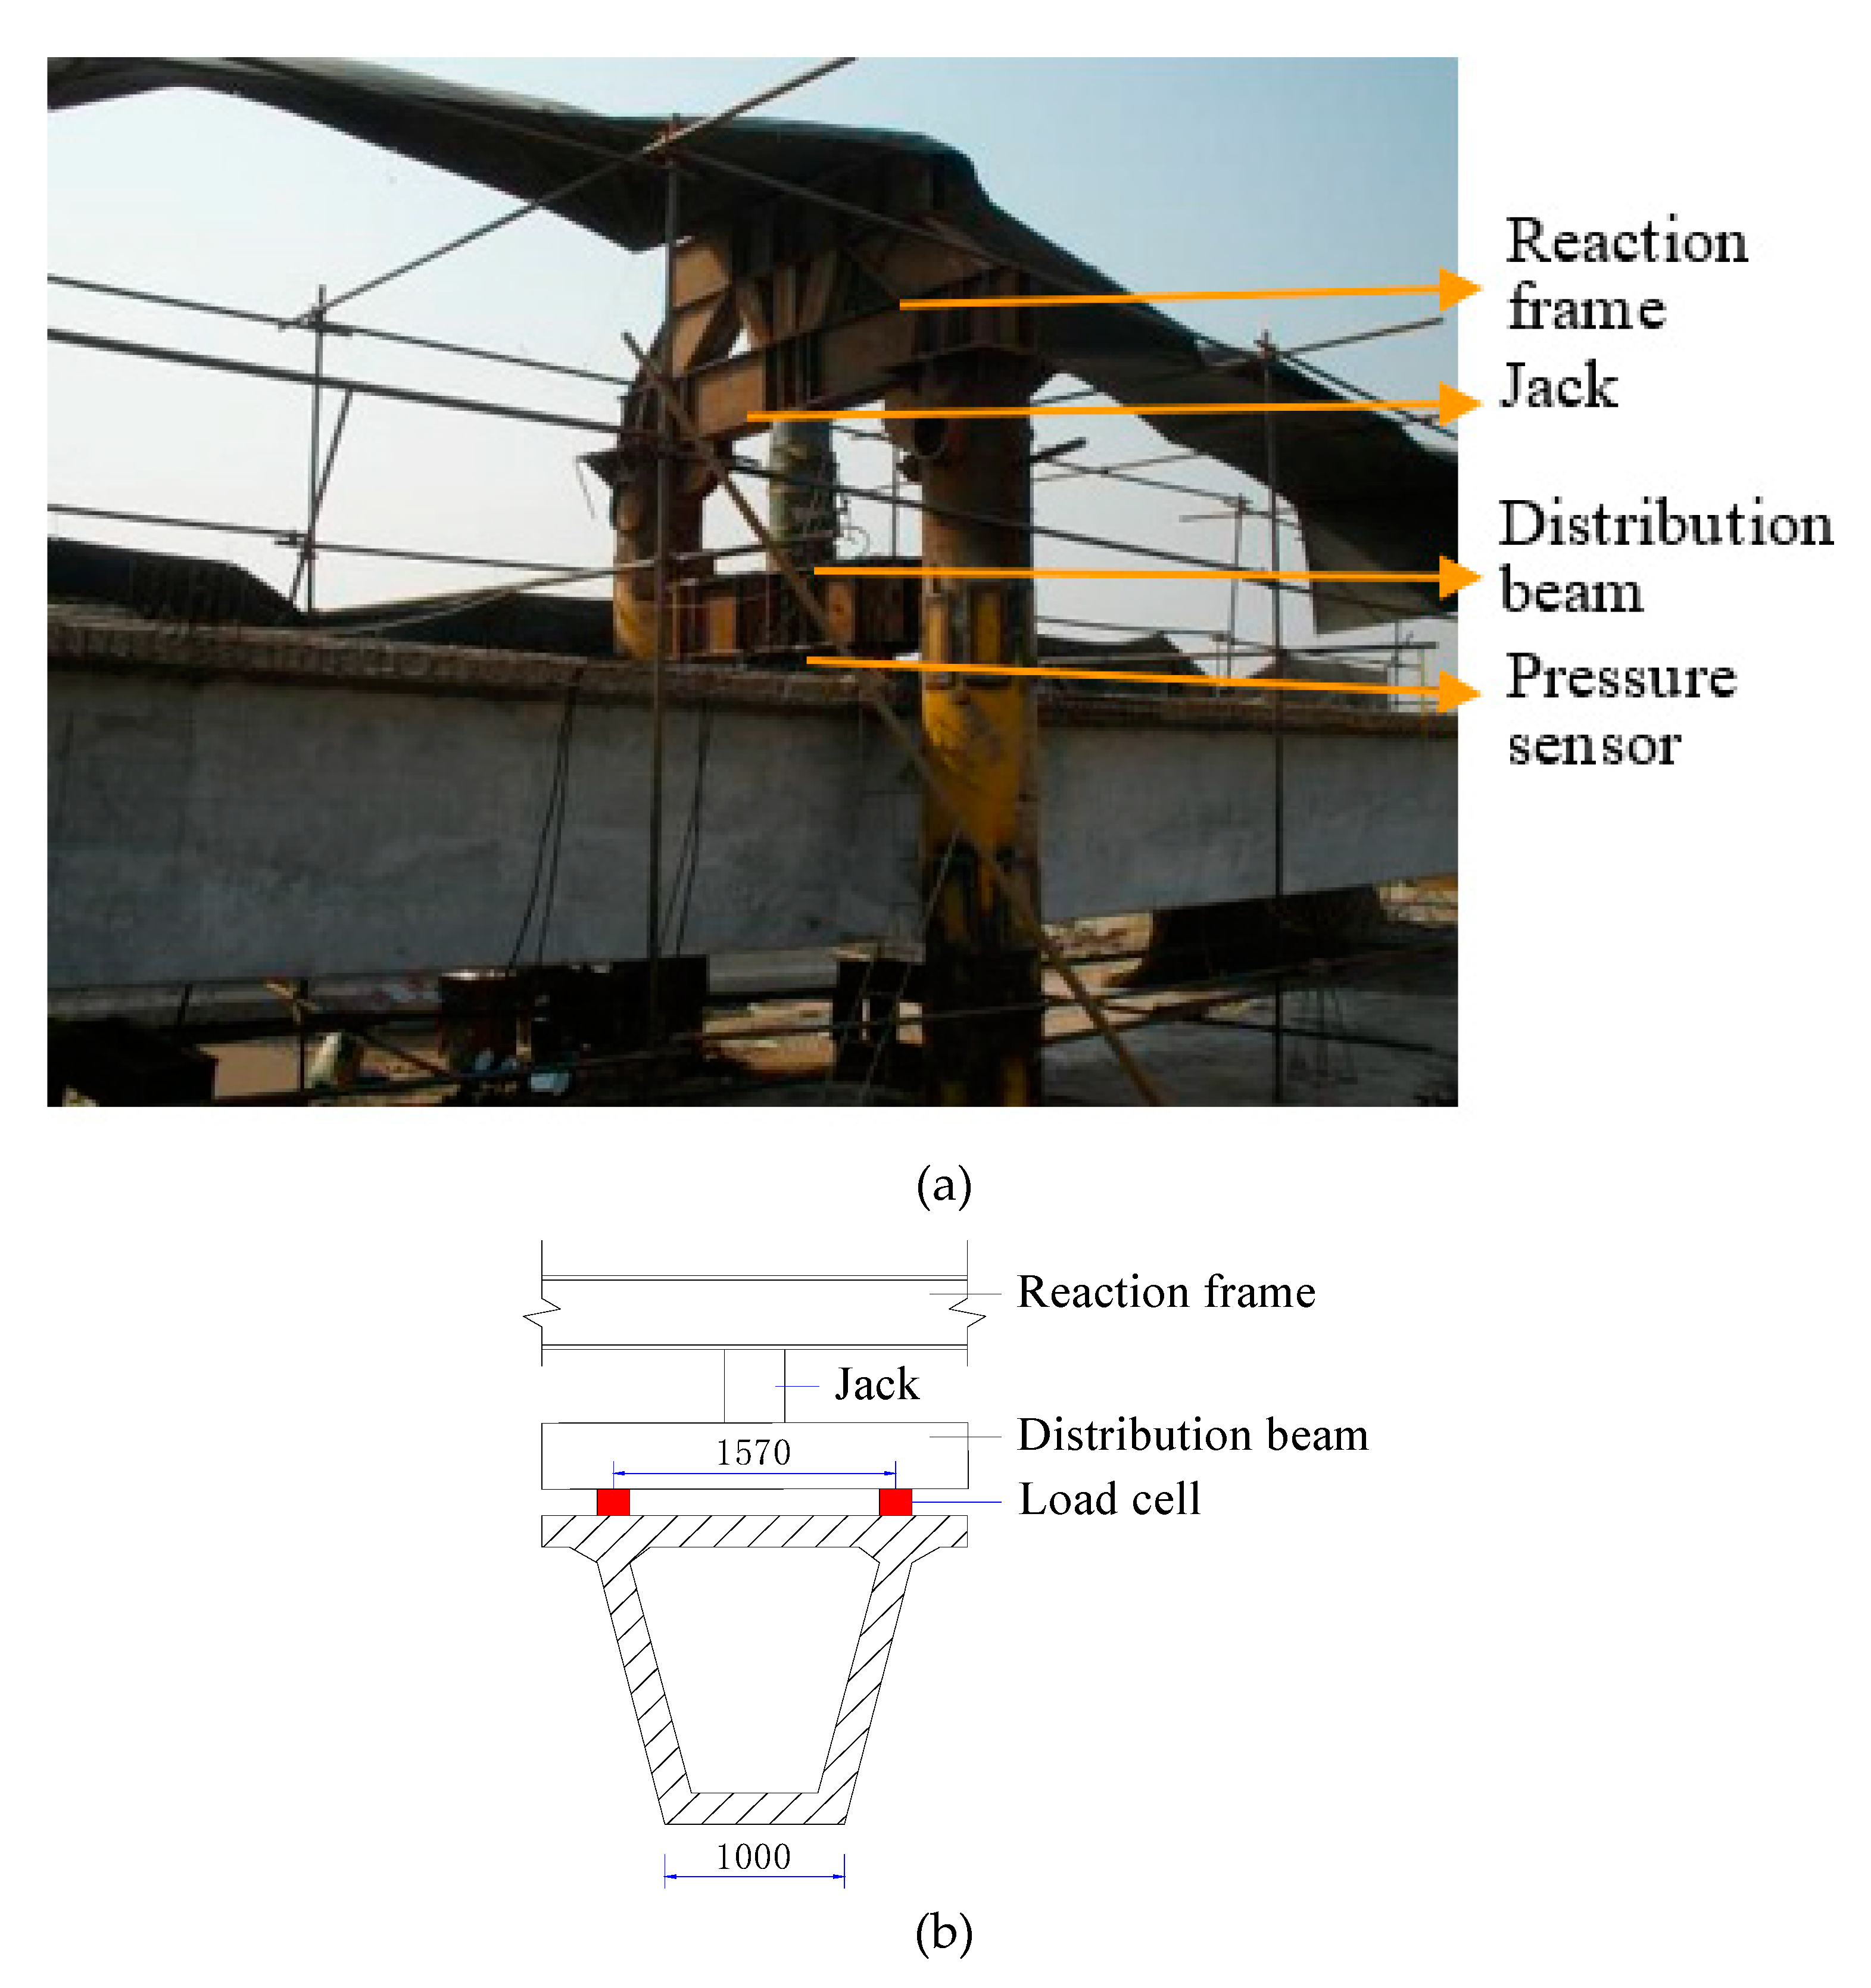
3.1. Loading Instrumentation and Procedure
3.2. Loading Procedure
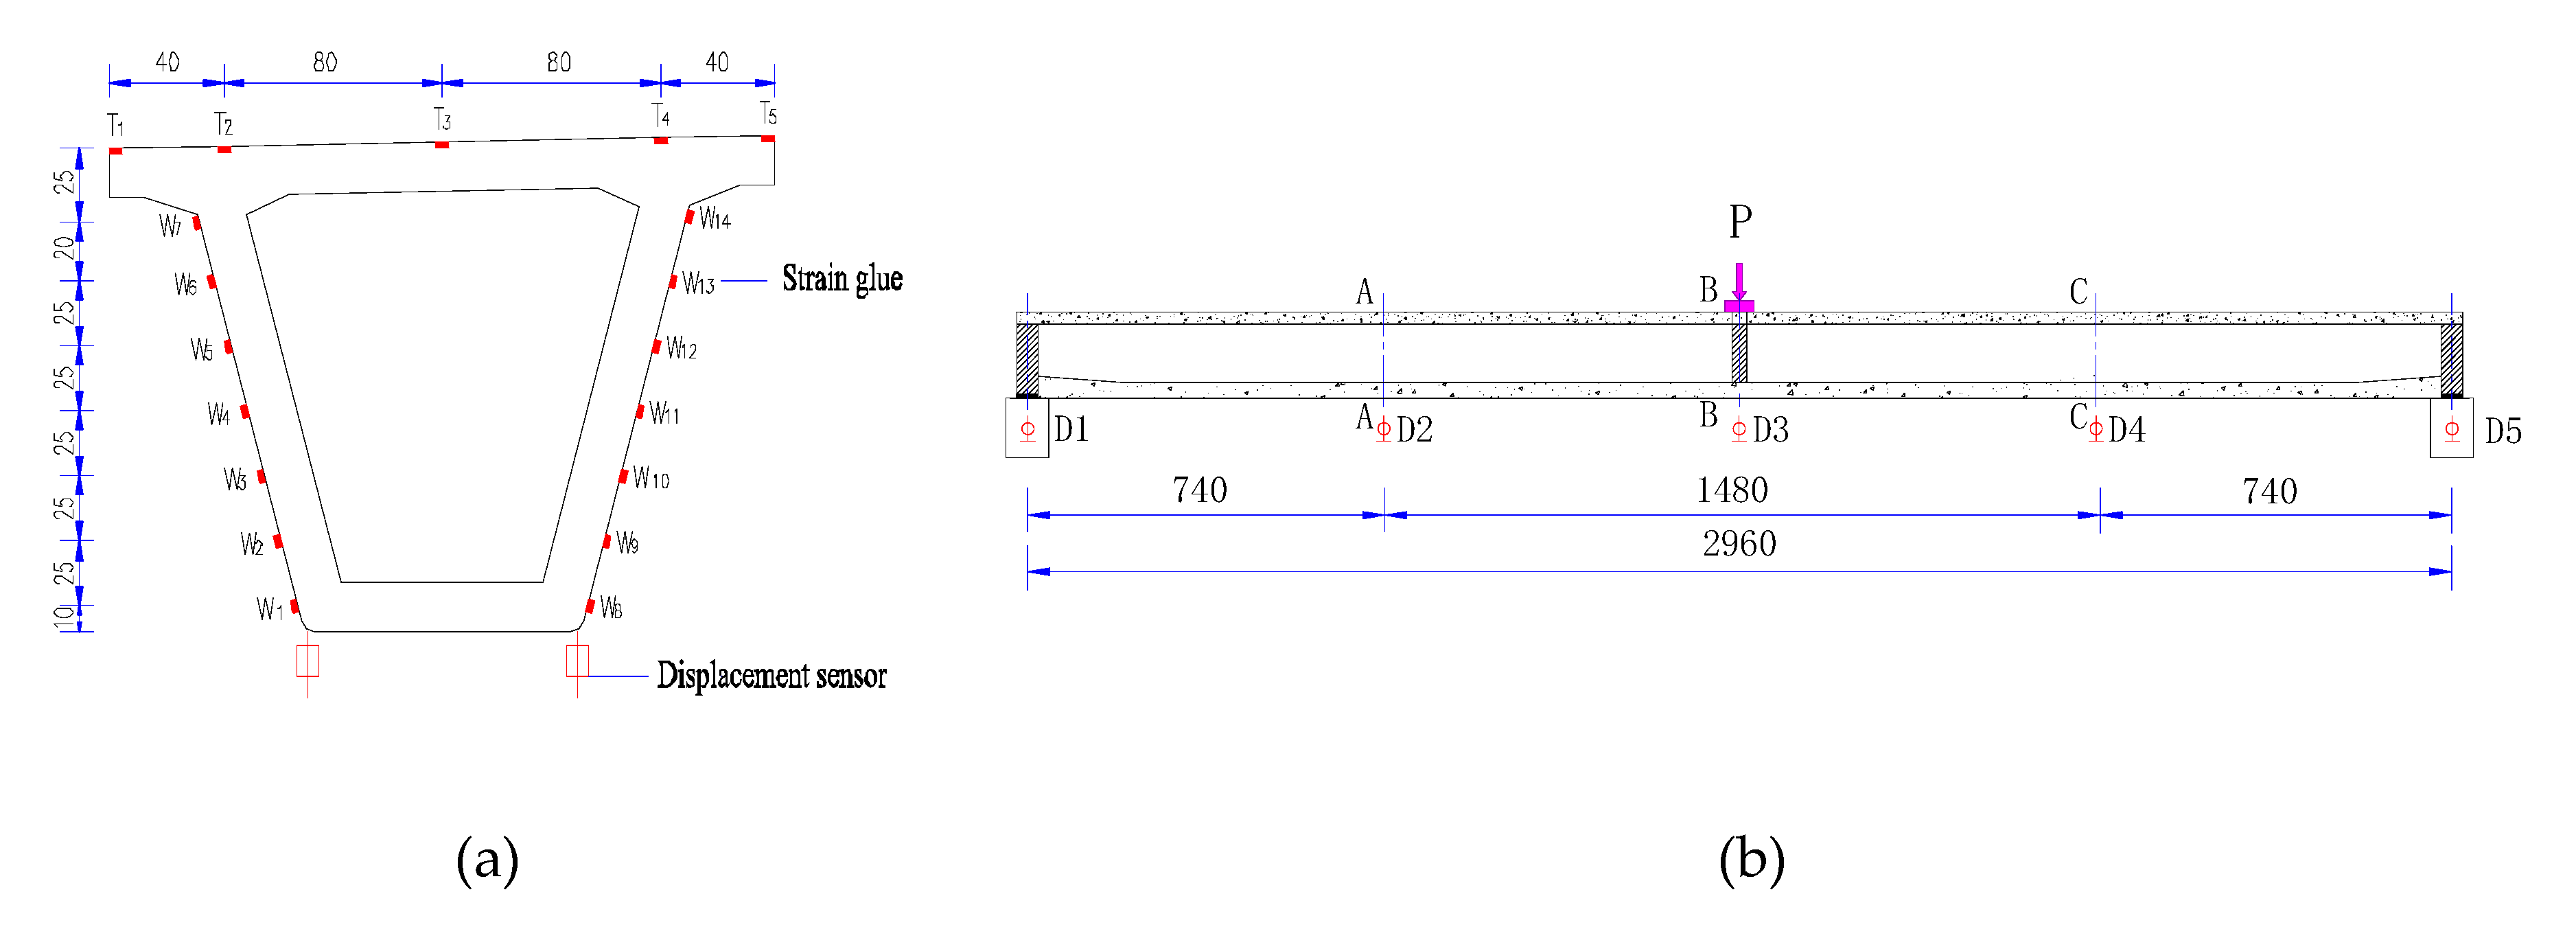
3.3. Arrangement of Test Instrumentation
3.4. Test Results
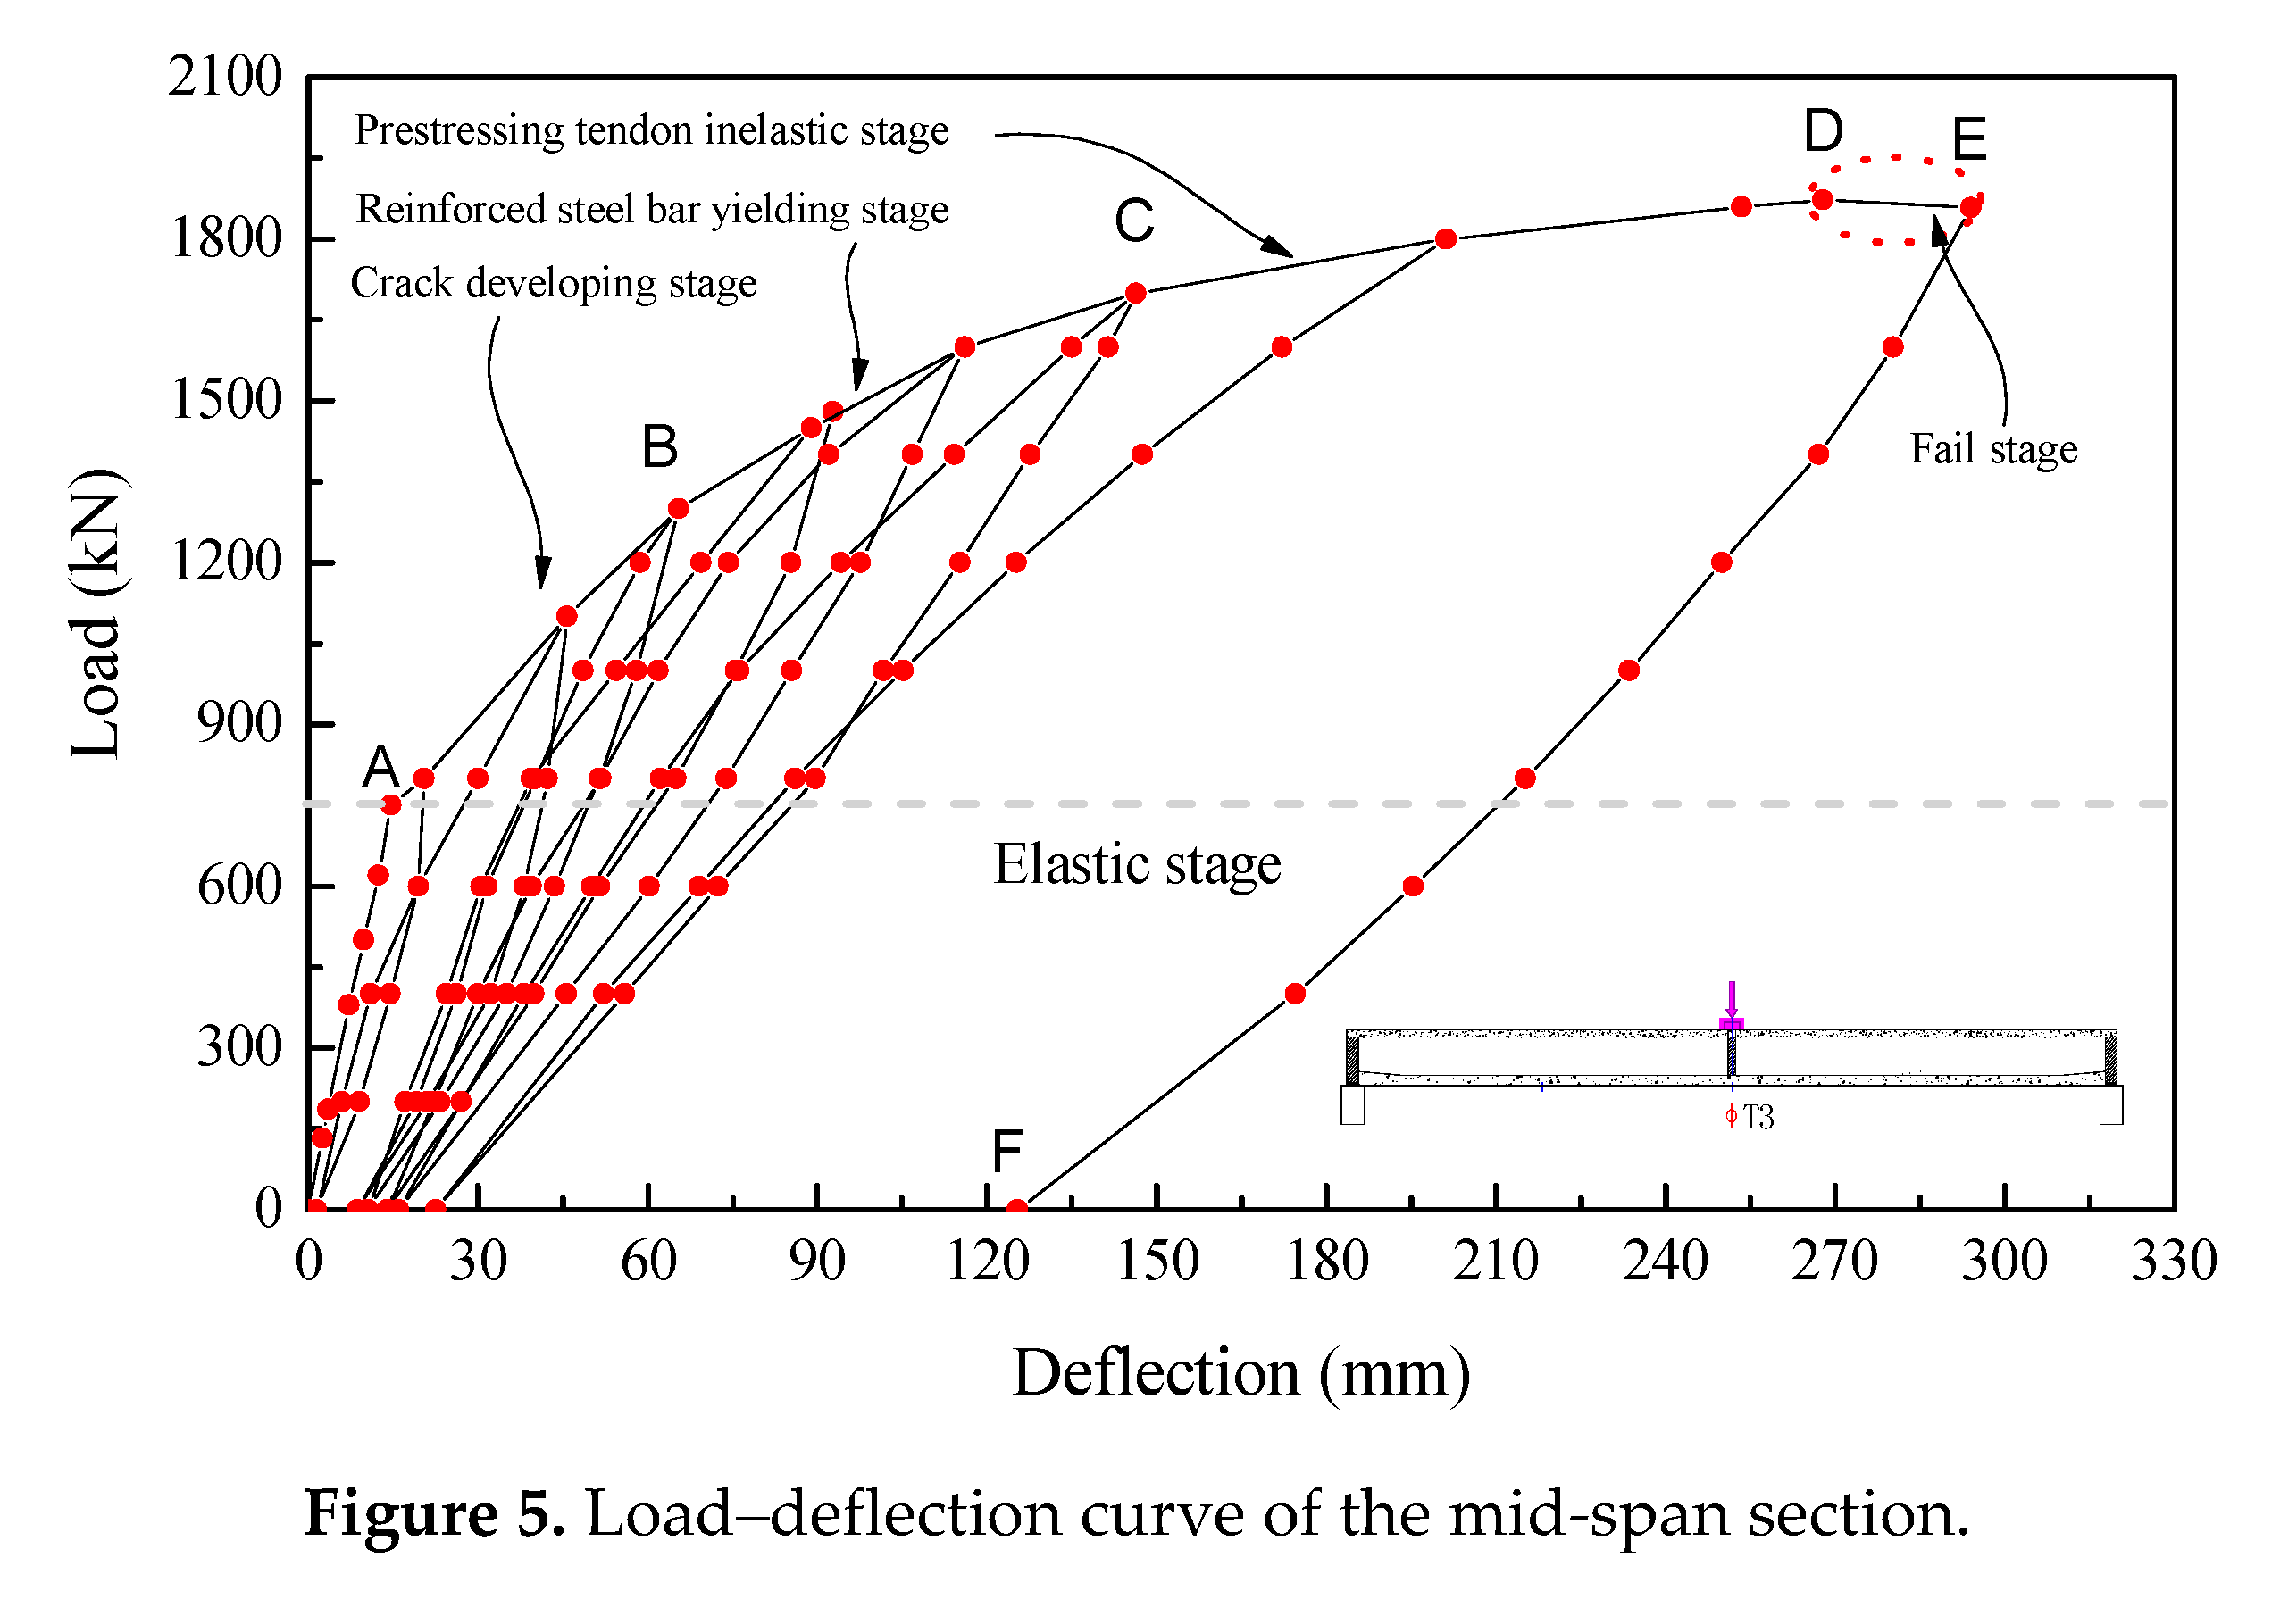
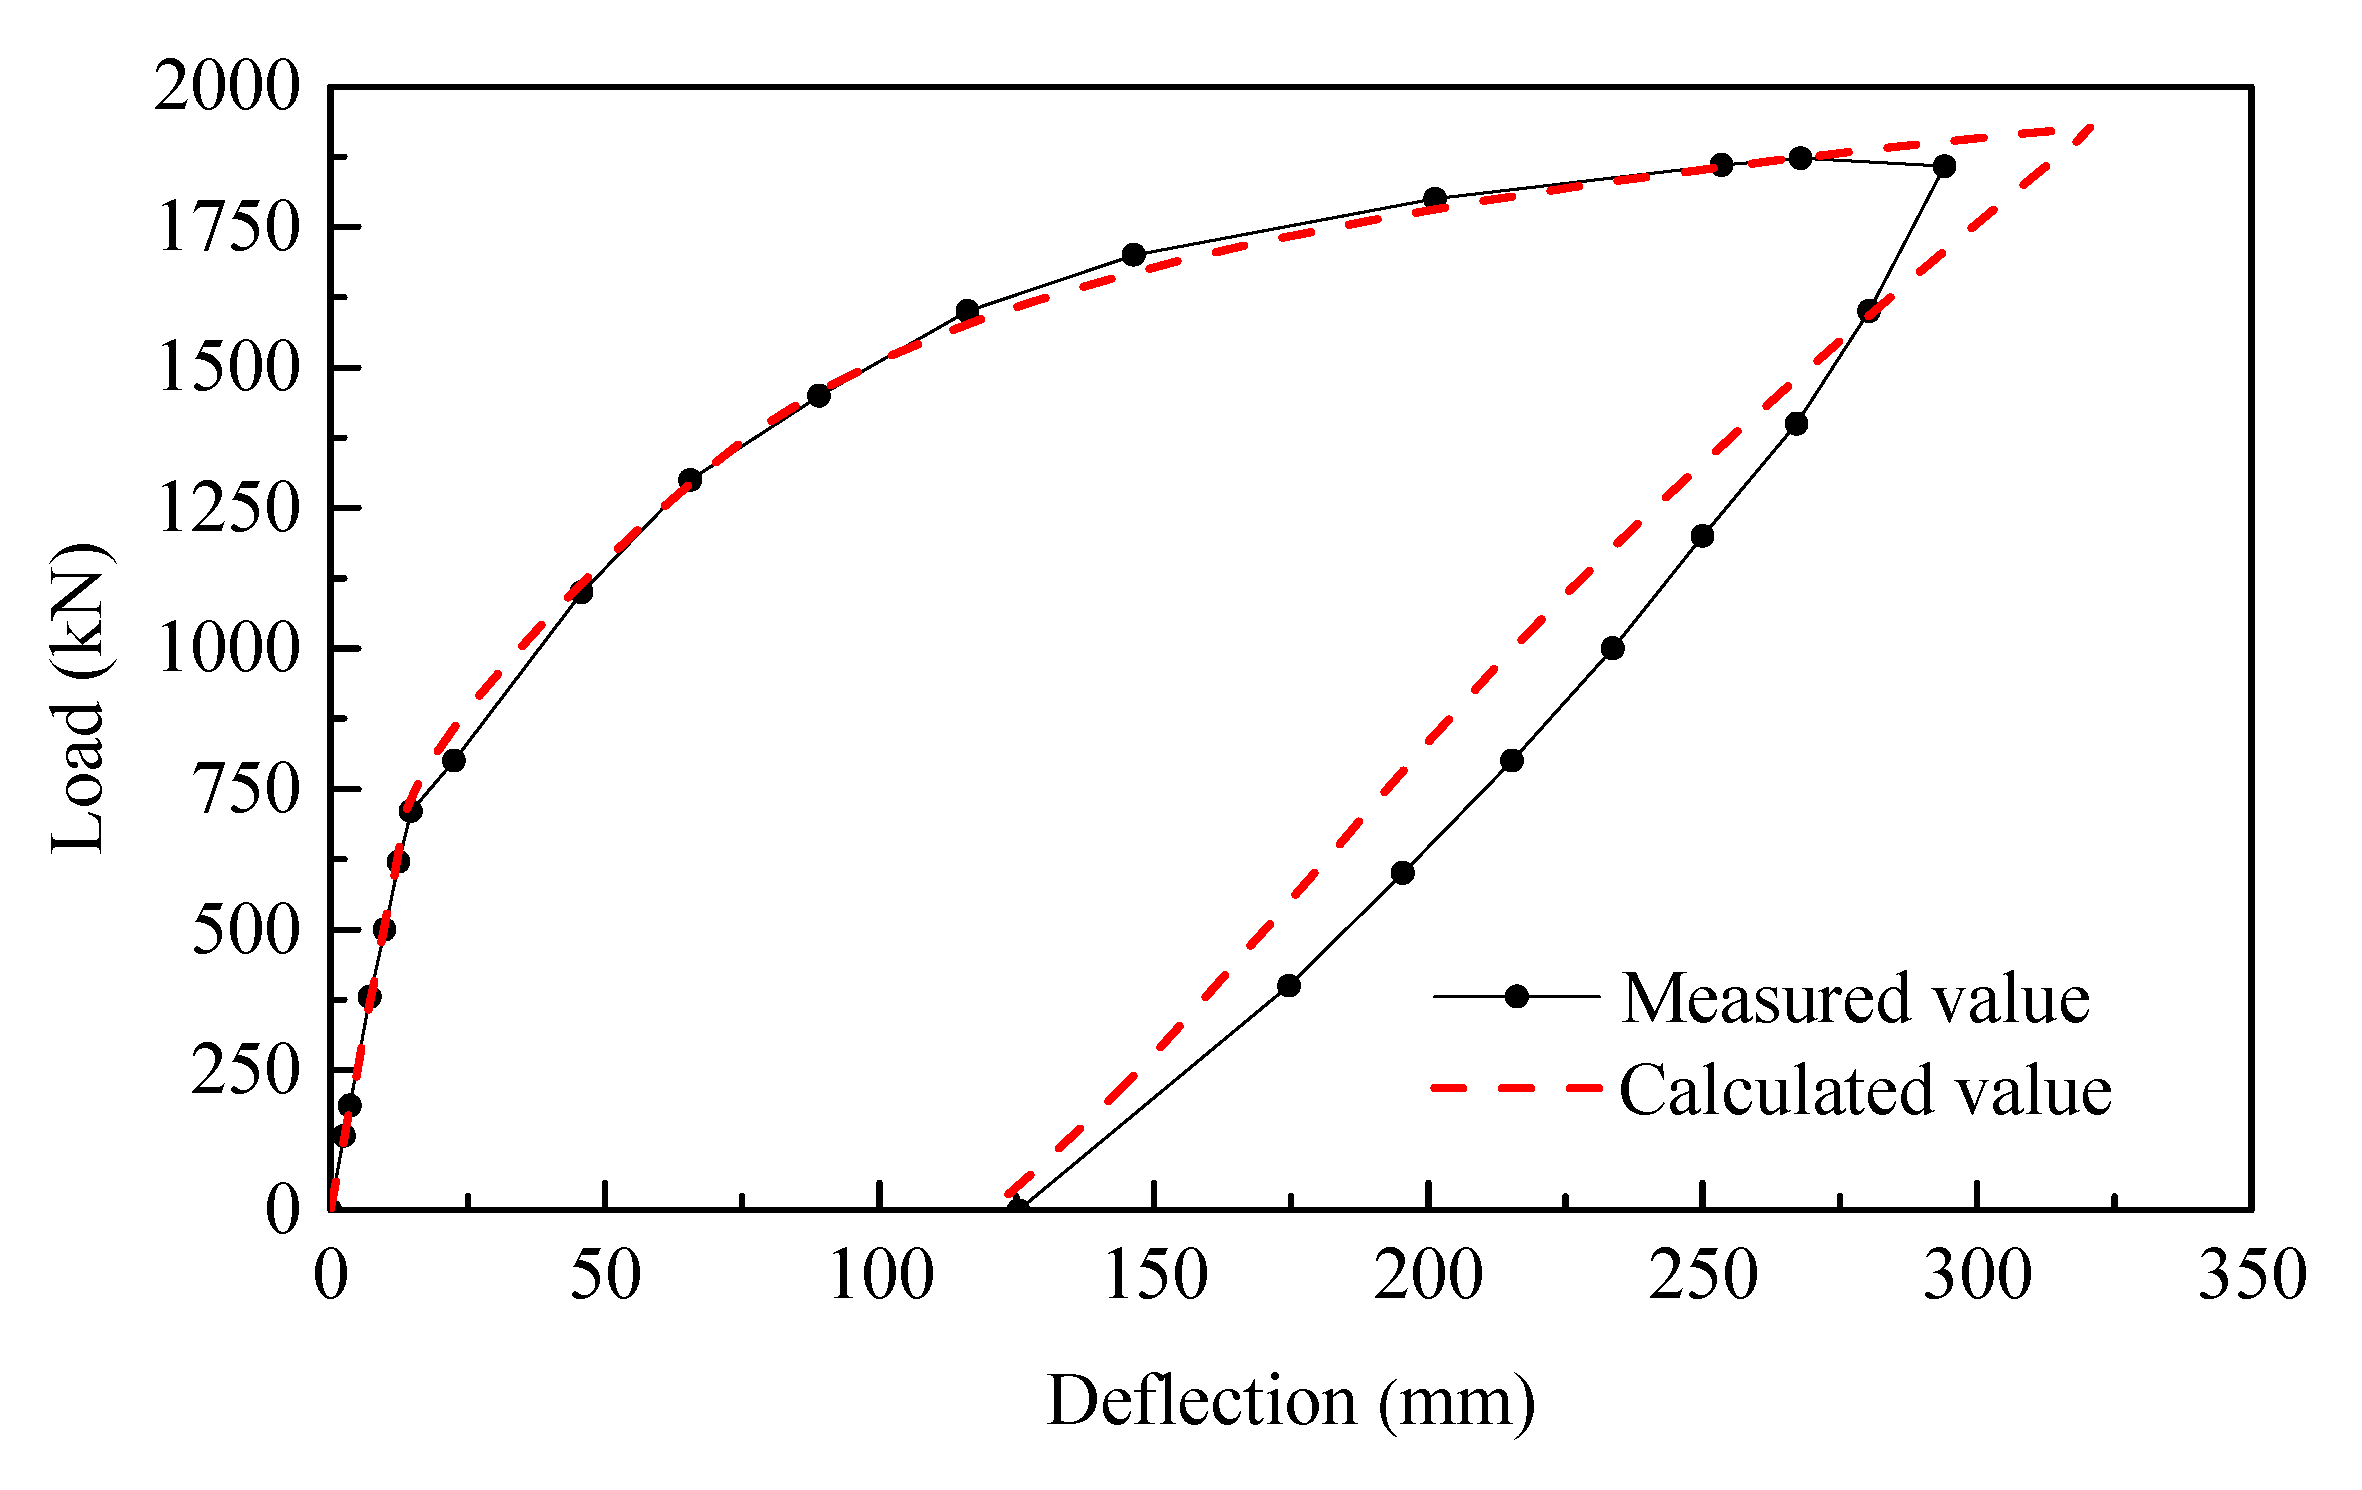
3.4.1. Load–Deflection Curve
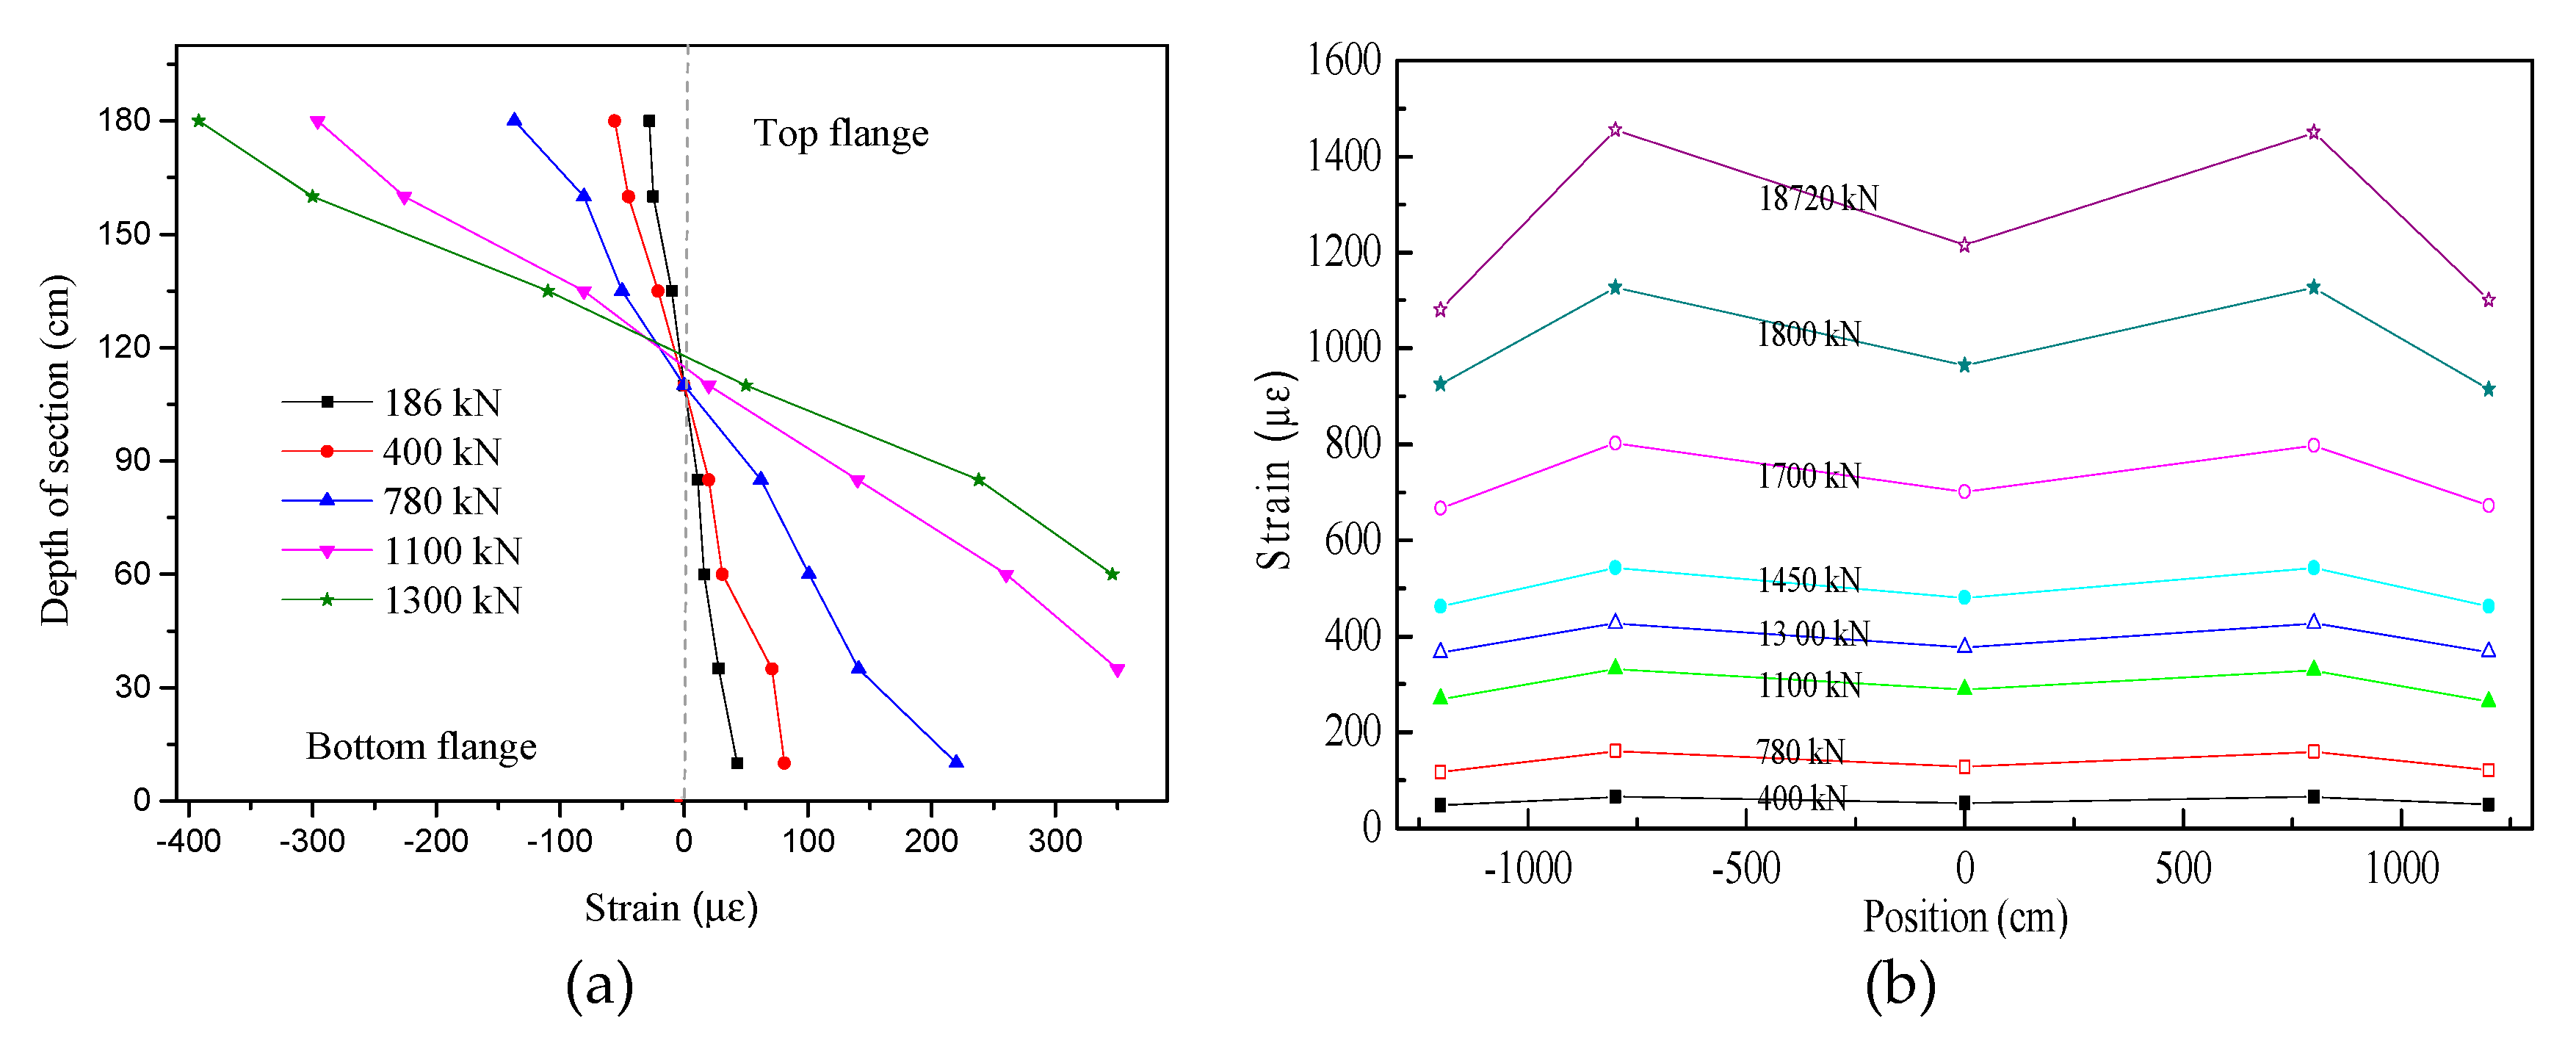
3.4.2. Strain
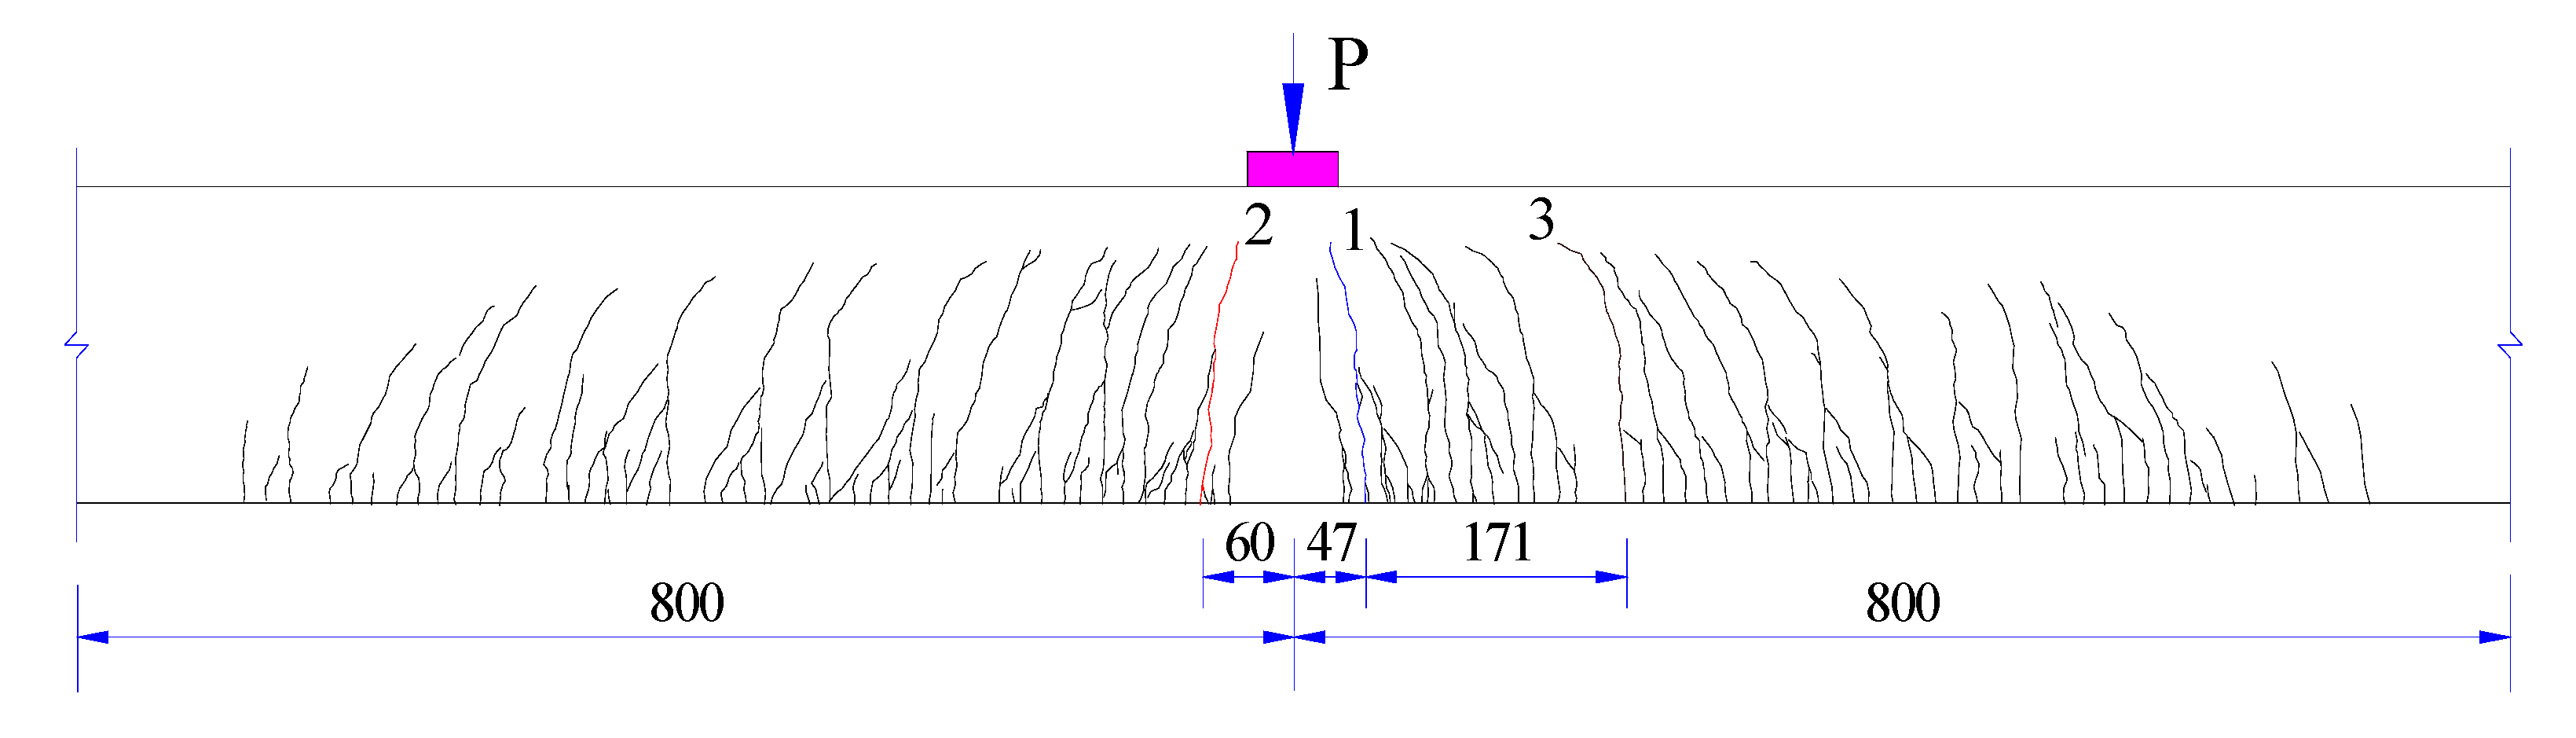
3.4.3. Cracks
3.5. Discussion
3.5.1. Failure Mode
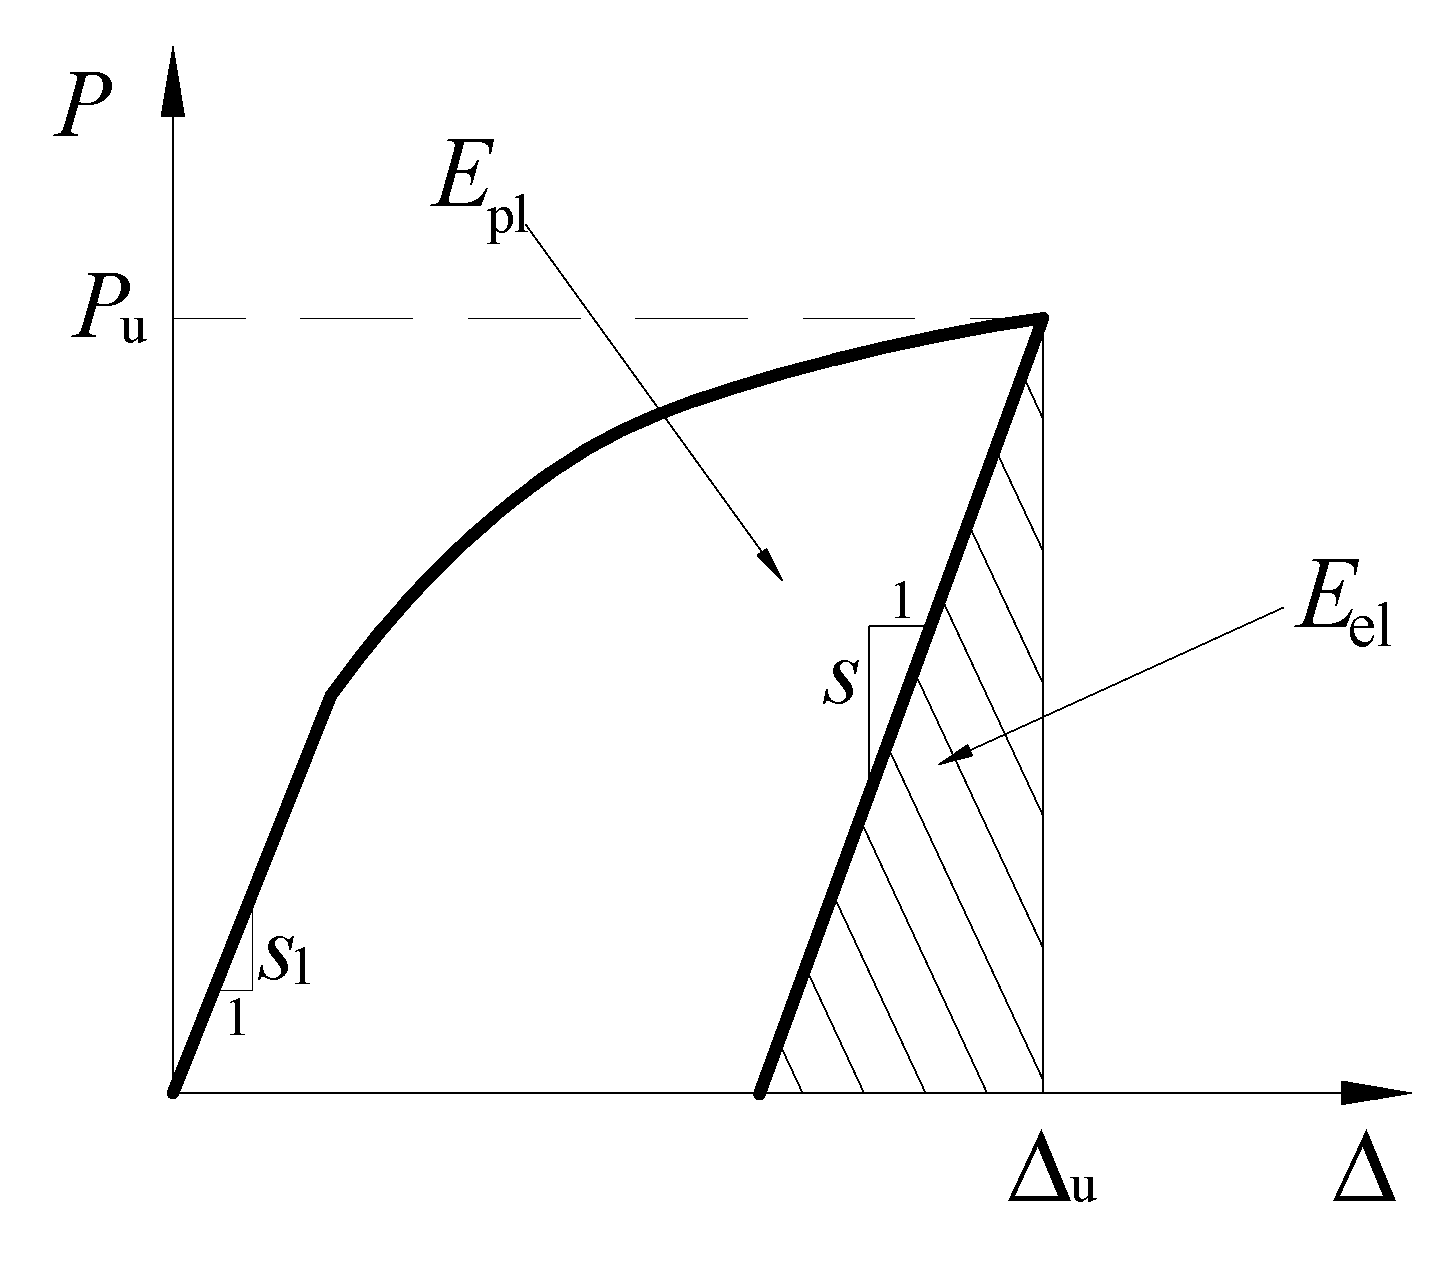
3.5.2. Ductility
4. A Nonlinear Numerical Model for the Tested Box Girder
4.1. Assumptions
- (1)
- The plane section assumption is applied, and normal strains along the depth are distributed linearly.
- (2)
- The reinforcement and concrete are well bonded without relative sliding.
- (3)
- The shear deformation is negligible.
- (4)
- The failure characteristics of the girder are the crushing of concrete in the compression zone or fracture of the prestressing tendon.
- (5)
- The section of concrete is divided into finite strips in which the strain is assumed to be uniformly distributed.
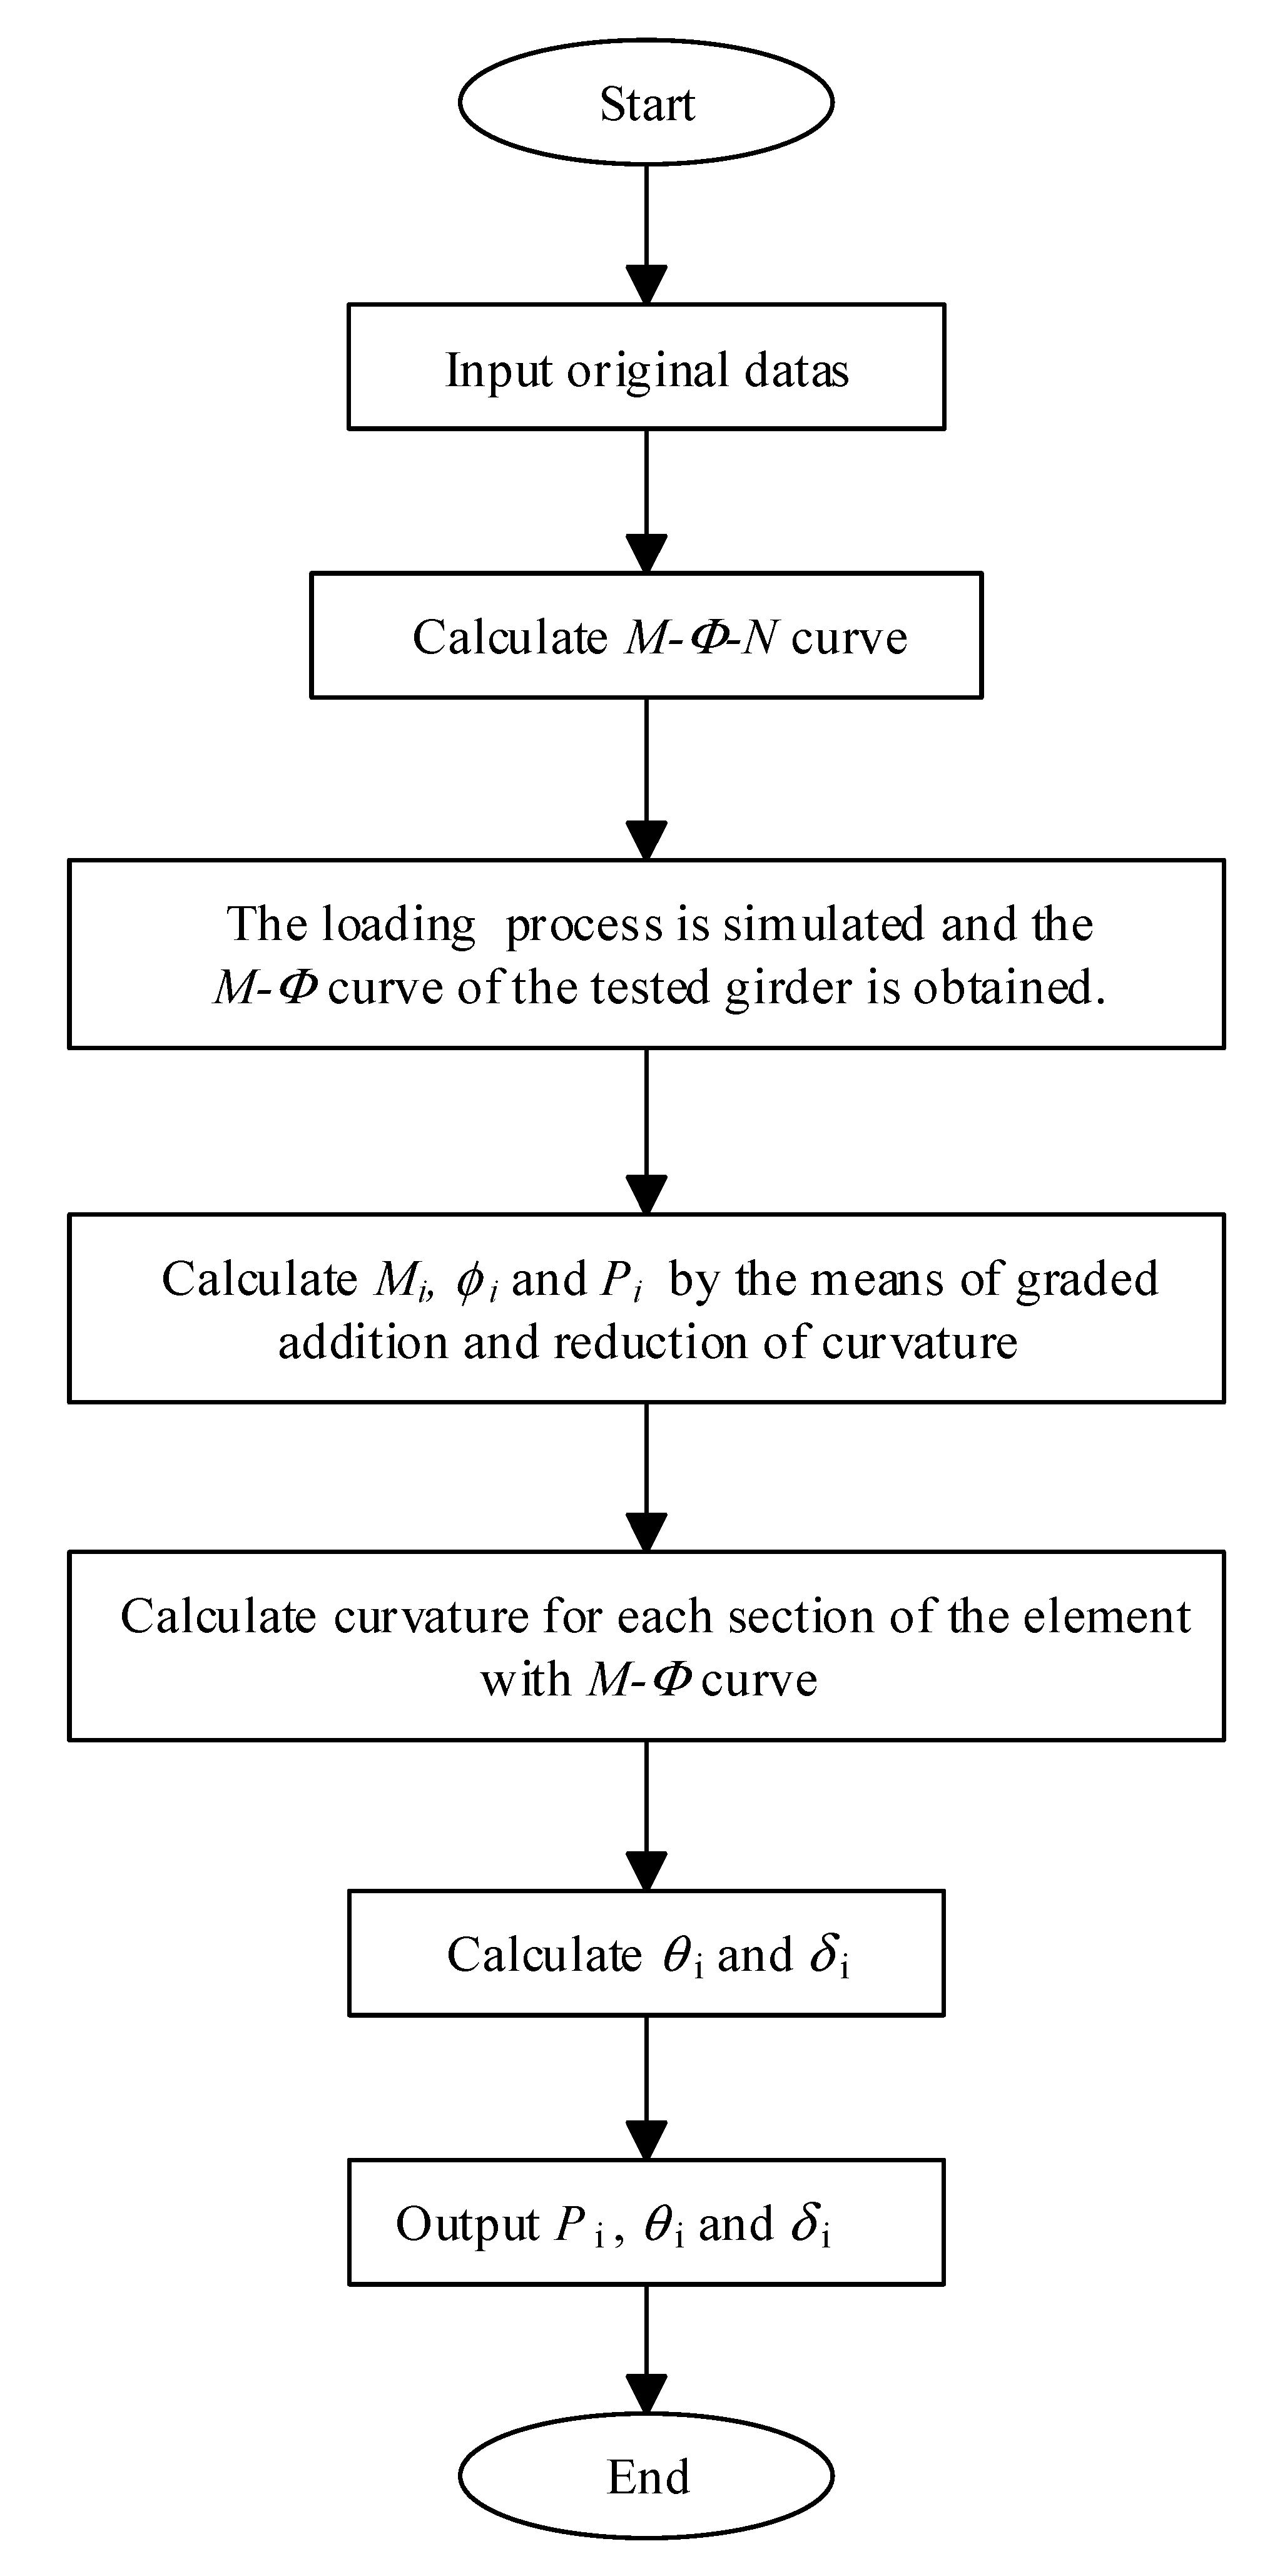
4.2. Method of Analysis
- (1)
- The beam is divided into n-many elements with the same length along the length direction, and each element is divided into finite strips in the height direction.
- (2)
- The moment–curvature–axial force () relationship is solved, by which the initial strain of each section under prestress is obtained.
- (3)
- The loading and unloading process of the prestressed concrete beam is simulated, and the bending moment–curvature () curve of the tested girder is obtained by the method of adding or reducing curvature, respectively.
- (4)
- Based on the moment–curvature () curve, by means of changing the curvature, , , and are obtained. , , and are the moment, curvature, and applied load at the ith load step, respectively.
- (5)
- Then, the bending moment of each element under applied load can be calculated. Therefore, the curvature for each section of the element can be obtained from the curve.
- (6)
- and can be obtained, where and are the rotation angle and deflection of each section under the ith applied load , respectively.
- (7)
- Repeat Steps (4)–(6) to complete the whole analysis process for the flexural behavior of the tested girder.
4.3. Material Stress–Strain (σ–ε) Relationship
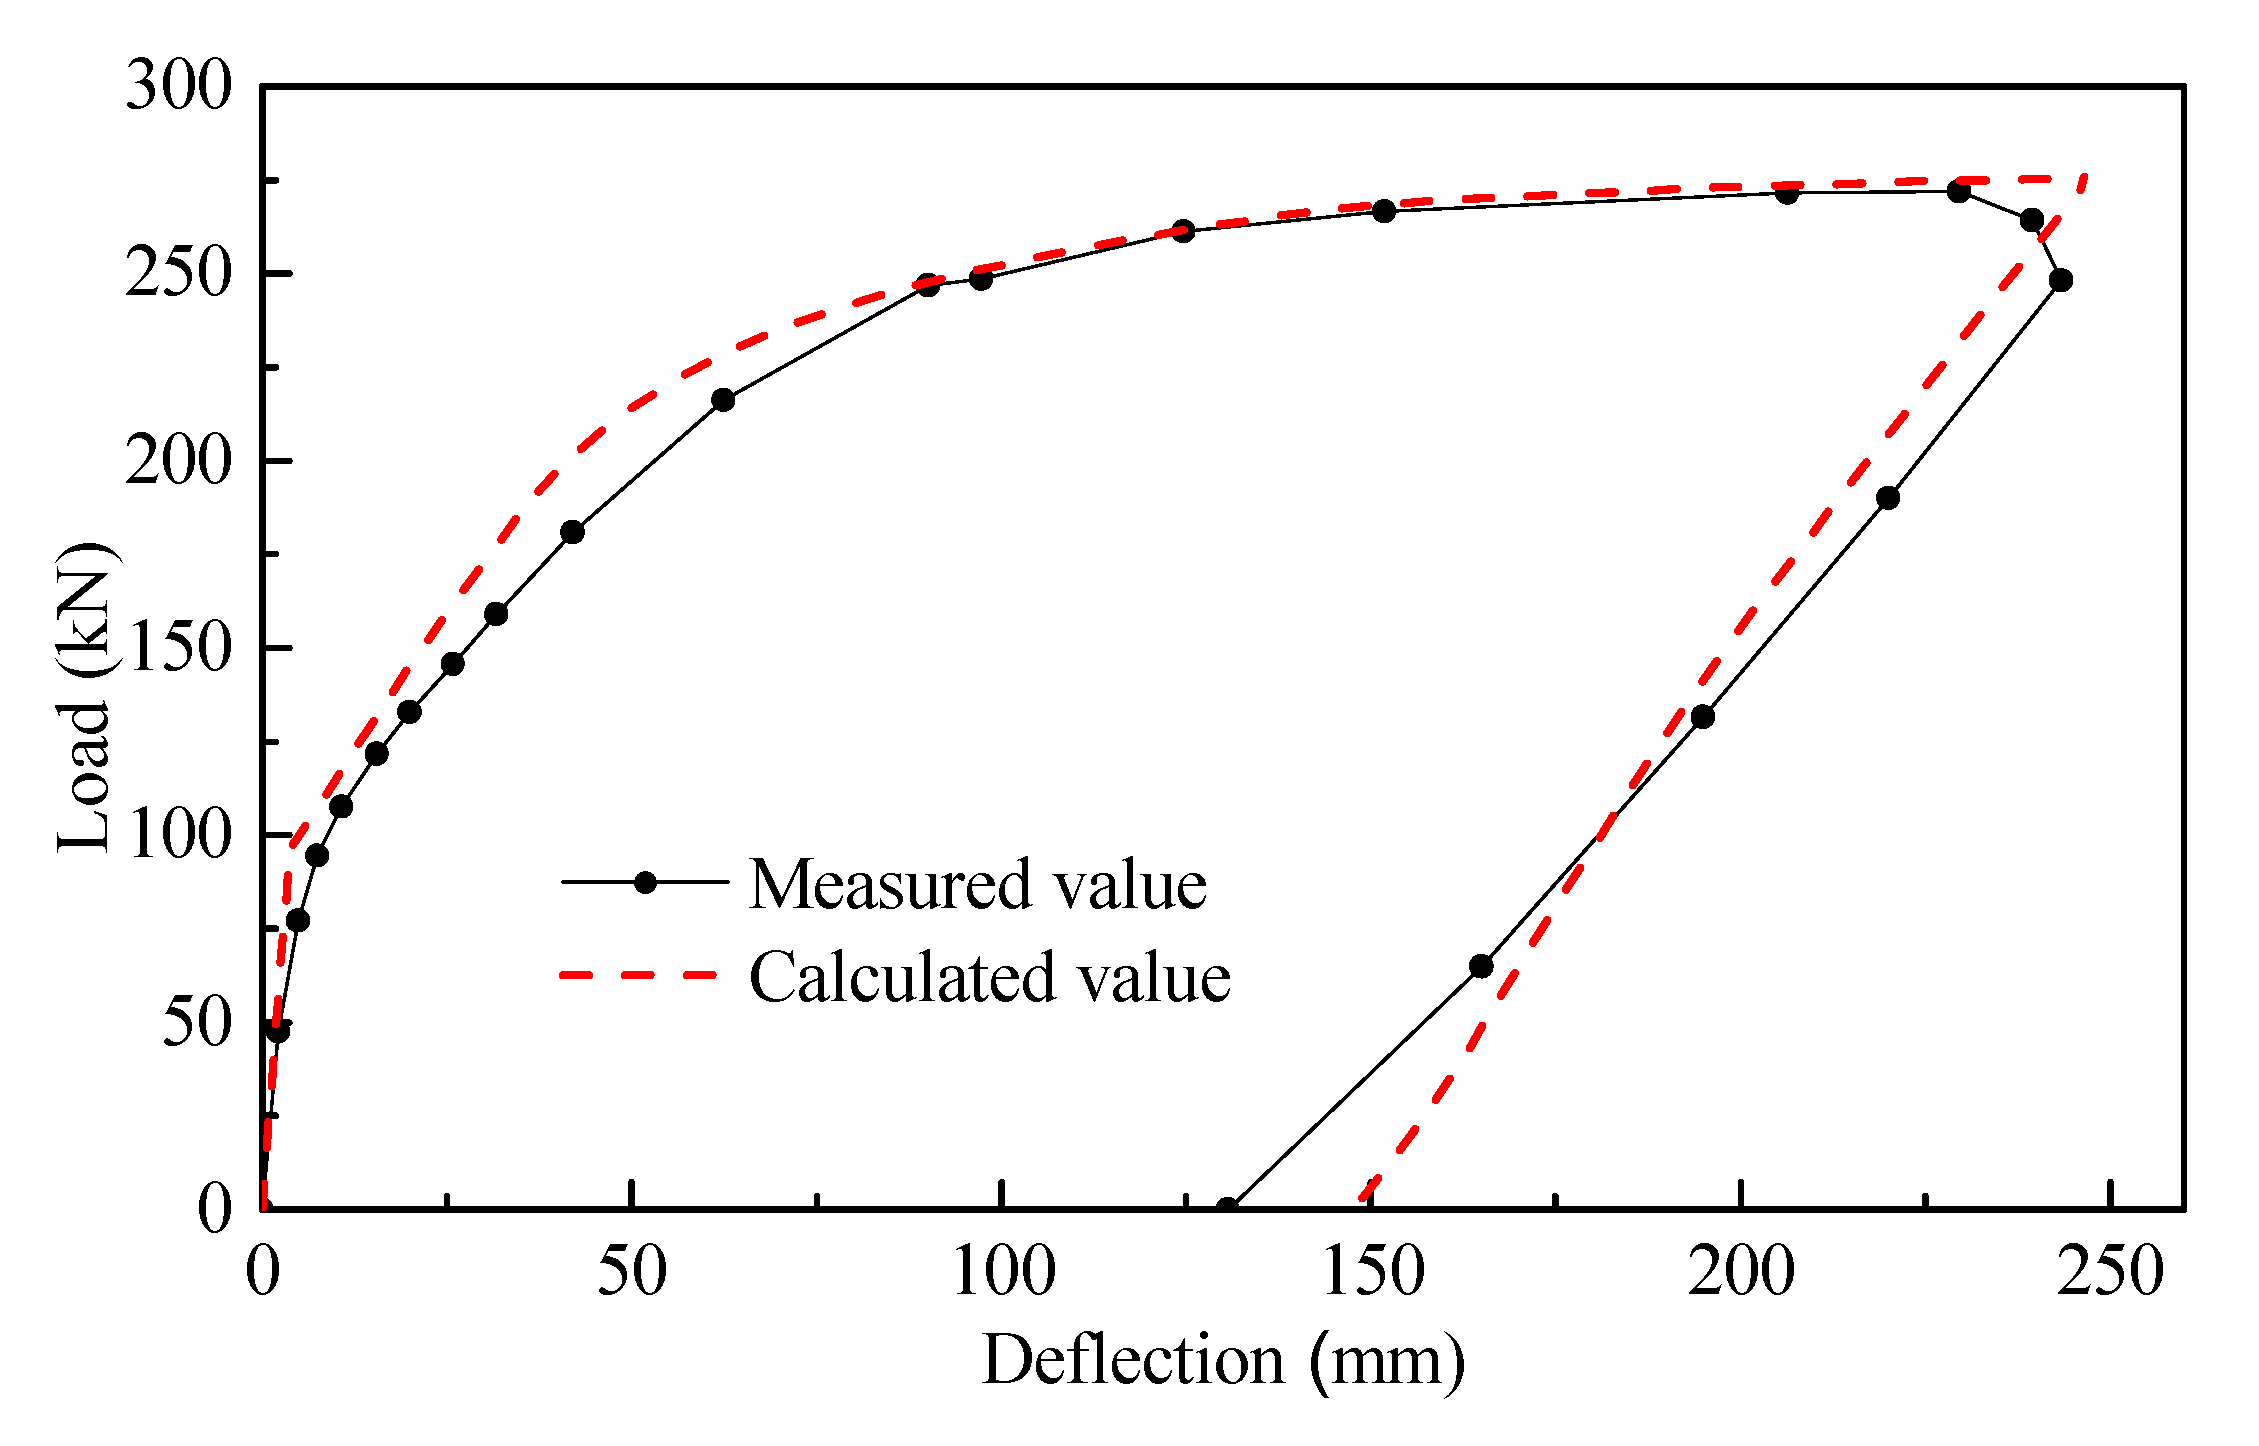
4.4. Verification of the Nonlinear Numerical Model
4.5. Discussion
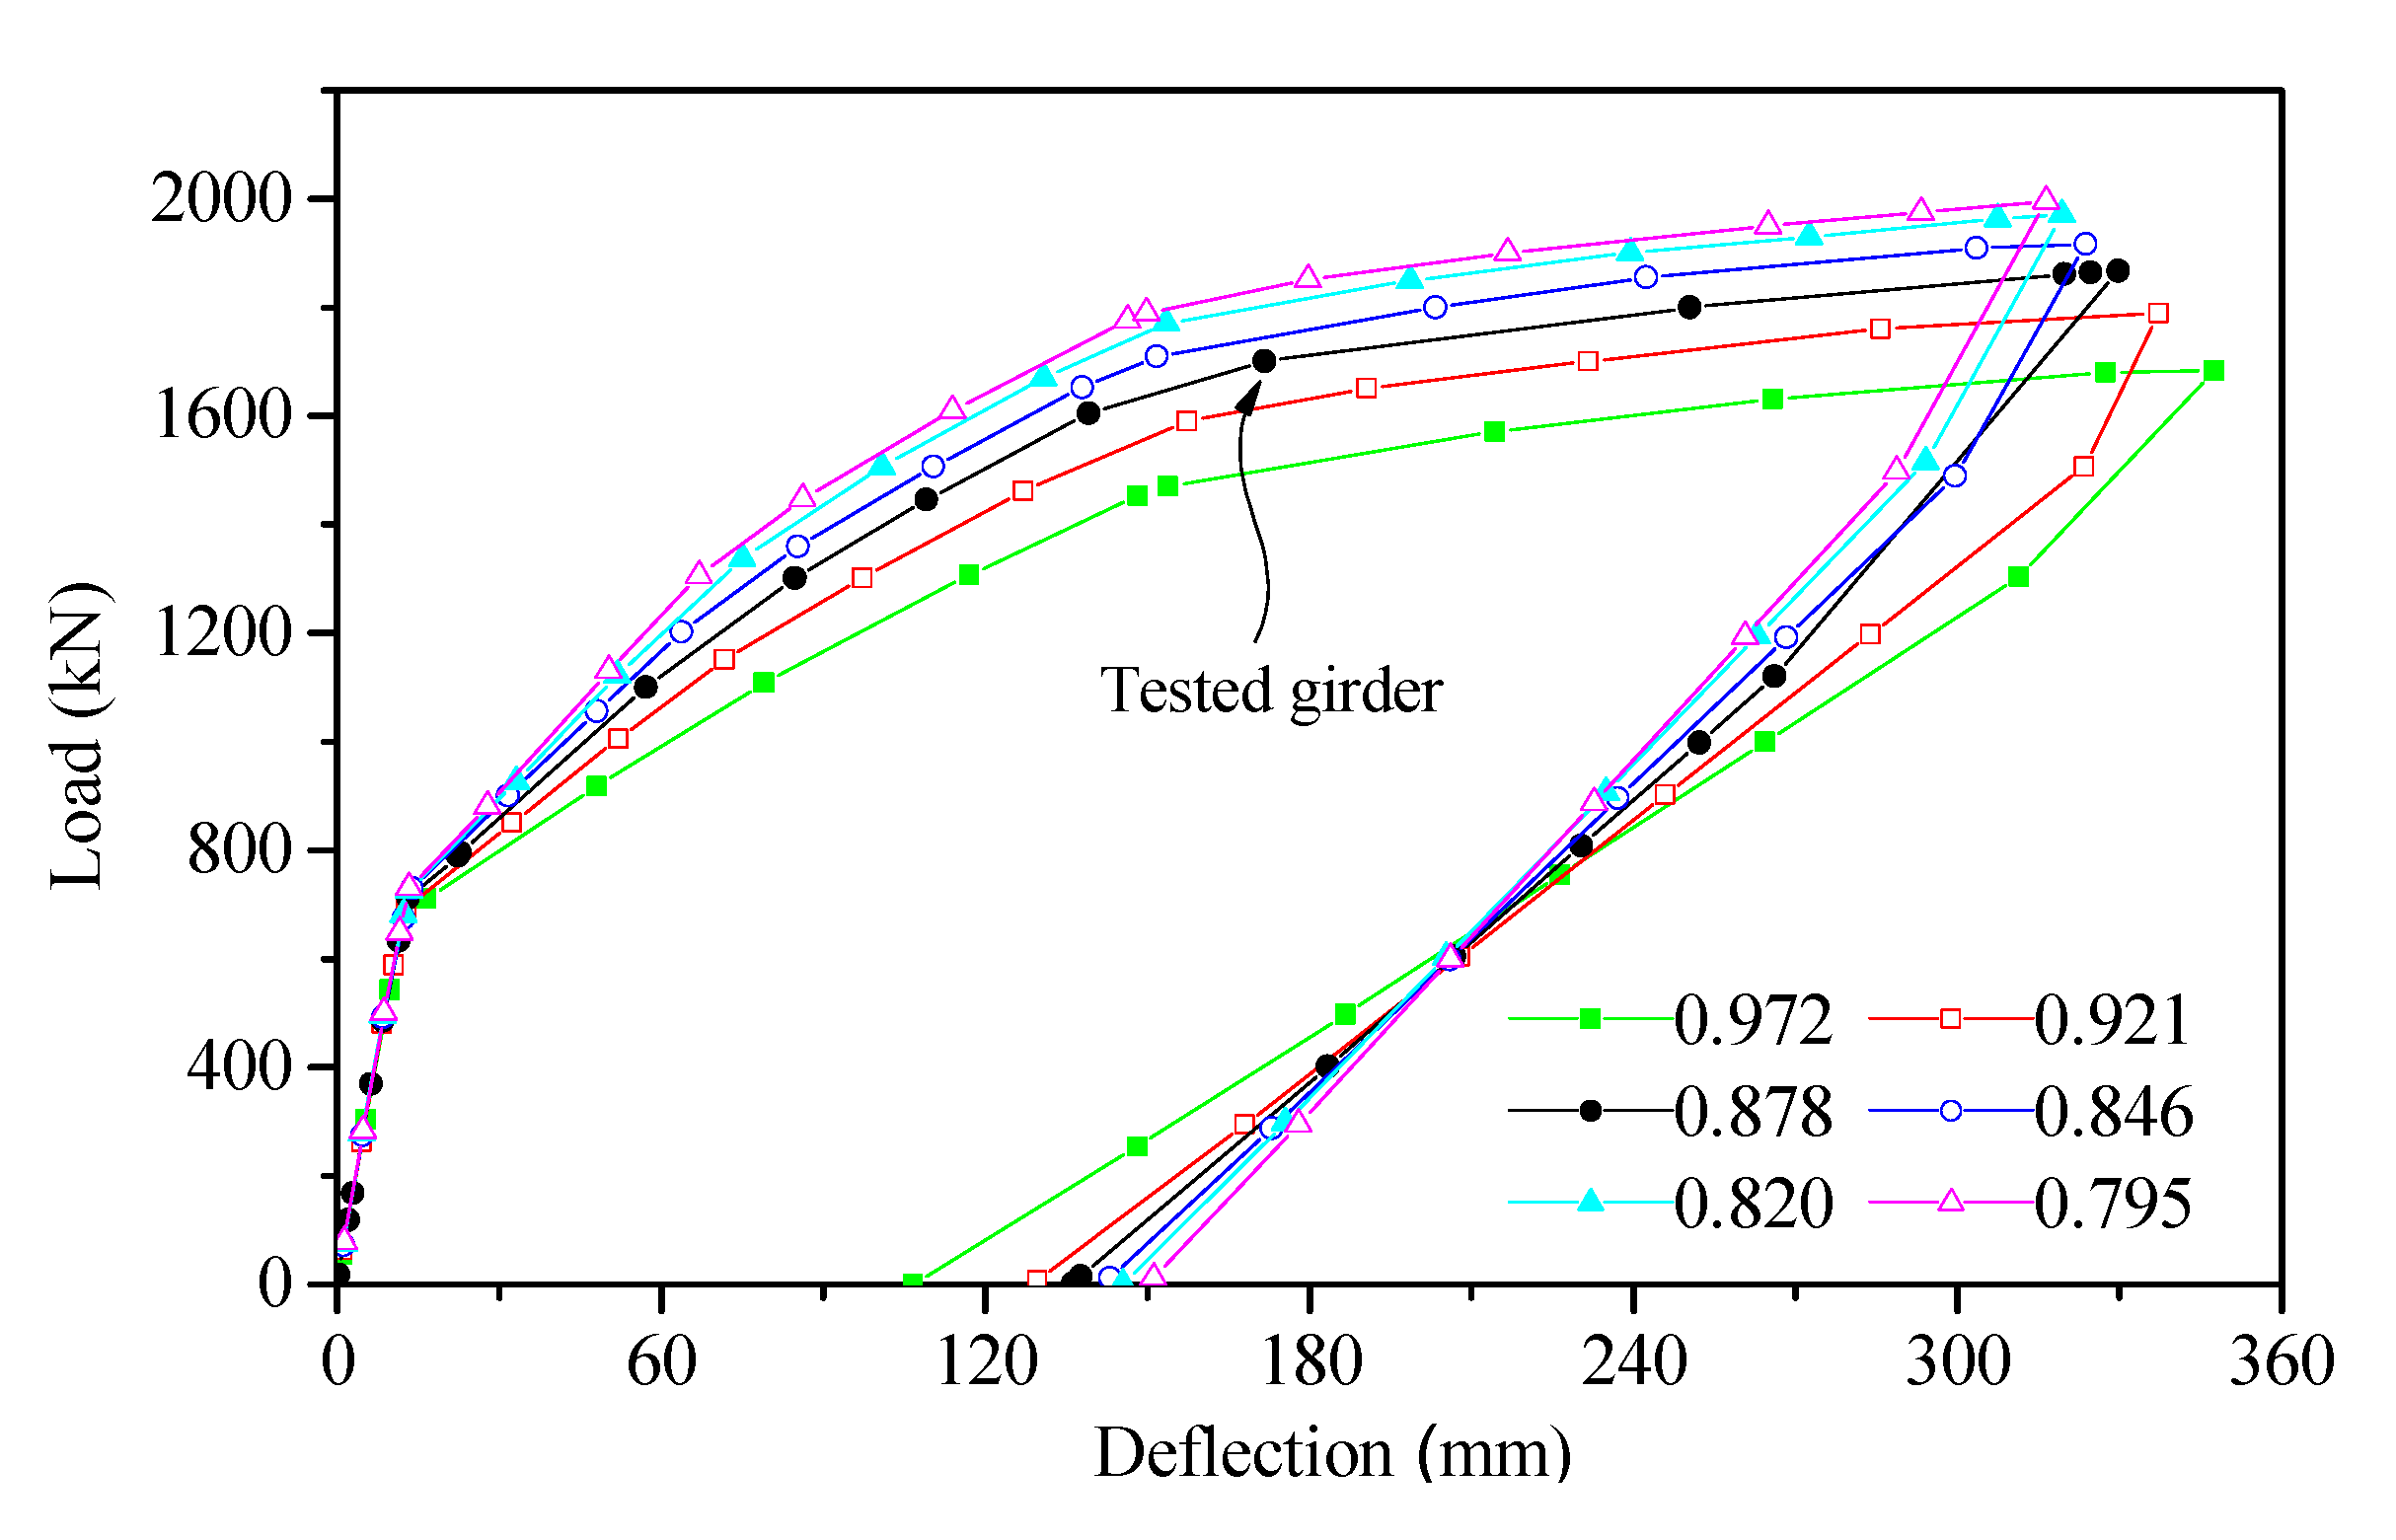
4.5.1. Reinforcement in the Compression Zone of the Top Flange
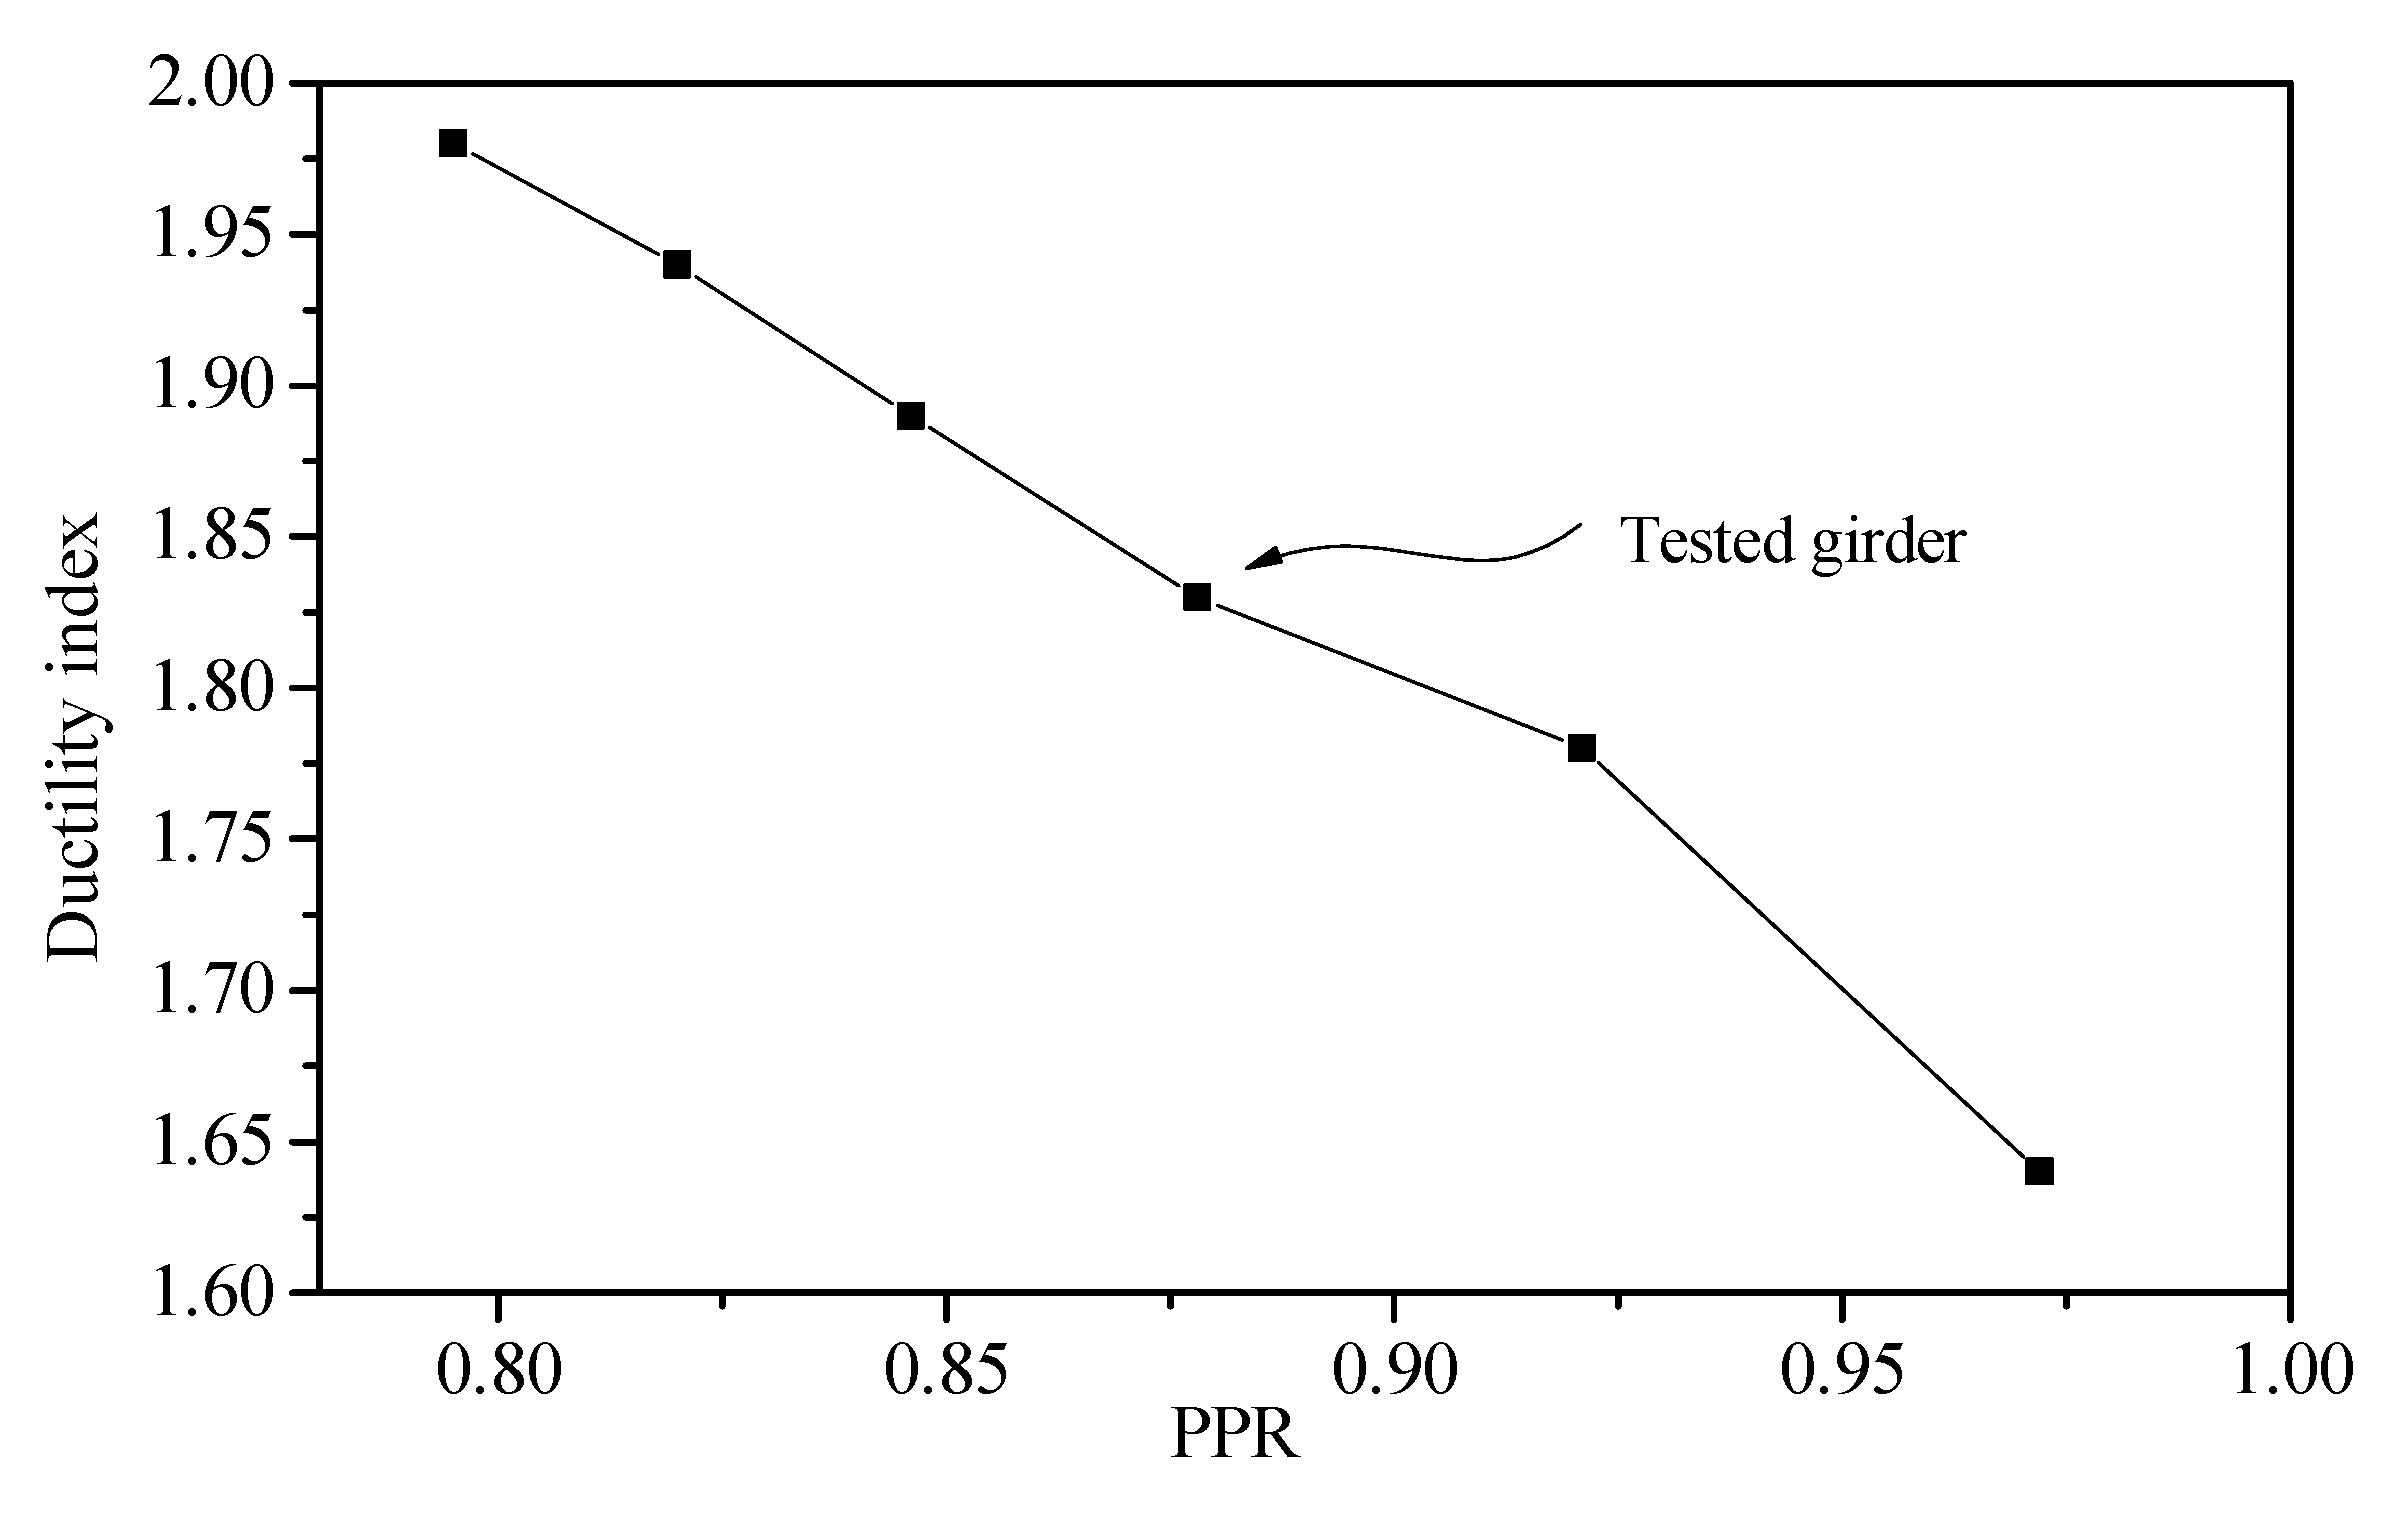
4.5.2. Reinforcement in the Tension Zone of the Bottom Flange
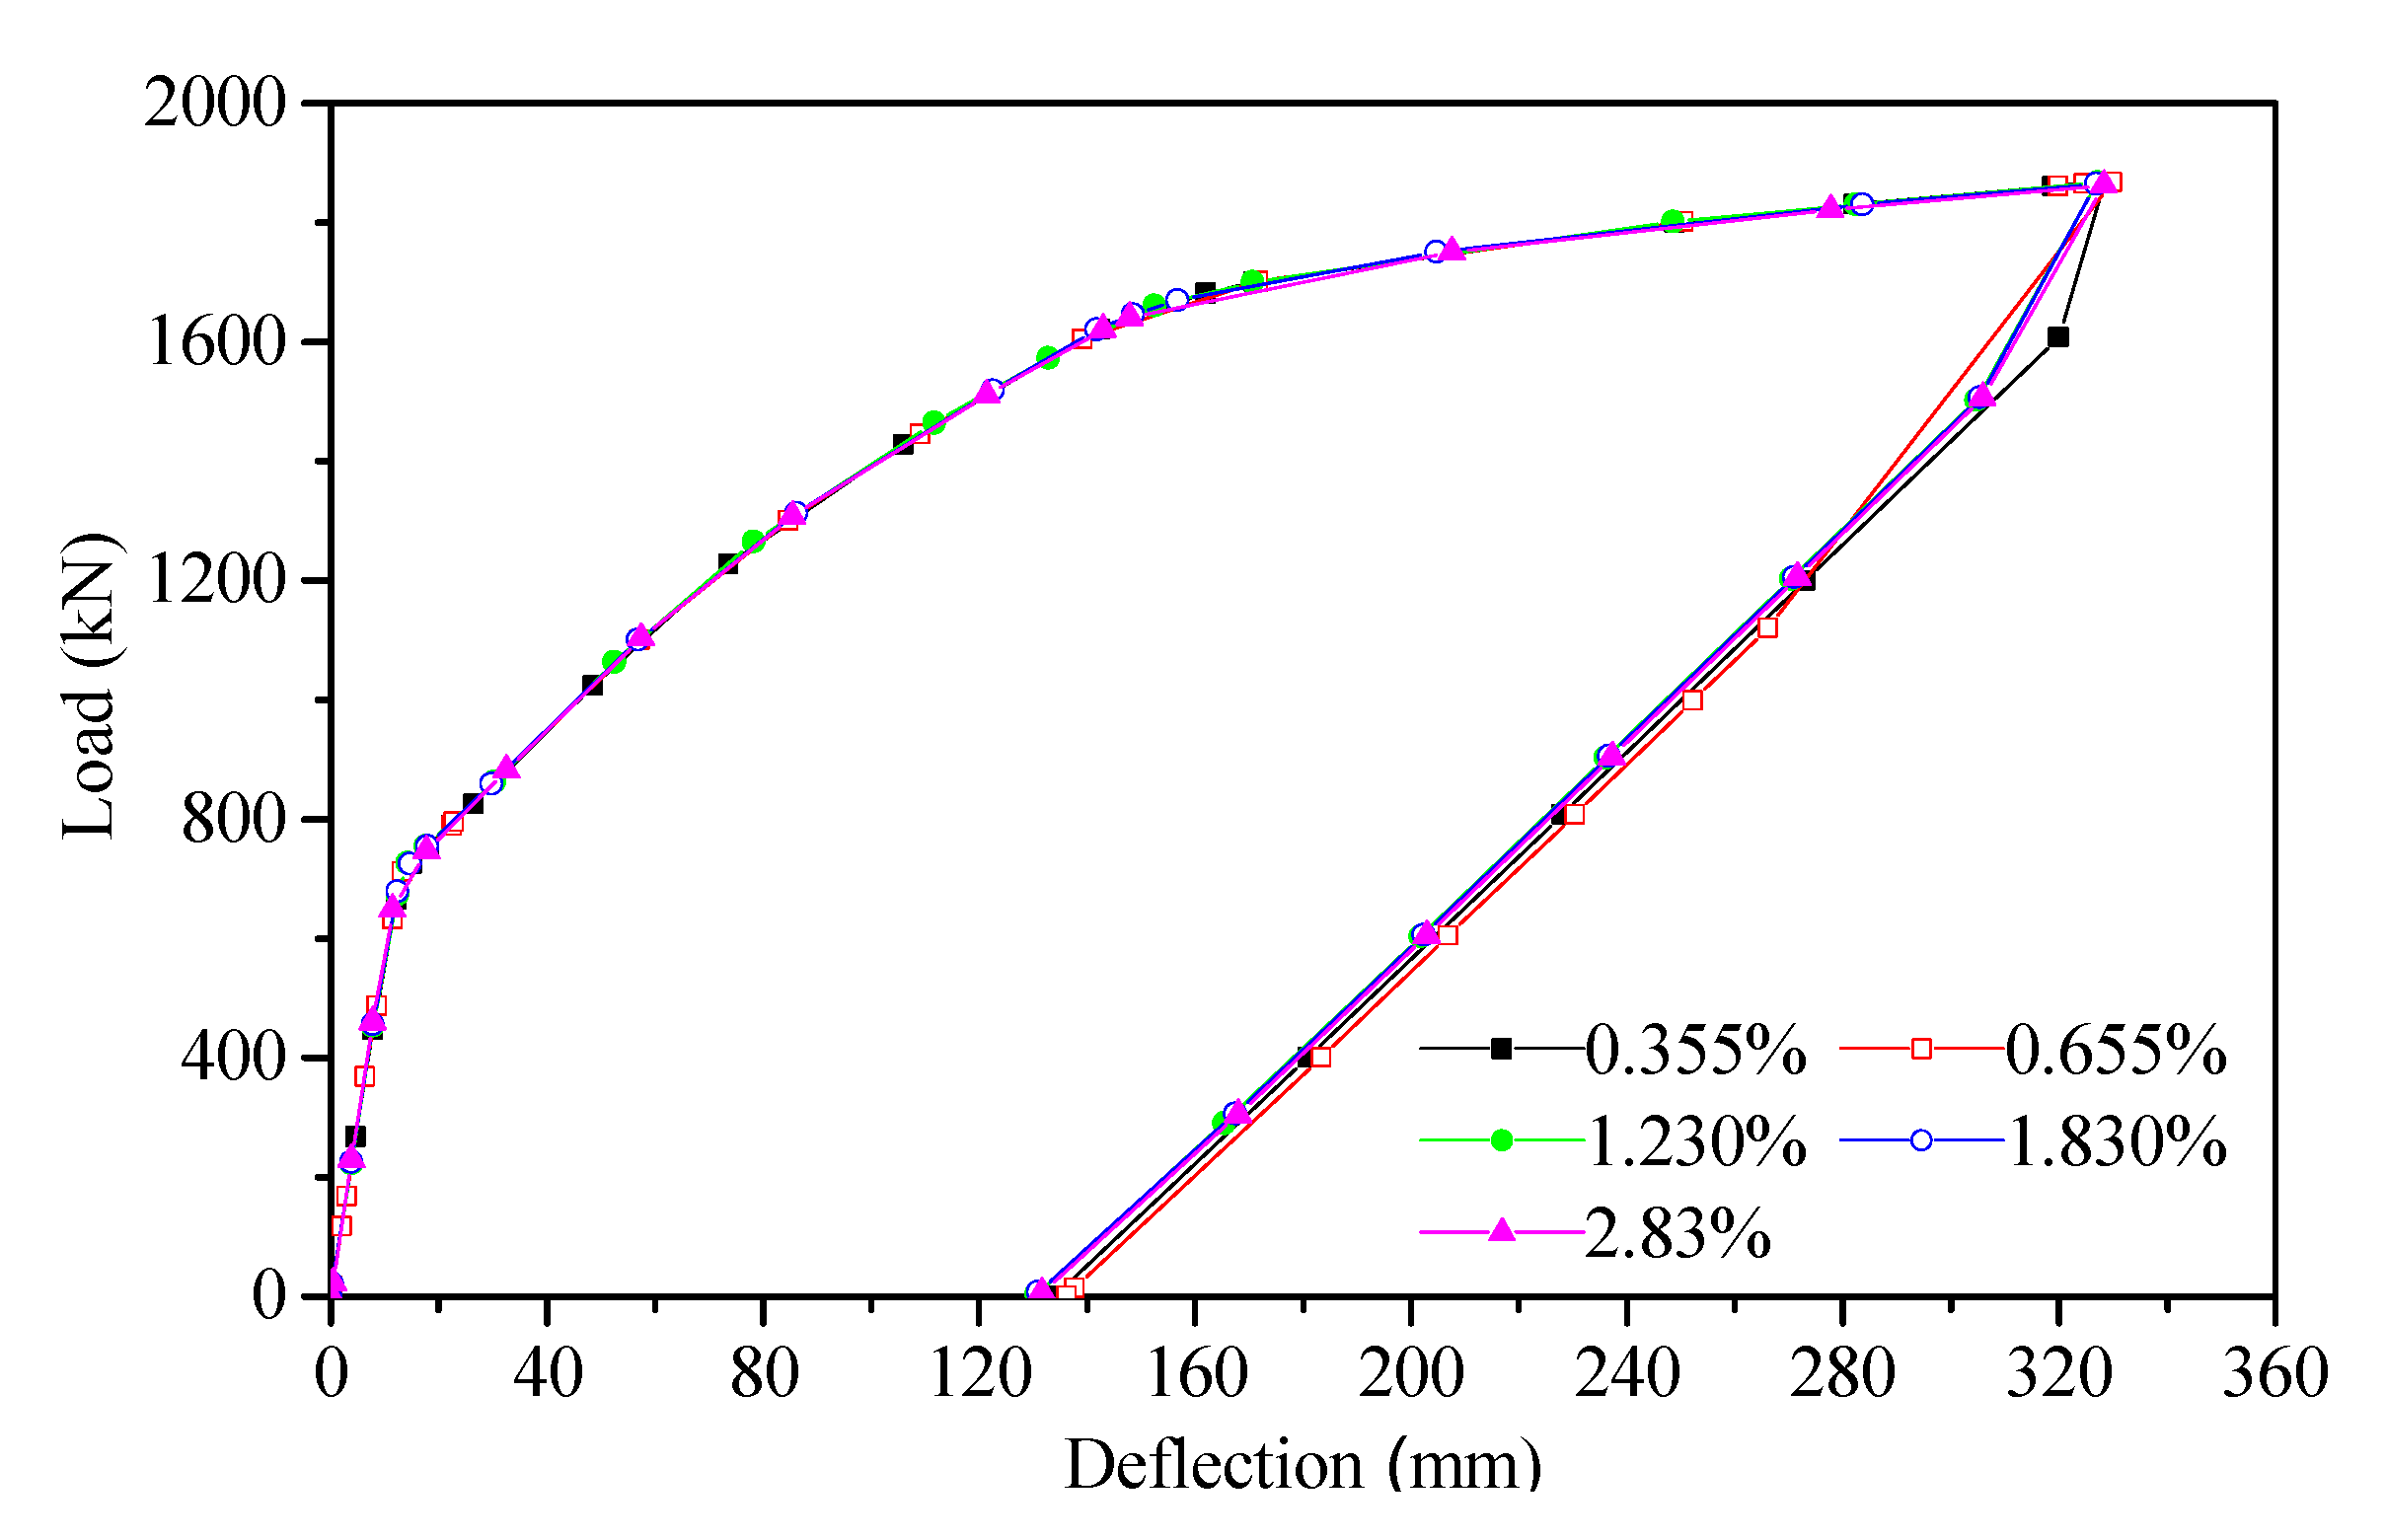
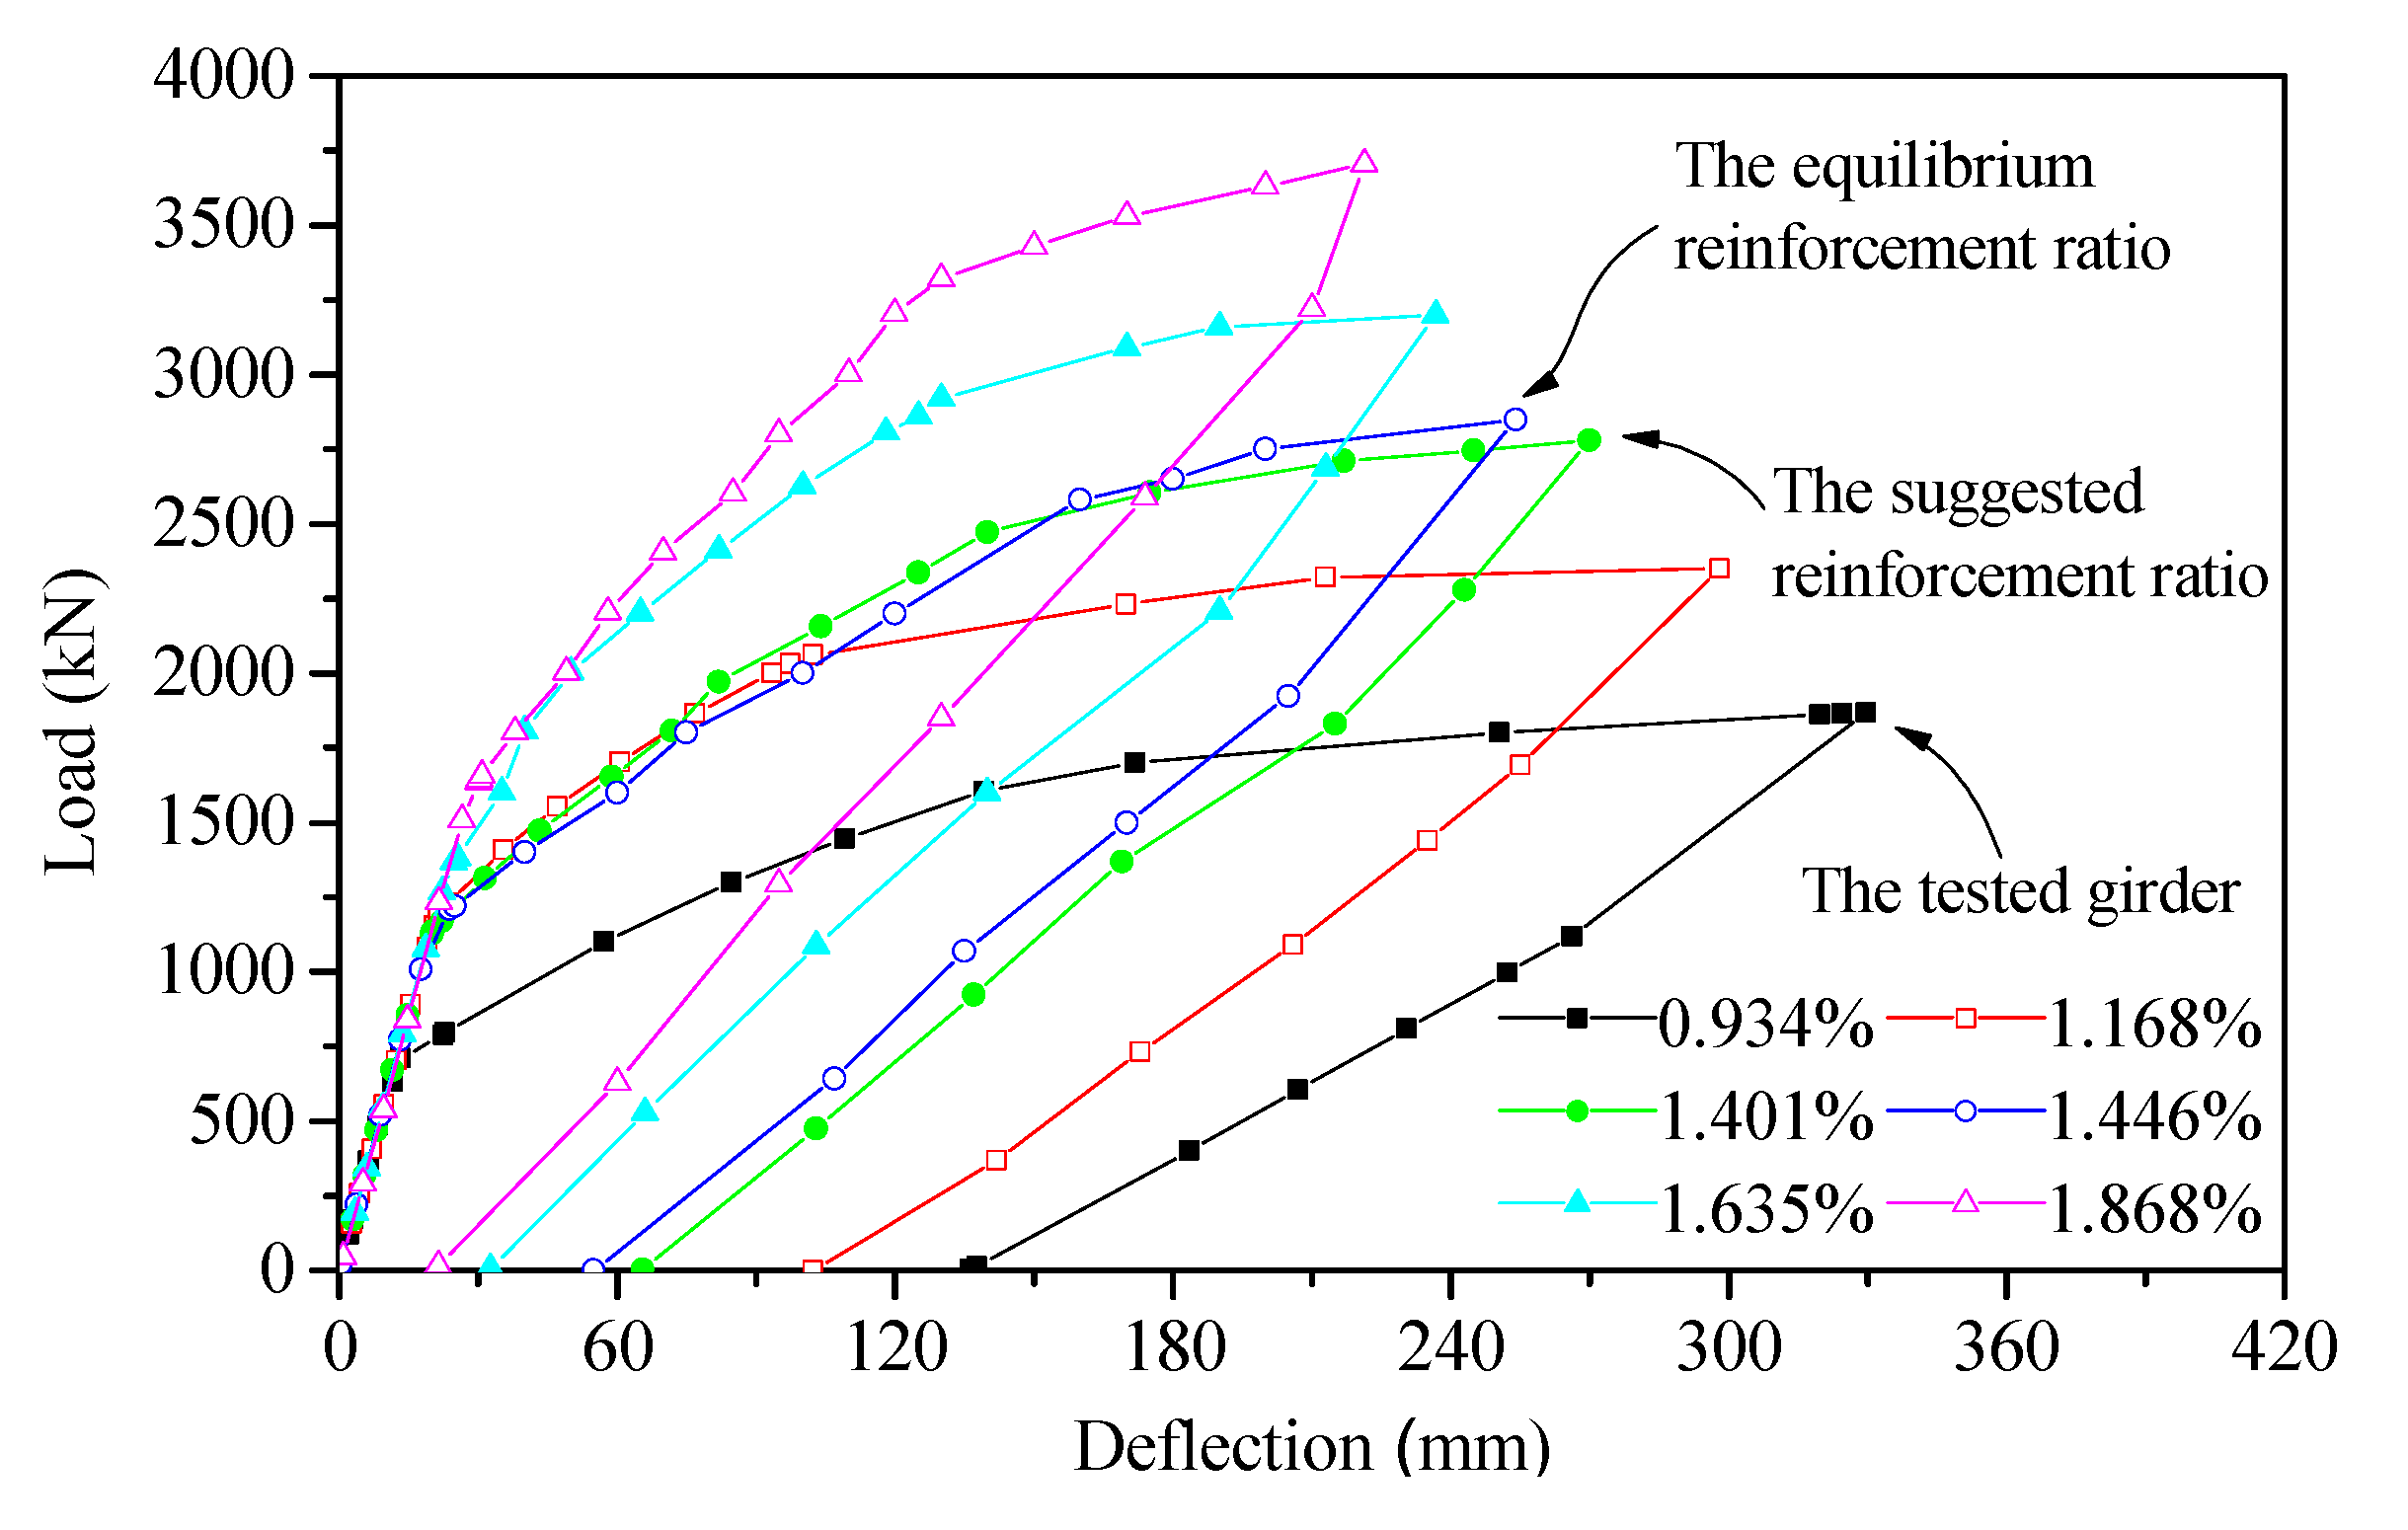
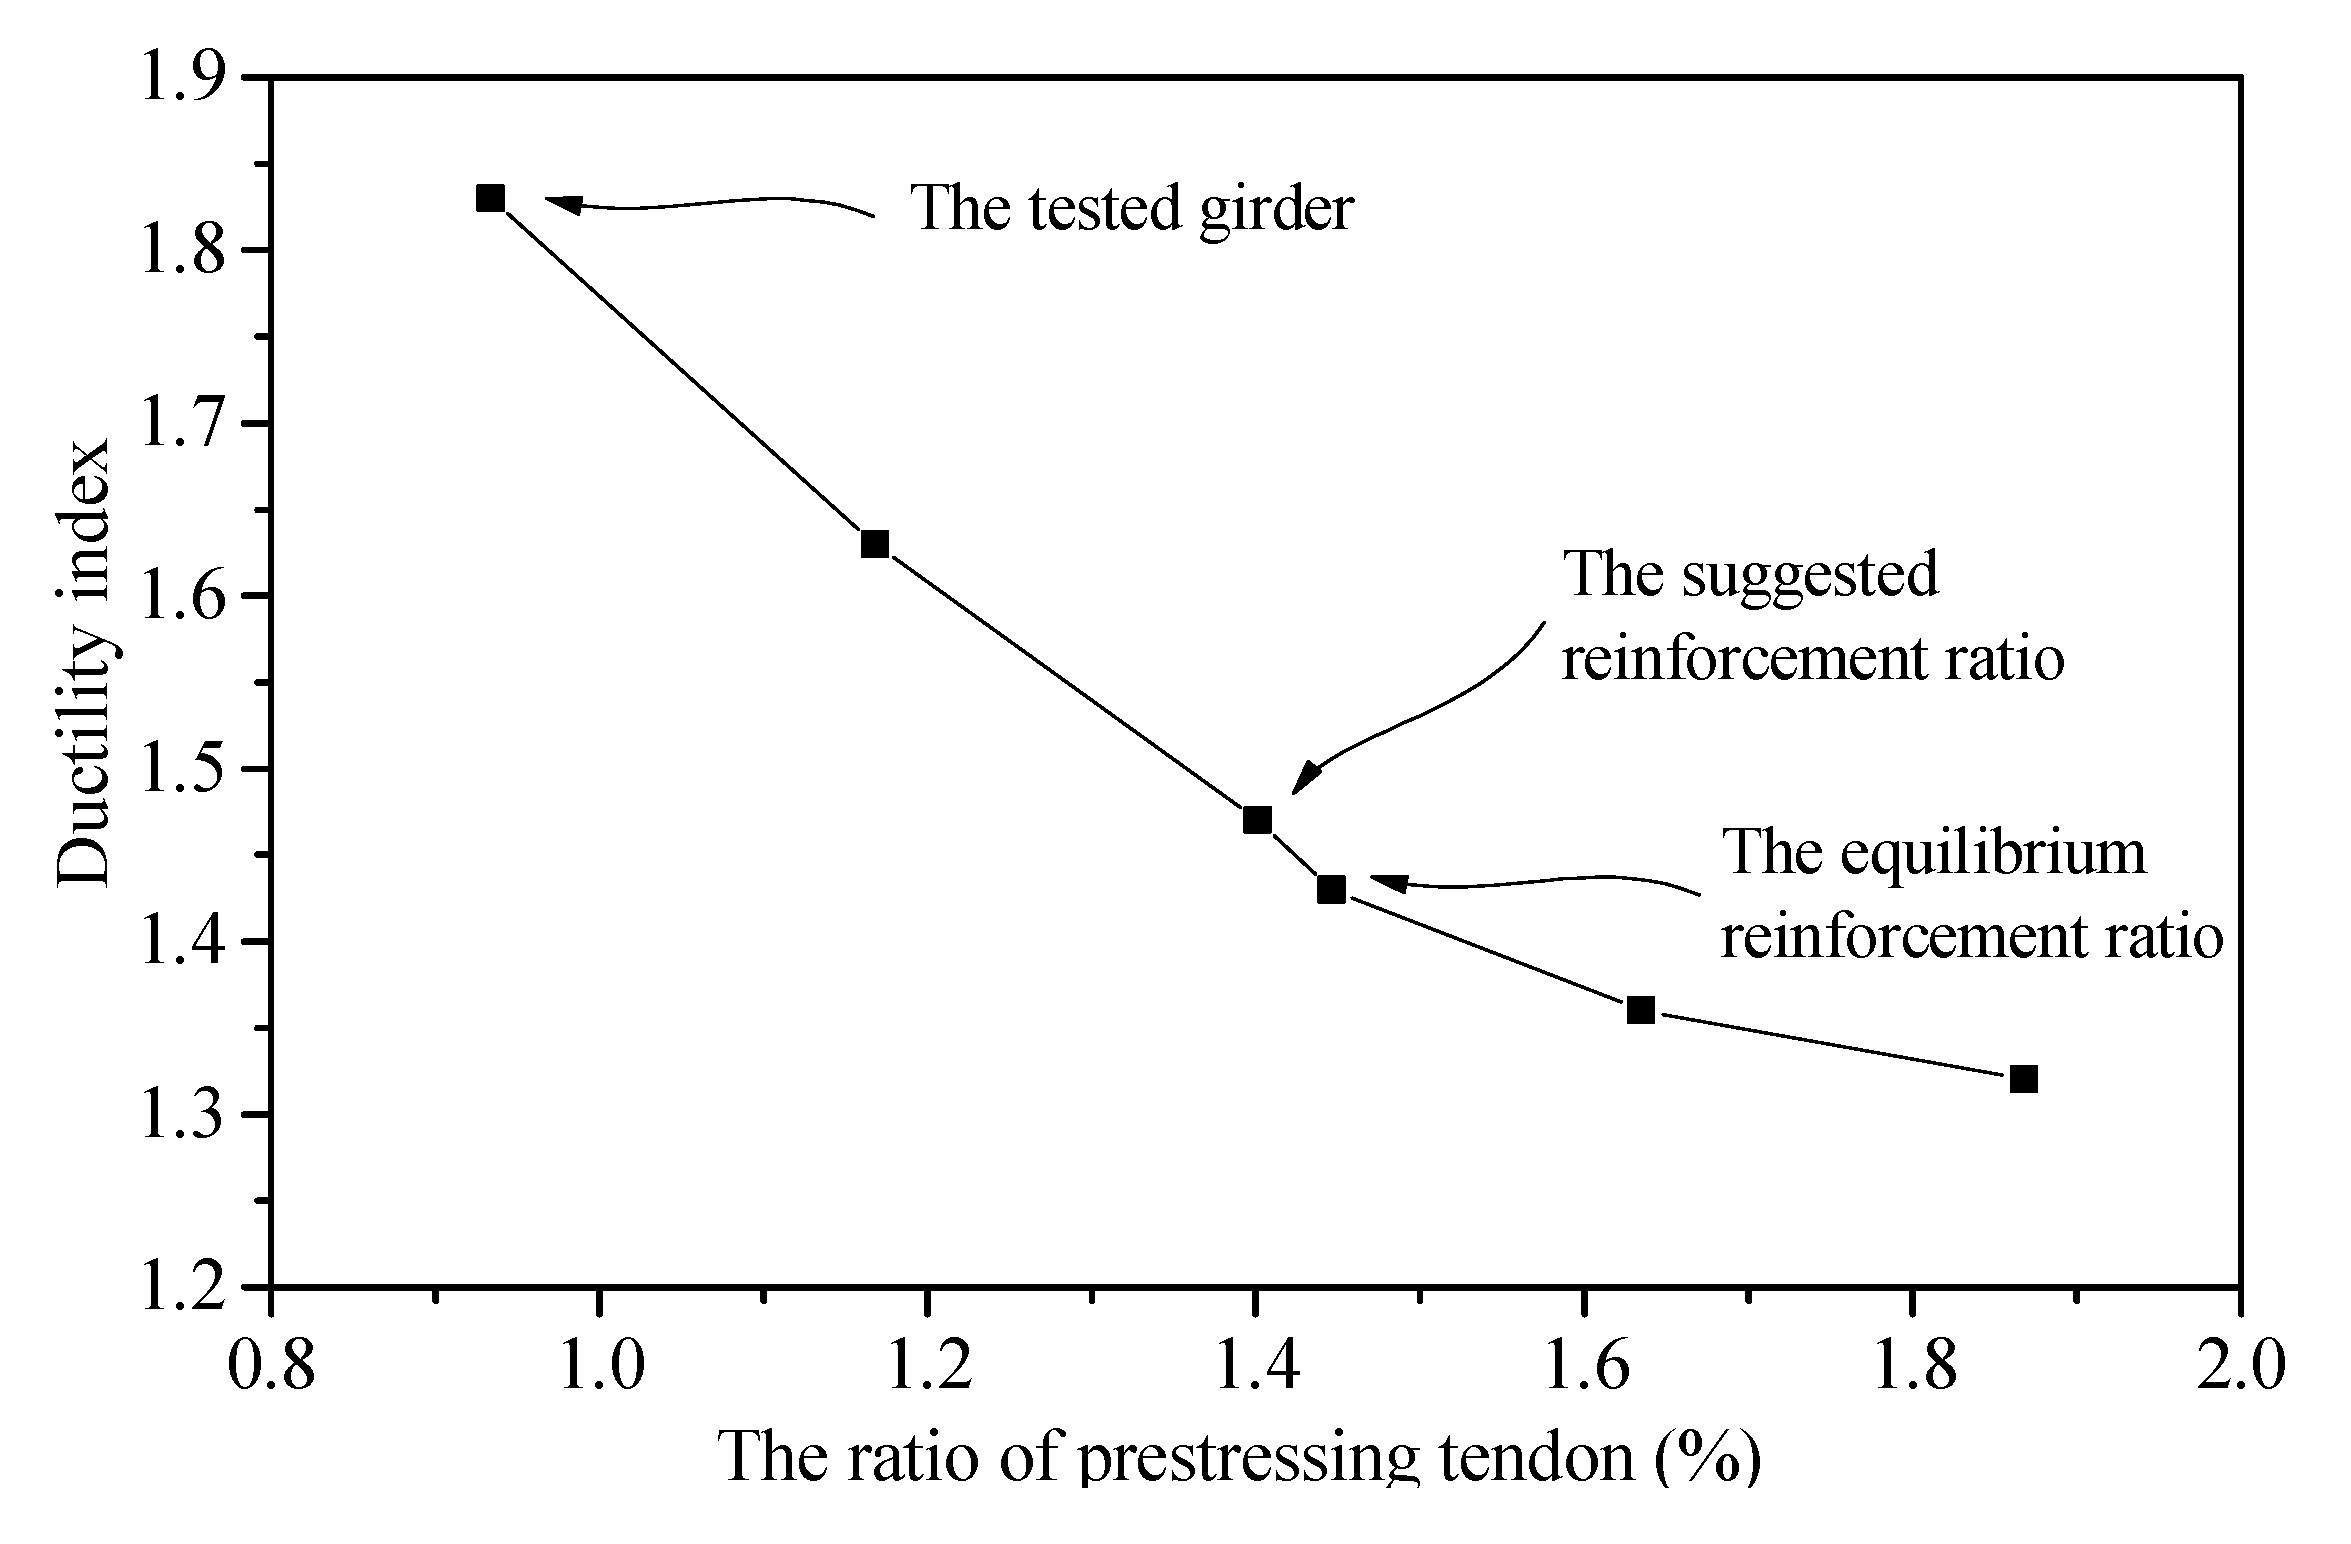
4.5.3. Prestressing Tendons
5. Conclusions
- (1)
- The failure mode of the tested girder was fracture of the prestressing tendon. The maximum compressive strain of concrete in the compression zone was only 1456, which is far less than the ultimate compressive strain (3300). Therefore, the concrete in the top flange was not fully utilized.
- (2)
- The maximum deflection was 1/102 of the span, and the ductility index of the tested girder was 1.99. Therefore, the tested girder possessed good ductility.
- (3)
- The measured cracking load was 750 kN, which is 1.98 times the applied load corresponding to the designed ultimate state of bearing capacity. Moreover, the measured maximum load was 1872 kN, which is 2.50 times the cracking load. It can be seen that the tested girder had a sufficient safety margin.
- (4)
- A nonlinear analysis procedure was performed using the FSM. The analysis procedure was demonstrated to be effective by comparing the analytical results with those of the tested girder and a laboratory-scale model.
- (5)
- The ratio of reinforcement in the compression zone has no obvious influence on the failure mode of the tested girder and can be ignored. The reinforcement in the tensile zone has a small effect on the bearing capacity and deformation of the tested girder, but has a large effect on the ductility index.
- (6)
- The ratio of prestressing tendons has an obvious influence on the bearing capacity, deformation, and ductility index. Considering the influence on the bearing capacity and ductility index of the structure, it is suggested that the ratio of prestressing tendons be increased to 1.041%. The prestressing tendons should thus be increased from four strands to six strands in each duct of the tested girder. After optimization of the prestressed reinforcement, the girder is ductile and the bearing capacity can be increased by 44.3%.
Author Contributions
Funding
Conflicts of Interest
References
- Navarro, I.J.; Yepes, V.; Martí, J.V. Life cycle cost assessment of preventive strategies applied to prestressed concrete bridges exposed to chlorides. Sustainability 2018, 10, 845. [Google Scholar] [CrossRef]
- Peng, J.; Hu, S.; Zhang, J.; Cai, C.S.; Li, L.Y. Influence of cracks on chloride diffusivity in concrete: A five-phase mesoscale model approach. Constr. Build. Mater. 2019, 197, 587–596. [Google Scholar] [CrossRef]
- Huo, L.; Li, C.; Jiang, T.; Li, H.N. Feasibility study of steel bar corrosion monitoring using a piezoceramic transducer enabled time reversal method. Appl. Sci. 2018, 8, 2304. [Google Scholar] [CrossRef]
- Xiao, L.; Peng, J.; Zhang, J.; Ma, Y.; Cai, C.S. Comparative assessment of mechanical properties of HPS between electrochemical corrosion and spray corrosion. Constr. Build. Mater. 2020, 237, 117735. [Google Scholar] [CrossRef]
- Yin, X.; Song, G.; Liu, Y. Vibration suppression of wind/traffic/bridge coupled system using multiple pounding tuned mass dampers (MPTMD). Sensors 2019, 19, 1133. [Google Scholar] [CrossRef] [PubMed]
- Wang, W.; Hua, X.; Chen, Z.; Wang, X.; Song, G. Modeling, simulation, and validation of a pendulum-pounding tuned mass damper for vibration control. Struct. Control Health Monit. 2019, 26, 2326. [Google Scholar] [CrossRef]
- Singh, Y.K.; Ray, D.S. Evaluation of vehicle damage factor in overloading for different types of loading. Int. J. Eng. Sci. 2019, 2019, 20327. [Google Scholar]
- Jang, B.; Mohammadi, J. Impact of fatigue damage from overloads on bridge life-cycle cost analysis. Bridge Struct. 2019, 15, 181–186. [Google Scholar] [CrossRef]
- Zhu, J.; Ho, S.C.M.; Kong, Q.; Patil, D.; Mo, Y.L.; Song, G. Estimation of impact location on concrete column. Smart Mater. Struct. 2017, 26, 055037. [Google Scholar] [CrossRef]
- Wang, F.; Song, G. Bolt early looseness monitoring using modified vibro-acoustic modulation by time-reversal. Mech. Syst. Signal Proc. 2019, 130, 349–360. [Google Scholar] [CrossRef]
- Kong, Q.; Robert, R.H.; Silva, P.; Mo, Y.L. Cyclic crack monitoring of a reinforced concrete column under simulated pseudo-dynamic loading using piezoceramic-based smart aggregates. Appl. Sci. 2016, 6, 341. [Google Scholar] [CrossRef]
- Alasadi, S.; Ibrahim, Z.; Shafigh, P.; Javanmardi, A.; Nouri, K. An experimental and numerical study on the flexural performance of over-reinforced concrete beam strengthening with bolted-compression steel plates: Part II. Appl. Sci. 2020, 10, 94. [Google Scholar] [CrossRef]
- Domski, J.; Zakrzewski, M. Deflection of steel fiber reinforced concrete beams based on waste sand. Materials 2020, 13, 392. [Google Scholar] [CrossRef] [PubMed]
- Peng, J.; Xiao, L.; Zhang, J.; Cai, C.S.; Wang, L. Flexural behavior of corroded HPS beams. Eng. Struct. 2019, 195, 274–287. [Google Scholar] [CrossRef]
- Zhou, L.; Zheng, Y.; Song, G.; Chen, D.; Ye, Y. Identification of the structural damage mechanism of BFRP bars reinforced concrete beams using smart transducers based on time reversal method. Constr. Build. Mater. 2019, 220, 615–627. [Google Scholar] [CrossRef]
- Biondini, F.; Frangopol, D.M. Life-cycle performance of civil structure and infrastructure systems: Survey. J. Struct. Eng. 2018, 144, 06017008. [Google Scholar] [CrossRef]
- Bremer, K.; Weigand, F.; Zheng, Y.; Alwis, L.S.; Helbig, R.; Roth, B. Structural health monitoring using textile reinforcement structures with integrated optical fiber sensors. Sensors 2017, 17, 345. [Google Scholar] [CrossRef]
- Seo, J.; Hu, J.W.; Lee, J. Structural health monitoring applications for highway bridges. J. Perform. Constr. Facil. 2016, 30, 04015072. [Google Scholar] [CrossRef]
- Zheng, L.; Cheng, H.; Huo, L.; Song, G. Monitor concrete moisture level using percussion and machine learning. Constr. Build. Mater. 2019, 229, 117077. [Google Scholar] [CrossRef]
- Wang, F.; Chen, Z.; Song, G. Monitoring of multi-bolt connection looseness using entropy-based active sensing and genetic algorithm-based least square support vector machine. Mech. Syst. Signal Proc. 2020, 136, 106507. [Google Scholar] [CrossRef]
- Liu, Y.; Zhang, M.; Yin, X.; Huang, Z.; Wang, L. Debonding detection of reinforced concrete (RC) beam with near-surface mounted (NSM) pre-stressed carbon fiber reinforced polymer (CFRP) plates using embedded piezoceramic smart aggregates (SAs). Appl. Sci. 2020, 10, 50. [Google Scholar] [CrossRef]
- Ye, X.F.; Chang, K.C.; Kim, C.W.; Ogai, H.; Oshima, Y.; Luna Vera, O.S. Flow analysis and damage assessment for concrete box girder based on flow characteristics. Sustainability 2019, 11, 710. [Google Scholar] [CrossRef]
- Huo, L.; Cheng, H.; Kong, Q.; Chen, X. Bond-slip monitoring of concrete structures using smart sensors—a review. Sensors 2019, 19, 1231. [Google Scholar] [CrossRef] [PubMed]
- Kong, Q.; Song, G. A comparative study of the very early age cement hydration monitoring using compressive and shear mode smart aggregates. IEEE Sens. J. 2016, 17, 256–260. [Google Scholar] [CrossRef]
- Kong, Q.; Fan, S.; Bai, X. A novel embeddable spherical smart aggregate for structural health monitoring: Part I. fabrication and electrical characterization. Smart Mater. Struct. 2017, 26, 095050. [Google Scholar] [CrossRef]
- Jiang, T.; He, B.; Zhang, Y.; Wang, L. Detecting of the longitudinal grouting quality in prestressed curved tendon duct using piezoceramic transducers. Sensors 2020, 20, 1212. [Google Scholar] [CrossRef]
- Mo, Y.L.; Luu, C.H.; Nie, X.; Tseng, C.C.; Hwang, S.J. Seismic performance of a two-story unsymmetrical reinforced concrete building under reversed cyclic bi-directional loading. Eng. Struct. 2017, 145, 333–347. [Google Scholar] [CrossRef]
- Chen, H.; Xu, B.; Mo, Y.L.; Zhou, T. Behavior of meso-scale heterogeneous concrete under uniaxial tensile and compressive loadings. Constr. Build. Mater. 2018, 178, 418–431. [Google Scholar] [CrossRef]
- He, X.; Sheng, X.; Scanlon, A.; Linzell, D.G.; Yu, X. Skewed concrete box girder bridge static and dynamic testing and analysis. Eng. Struct. 2012, 29, 38–49. [Google Scholar] [CrossRef]
- Luo, Q.; Wu, Y.; Tang, J.; Li, Q. Experimental studies on shear lag of box girders. Eng. Struct. 2002, 24, 469–477. [Google Scholar] [CrossRef]
- McClure, R.M.; West, H.H. Full-scale testing of a prestressed concrete segmental bridge. Can. J. Civ. Eng. 1984, 11, 505–515. [Google Scholar] [CrossRef]
- Shenoy, C.V.; Frantz, G.C. Structural tests of 27-year-old prestressed concrete bridge beams. PCI J. 1991, 36, 80–90. [Google Scholar] [CrossRef]
- Miller, R.; Parekh, K. Destructive testing of deteriorated prestressed box bridge beam. Transp. Res. Rec. 1994, 1460, 37–44. [Google Scholar]
- Scott, R.L. Structural Evaluation of LIC-310-0396 Box Beams with Advanced Strand Deterioration. Master’s Thesis, University of Cincinnati, Cincinnati, OH, USA, 2010. [Google Scholar]
- Labia, Y.; Saiidi, M.S.; Douglas, B. Full-scale testing and analysis of 20-year-old pretensioned concrete box girders. ACI Struct. J. 1997, 94, 471–482. [Google Scholar]
- Chung, W.; Kang, D. Full-scale test of a concrete box girder using FBG sensing system. Eng. Struct. 2008, 30, 643–652. [Google Scholar] [CrossRef]
- Huffman, J.M. Destructive Testing of a Full-Scale 43 Year Old Adjacent Prestressed Concrete Box Beam Bridge: Middle and West Spans; Ohio University: Athens, OH, USA, 2012. [Google Scholar]
- Su, J.Z.; Ma, X.L.; Chen, B.C.; Sennah, K. Full-scale bending test and parametric study on a 30-m span prestressed ultra-high performance concrete box girde. Adv. Struct. Eng. 2019, 2019, 1369433219894244. [Google Scholar] [CrossRef]
- Zhang, Y.; Fang, Z.; Jiang, R.; Xiang, Y. Static Performance of a Long-Span Concrete Cable-Stayed Bridge Subjected to Multiple-Cable Loss during Construction. J. Bridge Eng. 2020, 25, 04020002. [Google Scholar] [CrossRef]
- Deng, S.W.; Yan, B.F.; Wang, Y.; Li, H.L. Flexural performance of girder-to-girder wet joint for lightweight steel-UHPC composite bridge. Appl. Sci. 2020, 10, 1335. [Google Scholar] [CrossRef]
- Shi, Z.; Yang, S.; Pu, Q.; Zhang, Y. Fatigue performance of orthotropic steel decks in long-Span cable-stayed steel-box girder railway bridges. J. Bridge Eng. 2019, 24, 04019035. [Google Scholar] [CrossRef]
- Tu, B.; Dong, Y.; Fang, Z. Time-dependent reliability and redundancy of corroded prestressed concrete bridges at material, component, and system levels. J. Bridge Eng. 2019, 24, 04019085. [Google Scholar] [CrossRef]
- You, J.; Park, S.K.; Hong, S. Experimental study on the flexural behavior of steel-textile-reinforced concrete: Various textile reinforcement details. Appl. Sci. 2020, 10, 1425. [Google Scholar] [CrossRef]
- Ren, L.; Fang, Z.; Wang, K. Design and behavior of super-long span cable-stayed bridge with CFRP cables and UHPC members. Compos. Part. B Eng. 2019, 164, 72–81. [Google Scholar] [CrossRef]
- Jahangiri, S. Ultimate strength calculation and destructive modes extraction in a box girder model (with ANSYS). J. Math. Stat. Anal. 2019, 2, 1–14. [Google Scholar]
- Seo, J.; Hu, J.W. Simulation-based load distribution behaviour of a steel girder bridge under the effect of unique vehicle configurations. Eur. J. Environ. Civ. Eng. 2014, 18, 457–469. [Google Scholar] [CrossRef]
- Zhou, C.; Li, L.; Wang, L. Improved softened membrane model for prestressed composite box girders with corrugated steel webs under pure torsion. J. Constr. Steel Res. 2019, 153, 372–384. [Google Scholar] [CrossRef]
- Cheung, Y.K.; Lau, S.L. Incremental time-space finite strip method for non-linear structural vibrations. Earthq. Eng. Struct. Dyn. 1982, 10, 239–253. [Google Scholar] [CrossRef]
- Cheung, Y.K.; Li, W.Y.; Tham, L.G. Free vibration analysis of singly curved shell by spline finite strip method. J. Sound Vib. 1989, 128, 411–422. [Google Scholar] [CrossRef]
- Shi, J.; Shen, J.; Zhou, G.; Qin, F.; Li, P. Stressing state analysis of large curvature continuous prestressed concrete box-girder bridge model. J. Civ. Eng. Manag. 2019, 25, 411–421. [Google Scholar] [CrossRef]
- Tan, M.Y.; Cheng, W. Non-linear lateral buckling analysis of unequal thickness thin-walled box beam under an eccentric load. Thin Walled Struct. 2019, 139, 77–90. [Google Scholar] [CrossRef]
- Song, Y.; Li, J.; Chen, Y. Local and post-local buckling of normal/high strength steel sections with concrete infill. Thin Walled Struct. 2019, 138, 155–169. [Google Scholar] [CrossRef]
- Li, X.; Wan, S.; Mo, Y.L.; Shen, K.; Zhou, T.; Nian, Y. An improved method for analyzing shear lag in thin-walled box-section beam with arbitrary width of cantilever flange. Thin Walled Struct. 2019, 140, 222–235. [Google Scholar] [CrossRef]
- Mo, Y.L.; Jeng, C.H.; Krawinkler, H. Experimental and analytical studies of innovative prestressed concrete box-girder bridges. Mater. Struct. 2003, 36, 99–107. [Google Scholar] [CrossRef]
- MOTOC. Specifications for Design of Highway Reinforced Concrete and Prestressed Concrete Bridges and Culverts (JTG 3362-2018); Ministry of Transport of China: Beijing, China, 2018.
- Park, J.; Choi, J.; Jang, Y.; Park, S.K.; Hong, S. An experimental and analytical study on the deflection behavior of precast concrete beams with joints. Appl. Sci. 2017, 7, 1198. [Google Scholar] [CrossRef]
- Naaman, A.E.; Jeong, S.M. Structural Ductility of Concrete Beams Prestressed with FRP Tendons. In Non-Metallic (FRP) Reinforcement for Concrete Structures; Spon: Hamburg, Germany, 1995; pp. 379–386. [Google Scholar]
- Guo, Z. Principles of Reinforced Concrete, 1st ed.; Butterworth-Heinemann: Kidlington, Oxford, UK, 2014; pp. 19–42. [Google Scholar]
- Qi, H.; Li, G. The Uniaxial Constitutive Models of Reinforcemnt and Concrete for Nonlinear Dynamic Analysis. In Proceedings of the International Conference on Mechanics and Civil Engineering, Wuhan, China, 13–14 December 2014; pp. 162–165. [Google Scholar]
- Zhu, B.; Dong, Z. Nonlinearity Analysis for Reinforced Concrete Structure; Tongji University Press: Shanghai, China, 1985. [Google Scholar]
- Deng, L.; Ghosn, M.; Znidaric, A.; Casaa, J.R. Nonlinear flexural behavior of prestressed concrete girder bridges. J. Bridge Eng. 2001, 6, 276–284. [Google Scholar] [CrossRef]


| Cement | Fly Ash | Coarse Aggregate | Fine Aggregate | Water | Polycarboxylate Superplasticizers |
|---|---|---|---|---|---|
| 380 | 87 | 1078 | 705 | 152 | 5.60 |
| Age of Concrete (d) | Cubic Compressive Strength (MPa) | Prism Compressive Strength (MPa) | Modulus of Elasticity (MPa) |
|---|---|---|---|
| 28 | 64.2 | 48.1 | 4.22 × 10⁴ |
| 96 | 74.3 | 55.0 | 4.45 × 10⁴ |
| Type | Diameter (mm) | Yield Tensile Strength (MPa) | Ultimate Tensile Strength (MPa) | Modulus of Elasticity (MPa) |
|---|---|---|---|---|
| Prestressing tendon | Ø15.24 | 1740.8 | 1944.6 | 1.96 × 10⁵ |
| HPB235 | Ø10 | 286 | 472.3 | 2.1 × 10⁵ |
| HRB335 | Ø16 | 413 | 515.6 | 1.9 × 10⁵ |
| Load Case | Applied Load | Detail |
|---|---|---|
| 1 | 0→100 kN→0 | Loading to the self-weight of the girder and then unloading to eliminate the initial deformation and verify working condition of the instruments. |
| 2 | 0→133 kN→186→380→0 | Loading to the design serviceability limit state and design ultimate state of bearing capacity, then unloading. |
| 3 | 0→780 kN→0 | Loading until the first crack occurs, then unloading. |
| 4 | 0→1100 kN→0 | Loading until about 60% of ultimate bending capacity, then unloading. |
| 5 | 0→1300 kN→0 | Loading until about 70% of ultimate bending capacity, then unloading. |
| 6 | 0→1500 kN→0 | Loading until about 80% of ultimate bending capacity, then unloading. |
| 7 | 0→1600 kN→0 | Loading until about 85% of ultimate bending capacity, then unloading. |
| 8 | 0→1700 kN→0 | Loading until about 90% of ultimate bending capacity, then unloading. |
| 9 | 0→1800 kN→1872 kN→0 | Loading until the structure is about to fail, then unloading. |
| Load/kN | 750 | 1100 | 1200 | 0 | 1300 | 0 | 1450 | 0 | 1600 | 0 | 1700 | 0 | 1800 | 0 | 1872 | 0 |
|---|---|---|---|---|---|---|---|---|---|---|---|---|---|---|---|---|
| Crack width/mm | 0.01 | 0.20 | 0.38 | 0 | 0.44 | 0.01 | 0.6 | 0.02 | 1.0 | 0.04 | 1.2 | 0.1 | 3.0 | 0.18 | 6.0 | 0.40 |
© 2020 by the authors. Licensee MDPI, Basel, Switzerland. This article is an open access article distributed under the terms and conditions of the Creative Commons Attribution (CC BY) license (http://creativecommons.org/licenses/by/4.0/).
Share and Cite
Wang, J.; Tang, S.; Zheng, H.; Zhou, C.; Zhu, M. Flexural Behavior of a 30-Meter Full-Scale Simply Supported Prestressed Concrete Box Girder. Appl. Sci. 2020, 10, 3076. https://doi.org/10.3390/app10093076
Wang J, Tang S, Zheng H, Zhou C, Zhu M. Flexural Behavior of a 30-Meter Full-Scale Simply Supported Prestressed Concrete Box Girder. Applied Sciences. 2020; 10(9):3076. https://doi.org/10.3390/app10093076
Chicago/Turabian StyleWang, Jianqun, Shenghua Tang, Hui Zheng, Cong Zhou, and Mingqiao Zhu. 2020. "Flexural Behavior of a 30-Meter Full-Scale Simply Supported Prestressed Concrete Box Girder" Applied Sciences 10, no. 9: 3076. https://doi.org/10.3390/app10093076
APA StyleWang, J., Tang, S., Zheng, H., Zhou, C., & Zhu, M. (2020). Flexural Behavior of a 30-Meter Full-Scale Simply Supported Prestressed Concrete Box Girder. Applied Sciences, 10(9), 3076. https://doi.org/10.3390/app10093076