Abstract
In this paper, methods to estimate the number of basis vectors of the nonnegative matrix factorization (NMF) of automatic music transcription (AMT) systems are proposed. Previously, studies on NMF-based AMT have demonstrated that the number of basis vectors affects the performance and that the number of note events can be a good selection as the rank of NMF. However, many NMF-based AMT methods do not provide a method to estimate the appropriate number of basis vectors; instead, the number is assumed to be given in advance, even though the number of basis vectors significantly affects the algorithm’s performance. Recently, based on Bayesian methods, certain estimation algorithms for the number of basis vectors have been proposed; however, they are not designed to be used as music transcription algorithms but are components of specific NMF methods and thus cannot be used generally as NMF-based transcription algorithms. Our proposed estimation algorithms are based on eigenvalue decomposition and Stein’s unbiased risk estimator (SURE). Because the SURE method requires variance in undesired components as a priori knowledge, the proposed algorithms estimate the value using random matrix theory and first and second onset information in the input music signal. Experiments were then conducted for the AMT task using the MIDI-aligned piano sounds (MAPS) database, and these algorithms were compared with variational NMF, gamma process NMF, and NMF with automatic relevance determination algorithms. Based on experimental results, the conventional NMF-based transcription algorithm with the proposed rank estimation algorithms demonstrated enhanced F1 score performances of 2–3% compared to the algorithms. While the performance advantages are not significantly large, the results are meaningful because the proposed algorithms are lightweight, are easy to combine with any other NMF methods that require an a priori rank parameter, and do not have setting parameters that considerably affect the performance.
1. Introduction
Nonnegative matrix factorization (NMF) has been developed for use with signal processing systems, including audio and music signal processing systems [1]. Lee and Seung [2] introduced the NMF problem with a parts-based representation; moreover, an algorithm to solve the problem has been developed [3]. Because the NMF algorithm can be applied in various engineering fields, diverse algorithms have been developed to implement it [4]. The NMF algorithm has been applied to various signal- and image-processing fields such as signal separation [5,6] and hyperspectral unmixing [7,8].
Furthermore, the NMF algorithm is useful for music signal processing systems [9]. Because the NMF method is a parts-based representation, it can be applied to reduce the redundancy of spectrogram data and parse them into musical notes. Using this property, the NMF algorithm can be applied to various music-signal-processing systems, including automatic music transcription (AMT) [10,11].
NMF-based AMT algorithms perform relatively well for dealing with polyphonic music transcription (MT) tasks; however, the performance of such algorithms is affected by the number of basis vectors [9]. If the number of basis vectors is set to a value less than the actual number of note events, then the algorithm can fail and miss certain notes. If the number of basis vectors is set to a value greater than the number of actual note events, additional processing is required to select or group the correct answer from the excessively numerous basis vectors [9,12]. NMF-based algorithms demonstrate the best performance when the number of basis vectors and the number of note events are equal [9].
While setting the number of basis vectors is important for producing good results, most NMF-based music transcription systems assume that the correct value is available. Recently, multiple NMF algorithms including the estimation of the number of bases, using Bayesian inference [13], Gamma process statistics [14], and automatic relevance determination (ARD) [15], have been proposed. However, these algorithms have very high computational complexity, lack robustness in setting parameters, or show degraded performance because of a mismatch between the algorithm’s basic assumption and the music signal. Furthermore, because the conventional algorithms have the proper number of bases available after the NMF bases have been estimated, they cannot be combined with other NMF methods.
Recently, a model order estimation algorithm [16] has been developed for noisy principal component analysis (PCA) based on Stein’s unbiased risk estimator (SURE) [17]. Inspired by this study, we used the SURE method for performing rank estimation for NMF-based music transcription algorithms and focused on the similarity between order estimation for noisy PCA and rank estimation for NMF problems. A similar approach has been attempted in [18], but the method developed in [18] requires that all of the data be available simultaneously. Considering that several on-line NMF algorithms [19,20] have been developed to sequentially process large numbers of data or to be used in real-time systems, their application might be significantly limited because of that disadvantage. Thus, we would like to develop a rank estimation method that can be combined easily with existing NMF methods; consequently, the proposed algorithm uses as small a portion of the input music data as possible. Another SURE-based algorithm has been developed [21] but it is not suitable for music signal processing systems. This algorithm assumes that multiplying optimal NMF basis matrices is the same as that of the original data (i.e., there is no noise matrix), but music signal processing systems cannot satisfy that assumption.
In this study, a rank estimation algorithm, which is based on SURE, random matrix theory (RMT), and music onset information, for AMT is presented. To acquire estimation results that are suitable for a music signal, the proposed algorithm uses first and second onset information. The proposed method is similar to those of [16,18] wherein all algorithms are based on SURE; however, the algorithm for estimating the noise variance (which is crucial for properly estimating the model order) is different. The method in [16] performs a rough estimation of model order on the sole basis of RMT to estimate the noise variance, and the method in [18] uses a median filter to extract noise components without employing a probability model for noise eigenvalues. However, the proposed method uses the characteristics of NMF-based AMT methods (in particular, the fact that the NMF model has a rank of one at the first musical note or chord) and the Marchenko–Pastur (MP) probability model to enhance the NMF-based AMT methods, unlike conventional techniques.
2. Problem Description
2.1. NMF Algorithm
The NMF algorithm decomposes a nonnegative matrix into two nonnegative matrices and as
where is the field of matrices with K rows and N columns that contain nonnegative elements. Alternatively, the NMF model can be expressed in terms of a noise matrix as follows:
Algorithms for solving the NMF problem and for estimating the matrices and from the target matrix were developed in [3]. They comprise alternating estimation equations for each matrix:
with the constraints that and , where is a distance measure between the matrices and , is the element in the kth row and rth column of matrix , and means all of the elements of matrix .
Several “distance” measures, including the Euclidean distance and the Kullback–Leibler divergence, can be used to calculate . If the Euclidean distance is used, is defined as follows:
where is the Frobenius norm [3,22]. Through the application of the multiplicative update rule [3], and can be iteratively estimated as follows:
where ⊗ and ⊘ indicate element-wise multiplication and division, respectively.
2.2. Application of NMF to AMT
The NMF algorithm is used in AMT systems to decompose a music signal into multiple note events. The input music signal is transformed into magnitudes on a spectrogram, expressed as a nonnegative matrix . The NMF algorithm decomposes the magnitude spectrogram into two nonnegative basis matrices, and , representing the frequency and time bases, respectively.
Figure 1 and Figure 2 show examples of the application of the NMF algorithm for music signal processing. Figure 1 shows the spectrogram of a selection from Cello Suite No. 1 Prelude by J. S. Bach (BWV 1007) comprising the notes F2, C3, A3, and G3. An example showing the application of the NMF algorithm to the music signal is shown in Figure 2. Figure 2a shows a set of column vectors of , and Figure 2b shows a set of row vectors of . As noted in previous studies [9,23], good estimates of the matrices and indicate the frequency structures and time envelopes of the musical notes in the signal, respectively. Figure 2 shows that the column vectors of indicate the frequency structures of C3, F2, G3, and A3, and that the row vectors of indicate the time envelopes of the same notes, respectively.
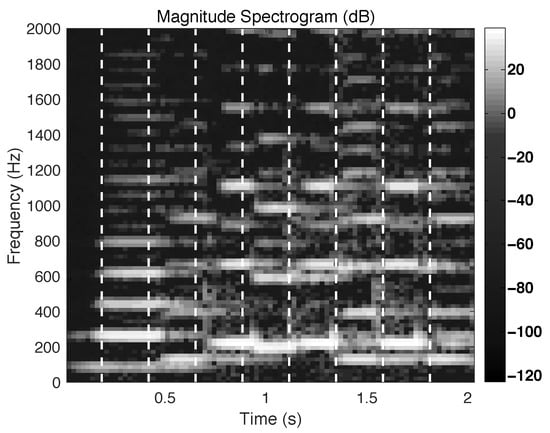
Figure 1.
Spectrogram of a selection from Cello Suite No. 1 Prelude by J. S. Bach (BWV 1007) consisting of the notes F2, C3, A3, and G3. Vertical dashed lines indicate the starting points of every tenth frame.
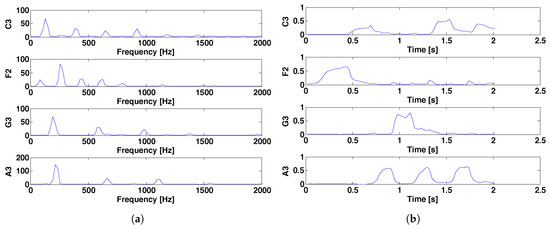
Figure 2.
Example of nonnegative matrix factorization (NMF) analysis results in terms of (a) the column vectors of and (b) the row vectors of .
If R is not optimal, then the desired result cannot be obtained (Figure 2). Figure 3 shows the results obtained when R is greater than the number of notes (); the target signal is the same as that in Figure 2. Compared with Figure 2, Figure 3 contains redundant information, namely, the third and fourth basis vectors in both and . Similarly, Figure 4 shows the results obtained when R is excessively small (). The decomposed basis cannot describe the characteristics of each musical note, with the consequence that the results do not yield any musically useful information. Based on these examples, an appropriately selected number of basis vectors is essential for obtaining useful results.
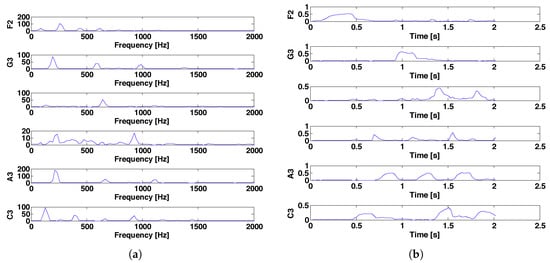
Figure 3.
Example of NMF analysis for (a) the column vectors of and (b) the row vectors of , when the number of basis vectors is excessively large.
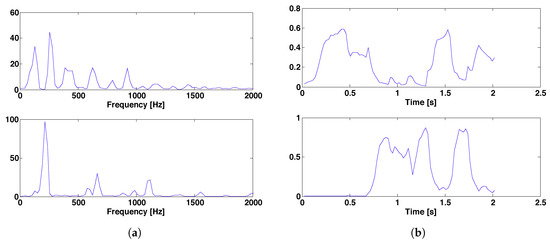
Figure 4.
Example of the NMF analysis results for (a) the column vectors of and (b) the row vectors of when the NMF is excessively small.
3. Method for Estimating the NMF Rank
3.1. Rank Estimation Using Stein’s Unbiased Risk Estimator
If we define , NMF Model (2) can be rewritten as follows:
According to the work of Smaragdis and Brown [9] and the example shown in Section 2, a well-decomposed basis corresponds to a musical note event. Because different musical notes have different fundamental frequencies () and because the spectrum of a note event forms a harmonic line spectrum comprising (n is an integer), the columns of the matrix are linearly independent (Figure 5). Hence, the nonnegative ranks of all of the matrices , , and are equal to R. Therefore, the estimation of the number of basis vectors is the same as the estimation of a nonnegative rank in a noisy environment. Unfortunately, the estimating of the nonnegative rank is NP-hard problem [24]. Because the rank and the nonnegative rank are related (the matrix rank is the lower bound of the nonnegative rank [25]), we decide to estimate the rank instead of the nonnegative rank.
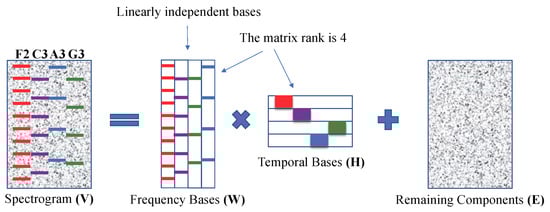
Figure 5.
Illustrative diagram for the NMF model and matrix rank ().
If we assume that the rank of is R, has R non-zero eigenvalues but has more than R non-zero eigenvalues because of . Therefore, the rank estimation problem is the same as the problem of identifying R signal eigenvalues in a noisy environment, which can be handled using noisy principal component analysis (PCA). The SURE algorithm is a well-known method for model order estimation in the noisy PCA problem; it selects the model order as the value that minimizes a risk function. To apply the SURE method to the NMF problem, Model (2) can be rewritten as follows:
where , , , and are the nth columns of , , , and , respectively. n denotes both the column index and the discrete-time index. The SURE method selects the model order R, which is same as the number of column vectors of the matrix that minimizes the risk function [16,18]
where , provides the estimation of , and is the variance of . and represent the expectation and the L2-norm, respectively, K is the length of the vector , and indicates the transpose of . According to Stein’s lemma [26], the second term has the relationship [18]
where represents the trace operator of a matrix, if we assume that has a Gaussian distribution. Because and , (11) can be expressed as follows:
Therefore, the risk function becomes
If the stochastic processes are assumed to be ergodic processes [18], the ensemble average can then be converted to the time average. If we consider the time average of the whole data , rather than the ensemble average, then (13) would be
According to previous studies of noisy PCA, if has the matrix rank R in Model (2), then can be expressed by R eigenvalues and eigenvectors of as [16]
where is the jth eigenvalue and is the jth eigenvector of . Furthermore, can be calculated using the maximum likelihood estimator as [16]
Because we require the expressions of the partial derivatives in the second term of (14), we calculate the partial derivative of (15) with respect to as follows:
where .
Based on the theorem for the derivatives of eigenvectors [16], the partial derivative of the eigenvector can be expressed as [18]
with the result that the trace of the partial derivative is
Moreover, the partial derivative of the eigenvalue is as follows:
The detailed derivation of (21) is the same as that in the Appendix of [18]. Finally, dropping the parts that do not depend on R,
The risk function can be calculated via (22) using the eigenvalues of the data if the noise variance is known. Therefore, determining the noise variance exactly is required to apply the SURE method to our problem. In the next section, we develop the noise variance estimation method based on random matrix theory and the properties of the NMF-based AMT method.
There is one more fact to take note of. Stein’s lemma (11) assumes that has a Gaussian distribution; however, the actual distribution of is not exactly Gaussian but is more similar to the Laplace distribution. Unfortunately, developing the SURE method for the Laplace distribution is very difficult, so we decide to use the Gaussian assumption here and to leave the development of the algorithm for the Laplace distribution for a future work.
3.2. Noise Variance Estimation
While the detailed derivation process differs from the method in [16], the developed results (22) are similar to those of SURE-based algorithm in [16,18]. However, (22) requires noise variance information, which has a significant impact on performance. To estimate the noise variance, the method used in [16] crudely estimates the rank based on the probability model, and that used in [18] performs noise-component extraction based on the median filtering. While neither of these methods use any characteristics of NMF-based AMT techniques, this study proposes a new noise variance method by considering such characteristics.
As per random matrix theory, noise eigenvalues follow a Marchenko–Pastur (MP) density [16,27]. The MP density for is
and for or , where
and . According to [16,27], the largest noise eigenvalue converges as
Furthermore, the median value satisfies the relationship [16]
where is a median value of a set C, is the inverse of the cumulative distribution function for the MP distribution, and is a smaller value of K and N.
Consequently, if we know the maximum noise eigenvalue, we can estimate from that eigenvalue. Generally, it is necessary to know the value of R to determine the maximum noise eigenvalue . Thus, model order estimation algorithms based on SURE and RMT use the following strategy: 1. Perform a crude estimation of R. 2. Identify the parameters of the MP distribution for the noise eigenvalues. 3. Estimate . 4. Perform a precise estimation of R using the SURE method [16].
In the proposed algorithm, using the note onset information, the MP distribution parameters are determined. As previously mentioned, the number of NMF basis vectors and the number of note events is the same, and there is only one note event between the first onset and the second onset. Thus, for the data before the second onset. If we define the partial correlation matrix as
then has only one signal eigenvalue (), and the remaining eigenvalues (, , ⋯) correspond to the remaining components when is the frame number between the first and second onsets. Therefore, we estimate the MP distribution parameters from this period if we can assume that the parameters—the maximum and median values of noise eigenvalues—do not quickly change over time.
To verify this assumption, we consider the example shown in Figure 1, where the first onset of the input music signal occurs in the tenth frame and the second onset is in the 22nd frame. Therefore, the appropriate number of basis vectors is for the data from the first to 21st frames because there is only one note event. Figure 6 and Figure 7 show the eigenvalues of the data matrix obtained from the music signal in the example where “x” and “o” denote the signal and noise eigenvalues, respectively; the horizontal axis shows the index of an eigenvalue; and the vertical axis shows its magnitude. Figure 6 shows the eigenvalues of the data from the first frame to the 21st frame (0.46 s), and Figure 7 shows the eigenvalues of the overall data (2.00 s). Using the partial correlation matrix mentioned above, Figure 6 and Figure 7 show the eigenvalues of and , respectively.
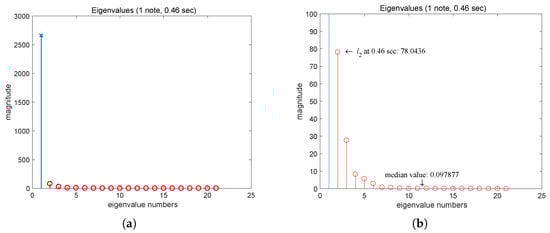
Figure 6.
Eigenvalues of for the data from : (a) Full-scale display, (b) scaled display for noise eigenvalues, where “x” denotes a signal eigenvalue and “o” denotes a noise eigenvalue.
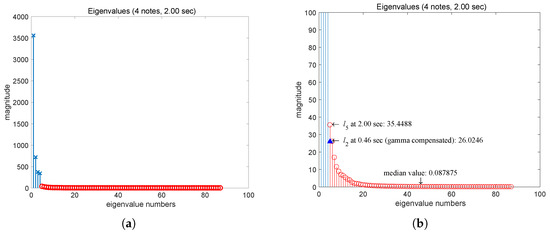
Figure 7.
Eigenvalues of for all of the data (): (a) Full-scale display, (b) scaled display for noise eigenvalues, where “x” denotes a signal eigenvalue and “o” denotes a noise eigenvalue.
Figure 6a shows that a large eigenvalue corresponds to the signal , and 20 small eigenvalues correspond to the remaining components . The remaining eigenvalues are not shown in the graph because their values are zero, agreeing with the theory in [27]. Figure 7a shows that four large eigenvalues correspond to the signal , and 83 small eigenvalues correspond to the remaining noisy components. Figure 6b and Figure 7b show the eigenvalues within the range of 0–100 for comparison with the noisy signal properties. Comparing the “o” marks and the “+” marks in the Figure 7b, the graph shows that the noise eigenvalues of the data for and have similar properties, i.e., maximum value, median value, and shape.
Because is different when and , the maximum noise eigenvalue is different even if is the same. If we compensate the difference of between two points, the magnitude of , 78.04, is equivalent to the value, 26.02, when . While the maxima of the noise eigenvalues are not exactly the same, the difference between the noise eigenvalues of the data for and is very small ( 9.4 if we compensate for the change of ) compared to the differences between the magnitudes of the signal eigenvalues and the noise eigenvalues for each data case. The difference between the median values is small. Thus, this data can be used to make a crude estimation of the MP distribution parameters and .
We defined as the frame number for an arbitrary frame between the first and the second onset frames. If there is only one note in , as shown in the example, is a rank-1 matrix. Even if multiple notes are played simultaneously at the first onset-it is generally a chord- can be expected to be a rank-1 matrix because the notes possess the same time basis vector as shown in Figure 8 [9]. Therefore, has noise eigenvalues of , which correspond to the remaining components.
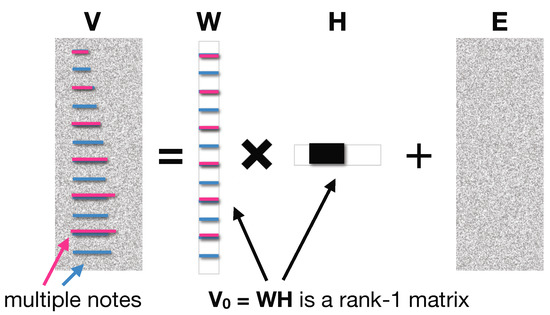
Figure 8.
Illustrative diagram of the NMF model for the case in which a chord is played at the first onset.
From the relationship of (26) or (27), we can estimate the noise variance by using either the maximum or the median values of the noise eigenvalues. Consequently, we propose two algorithms. In the first, the noise variance is estimated as follows:
using the maximum value of the noise eigenvalues. In the second version, the noise variance is estimated as follows:
using the median value, because the MP distribution has the property of [16]. Algorithm 1 shows a summary of the proposed algorithm.
Because the proposed methods were developed based on the characteristics of the AMT method, they may not be applied to other NMF-related tasks. However, the key idea is to determine the noise variance using part of the data. This is possible when the task’s characteristics can be used to find a suitable rank for part of the signal. Therefore, if we can find the proper characteristics of a target task, the proposed methods can be extended to other NMF-related tasks.
| Algorithm 1 Rank Estimation with SURE (RESURE) |
| Require: Spectrogram , second onset frame number N. |
An onset detection algorithm must be used to determine the first and second onset frames. Many studies have proposed successful onset detection algorithms [28,29], but developing such an algorithm is beyond this study’s scope.
4. Simulation
4.1. Experimental Settings
To evaluate the proposed algorithm, the numbers of basis vectors were estimated in AMT experiments, performed with piano music signals. The test dataset consisted of signals from the “AkPnCGdD” dataset of the MIDI-aligned piano sounds (MAPS) database [30]. The test signals comprised 30 piano-music signals with a sampling frequency of 44,100 Hz and 16-bit quantization, truncated at 30 s. The signals were transformed into two-dimensional data through a constant-Q transform [31] with 24 frequency bins per an octave from 27.5 Hz to the half of the sampling frequency.
We compared the proposed algorithm with conventional NMF algorithms that estimate the number of basis vectors, including variational NMF (VAR-NMF) [13], NMF with automatic relevance determination (ARD-NMF) [15], and gamma process NMF (GaP-NMF) [14] algorithms. VAR-NMF was performed with the initial hyperparameters and , and the hyperparameters were optimized using the algorithm proposed in [13] with tying parameters. The parameters of the ARD-NMF algorithm were , , and ; and the parameters of the GaP-NMF algorithm were set at , , and , which obtain the best performance. To determine the proper parameter values, we started from the values in the original papers and then searched for the optimal parameters around those values.
The compared algorithms possessed their own estimation algorithms for the NMF basis vectors, but the proposed algorithm could be combined with any algorithm to estimate the NMF basis vectors. In this experiment, the NMF algorithm with temporal continuity and sparseness criteria, proposed by Virtanen [1], was used to estimate the NMF basis vectors after applying the proposed algorithm, with the parameters and . Information on the first and second onset was extracted from the MIDI data included in the database.
The estimation algorithms were evaluated by measuring the AMT performances. These performances were evaluated in accordance to the segment-based F1-score. All clips were segmented by 0.1 s, and the F1-score was calculated using the following equations:
where is the number of correct pitches (true positives), is the number of incorrect pitches (false positives), and is the number of missing pitches (false negatives). The pitch information of an NMF frequency basis was estimated using the subharmonic summation [32], and the onset and offset were calculated from the NMF temporal basis using a threshold that is defined by the average plus standard deviation of each basis.
4.2. Experimental Results
As per previous studies [9], the optimal number of bases might be related to the number of note events, as mentioned in Section 2. Therefore, we first compare the estimated number of bases of each algorithm and evaluate the performance based on the number of actual note events. To compare the overall performance, we verify the distribution of the absolute values of errors, as shown in Figure 9. The vertical lines indicate the range between the smallest and largest errors, and the boxes indicate the quartiles: The top and bottom of the box indicates the third and first quartiles, and the horizontal bar in the middle of the box indicates the median value. As expected, smaller values indicate better performance. The graph demonstrates that the ARD-NMF algorithm has the best performance among the conventional algorithms. The result of the proposed RESUREv2 algorithm (1st quartile: 3.25, median: 8.5, 3rd quartile: 13) is slightly better than that of the ARD-NMF algorithm (1st quartile: 4.25, median: 9.0, 3rd quartile: 16).
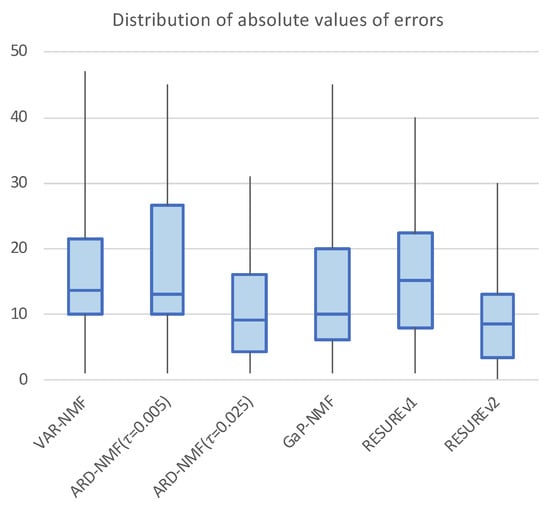
Figure 9.
Distribution of absolute values of the estimation errors based on the number of notes. The top and bottom of the box indicate the third and first quartiles, and the horizontal bar within the box indicates the median value. The ends of the vertical bar indicate the maximum and minimum values.
The detailed results of the estimated NMF ranks for the database are shown in Table 1. The underlined bold number indicates the result closest to the number of musical notes for each clip, and the (highlighted) green value indicates a result with an error within of the number of musical notes. The results demonstrate that ARD-NMF (with a of ) performs best among the conventional algorithms, and the performance of the RESUREv2 algorithm is similar to or slightly better than that of the ARD-NMF algorithm. While the ARD-NMF performance is affected by the parameter (comparing the and cases), the proposed algorithm does not contain any parameters. This is a further advantage of the proposed algorithm.

Table 1.
Estimated NMF ranks for 30 test signals. The underlined bold number indicates the result closest to the number of musical notes for each clip, and the (highlighted) green value indicates a result with an error within of the number of musical notes.
While the RESUREv2 algorithm works well for many audio clips, it greatly overestimates the estimation results in some clips such as # 11, # 23, # 27. These clips have in common that the interval between the first and second onset times is excessively short (100 ms). In those cases, the RESUREv1 shows better performance compared to RESUREv2. While we cannot generalize with only three cases, we expect that the RESUREv1 algorithm might improve the RESUREv2 algorithm with small intervals between the first and second onsets despite the poor performance of the RESUREv1 algorithm overall.
While several studies have demonstrated that the actual number of notes might be related to the optimal NMF rank for the matrix-factorization-based AMT method [9], they cannot guarantee that the number of notes is the best selection for the NMF rank. Therefore, we measure the AMT performance to evaluate the rank estimation performance. The detailed settings for evaluating the AMT performance are discussed in Section 4.1. The F1-score results are shown in Figure 10. While the differences of F1-score performances between the algorithms are not as noticeable as the number of notes estimation performance, the algorithm whose estimated rank is close to the number of notes shows better F1-score performance. ARD-NMF performs best (1st quartile: 40.89, median: 43.23, 3rd quartile: 48.63) among the conventional algorithms, and the RESUREv2 algorithm performs slightly better (1st quartile: 41.20, median: 45.61, 3rd quartile: 51.25) compared to ARD-NMF. Just as in the case of the rank estimation results, the ARD-NMF F1-score results are similar to those of the RESUREv2, but the ARD-NMF performances are affected noticeably by the parameter . The proposed algorithm’s F1-score advantages (which represent an improvement of approximately 2%–3% over the conventional algorithm), are not considerably large. However, the proposed algorithm neither specifies a particular NMF method, nor requires sensitive design parameters; therefore, it is meaningful that its performance is improved, rather than degraded.
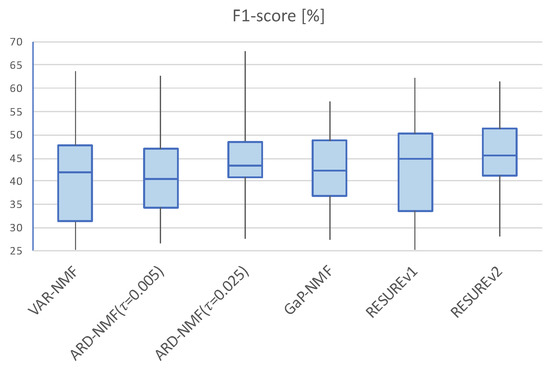
Figure 10.
Box plots for the F1-score performances. The top and bottom of the box indicate the third and first quartiles, respectively, and the horizontal bar inside the box indicate the median value. The ends of the vertical bar indicate the maximum and minimum values.
To analyze the rank estimation and F1-score results, we plot the precision and recall of each algorithm (RESUREv2, ARD-NMF, GaP-NMF) versus the differences between the estimated ranks of the algorithms and the numbers of musical notes in audio clips, as shown in Figure 11. The x-axis of each graph indicates the estimated rank minus the number of notes. The graph demonstrates that the small estimated ranks tend to have high precision and low recall and vice versa. However, certain extremely small ranks (indicated by the dashed red circle in Figure 11a) cause low precision and recall performances. In our view, the proposed algorithm avoided severely underestimating the rank that causes both low precision and recall, resulting in better performance.
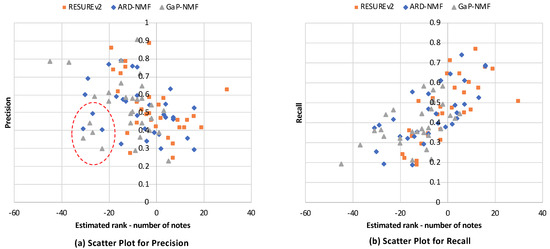
Figure 11.
Scatter plots for (a) precision and (b) recall versus the difference between the estimated rank and number of notes (estimated rank number of notes).
To compare the performance of the proposed algorithm with that of the conventional SURE-based rank estimation method, we measured the estimation error of the number of notes and the F1-score performance of the conventional SURE method [16]. The input data of the conventional SURE method were the same as that of the proposed method. The conventional SURE method does not require parameter settings, similar to the proposed method. The Figure 12a shows the absolute values of the estimation errors (same as Figure 9) and Figure 12b shows the F1-score results (same as Figure 10). The graphs show that the conventional SURE method fails to determine the proper number of notes, and the F1-score results are also degraded.
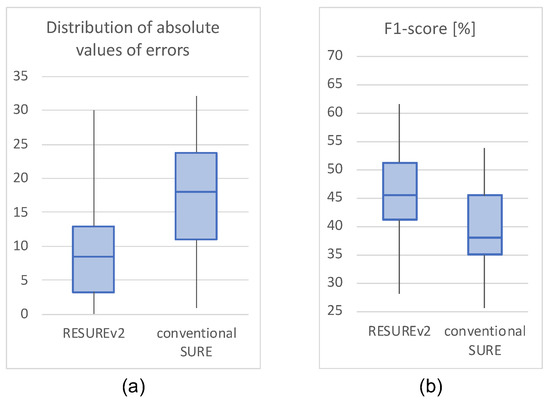
Figure 12.
Performance comparisons of the proposed method with the conventional SURE-based method [16] by (a) the absolute values of estimation errors for the number of notes and (b) the F1-score performances. The top and bottom of the box indicate the third and first quartiles, respectively, and the horizontal bar inside the box indicate the median value. The ends of the vertical bar indicate the maximum and minimum values.
Figure 13 shows the elapsed times of the algorithms for processing a 30-second-long audio clip. The algorithms were executed using MATLAB in a laptop with 3.5-GHz dual-core CPU and 16-GB memory. The RESUREv1 and RESUREv2 algorithms show nearly the same elapsed times. The NMF algorithm with the proposed RESUREv2 algorithms uses the least time, 85.12 s, making it worthwhile to combine the conventional NMF and the proposed RESURE algorithms in terms of computation time. Furthermore, the RESURE algorithms use much less computation time than the NMF methods, making them easy to combine with various NMF methods. The measured elapsed time of the RESURE algorithm does not include the onset detection process but there is no significant difference if we consider it because many lightweight onset detection techniques already exist.
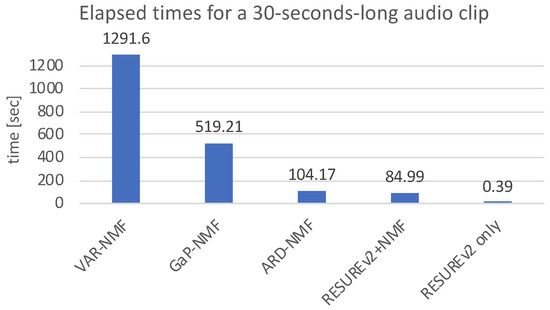
Figure 13.
Comparison chart for elapsed times of algorithms. The elapsed times were measured for processing a 30-second-long audio clip using MATLAB on a laptop with a 3.5-GHz dual-core CPU and 16-GB memory.
To compare the complexity of the proposed algorithm with the rank-estimation parts of the conventional methods, we measured the elapsed times for the rank-selection parts of each algorithm, (i.e., the parts for calculating the lower bounds of marginal likelihoods in the VAR-NMF and GaP-NMF algorithms, and the part for calculating relevance in the ARD-NMF algorithm) under a changing input-signal length from 10 s to 40 s. Figure 14 shows the comparison results. Similar to the case of Figure 13, the elapsed times of RESUREv1 and RESUREv2 are fairly identical; therefore, we display the elapsed time of RESUREv2 only. The graph shows that the proposed method requires the least time to estimate the rank independent of the input-signal length.
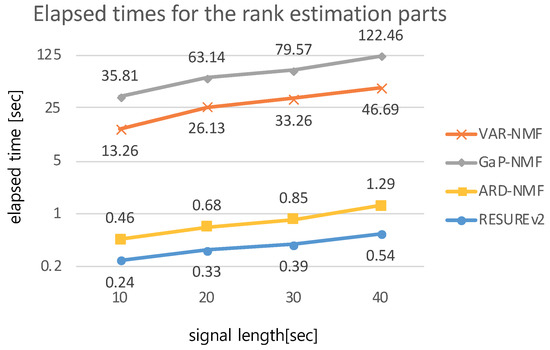
Figure 14.
Chart comparing the elapsed times of the parts of various algorithms related to model order selection. The elapsed times were measured using MATLAB on a laptop with a 3.5-GHz dual-core CPU and 16-GB memory.
5. Conclusions
This paper developed an algorithm for estimating the NMF rank in music signal processing systems. As has been mentioned in previous studies, music signal processing systems based on NMF algorithms perform well when the order is the same as the number of independent notes or chords. Thus, for NMF-based music signal processing systems, estimating the proper NMF rank is important.
The proposed NMF rank estimation method was based on the SURE method. To use the SURE method, an estimate of the noise variance is required because it is assumed to be known. The conventional method estimates the noise variance using RMT, but the SURE-RMT algorithm estimates the NMF rank for general signal analysis and not merely for music signal processing systems. The proposed algorithm uses the onset information to estimate the number of basis vectors. The input data from the beginning to the second onset is required to have one basis; thus, the noise variance was estimated accurately using the eigenvalues of the correlation matrix of the partial data. We proposed two rank estimation algorithms, i.e., RESUREv1 and RESUREv2, which use the maximum and median values, respectively, of the noise eigenvalues.
Simulations for estimating the NMF order were performed to evaluate the proposed algorithm. The simulations were performed using 30 test signals taken from the MAPS database. The evaluation results demonstrated that the proposed algorithm estimated the NMF rank to be closer to the number of musical notes compared to the conventional NMF rank estimation algorithms such as VAR-NMF, ARD-NMF, and GaP-NMF. Furthermore, music transcription evaluations were performed for the proposed rank estimation method combined with the conventional NMF algorithm, with results showing that the proposed method is effective as compared to the conventional-NMF-based music transcription algorithm. Though the F1-score performance advantages are not significantly large compared to to the ARD-NMF and GaP-NMF performances, the results are still meaningful, because the proposed algorithms are lightweight, are easy to combine with any other NMF methods that require the rank parameter as a priori, and lack setting parameters that affect the performance substantially.
Funding
This research was supported by Kyungpook National University Research Fund, 2018.
Conflicts of Interest
The author declares no conflict of interest.
References
- Virtanen, T. Monaural sound source separation by nonnegative matrix factorization with temporal continuity and sparseness criteria. IEEE Trans. Audio Speech Lang. Process. 2007, 15, 1066–1074. [Google Scholar] [CrossRef]
- Lee, D.D.; Seung, H.S. Learning the parts of objects by non-negative matrix factorization. Nature 1999, 401, 788–791. [Google Scholar] [CrossRef] [PubMed]
- Lee, D.D.; Seung, H.S. Algorithms for non-negative matrix factorization. In Advances in Neural Information Processing Systems; MIT Press: Cambridge, MA, USA, 2001; pp. 556–562. [Google Scholar]
- Berry, M.W.; Browne, M.; Langville, A.N.; Pauca, V.P.; Plemmons, R.J. Algorithms and applications for approximate nonnegative matrix factorization. Comput. Stat. Data Anal. 2007, 52, 155–173. [Google Scholar] [CrossRef]
- Wang, H.; Wang, M.; Li, J.; Song, L.; Hao, Y. A Novel Signal Separation Method Based on Improved Sparse Non-Negative Matrix Factorization. Entropy 2019, 21, 445. [Google Scholar] [CrossRef]
- Fu, X.; Huang, K.; Sidiropoulos, N.D.; Ma, W.K. Nonnegative Matrix Factorization for Signal and Data Analytics: Identifiability, Algorithms, and Applications. IEEE Signal Process. Mag. 2019, 36, 59–80. [Google Scholar] [CrossRef]
- He, W.; Zhang, H.; Zhang, L. Total variation regularized reweighted sparse nonnegative matrix factorization for hyperspectral unmixing. IEEE Trans. Geosci. Remote Sens. 2017, 55, 3909–3921. [Google Scholar] [CrossRef]
- Tsinos, C.G.; Rontogiannis, A.A.; Berberidis, K. Distributed blind hyperspectral unmixing via joint sparsity and low-rank constrained non-negative matrix factorization. IEEE Trans. Comput. Imaging 2017, 3, 160–174. [Google Scholar] [CrossRef]
- Smaragdis, P.; Brown, J.C. Non-negative matrix factorization for polyphonic music transcription. In Proceedings of the 2003 IEEE Workshop on Applications of Signal Processing to Audio and Acoustics, New Paltz, NY, USA, 19–22 October 2003; pp. 177–180. [Google Scholar]
- Vincent, E.; Bertin, N.; Badeau, R. Harmonic and inharmonic nonnegative matrix factorization for polyphonic pitch transcription. In Proceedings of the 2008 IEEE International Conference on Acoustics, Speech and Signal Processing, Las Vegas, NV, USA, 31 March–4 April 2008; pp. 109–112. [Google Scholar]
- Benetos, E.; Dixon, S.; Duan, Z.; Ewert, S. Automatic music transcription: An overview. IEEE Signal Process. Mag. 2018, 36, 20–30. [Google Scholar] [CrossRef]
- Park, S.H.; Lee, S.; Sung, K.M. Polyphonic Music Transcription by Nonnegative Matrix Factorization with Harmonicity and Temporality Criteria. IEICE Trans. Fundam. Electron. Commun. Comput. Sci. 2012, 95, 1610–1614. [Google Scholar] [CrossRef]
- Cemgil, A.T. Bayesian inference for nonnegative matrix factorisation models. Comput. Intell. Neurosci. 2009, 2009, 1–17. [Google Scholar] [CrossRef]
- Hoffman, M.D.; Blei, D.M.; Cook, P.R. Bayesian nonparametric matrix factorization for recorded music. In Proceedings of the 27th International Conference on Machine Learning (ICML-10), Haifa, Israel, 21–24 June 2010. [Google Scholar]
- Tan, V.Y.; Févotte, C. Automatic relevance determination in nonnegative matrix factorization with the/spl beta/-divergence. IEEE Trans. Pattern Anal. Mach. Intell. 2012, 35, 1592–1605. [Google Scholar] [CrossRef] [PubMed]
- Ulfarsson, M.O.; Solo, V. Dimension estimation in noisy PCA with SURE and random matrix theory. IEEE Trans. Signal Process. 2008, 56, 5804–5816. [Google Scholar] [CrossRef]
- Stein, C.M. Estimation of the mean of a multivariate normal distribution. Ann. Stat. 1981, 9, 1135–1151. [Google Scholar] [CrossRef]
- Lee, S. Estimation of the Matrix Rank of Harmonic Components of a Spectrogram in a Piano Music Signal Based on the Stein’s Unbiased Risk Estimator and Median Filter. IEICE Trans. Inf. Syst. 2019, 102, 2276–2279. [Google Scholar] [CrossRef]
- Guan, N.; Tao, D.; Luo, Z.; Yuan, B. Online nonnegative matrix factorization with robust stochastic approximation. IEEE Trans. Neural Netw. Learn. Syst. 2012, 23, 1087–1099. [Google Scholar] [CrossRef]
- Lee, S. RLS-based on-line sparse nonnegative matrix factorization method for acoustic signal processing systems. IEICE Trans. Fundam. Electron. Commun. Comput. Sci. 2013, 96, 980–985. [Google Scholar] [CrossRef]
- Ulfarsson, M.O.; Solo, V. Tuning parameter selection for nonnegative matrix factorization. In Proceedings of the 2013 IEEE International Conference on Acoustics, Speech and Signal Processing, Vancouver, BC, Canada, 26–31 May 2013; pp. 6590–6594. [Google Scholar]
- Cichocki, A.; Zdunek, R.; Phan, A.H.; Amari, S.I. Nonnegative Matrix and Tensor Factorizations: Applications to Exploratory Multi-Way Data Analysis and Blind Source Separation; John Wiley & Sons: Hoboken, NJ, USA, 2009. [Google Scholar]
- Wang, B.; Plumbley, M.D. Musical audio stream separation by non-negative matrix factorization. In Proceedings of the DMRN Summer Conference, At Glasgow, UK, 23–24 July 2005; pp. 23–24. [Google Scholar]
- Shitov, Y. The nonnegative rank of a matrix: Hard problems, easy solutions. SIAM Rev. 2017, 59, 794–800. [Google Scholar] [CrossRef]
- Cohen, J.E.; Rothblum, U.G. Nonnegative Ranks, Decompositions, and Factorizations of Nonnegative Matices. Linear Algebra Appl. 1993, 190, 149–168. [Google Scholar] [CrossRef]
- Eldar, Y.C. Generalized SURE for exponential families: Applications to regularization. IEEE Trans. Signal Process. 2008, 57, 471–481. [Google Scholar] [CrossRef]
- Baik, J.; Silverstein, J.W. Eigenvalues of large sample covariance matrices of spiked population models. J. Multivar. Anal. 2006, 97, 1382–1408. [Google Scholar] [CrossRef]
- Klapuri, A. Sound onset detection by applying psychoacoustic knowledge. In Proceedings of the 1999 IEEE International Conference on Acoustics, Speech, and Signal Processing, Phoenix, AZ, USA, 15–19 March 1999; Volume 6, pp. 3089–3092. [Google Scholar]
- Dixon, S. Onset detection revisited. In Proceedings of the 9th International Conference on Digital Audio Effects, Montreal, QC, Canada, 18–20 September 2006; Volume 120, pp. 133–137. [Google Scholar]
- Emiya, V.; Badeau, R.; David, B. Multipitch estimation of piano sounds using a new probabilistic spectral smoothness principle. IEEE Trans. Audio Speech Lang. Process. 2009, 18, 1643–1654. [Google Scholar] [CrossRef]
- Schörkhuber, C.; Klapuri, A.; Holighaus, N.; Dörfler, M. A Matlab toolbox for efficient perfect reconstruction time-frequency transforms with log-frequency resolution. In Proceedings of the Audio Engineering Society Conference: 53rd International Conference: Semantic Audio, London, UK, 27–29 January 2014. [Google Scholar]
- Hermes, D.J. Measurement of pitch by subharmonic summation. J. Acoust. Soc. Am. 1988, 83, 257–264. [Google Scholar] [CrossRef] [PubMed]
© 2020 by the author. Licensee MDPI, Basel, Switzerland. This article is an open access article distributed under the terms and conditions of the Creative Commons Attribution (CC BY) license (http://creativecommons.org/licenses/by/4.0/).