Article

Transport Pathways and Potential Source Region Contributions of PM2.5 in Weifang: Seasonal Variations

Chinese Academy of Surveying and Mapping, Beijing 100830, China
*
Author to whom correspondence should be addressed.
Appl. Sci. 2020, 10(8), 2835; https://doi.org/10.3390/app10082835
Submission received: 3 March 2020 / Revised: 13 April 2020 / Accepted: 14 April 2020 / Published: 20 April 2020
(This article belongs to the Special Issue Advances in Air Quality Monitoring and Assessment)

Abstract

:
As air pollution becomes progressively more serious, accurate identification of urban air pollution characteristics and associated pollutant transport mechanisms helps to effectively control and alleviate air pollution. This paper investigates the pollution characteristics, transport pathways, and potential sources of PM2.5 in Weifang based on PM2.5 monitoring data from 2015 to 2016 using three methods: Hybrid Single-Particle Lagrangian Integrated Trajectory (HYSPLIT), the potential source contribution function (PSCF), and concentration weighted trajectory (CWT). The results show the following: (1) Air pollution in Weifang was severe from 2015 to 2016, and the annual average PM2.5 concentration was more than twice the national air quality second-level standard (35 μg/m3). (2) Seasonal transport pathways of PM2.5 vary significantly: in winter, spring and autumn, airflow from the northwest and north directions accounts for a large proportion; in contrast, in summer, warm-humid airflows from the ocean in the southeastern direction dominate with scattered characteristics. (3) The PSCF and CWT results share generally similar characteristics in the seasonal distributions of source areas, which demonstrate the credibility and accuracy of the analysis results. (4) More attention should be paid to short-distance transport from the surrounding areas of Weifang, and a joint pollution prevention and control mechanism is critical for controlling regional pollution.

Graphical Abstract

1. Introduction

With rapid socioeconomic development, accelerated industrialization, and continuously increasing energy consumption, particulates have become major urban air pollutants in China [1,2,3]. In particular, fine particulates PM2.5 can not only reduce atmospheric visibility but also increase mortality and incidence of diseases such as respiratory diseases [4,5,6], and these particulates have aroused great public concern and attention. Studies have indicated that urban air pollution levels and their spatiotemporal distributions are not only associated with local emissions but also influenced by cross-regional transport from sources in surrounding areas [7,8,9]. Accurate identification of urban atmospheric pollution characteristics and transport mechanisms is critical to control and mitigate air pollution [10].
Existing studies on the spatiotemporal characteristics of PM2.5 and transport mechanisms have mostly focused on geo-statistics analysis [11], air quality models (e.g., large-scale Weather Research and Forecasting (WRF) model) [12], and back-trajectory clustering-based mechanism analysis. For back-trajectory clustering-based transport analysis, previous research has mostly focused on hotspots [13,14], while there is limited research on small but seriously polluted cities in China. Li et al. (2018, 2019) indicated that PM2.5 concentration and its influencing factors varied in different seasons, and they also preliminarily showed that the air pollution in Weifang City was affected by meteorological conditions and pollution of surrounding cities [6,15]. The above-mentioned studies are based on qualitative analysis. To quantitatively analyze the cross-regional influences of Weifang in different seasons, this paper describes an in-depth study of the seasonal variations in internal and external potential sources and provides targeted pollution control measures for government over different seasons. In addition, to improve the credibility and accuracy of the results, different trajectory analysis methods are used to analyze the potential sources of Weifang PM2.5 in this paper, which can be used to evaluate the results through mutual verification.
Therefore, based on hourly high-frequency PM2.5 data from 38 provincial monitoring stations in Weifang from 2015 to 2016, this paper examines the transport characteristics and potential sources of PM2.5 in Weifang City in different seasons by using a back-trajectory clustering method. This research helps to better understand the causes of PM2.5 pollution and the sources in Weifang as well as provides important scientific references for joint atmospheric pollution control in Weifang City.
This paper includes five sections. Section 2 summarizes relevant studies on pollutant transport mechanisms and potential sources. Section 3 describes the data sources and methods used. The analytical results of the PM2.5 pollution characteristics and potential source contributions in different seasons are presented in Section 4, followed by the conclusions in Section 5.

2. Literature Review

The causes and sources of urban air pollution are closely related to the characteristics of airflow transport trajectories. Methods such as the back-trajectory model, clustering analysis, and the potential source contribution function (PSCF) method have become important ways to address these characteristics [16,17,18]. For example, Yan et al. (2015) conducted a trajectory analysis on a smog process in Beijing in February 2014 and discovered that Baoding, Hengshui, and Handan are important potential source areas in the region [19]. Donnelly et al. (2015) analyzed the effects of various long-range transport pathways of the concentrations of particulate matter with diameter less than 10 μm (PM10) in Ireland by using the HYSPLIT4 model and showed that air quality in Ireland is heavily dependent on air mass origin and the inherent characteristics of the air mass [20]. Lee et al. (2011) examined the pathways of PM10 by back-trajectory analysis and showed that the transboundary pollutants of high-PM10 levels are more than twice as high as those from internal sources, especially in winter and spring; in addition, the local pollutants contributing to high-PM10 concentrations have decreased through the efforts to reduce emissions, but the transboundary pollutants have not decreased [21]. By analyzing the transport pathways of particulate matter over Guwahati, located in the Brahmaputra River Valley (BRV), Tiwari et al. (2017) found that the turbid air masses transported over Guwahati mostly from the western and southwestern directions contribute to higher PM concentrations, either carrying anthropogenic pollution from the Indo-Gangetic Plains or locally and LRT (long-range transported) dust from BRV and western India, respectively [22]. Li et al. (2017) employed the PSCF and concentration weighted trajectory (CWT) methods to analyze the transport trajectories and potential sources of PM2.5 and PM10 in Beijing and demonstrated that, in summer and autumn, the impacts of air pollution are mostly from the south and southeast, while those in spring and winter are influenced from the southeast and north [23]. By analyzing the transport pathways and potential sources of PM10 pollution in Shanghai, Li et al. (2014) reported that there are two potential sources of PM10 pollution in Shanghai: one is located in the northwest (for example, Hebei and Shandong), while the other is in the southwest (for example, Zhejiang and Jiangxi) [24]. Yang et al. (2017) examined the spatiotemporal characteristics and trajectories of a smog process in Beijing in December 2015 and discovered that the PM2.5 concentration in Beijing was high in the south but low in the north [25]. The major potential pollutant sources are the deserts in the northwest and the built-up areas in the Beijing-Tianjin-Hebei region.
Based on eight monitoring locations in Chengdu and meteorological data over three months, Liao et al. (2017) analyzed the spatiotemporal characteristics and sources of PM2.5 in Chengdu. The results reveal that the major potential sources of PM2.5 in Chengdu are located along the western margin of the Sichuan Basin and in the southeastern cities [26]. Xin et al. (2016) adopted daily average PM10 concentration data and Global Data Assimilation System (GDAS) data to study the transport trajectories that significantly influence PM10 in Xining and found that atmospheric pollution is easily affected by inland trajectories [27]. Based on nine air quality monitoring locations in Qingdao in winter, Li et al. (2017) analyzed the characteristics of atmospheric pollution and pollutant sources, the results revealed that PM2.5 is a major urban atmospheric pollutant in Qingdao, and the greatest contributions are from Shanxi, the southern part of Hebei, and the western part of Shandong [23]. Additionally, pollutants such as aerosols from the deserts in Inner Mongolia and the Yellow Sea are also a cause of atmospheric pollution. Lv et al. (2015) discovered that the PM2.5 concentration in Guangzhou is more sensitive to the velocities of air mass movements than their directions. The regional PM2.5 contributions in spring, summer, autumn, and winter are 15%, 28%, 16%, and 22%, respectively [28].
However, previous studies have shortcomings with respect to air pollution transport characteristics. Most studies: (1) have focused on typical large-scale regions, while limited research has focused on small yet heavily polluted cities, such as Weifang City [24]; and (2) have adopted low temporal resolution data (with 6- or 24- h resolution); however, high time resolution data have been shown to contribute to improved resolutions of source areas in PSCF calculations [23]. Moreover, in previous studies, several air quality monitoring data have mostly been used only to obtain average pollutant concentrations in PSCF models, whereas sparse and unevenly distributed monitoring data cannot truly represent the concentrations over the study area.

3. Data and Methodology

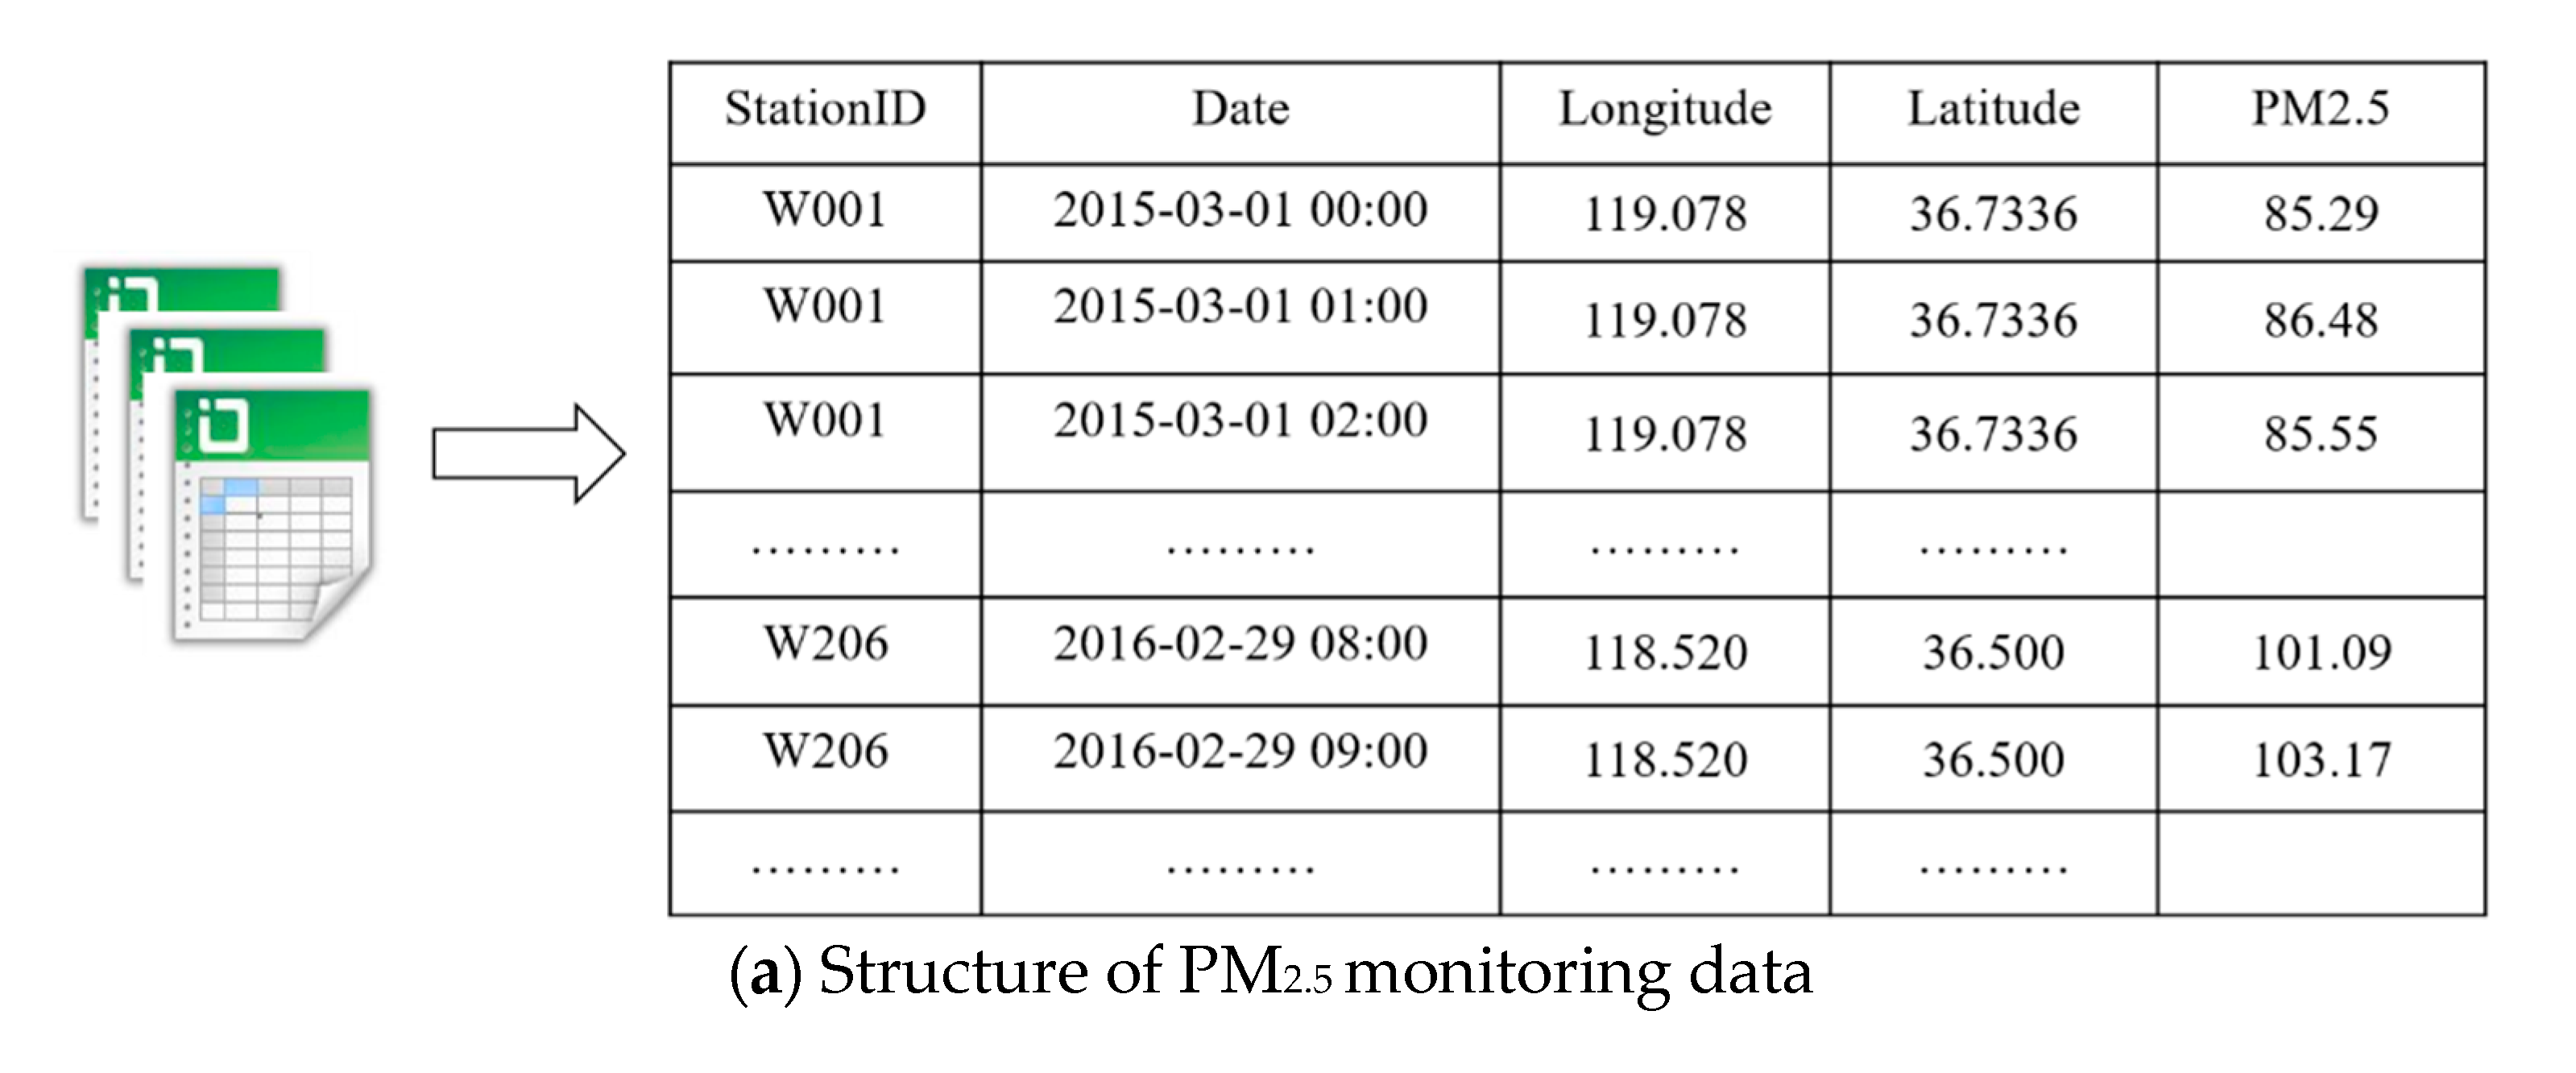
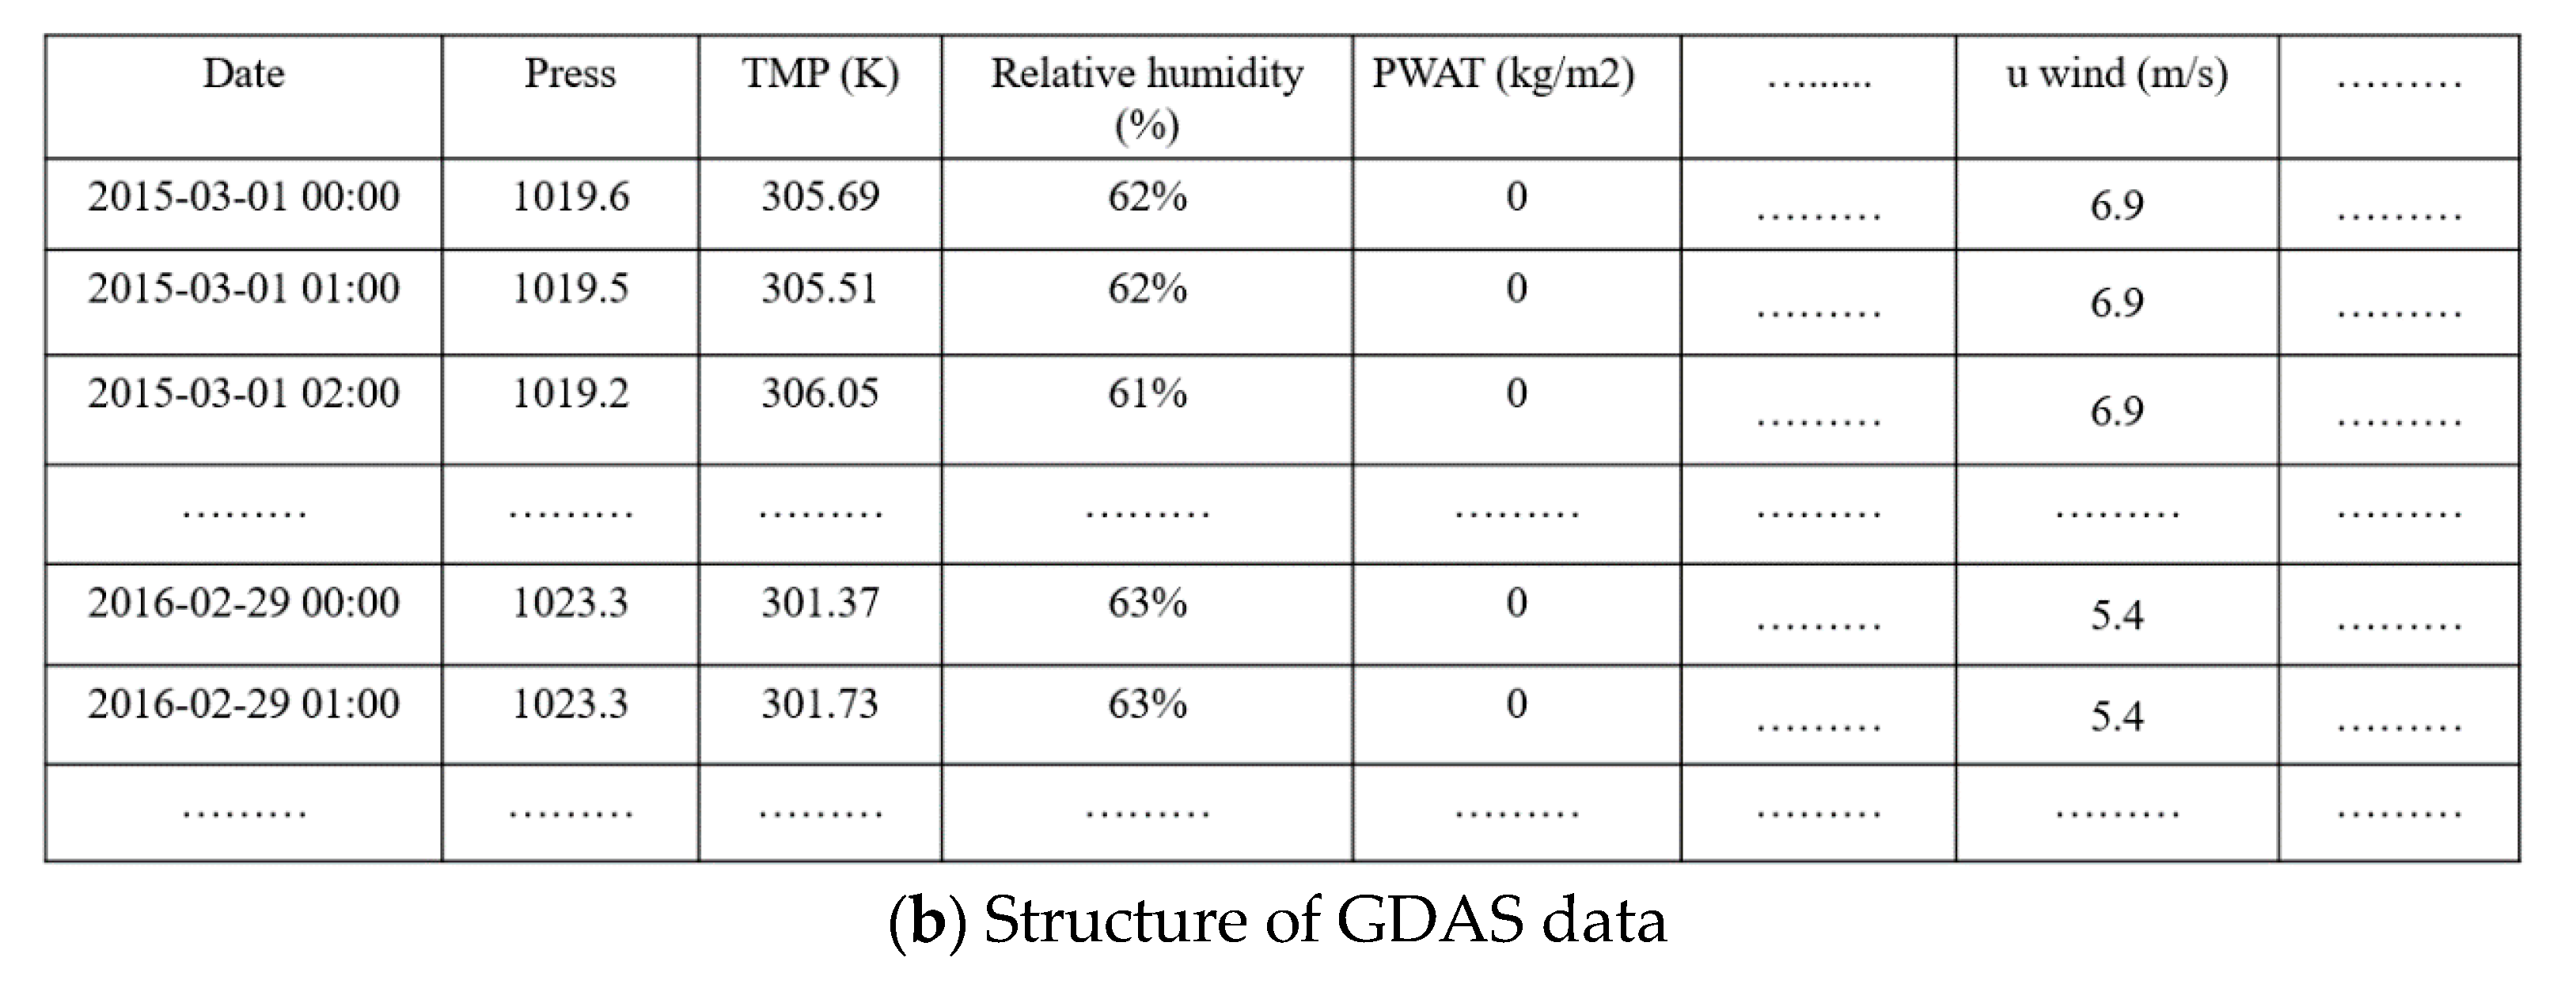
3.1. Study Area and Data Sources

Weifang is located in the middle of the Shandong Peninsula (Figure 1), with Zibo to the west, Linyi to the south, Qingdao to the east and Laizhou Bay and the Bohai Sea to the north, covering a total area of 16,000 square kilometers. Weifang City is high in the south (with ground elevation 100–1032 m) and low in the north (with ground elevation under 7 m). The south is mainly covered with hills and low mountains, while the northeast is mainly characterized by plains and lakes. Weifang City has been experiencing industrial and economic advancements and was one of the most rapidly developing cities in Shandong Province. As of 2019, the number of registered vehicles had exceeded 2 million. This growth has resulted in damage to the Weifang City environment. Existing studies on the characteristics of air pollution in Weifang have mainly focused on spatiotemporal patterns, while few reports have described the transport trajectories and mechanisms as well as the potential sources of air pollution. This paper utilizes hourly PM2.5 monitoring data and a back-trajectory model to analyze the transport pathways and potential source contributions of PM2.5 pollution in Weifang and can provide important scientific support for joint atmospheric pollution control and management.
The PM2.5 monitoring data used in this paper were acquired from 5 national monitoring stations, 4 provincial monitoring stations, and 29 city monitoring stations in Weifang (Table A1 in Appendix A). The data were obtained by automatic air quality monitors through 24-h continuous monitoring and cover the period from 1 March 2015 to 29 February 2016. The data were acquired from the Data Center of the Ministry of Environmental Protection of the People’s Republic of China (http://datacenter.mep.gov.cn/index). Thermo Fisher 1405F monitoring devices were used to measure the PM2.5 concentrations, and this instrument operates on the principle of measuring PM2.5 concentrations by a filter dynamic measurement system (FDMS) with the tapered element oscillating microbalance (TEOM) and the beta-attenuation method [6].
The major data structure is illustrated in Figure 2a. The meteorological data used in the back-trajectory model were obtained from GDAS data provided by the National Centers for Environmental Prediction (NCEP). The 1.0° resolution global reanalysis data are adopted. These data are recorded every 6 h, namely, at 00:00, 06:00, 12:00 and 18:00 (UTC). Their structure is shown in Figure 2b.

3.2. Methodology

(1)
HYSPLIT model
The Hybrid Single-Particle Lagrangian Integrated Trajectory (HYSPLIT) model established by the Air Resources Laboratory of the National Oceanic and Atmospheric Administration (NOAA) is used in this paper to analyze sources and transport trajectories of air pollutants [29,30]. This model gives highly accurate and temporally continuous simulation results and has been widely used in research on the transport and diffusion of various pollutants in different areas. The HYSPLIT model is divided into two parts: the backward transport model and the forward diffusion model, which solve problems concerning sources and sinks, respectively. In this paper, the backward transport model of the HYSPLIT model is employed to simulate 72-h backward airflow transport trajectories near the ground surface in Weifang during the period of interest. The characteristics of the airflow movements in the study area are thereby reflected.
(2)
Trajectory clustering analysis
Trajectory clustering analysis, a multivariate statistical analyses technique, was used to divide the trajectory data into several classes or clusters. Data in the same class or cluster share a higher degree of similarity, whereas those in different classes or clusters vary more significantly [31]. This paper uses TrajStat, a plugin of MeteoInfo; this plugin can view, query, and cluster trajectories and includes two clustering methods: Euclidean distance and angle distance. Because this paper aims to determine the direction from which the air masses that reach the site have originated, the angle distance clustering method is utilized to cluster airflow trajectories. The angle distance is often used to define the mean angle between the two trajectories, which varies between 0 and π. The details of the angle distance clustering method can be found in the work of Sirois and Bottenheim (1995) [32].
(3)
Potential source contribution function (PSCF)
The PSCF model is a simple method that links residence time in upwind areas with high concentrations through a conditional probability field [33]. This method can identify pollutant sources by analyzing airflow trajectories and a given threshold [34,35]. It can be calculated as follows:
P S C F i j = n i j N i j
where N i j is the total number of airflow trajectories’ endpoints that fall in the ijth grid and nij is the total number of airflow trajectories’ endpoints for which the measured PM2.5 concentration exceeds a given threshold in the same grid. In this study, the 24-h average Grade II standard PM2.5 concentration (75 μg/m3) in ambient air quality standards of China (GB3095-2012) was selected as the threshold value [26]. The trajectories were calculated hourly. Studies have demonstrated that great uncertainty exists in the calculation result when Nij is extremely small. To eliminate this uncertainty, an arbitrary weight function, Wij, was applied when the number of the endpoints in a particular cell was less than three times the average number of endpoints for each cell [36,37].
W P S C F i j = W i j × P S C F i j
W i j = { 1.00                       N i j > 80 0.70             20 < N i j 80 0.42             10 < N i j 20 0.05               0 < N i j 10
(4)
Concentration weighted trajectory (CWT)
The CWT method first computes the weighted concentrations of trajectories and then obtains the weighted concentrations of grids [38]. The calculation formula of the CWT method is given as follows:
C W T i j = k = 1 N C k τ i j k k = 1 N τ i j k
where CWTij is the weighted average concentration of grid ij; N is the total number of trajectories; k denotes a trajectory; Ck is the PM2.5 concentration of trajectory k when it passes through grid ij, which can be calculated by the HYSPLIT model; and τijk is the duration in which trajectory k stays in grid ij [39,40]. In addition, the CWT method gives rise to great uncertainties, thus the weight coefficient Wij is needed to reduce these uncertainties. Similarly, Wij is determined using Equation (3), and the introduction of the coefficient is as follows:
W C W T i j = W i j × C W T i j
For PSCF and CWT methods, the input data and applicable resolution of grid are the same. The difference between CWT and PSCF is that PSCF usually uses a concentration threshold to evaluate the potential sources of PM2.5. It means that it may have the same PSCF value when sample concentrations are either only slightly higher or much higher than the criterion. As a result, it may not distinguish moderate sources from strong ones. For CWT method, the limitation of PSCF can be overcome by assigning a weighted concentration by averaging the sample concentrations that have associated trajectories that cross the grid cell.

4. Results and Analyses

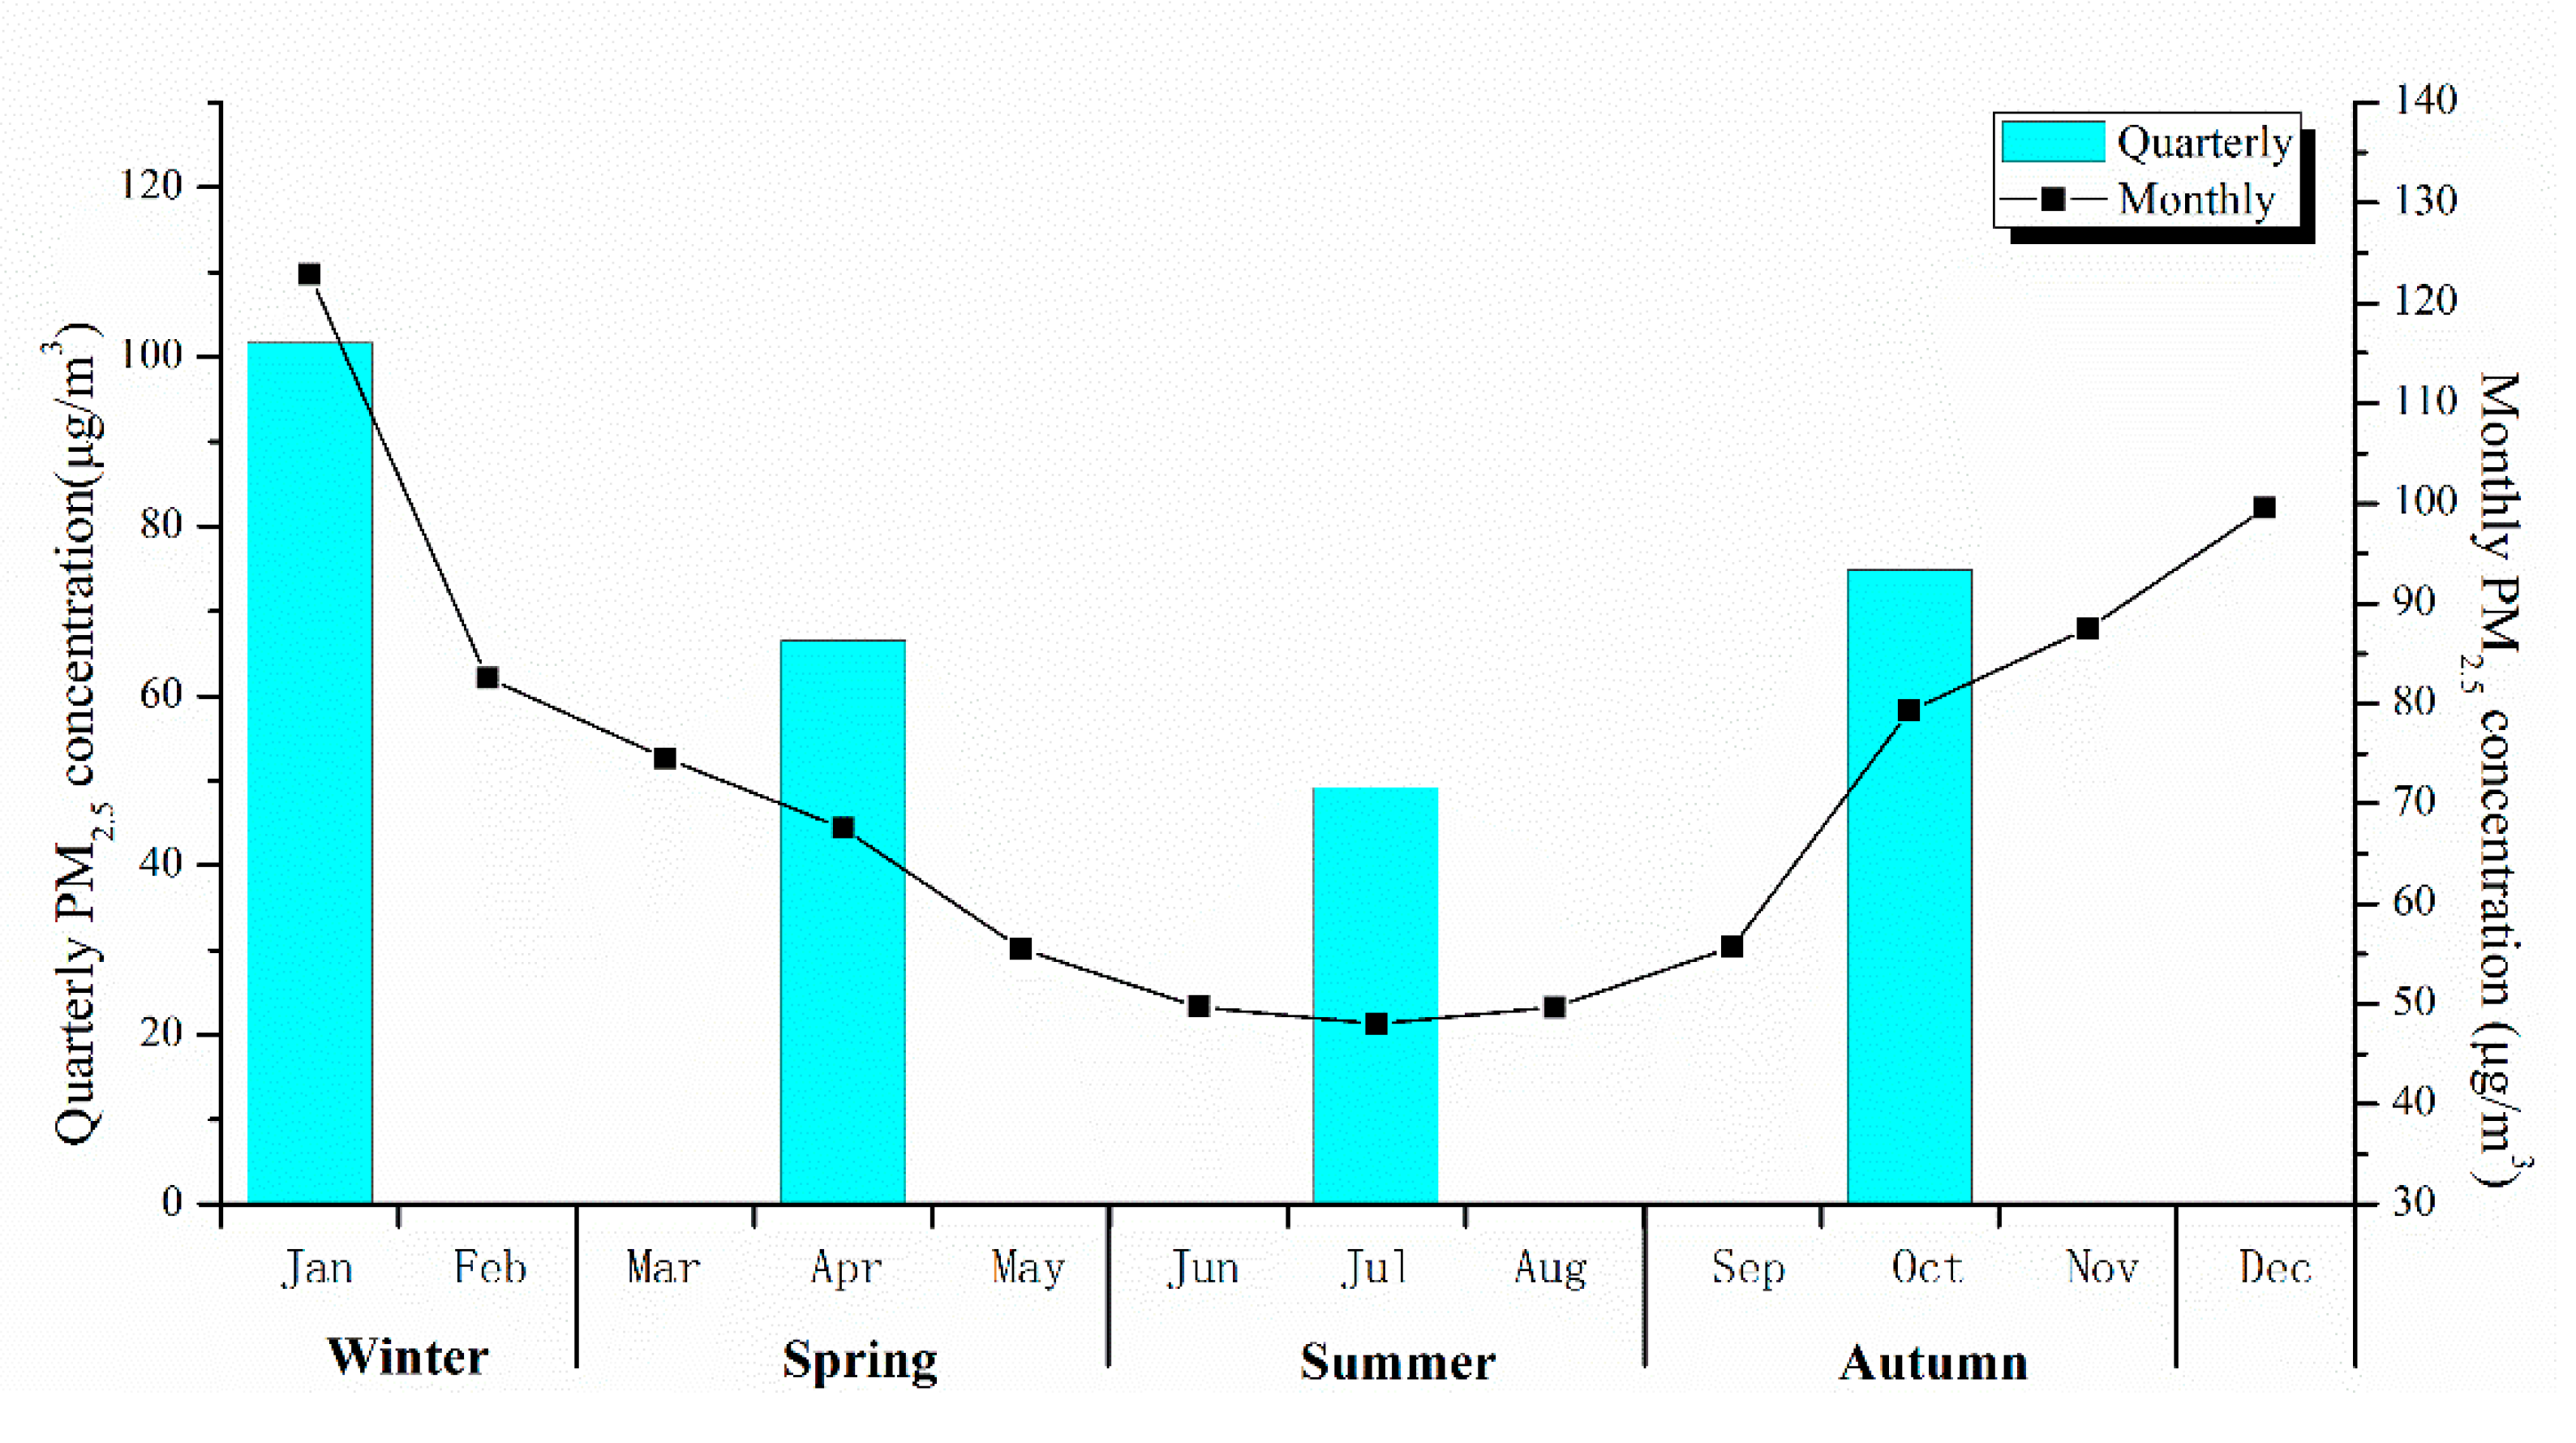
4.1. PM2.5 Pollution Characteristics

Hourly PM2.5 concentration data for Weifang from 2015 to 2016 are examined to analyze the annual, seasonal, and monthly characteristics of the PM2.5 concentration. The annual average PM2.5 concentration in Weifang is 73.03 μg/m3, which is more than twice the national second-level standard (35 μg/m3) and nearly five-fold the national first-level standard (15 μg/m3). Figure 3 presents the seasonal and monthly variations in the PM2.5 concentration. In general, the monthly average PM2.5 concentration presents a U-shaped curve. The PM2.5 concentration is higher in winter (December, January, and February), approximately 101.64 μg/m3, which significantly exceeds the national 24-h atmospheric quality second-level standard (75 μg/m3). The concentrations in autumn (September to November) and spring (March to May) are 74.81 and 66.53 μg/m3, respectively. The lowest concentration occurs in summer (June to August), with only 49.12 μg/m3. The PM2.5 concentrations in the four seasons all exceed the national 24- h atmospheric quality first-level standard (35 μg/m3). The highest concentration occurs in January (122.86 μg/m3) and the lowest in July (48.02 μg/m3). The monthly average considerably decreases in March but rapidly increases in October.

4.2. Backward Trajectory Clustering

TrajStat was used to process airflow data in Weifang in different seasons to obtain transport trajectories in different seasons. However, from these airflow trajectories, it is not possible to determine the exact number of trajectories from different directions. Therefore, according to the consistency in the spatial distributions of various airflow trajectory types, trajectories in spring, summer, autumn, and winter are integrated into four, five, two, and two clusters, respectively (Figure 4).
Figure 4 shows that, in spring, the airflow trajectories originating from northern inland areas (Trajectories 1–3) dominate. More specifically, airflows originating from Russia, Mongolia, central Inner Mongolia, and Hebei account for 36.91% of the total trajectories, and those from the Yellow Sea and central Shandong account for 29.38%. In summer, the airflow trajectories are shorter and follow a star-shaped distribution. Influenced by warm and humid airflows from the ocean, these trajectories are dominated by southerly and southeasterly winds and account for 67.1% of the total trajectories. In autumn, as cold air masses move southward, the airflow trajectories from the southeast weaken. As a result, the airflow trajectories originating from southeastern Mongolia, central Inner Mongolia, and northeastern Hebei account for 59.07%. The airflow trajectories from northeastern Hebei are shorter, accounting for 40.30%. They pass over the waters of the Bohai Sea and finally return to Weifang via the inland areas of Shandong. In winter, under the influence of the Siberian cold current, the airflow trajectories originating from the northwest dominate (68.91%). These trajectories are longer, and the air masses move more quickly. Moreover, in winter, the airflow trajectories from southwestern Shandong account for 31.06% and are shorter and slower.

4.3. Transport Trajectories in Different Seasons

Based on the airflow backward trajectory clustering results in different seasons, combined with the hourly PM2.5 concentration data, this paper analyzes the pollution characteristics of different transport trajectories. According to the second-level PM2.5 concentration (75 μg/m3) in Ambient Air Quality Standards (GB 3905-2012), back-trajectories are classified into “low polluted” trajectories (<75 μg/m³) and “polluted” trajectories (75 μg/m3). The statistics for different types of trajectories are described in Table 1.
(1)
Pollution characteristics in spring
The average PM2.5 concentration of spring trajectories is 70.83 μg/m3. The trajectory clusters in descending order are: 2 > 3 > 4> 1. The airflow trajectories originating from the north (Inner Mongolia) have the highest average PM2.5 concentrations, reaching 83.35 μg/m3. This may be due to two reasons: one is that these airflows mainly come from the western arid regions of China, and, in spring, northwesterly winds easily blow loose topsoil and fine sand from dry surfaces to form sandstorms; the other reason is that these trajectories pass over the industrial areas in southern Hebei and easily transport local pollutants to Weifang City to form accumulation. Type 3 trajectories from the northwest are longer and have the lowest PM2.5 concentration of 53.72 μg/m3. This may due to two reasons: (1) these trajectories travel large distances at high wind speeds; and (2) they subsequently pass over regions with high vegetation cover and relatively low population density [41], such as Xilingol league in Inner Mongolia, Chengde City in northern Hebei, and waters of the Bohai Sea. Both the abovementioned cases may lead to low pollution transport and effective adsorption, diffusion, and dilution of pollutants.
The average PM2.5 concentration of the polluted trajectories is 104.87 μg/m3. In particular, Type 1 and 2 trajectories account for 29.43% and 31.55% of the total polluted trajectories, respectively. These types together account for 60.98% of the seasonal total polluted trajectories, suggesting that PM2.5 is mainly transported from the north and southeast directions to Weifang in spring.
(2)
Pollution characteristics in summer
The average PM2.5 concentration of summer trajectories is the lowest, only 49.40 μg/m3. In summer, many plants flourish, and the total leaf area of surface vegetation significantly increases, which is conducive to the adsorption of atmospheric particulates. Moreover, precipitation in summer is more concentrated, and the increased precipitation greatly facilitates wet deposition and dilution of atmospheric pollutants. However, under the control of the subtropical high and typhoon, the trajectories are diverse. The trajectory clusters in descending order of average PM2.5 concentration are: 4 > 3 > 5 > 2 > 1. The airflow trajectories from southeast have the highest value (68.16 μg/m3), followed by those from northwest (62.95 μg/m3). This pattern indicates that external pollutant emissions from southeast and northwest have a substantial effect on PM2.5 pollution in Weifang. Although Type 4 originated from the Yellow Sea, affected by subtropical auxiliary high pressure and wheat straw burning in south China, pollutants and suspended particles from eastern Zhejiang and southern Shandong are easily carried by the trajectory and accumulate Weifang. Type 1 trajectories originating from the Bohai Sea have the lowest average PM2.5 concentration (41.50 μg/m3) and make up the largest proportion of the total trajectories. These trajectories mainly pass over waters and coastal areas in eastern Shandong. These areas are characterized by strong air masses, cleanliness, and intensive atmospheric wet deposition, which facilitate wet deposition and dilution of pollutants [1,6,42].
The average PM2.5 concentration of polluted trajectories is 94.92 μg/m3. Types 3–5 trajectories account for 20.68%, 43.19%, and 19.63% of the total polluted summer trajectories, respectively. They together account for 83.50% of the seasonal total polluted trajectories, indicating that PM2.5 is mainly transported in easterly directions to Weifang in summer.
(3)
Pollution characteristics in autumn
Autumn trajectories have an average PM2.5 concentration of 80.53 μg/m3. The autumn trajectory clusters in descending order of PM2.5 concentration are: 1 > 2. In particular, Type 2 trajectories are longer and have lower PM2.5 concentrations. These trajectories originate mostly from northwestern Mongolia, central Inner Mongolia, and northern Hebei and travel over extensive areas at high wind speeds. In addition, they pass over the waters of the Bohai Sea and enter Weifang directly. The air masses are relatively clean, which is conducive to the diffusion of pollutants. In contrast, the PM2.5 concentrations of Type 1 trajectories are higher, with an average of 94.52 μg/m3. This is because short and slow Type 1 trajectories do not favor the diffusion of pollutants. Furthermore, these airflow trajectories pass over the northeastern part of Shandong before they reach Weifang and often carry pollutants from Shandong, leading to higher PM2.5 concentrations.
The polluted trajectories have an average PM2.5 concentration of 120.72 μg/m3. Type 1 trajectories account for 52.60% of the total polluted trajectories. It follows that the northeasterly direction is the major PM2.5 transport direction to Weifang in autumn.
(4)
Pollution characteristics in winter
Compared to the other three seasons, the average PM2.5 concentration of winter trajectories is the highest, reaching 115.54 μg/m3. More specifically, Type 2 trajectories have the highest PM2.5 concentrations, with an average of 148.08 μg/m3. This is mostly because these airflow trajectories originate from south-central Hebei and pass over inland cities in northern Shandong. In winter, these areas are in the heating period, leading to increases in anthropogenic pollutant emissions, such as from coal burning [8,43]. As air masses pass over these areas, they usually carry soil, dust, and pollutants from the inland areas to Weifang. In addition, these airflow trajectories are relatively short and travel slowly, making pollutants not able to diffuse easily. Hence, the average PM2.5 concentration of these trajectories is relatively high. In contrast, the average concentration of Type 2 trajectories is the lowest, but they are also significantly higher than those in the other seasons, at 82.99 μg/m3. These trajectories originate from Siberia and arrive in Weifang through the Mongolian Plateau, Inner Mongolia, Hebei, Beijing, Tianjin, and the Bohai Sea and are relatively long and travel at higher wind speeds. These trajectories pass over the waters of the Bohai Sea, which may slightly facilitate the diffusion and elimination of pollutants.
The average PM2.5 concentration of polluted winter trajectories is 138.61 μg/m3. The average PM2.5 concentration of Type 1 trajectories reaches 158.08 μg/m3, which includes not only the external source from southern Hebei Province but also local emissions and is the main pollution source of Weifang City in winter.
Overall, in autumn and winter, Weifang is mostly influenced by pollutants from inland areas of Hebei and Shandong. Airflows from these areas often carry particulates emitted from the passed areas. This reflects the knock-on effects of PM2.5 pollution within Shandong Province. In summer, due to the influences from coastal cities in the east and clean airflows from the ocean, the concentrations of pollutants are lower. In spring, severe pollution in Weifang is closely associated with sandstorms in the arid areas in the west, where loose topsoil and fine sand are blown from dry surfaces.

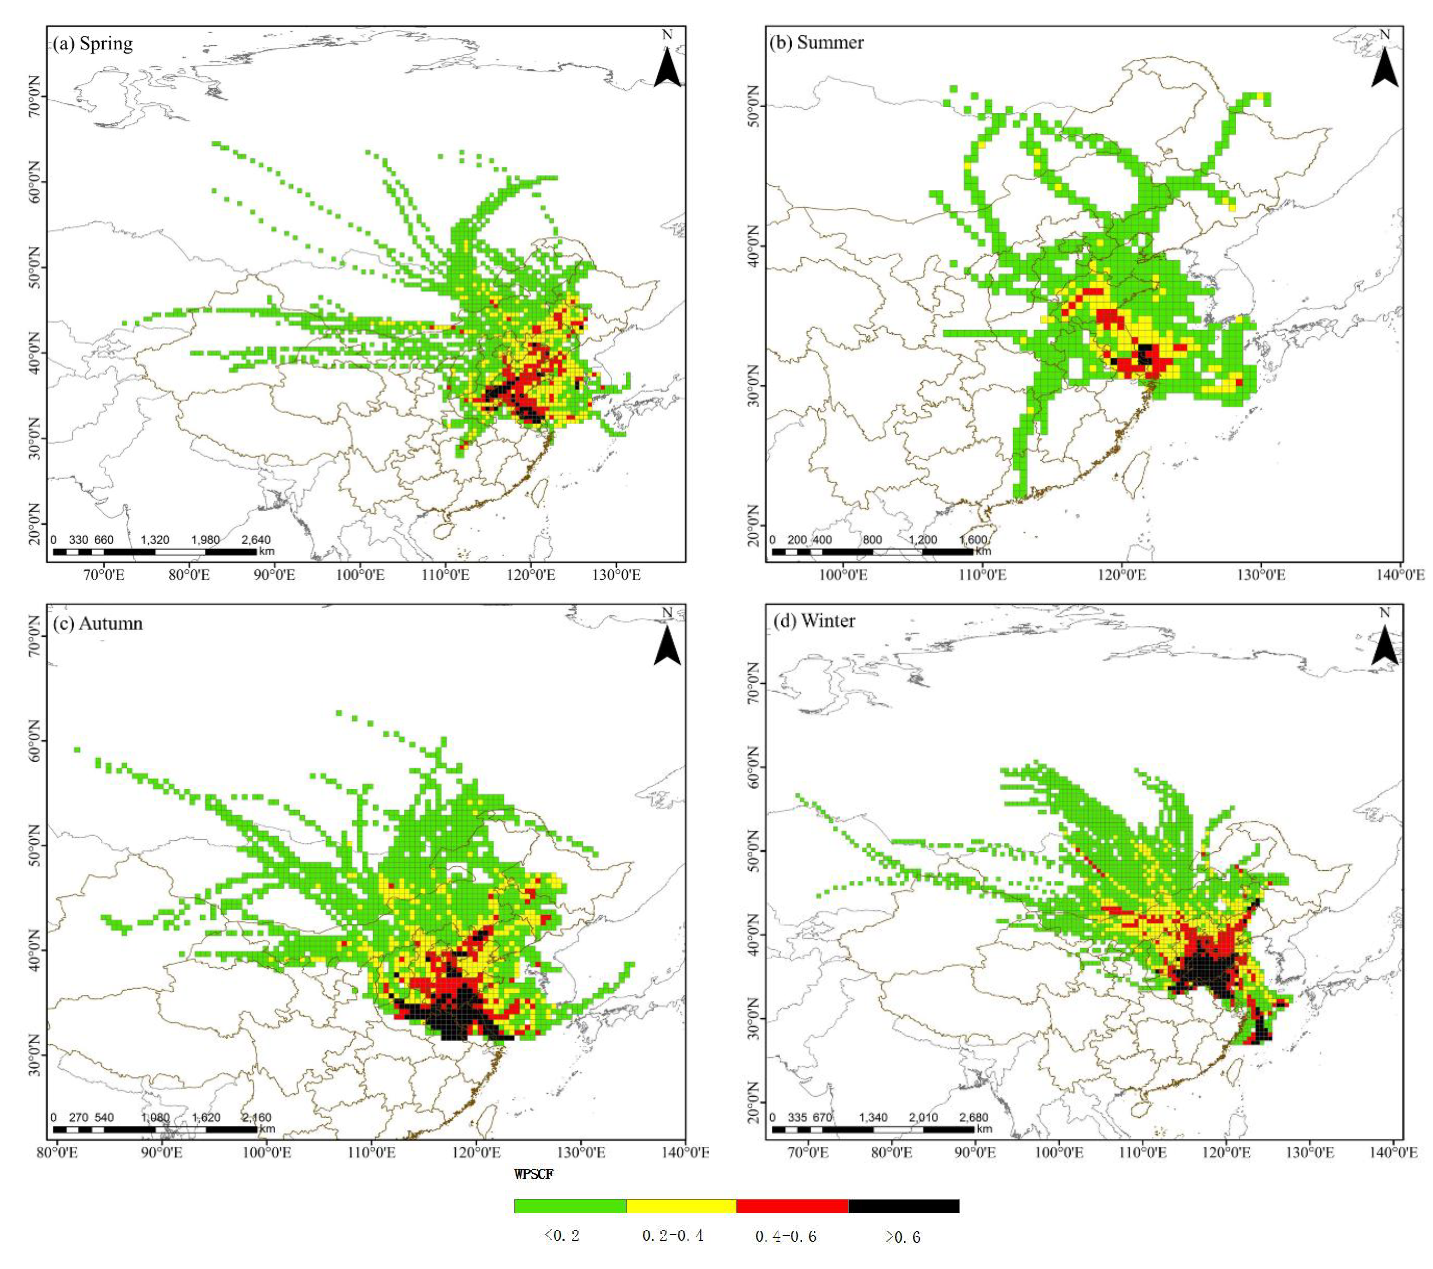
4.4. Potential Source Regions

To further investigate the sources of atmospheric pollutant transport in Weifang, this paper analyzes the potential source regions of PM2.5 pollution. First, PM2.5 concentration data are added to airflow trajectories, and areas covering all airflow trajectories are uniformly divided into 0.5° × 0.5° grids. Then, the weighted potential source contribution function (WPSCF) value of each grid is computed. WPSCF reveals the spatial distribution of PM2.5 potential sources obtained by combining back-trajectories and measurements of PM2.5 concentration. A high PSCF value signifies a potential source location. The greater the WPSCF value of a grid is, the higher the contribution levels of potential source regions to PM2.5 pollution in Weifang, given that other factors remain stable.
Figure 5 shows the PSCF results for PM2.5 in Weifang from 2015 to 2016. The colors represent the contribution levels of potential source areas; the black color is associated with high concentrations, while green represents low PM2.5 concentrations. Distinct seasonal variations are noted in the distribution of the potential source areas of PM2.5. (1) In spring, high PSCF values are mainly found in north-central Jiangsu and southwestern Shandong. Additionally, areas such as Tianjin, Liaoning and western Jilin have key influences on the sources of pollution in Weifang. (2) In summer, PSCF values are generally smaller, indicating that Weifang is less affected by pollutants from the surrounding areas in summer. Compared to those in spring, the potential sources are shifted eastward and are located in Shandong and the waters of the Bohai Sea and Yellow Sea. This is may because the southeasterly monsoon carries pollutants emitted from passed areas when it moves northward. Furthermore, stubble burning is the most intensive in some southern regions in summer, creating large fumes that easily travel northward with the monsoon. (3) In autumn, higher PSCF values are increasing and are mainly found in regions such as northern Anhui, northeastern Henan, and southwestern Shandong. In addition, areas such as Hebei, Beijing, Tianjin, eastern Shanxi, and central Inner Mongolia make certain potential contributions. (4) In winter, potential source areas transit and extend northwestward. High values are found in the whole city of Shandong, northern Jiangsu, northeastern Henan, and southern Hebei; in these regions, their situations are very similar to that of Weifang, with the same climate, industrial emission, population density, and winter heating. In addition, those values in eastern Shanxi and western Inner Mongolia increase.
In summary, in winter, spring, and autumn, Weifang is more substantially affected by nearby inland cities in Jiangsu, Henan, and Shandong, and these areas are potential source regions of pollutants in Weifang. In contrast, in summer, Weifang is less influenced by pollutants from surrounding areas. Moreover, comparisons reveal that the distributions of high PSCF values in different seasons agree well with those of the major trajectory areas shown in Table 1. This finding indicates that the potential source contribution results obtained by the PSCF method in this paper are reasonably reliable.

4.5. Potential Source Region Contributions

The CWT method is adopted to calculate the weighted concentrations of trajectories originating from various potential source regions. The CWT value represents a weighted specific concentration value by averaging sample concentrations that have associated trajectories that cross the grid cell, under the condition of other factors remaining relatively constant. The larger is the CWT value, the greater is the contribution of the grid cell to the pollutant concentration of Weifang City. The results are illustrated in Figure 6. The regions colored in black correspond to the main contributing sources associated with the highest PM2.5 values, while the green color represents regions with low values.
In spring, higher WCWT values are mostly concentrated in northeastern Henan and southwestern Shandong, which are important sources of PM2.5 in Weifang. These areas have daily average PM2.5 concentration contributions above 80 μg/m3. Additionally, other regions in Shandong, western Tianjin, and the central Bohai region influence pollution in Weifang. For these areas, the daily average PM2.5 concentration contributions are more than 60 μg/m3.
In summer, WCWT values are generally smaller. The highest CWT values covering the map were distributed in coastal areas in the east, such as Zhejiang and Jiangsu, with values of 60–80 μg/m3. This is possibly because southeasterly wind dominates in Weifang in summer. Sea-salt aerosols from the south are easily transported to the Weifang region via the monsoon traveling northward.
Compared to those in summer, higher WCWT values in autumn are found in areas further south and northeast. These values are mainly observed at the intersection of Anhui, Jiangsu, and Shandong, with daily average PM2.5 concentration contributions of above 80 μg/m3. Furthermore, relatively substantial contributions are observed in certain localized areas such as eastern Hebei, southern Beijing, and Tianjin, and the daily average PM2.5 concentration contributions of these areas exceed 60 μg/m3.
The WCWT values in winter are greater than those in other seasons. The greatest contributions to the PM2.5 concentration in Weifang are throughout Shandong as well as certain nearby areas such as northeastern Henan, northern Jiangsu, and southwestern Hebei. The daily average contributions are more than 80 μg/m3. This is probably because many pollutants are emitted when coal is burned for heating in the north in winter.
When CWT results are compared to the WPSCF results, they have basically consistent results for areas contributing to the PM2.5 concentration in Weifang, which demonstrates the credibility and accuracy of the analysis results. Nevertheless, the potential source regions obtained via the CWT method for spring, summer, and autumn cover larger areas than those simulated by the PSCF method, while the results for winter are similar. These results are consistent with the findings reported by Yan et al. (2018) in Yinchuan [44]. These observations may arise because the CWT method takes into account all the concentrations rather than a subset of high concentrations in the PSCF method. The findings demonstrate that the seasonal distributions of PM2.5 source areas obtained by these two methods share generally similar characteristics, suggesting the credibility and accuracy of the analysis results.

5. Discussion and Conclusions

Based on PM2.5 monitoring data from 2015 to 2016 from 38 air quality monitoring stations, this paper describes an in-depth study of the seasonal variations in internal and external potential sources in Weifang by using different trajectory analysis methods.
(1)
Seasonal differences in the contributions of potential source regions of PM2.5 in Weifang. In winter, spring, and autumn, airflows are mostly from the northwesterly and northerly directions and significantly influence the PM2.5 concentration in Weifang. However, in summer, airflow trajectories are scattered, and warm and humid airflows from the ocean in the southeastern direction dominate. In winter, spring, and autumn, Weifang is more greatly affected by pollutant transport from nearby inland cities in Shandong and Henan. These transport pathways are short in general, and the wind speeds are low, leading to accumulation of the carried pollutants in Weifang. In contrast, in summer, Weifang is less influenced by pollutants from the surrounding areas, and the potential source regions are mainly located in coastal areas in the east, such as Jiangsu, the Bohai Sea, and the Yellow Sea. It should be noted that the region covering central Inner Mongolia and southern Liaoning is also a potential source area for Weifang.
(2)
Policy implications for PM2.5 pollution in Weifang. The results indicate that, in formulating relevant pollution control and prevention measures, the government should focus on the control of pollutant sources and take the migration of regional pollution caused by these sources into account. For example, according to the transport patterns of pollutants in Weifang, the surrounding pollutant source regions can be divided and classified (such as key control zones). This finding suggests that different control and management policies can be implemented, and region-specific pollution control and prevention measures can be formulated. Because Weifang is more significantly affected by short-distance pollutant transport from the surrounding cities and provinces as well as inland areas in Shandong Province, the government should pay more attention to short-distance transport from these regions. For instance, more intensive greening measures can be introduced to reduce the short-distance transport of PM2.5. Furthermore, the interactions between the city and its surrounding areas should be considered, and joint control and cooperation between different regions should be enhanced.
(3)
Evaluation of the analysis results. The results demonstrate that the seasonal distributions of PM2.5 source areas obtained by two methods (PSCF and CWT) share generally similar characteristics, demonstrating the credibility and accuracy of the analysis results. Both methods can effectively reflect the potential source areas of pollution in the region. However, there is a limitation in validating the modeling results with the real transport values because emissions and depositions of air pollutants along the trajectories cannot be captured easily. Nevertheless, our results are able to locate the source direction and areas and identify source contributions to a certain extent. To support this point, we analyzed the notice issued by Shandong Provincial Environmental Protection Office, which indicates that the primary source of external dust transport from Inner Mongolia is the main reason that leads to the rapid increase in pollutants in Weifang City in April [45]. Thus, some references indicated that in northern China (such as Weifang), the main pollution sources come from anthropogenic emissions related to coal burning and their transportation [46]. These cases both support our findings regarding spring and winter. In addition, PSCF and CWT are appropriate tools that help identify source contributions to the concentration variations at the destination, assuming that other elements/factors remain the same, such as the period of the kite festival (in April every year). In the future, additional work that combines emission sources and external monitored PM2.5 concentration data is needed to improve the prediction of PM2.5 source regions and validate the analysis results quantitatively.
This paper analyzes the external and internal potential source regions of PM2.5 pollution and their influences on Weifang City. Our findings can provide scientific support for the design of region-specific measures for atmospheric pollution prevention and the development of a chemical transport model combined with meteorology. However, this work also has limitations. For instance, the resolution of the study grid based on the backward trajectory model is not very high and may not be applied to small-scale regions. Furthermore, the estimation of the sources of PM2.5 is not perfect because the contributing sources were calculated only based on meteorological data without information such as the production and deposition of dust. In future research, based on the results in this paper, auxiliary parameters such as the local emission sources and external PM2.5 monitoring value will be combined to improve the simulation analysis accuracy and evaluate the accuracy of potential sources contributing to the PM2.5 in Weifang quantitatively. Furthermore, analyses for various years will be further conducted to assess the inter-annual variability.

Author Contributions

Conceptualization, C.L.; methodology, C.L. and Z.D.; software, Z.D. and X.L.; validation, Z.D., X.L. and P.W.; formal analysis, Z.D., X.L. and P.W.; investigation, Z.D. and X.L.; resources, C.L.; writing—original draft preparation, Z.D.; writing—review and editing, C.L. and Z.D.; supervision, C.L.; and funding acquisition, C.L. and Z.D. All authors have read and agreed to the published version of the manuscript.

Funding

This research was funded by the National Natural Science Foundation of China, grant numbers 41907389 and 41871375, National Key Research and Development Program of China, grant number 2018YFB2100700, and Basic Foundation of Chinese Academy of Surveying and Mapping (AR2010).

Conflicts of Interest

The authors declare no conflict of interest.

Appendix A

Table A1. Information of Air Monitoring Stations.
OrderStation NameLatitudeLongitudeTypeAvailability
1Weifang arbitration committee36.702119.122National monitoring stationsAvailable
2Weifang environmental protection bureau36.702119.144
3Hanting Station36.774119.191
4Weifang No. 7 High School36.687119.017
5Weifang Fangzi post36.652119.164
6Weifang College36.715119.176Provincial monitoring stations
7Weifang government36.728119.018
8Jincheng Middle School36.772119.098
9Xinhui group36.637119.107
10Shouguang monitoring station36.869118.735City monitoring stations
11Zhucheng Safety Supervision Bureau36.004119.406
12Changle Sports Bureaus36.730118.834
13Changyi No. 7 High School36.859119.431
14East side in Binhai district37.020119.145
15Qingzhou Guangtong group36.742118.494
16Gaomi college town36.343119.748
17Anqiu Qingyunhu village36.479119.223
18Changyi Xiaying school37.051119.479
19Zhucheng Technology School36.045119.404
20Xiashan water works36.503119.411
21Gaomi Ruiguang electronic36.411119.807
22Changle Wutu street36.684118.887
23Fangzi Luneng school36.614119.124
24Linqu qushan36.503118.543
25Experimental school in Gaoxin district36.687119.198
26West side in Binhai district37.116118.999
27Hanting foreign language school36.758119.205
28Shouguang business district36.859118.787
29Shouguang Hou village37.047119.075
30Qingzhou monitoring station36.681118.491
31Shouguang Yangkou village37.240118.879
32Qingzhou Shuangbeistadium36.657118.456
33Normal university of Special education36.734119.078
34Linqu water works36.500118.520
35Gaomi Sports Bureaus36.359119.802
36Changle Zhuliu street36.715118.875
37Changyi highway bureau36.842119.390
38Anqiu Qingyunshan scenic spot36.437119.240

References

  1. He, J.; Ding, S.; Liu, D.F. Exploring the spatiotemporal pattern of PM2.5 distribution and its determinants in Chinese cities based on a multilevel analysis approach. Sci. Total Environ. 2019, 659, 1513–1525. [Google Scholar] [CrossRef] [PubMed]
  2. Xie, R.; Zhao, G.; Zhu, B.Z.; Chevallier, J. Examining the Factors Affecting Air Pollution Emission Growth in China. Environ. Modeling Assess. 2018, 23, 389–400. [Google Scholar] [CrossRef]
  3. Liu, J.; Kiesewetter, G.; Klimont, Z.; Cofala, J.; Heyes, C.; Schöpp, W.; Zhu, T.; Cao, G.; Gómez-Sanabria, A.; Sander, R.; et al. Mitigation pathways of air pollution from residential emissions in the Beijing-Tianjin-Hebei region in China. Environ. Int. 2019, 125, 236–244. [Google Scholar] [CrossRef] [PubMed]
  4. Burnett, R.; Chen, H.; Szyszkowicz, M.; Fann, N.; Hubbell, B.; Pope, C.A.; Apte, J.S.; Brauer, M.; Cohen, A.; Weichenthal, S.; et al. Global estimates of mortality associated with long-term exposure to outdoor fine particulate matter. Proc. Natl. Acad. Sci. USA 2018, 115, 9592–9597. [Google Scholar] [CrossRef] [PubMed] [Green Version]
  5. Fang, D.; Wang, Q.G.; Li, H.M.; Yu, Y.; Lu, Y.; Qian, X. Mortality effects assessment of ambient PM2.5 pollution in the 74 leading cities of China. Sci. Total Environ. 2016, 569–570, 1545–1552. [Google Scholar] [CrossRef] [PubMed]
  6. Li, Y.; Dai, Z.; Liu, X. Analysis of Spatial-Temporal Characteristics of the PM2.5 Concentrations in Weifang City, China. Sustainability 2018, 10, 2960. [Google Scholar] [CrossRef] [Green Version]
  7. Cheng, Z.H.; Li, L.S.; Liu, J. Identifying the spatial effects and driving factors of urban PM2.5 pollution in China. Ecol. Indic. 2017, 82, 61–75. [Google Scholar] [CrossRef]
  8. Liu, H.; Fang, C.; Zhang, X.; Wang, Z.; Bao, C.; Li, F. The effect of natural and anthropogenic factors on haze pollution in Chinese cities: A spatial econometrics approach. J. Clean. Prod. 2017, 165, 323–333. [Google Scholar] [CrossRef]
  9. Ma, Y.; Ji, Q.; Fan, Y. Spatial linkage analysis of the impact of regional economic activities on PM2.5 pollution in China. J. Clean. Prod. 2016, 139, 1157–1167. [Google Scholar] [CrossRef]
  10. Wei, X.; Liu, M.; Yang, J.; Du, W.-N.; Sun, X.; Huang, Y.-P.; Zhang, X.; Khalil, S.K.; Luo, D.-M.; Zhou, Y.-D. Characterization of PM2.5-bound PAHs and carbonaceous aerosols during three-month severe haze episode in Shanghai, China: Chemical composition, source apportionment and long-range transportation. Atmos. Environ. 2019, 203, 1–9. [Google Scholar] [CrossRef]
  11. Yan, D.; Lei, Y.; Shi, Y.; Zhu, Q.; Li, L.; Zhang, Z. Evolution of the spatiotemporal pattern of PM2.5 concentrations in China–A case study from the Beijing-Tianjin-Hebei region. Atmos. Environ. 2018, 183, 225–233. [Google Scholar] [CrossRef]
  12. Zhang, Z.; Wang, W.; Cheng, M.; Liu, S.; Xu, J.; He, Y.; Meng, F. The contribution of residential coal combustion to PM2.5 pollution over China’s Beijing-Tianjin-Hebei region in winter. Atmos. Environ. 2017, 159, 147–161. [Google Scholar] [CrossRef]
  13. Zhang, Y.; Chen, J.; Yang, H.; Li, R.; Yu, Q. Seasonal variation and potential source regions of PM2.5-bound PAHs in the megacity Beijing, China: Impact of regional transport. Environ. Pollut. 2017, 231, 329–338. [Google Scholar] [CrossRef]
  14. Zhang, Y.; Zhang, H.; Deng, J.; Du, W.; Hong, Y.; Xu, L.; Qiu, Y.; Hong, Z.; Wu, X.; Ma, Q.; et al. Source regions and transport pathways of PM2.5 at a regional background site in East China. Atmos. Environ. 2017, 167, 202–211. [Google Scholar] [CrossRef] [Green Version]
  15. Li, C.; Dai, Z.; Yang, L.; Ma, Z. Spatiotemporal Characteristics of Air Quality across Weifang from 2014–2018. Int. J. Environ. Res. Public Health 2019, 16, 3122. [Google Scholar] [CrossRef] [Green Version]
  16. Ghosh, S.; Biswas, J.; Guttikunda, S.; Roychowdhury, S.; Nayak, M. An investigation of potential regional and local source regions affecting fine particulate matter concentrations in Delhi, India. J. Air Waste Manag. Assoc. 2015, 65, 218–231. [Google Scholar] [CrossRef] [PubMed]
  17. Gogikar, P.; Tyagi, B. Assessment of particulate matter variation during 2011–2015 over a tropical station Agra, India. Atmos. Environ. 2016, 147, 11–21. [Google Scholar] [CrossRef]
  18. Hao, T.; Cai, Z.; Chen, S.; Han, S.; Yao, Q.; Fan, W. Transport Pathways and Potential Source Regions of PM2.5 on the West Coast of Bohai Bay during 2009–2018. Atmosphere 2019, 10, 345. [Google Scholar] [CrossRef] [Green Version]
  19. Yan, R.; Yu, S.; Zhang, Q.; Li, P.; Wang, S.; Chen, B.; Liu, W. A heavy haze episode in Beijing in February of 2014: Characteristics, origins and implications. Atmos. Pollut. Res. 2015, 6, 867–876. [Google Scholar] [CrossRef]
  20. Donnelly, A.; Broderick, B.; Misstear, B. The effect of long-range air mass transport pathways on PM10 and NO2 concentrations at urban and rural background sites in Ireland: Quantification using clustering techniques. J. Environ. Sci. Health Part A 2015, 50, 647–658. [Google Scholar] [CrossRef] [PubMed]
  21. Lee, S.; Ho, C.-H.; Choi, Y.-S. High-PM10 concentration episodes in Seoul, Korea: Background sources and related meteorological conditions. Atmos. Environ. 2011, 45, 7240–7247. [Google Scholar] [CrossRef]
  22. Tiwari, S.; Dumka, U.; Gautam, A.; Kaskaoutis, D.; Srivastava, A.; Bisht, D.; Chakrabarty, R.; Sumlin, B.; Solmon, F. Assessment of PM2.5 and PM10 over Guwahati in Brahmaputra River Valley: Temporal evolution, source apportionment and meteorological dependence. Atmos. Pollut. Res. 2017, 8, 13–28. [Google Scholar] [CrossRef]
  23. Li, D.; Liu, J.; Zhang, J.; Gui, H.; Du, P.; Yu, T.; Wang, J.; Lu, Y.; Liu, W.; Cheng, Y. Identification of long-range transport pathways and potential sources of PM2.5 and PM10 in Beijing from 2014 to 2015. J. Environ. Sci. 2017, 56, 214–229. [Google Scholar] [CrossRef] [PubMed]
  24. Li, M.; Huang, X.; Zhu, L.; Li, J.; Song, Y.; Cai, X.; Xie, S. Analysis of the transport pathways and potential sources of PM10 in Shanghai based on three methods. Sci. Total Environ. 2014, 414, 525–534. [Google Scholar] [CrossRef] [PubMed]
  25. Yang, W.; Wang, G.; Bi, C. Analysis of Long-Range Transport Effects on PM2.5 during a Short Severe Haze in Beijing, China. Aerosol Air Qual. Res. 2017, 17, 1610–1622. [Google Scholar] [CrossRef]
  26. Liao, T.; Wang, S.; Ai, J. Gui, K.; Duan, B.; Zhao, Q.; Zhang, X.; Jiang, W.; Sun, Y. Heavy pollution episodes, transport pathways and potential sources of PM2.5 during the winter of 2013 in Chengdu (China). Sci. Total Environ. 2017, 584–585, 1056–1065. [Google Scholar] [CrossRef]
  27. Xin, Y.; Wang, G.; Chen, L. Identification of Long-Range Transport Pathways and Potential Sources of PM10 in Tibetan Plateau Uplift Area: Case Study of Xining, China. Environ. Pollut. 2014, 224, 44–53. [Google Scholar] [CrossRef]
  28. Lv, B.; Liu, Y.; Yu, P.; Zhang, B.; Bai, Y. Characterizations of PM2.5 Pollution Pathways and Sources Analysis in Four Large Cities in China. Aerosol Air Qual. Res. 2015, 15, 1836–1843. [Google Scholar] [CrossRef]
  29. Draxler, R.; Hess, G. An overview of HYSPLIT-4 modeling system for trajectories dispersion and deposition. Aust. Met. Mag. 1998, 47, 295–308, ISSN: 0004-9743. [Google Scholar]
  30. Sahu, S.; Zhang, H.; Guo, H.; Hu, J.; Ying, Q.; Kota, S. Health risk associated with potential source regions of PM2.5 in Indian cities. Air Qual. Atmos. Health 2019, 12, 327–340. [Google Scholar] [CrossRef]
  31. Yang, K.; Li, Q.; Yuan, M.; Guo, M.; Wang, Y.; Li, S.; Tian, C.; Tang, J.; Sun, J.; Li, J.; et al. Temporal variations and potential sources of organophosphate esters in PM2.5 in Xinxiang, North China. Chemosphere 2019, 215, 500–506. [Google Scholar] [CrossRef] [PubMed]
  32. Sirois, A.; Bottenheim, J. Use of backward trajectories to interpret the 5-year record of pan and O3 ambient air concentrations at Kejimkujik National Park, Nova Scotia. J. Geophys. Res. 1995, 100, 2867–2881. [Google Scholar] [CrossRef]
  33. Ashbaugh, L.; Malm, W.; Sadeh, W. A residence time probability analysis of sulfur concentrations at Grand Canyon National Park. Atmos. Environ. 1985, 19, 1263–1270. [Google Scholar] [CrossRef]
  34. Wang, Y.; Zhang, X.; Draxler, R. TrajStat: GIS-based software that uses various trajectory statistical analysis methods to identify potential sources from long-term air pollution measurement data. Environ. Model. Softw. 2009, 24, 938–939. [Google Scholar] [CrossRef]
  35. Dimitriou, K.; Kassomenos, P. Combining AOT, Angstrom Exponent and PM concentration data, with PSCF model, to distinguish fine and coarse aerosol intrusions in Southern France. Atmos. Res. 2016, 172–173, 74–82. [Google Scholar] [CrossRef]
  36. Polissar, A.; Hopke, P.; Poirot, R. Atmospheric aerosol over Vermont: Chemical composition and sources. Environ. Sci. Technol. 2001, 35, 4604–4621. [Google Scholar] [CrossRef]
  37. Wang, L.; Liu, Z.; Sun, Y.; Ji, D.; Wang, Y. Long-range transport and regional sources of PM2.5 in Beijing based on long-term observations from 2005 to 2010. Atmos. Res. 2015, 157, 37–48. [Google Scholar] [CrossRef]
  38. Zhang, K.; Shang, X.; Herrmann, H.; Meng, F.; Mo, Z.; Chen, J.; Lv, W. Approaches for identifying PM2.5 source types and source areas at a remote background site of South China in spring. Sci. Total Environ. 2019, 691, 1320–1327. [Google Scholar] [CrossRef] [PubMed]
  39. Stohl, A. Trajectory statistics-a new method to establish source-receptor relationships of air pollutants and its application to the transport of particulate sulfate in Europe. Atmos. Environ. 1996, 30, 579–587. [Google Scholar] [CrossRef]
  40. Stohl, H.; Krom-kolb, H. Origin of ozone in Vienna and surroundings, Austria. Atmos. Environ. 1994, 28, 1255–1266. [Google Scholar] [CrossRef]
  41. Liu, H.; Fang, C.; Huang, J.; Zhu, X.D.; Zhou, Y.; Wang, Z.B.; Zhang, Q. The spatial-temporal characteristics and influencing factors of air pollution in Beijing-Tianjin-Hebei urban agglomeration. J. Geogr. Sci. 2018, 73, 177–191. [Google Scholar] [CrossRef]
  42. Yang, Q.; Yuan, Q.; Li, T.; Shen, H.; Zhang, L. The Relationships between PM2.5 and Meteorological Factors in China: Seasonal and Regional Variations. Int. J. Environ. Res. Public Health 2017, 14, 1510. [Google Scholar] [CrossRef] [Green Version]
  43. Zhan, D.; Kwan, M.; Zhang, W.; Yu, X.; Meng, B.; Liu, Q. The driving factors of air quality index in China. J. Clean. Prod. 2018, 197, 1342–1351. [Google Scholar] [CrossRef]
  44. Yan, X.; Gou, X.; Wu, W.; Huang, F.; Yang, J.; Liu, Y. Analysis of atmospheric particulate transport path and potential source area in Yinchuan. Acta Sci. Circumstantiae 2018, 38, 1727–1738. [Google Scholar] [CrossRef]
  45. Shandong’s Outer Dust in April Became the Main Force of PM10 Pollution. Available online: http://weifang.iqilu.com/rdjj/2016/0512/2785473.shtml (accessed on 12 May 2016).
  46. Wang, S.; Zhou, C.; Wang, Z.; Feng, K.; Hubacek, K. The characteristics and drivers of fine particulate matter (PM2.5) distribution in China. J. Clean. Prod. 2017, 142, 1800–1809. [Google Scholar] [CrossRef]
Figure 1. Study area and spatial distribution of monitoring sites.
Applsci 10 02835 g001
Figure 2. Structures of monitoring station data and GDAS data.
Applsci 10 02835 g002aApplsci 10 02835 g002b
Figure 3. Quarterly and monthly characteristics of PM2.5 concentration in Weifang.
Applsci 10 02835 g003
Figure 4. Cluster mean back-trajectories in different seasons in Weifang from March 2015 to February 2016.
Applsci 10 02835 g004aApplsci 10 02835 g004b
Figure 5. Spatial distribution of WPSCF values of PM2.5 in spring, summer, autumn, and winter from March 2015 to February 2016.
Applsci 10 02835 g005
Figure 6. Spatial distribution of WCWT values of PM2.5 in spring, summer, autumn, and winter from March 2015 to February 2016.
Applsci 10 02835 g006
Table 1. Trajectory proportions and PM2.5 concentrations based on all trajectories and pollution trajectories.
SeasonTrajectory ClusterAll TrajectoriesPolluted Trajectories
Proportion (%)Average (μg/m3)Proportion of Seasonal Total Polluted Trajectories (%)Average (μg/m3)
Spring112.0883.3529.43109.71
245.3669.6331.5599.46
327.1553.7218.8398.21
415.4176.6420.20111.62
All 70.83 104.87
Summer134.0641.5012.0489.41
222.7142.934.4588.29
36.6362.9520.6899.94
421.1668.1643.1994.13
515.4447.5919.6396.24
All 52.63 94.92
Autumn125.8094.5252.60124.22
274.2066.5347.40116.84
All 80.53 120.72
Winter137.11148.0855.72158.08
262.8982.9944.28114.11
All 115.54 138.61

