Article

Transient Study of Flow and Cavitation Inside a Bileaflet Mechanical Heart Valve

1
Institute of Process Equipment, College of Energy Engineering, Zhejiang University, Hangzhou 310027, China
2
State Key Laboratory of Fluid Power and Mechatronic Systems, Zhejiang University, Hangzhou 310027, China
*
Authors to whom correspondence should be addressed.
Appl. Sci. 2020, 10(7), 2548; https://doi.org/10.3390/app10072548
Submission received: 13 March 2020 / Revised: 30 March 2020 / Accepted: 31 March 2020 / Published: 8 April 2020
(This article belongs to the Section Applied Biosciences and Bioengineering)

Abstract

:
A mechanical heart valve (MHV) is an effective device to cure heart disease, which has the advantage of long life and high reliability. Due to the hemodynamic characteristics of blood, mechanical heart valves can lead to potential complications such as hemolysis, which have damage to the blood elements and thrombosis. In this paper, flowing features of the blood in the valve are analyzed and the cavitation mechanism in bileaflet mechanical heart valve (BMHV) is studied. Results show that the water hammer effect and the high-speed leakage flow effect are the primary causes of the cavitation in the valve. Compared with the high-speed leakage flow effect, the water hammer has a greater effect on the cavitation strength. The valve goes through four kinds of working condition within one heart beating period, including, fully opening stage, closing stage and fully closing stage. These four stages, respectively, make up 8.5%, 16.1%, 4.7% and 70.7% of the total period. The cavitation occurs on the fully closing stage. When the valve is in closing stage, the high pressure downstream of the valve lasts for about 20 ms and the high-speed leakage flow lasts for about 200 ms. This study systematically analyzes the causes of cavitation emerged in the process of periodic motion, which proposes the method for characterizing the intensity of the cavitation, and can be referred to for the cavitation suppression of the BHMV and similar valves.

1. Introduction

The valvular heart disease is a significant health problem for more than 100 million people worldwide and has a high mortality rate [1]. According to previous studies [2], the incidence of these diseases would continue to increase, due to the increasing pathological burden of degenerative diseases and rheumatic fever. In the treatment of valvular heart disease, the bileaflet mechanical heart valve (BMHV), which has long service life and reliable performance, has a tremendous impact on the treatment of the valvular heart disease in the field of biomedicine, and has become the most common treatment device. The BHMV is usually implanted in the heart to replace the diseased heart valve. Although it is widely used in clinical studies, the BHMV still has defects and causes main complications including hemolysis, thrombocytopenic and thromboembolism. In addition, non-physiological geometry of the valve can cause abnormal velocity distribution of blood flow when the heart valve is implanted.
The main concerns of valve research have been the performance [3] and the internal flow properties [4]. In order to study the hydrodynamic characteristics of the mechanical heart valve, numerical simulation based on CFD is one powerful tool to study cardiovascular risk factors, especially those related to mechanical properties of artificial heart valve [5]. It is an effective way to improve the performance of the valve by structure optimization, which is applicable to many valves +(e.g., Tesla valve) [6,7], and the BMHV is no exception. Many works on the effect of geometric features of the BMHV on blood stream are performed by simulations in the past years. For example, it has been found that the maximum shear stress within the range of platelet activation can lead to thrombosis [8,9]. The strategy of self-adapting mesh is used to capture the motion of the leaflet realizing by user-defined functions (UDF) in the commercial software [10]. It is found that the valve leaflet and the valve pivot are continuously exposed to shear stress higher than 52.3 Pa, which can cause damage to the platelets. The problem of thrombosis can be solved by increasing the curvature of the leaflet of the bileaflet mechanical heart valve [11]. Results show that increasing the curvature of the leaflet can provide larger central circulation area and reduce the risk of thrombosis. Another way [12] is proposed by using BMHV with SH coating to reduce the interaction between blood and BMHV. Based on effect analysis of BMHV with SH coating on blood substances and hemodynamics, the performance index of BMHV with SH coating, which is the effective orifice area (EOA) based on the ISO-5840/2005 guidance document, increases by 2.5%. Different models [13] were used to predict the hemodynamics in BMHV. The results based on stress-based models have higher levels of blood damage than that of strain-based models. Additionally, the FSI model can better capture the fast opening motion and closing motion of the valve and its interaction with the blood in the Valsalva sinus [14]. In in vitro models, the blood flow is modulated by a self-regulating device mimicking the physiological mechanism; the whole device is based on the contraction and relaxation of the heart muscle during the cardiac cycle [15]. Studies about in vitro models show that they are suitable to provide the simultaneous measurement of all different quantities of interest for hemodynamics performance and the analysis of their mutual interactions [16].
Different from native heart valve, the BMHV has greater resistance to flow of the blood during diastolic phase, and therefore greatly increases the flow velocity into the coronary artery. In addition, it changes the distribution of wall shear stress and increases the risk of coronary artery disease [17]. The implantation orientation [18], angle [19] and position [20] of the BHMV have the significant impact on blood flow and motion of the leaflet. With the implantation angle of the BMHV increased, the degree of asymmetry of the blood flow and the leaflet motion is increased, which can lead to unbalanced forces imposed on BHMV. Coronary flow rate is directly affected by the size, direction and time evolution of the vortex in the sinus, which are sensitive to the orientation of the valve. In term of implantation position, it is found that under similar physiological conditions, the von-mises stresses of the BMHV placed at the root of aorta with axisymmetric sinus are 47% higher than stresses of the BMHV placed at the aorta with axisymmetric bulb. In addition, the leaflet thickness has a significant effect on the flow of the blood [21]. When the leaflet thickness is reduced by 0.1 mm, the equivalent stress is 75% higher than the allowable equivalent stress. Therefore, thinner leaflet cannot be used to replace the diseased aortic valves.
Research shows that there are a large number of vortices in the cardiac and large arteries, which play fundamental roles in the normal physiology. Due to vortices, there is a proper balance between blood motion and stresses on the surrounding tissues [22], and the length of the leaflet can vastly affect the transmitral vortex formation, possibly due to altered flow-wall interaction [23]. The detail of the vortex formation including its deformation and breakdown can be described precisely by numerical simulation [24,25]. In order to fully reveal the fundamental flow characteristics of the BMHV at different working conditions, several researchers have begun to focus on dynamic characteristics of the BMHV [26]. In recent studies, the transient flow details of the blood in the ascending aorta have been presented by a fully coupled simulation method [27]. Results show that the gradient of trans valvular pressure difference produced by On-X valve is relatively small, which can reduce cardiac external work. Trajectories of blood substance are estimated by Lagrangian particle tracking method [28], which can quantify the movement of the leaflet by tracking the position of the leaflet tip during the whole closing process. In addition, the reverse leakage flow passing through the hinge gap is studied, to reduce damage to blood substances [29,30]. The leakage flow has a maximum speed of 4.7 m/s in the simplified axisymmetric sinus during the early diastolic phase. However, the flow field, with an effective spatial resolution of 167 μm and temporal resolution of 594 μs, is measured by two-component PIV. Higher speed leakage is observed t the hinge and the measured average speed can reach as high as 5.7 m/s [31].
To aid clinical decision making and the understanding of pathophysiology, the Lagrangian particle method can be used to improve insight into the transport mechanics of the downstream flow of the valve [32]. Based on this, the pulsating flow in BMHV is simulated by the smoothed particle hydrodynamic method [33]. The advantage of the smoothed particle hydrodynamic method is that it is a Lagrangian method, which can avoid the accuracy loss caused by the grid distortion when the deformation is extremely large. Results show that the non-physiological flow pattern and the main vertical structure have an important influence on the shear stress of blood components. The full three-dimensional geometry of the MHV with moving leaflet in a typical human heart cycle is simulated. The simulation can essentially reproduce the pressure distribution of the left ventricle and the aorta. From the simulation results, wall shear stress and vorticity can be derived to further understand the performance of the valve.
Cavitation is the process of the formation, development and collapse of vapor or gas cavities in the liquid or at the liquid-solid interface when the local pressure in the liquid decreases [34,35]. In early studies, researchers aimed at developing a physical model, supported by experimental observations, described the formation and growth of microbubbles seen in patients with mitral mechanical heart valve [36]. In order to fully-reveal the generation mechanism of microbubbles, an in vitro dynamic environment closest to the real situation was created. Results show that the vortex formation and microbubbles growth, which take place during valve closure, have far reaching clinical implications [37,38]. The violent collapse of microbubbles induces local erosion that may lead to structural damage and the microbubbles are caused by the cavitation [39], which inevitably leads to energy loss [40]. Although a large number of researchers have done a lot of work on the flow characteristics and structural improvement of MHV, few people pay attention to the cavitation effect. The collapse of the cavitation bubble produces high-speed leakage and shock waves, which damages the valve surface and blood components. Cavitation can increase the probability of thromboembolism. Therefore, it is of great significance to study the cavitation effect. In this work, a transient computational model is developed for calculating the flow and cavitation characteristics of mechanical heart valves and analyzing the mechanism of cavitation.

2. Method and Validation

2.1. Geometric Model

The structure of the bileaflet mechanical heart valve, which is similar to the St. Jude Medical valve, is shown in Figure 1. The BMHV is mainly composed of valve housing and two leaflets. The two leaflets are connected with the valve housing through a hinge. The material density of the leaflet is 2.116 × 10³ kg/m3, the inner diameter is 22.3 mm, the diameter of the upstream pipe is 25 mm, the length is 16.5 mm, and the length of the downstream pipe is 50 mm. The size of the valve is consistent with that in the literature [41].

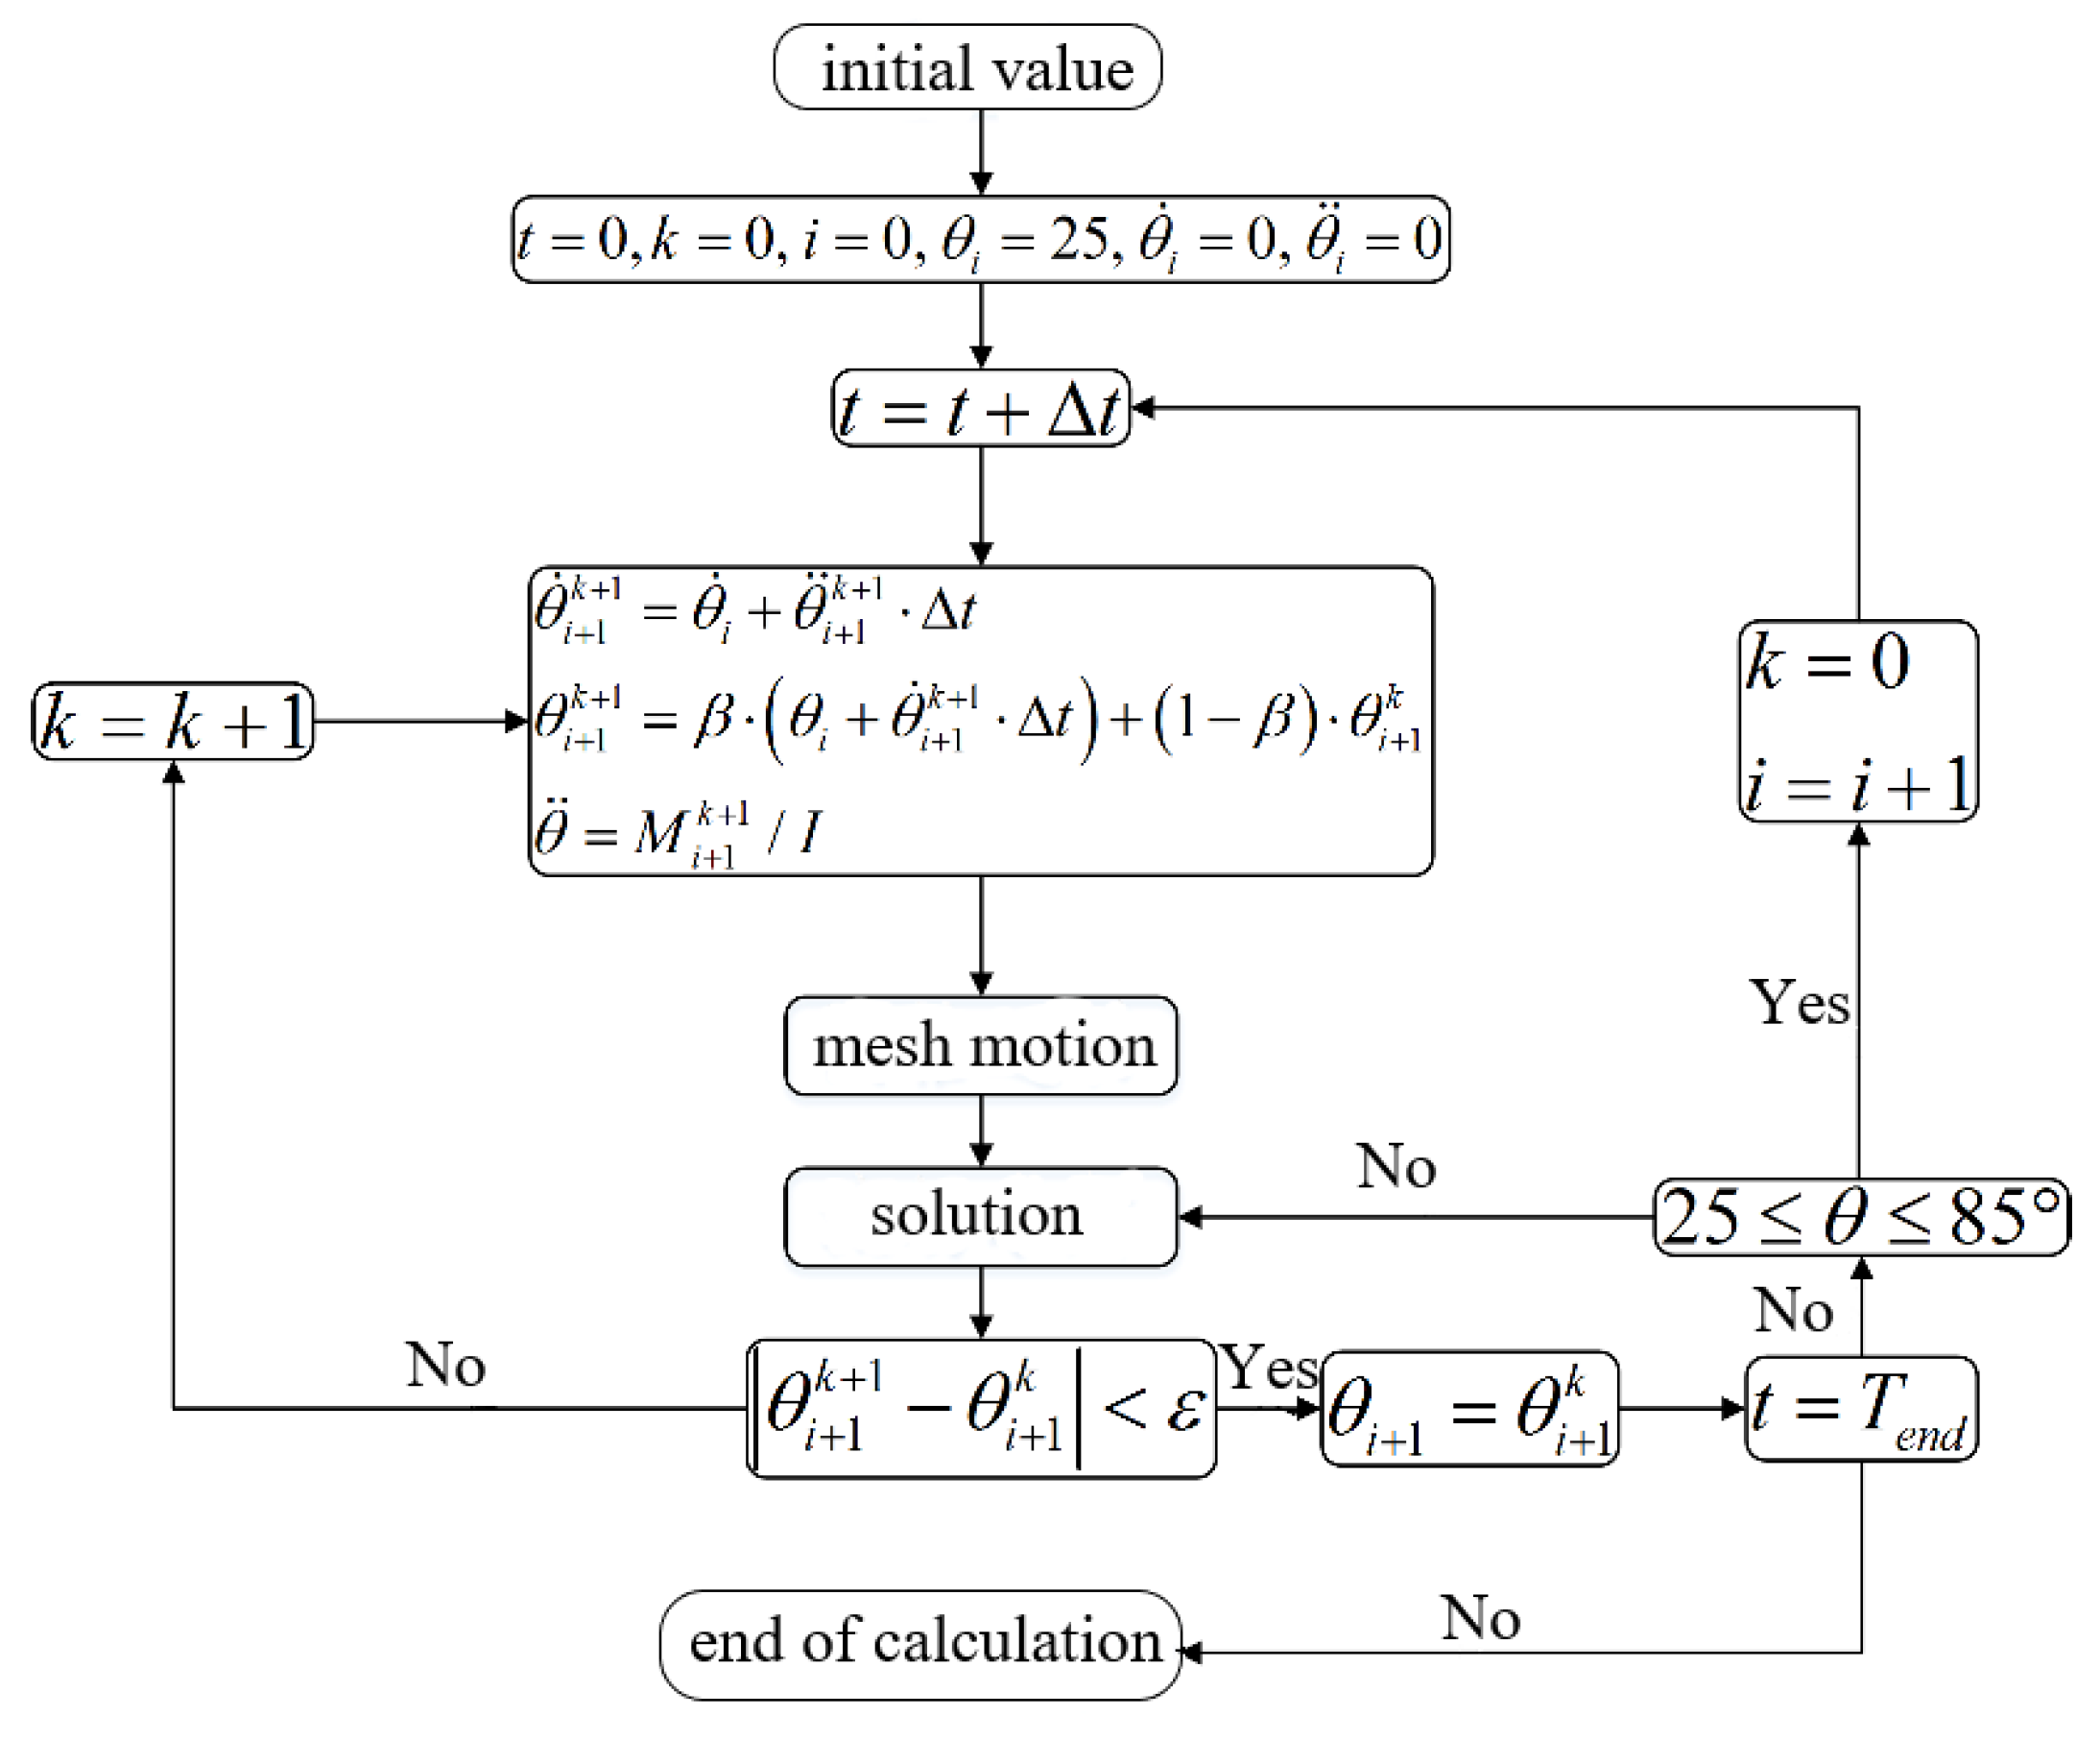
2.2. Numerical Model

As illustrated in Figure 1, the flow channel is divided into three parts to generate mesh. Relatively coarse meshes are selected at the inlet and outlet parts, and relatively dense meshes are used at the vicinity of valve leaflet. The mesh re-generation method when the leaflets are moved is shown below.
When the difference between the latest calculation result and the last one is less than the set convergence criterion, it is considered that the current time step calculation converges and enters the next time step calculation. The detailed calculation process during the mesh updating process at each time step is shown in Figure 2. In order to reveal fully the flow characteristics of the blood in the MHV, the software FLUENT is used in this work. The inlet boundary condition is pressure inlet and the outlet boundary condition is pressure outlet. A no-slip boundary condition was imposed on the walls of the leaflets. The blood is considered as an incompressible Newtonian fluid with the density of 1.06 × 10³ kg/m3 and the dynamic viscosity of 3.5 × 10⁻³ Pa·s. The pressure of saturated steam is 6.343 × 10³ Pa, which is consistent with water at 37.5 °C. Flow is assumed to be laminar and the boundary conditions at heart rate of 70 bpm are loaded by means of the segmental application method.
When the blood flows through the MHV, it follows the laws of mass conservation, momentum conservation and energy conservation. Equations are as follows:
The equation of continuity is expressed as:
p t + ρ u i x i = 0
p is the pressure of the blood; t is the time; ρ is the density of the blood; i is the direction of the blood flow and i = 1, 2, 3.
The moment equation is expressed as:
ρ u j t + ρ u i u j x i = p x j τ i j x i + ρ g j
p is the pressure of the blood; g is the acceleration of gravity; τij is viscous stress tensor and can be expressed as follows:
τ i j = μ ( u j x i + u i x j ) + 2 3 δ i j μ u k x k
μ is dynamic viscosity.
The energy equation is expressed as:
ρ C v T t + ρ C v u i T x i = p u i x j + C p μ Pr 2 T x i 2 τ i j u j x i
T is the temperature of the blood; Pr is Prandtl number; Cv is the specific heat at constant volume; Cp is the specific heat at constant pressure.
The kε equation of the turbulence model in the turbulent viscosity coefficient method is selected to solve the problem of the turbulent flow in the valve. The transport equations of turbulent kinetic energy and turbulent dissipation rate in the standard kε turbulence model are as follows:
x i ( ρ k u i ) = x j [ ( μ + μ t σ k ) k x j ] + G k + G b ρ ε
x i ( ρ ε u i ) = x j [ ( μ + μ t σ ε ) ε x j ] + C 1 ε ε k ( G k + C 3 ε G b ) C 2 ε ρ ε 2 k
k is the turbulent kinetic energy; ε is the turbulence dissipation; Gk and Gb are turbulent kinetic energy due to velocity gradient and buoyancy. C1ε, C2ε and C3ε are model constants.
Checking for grid independence is performed by comparing three different kinds of mesh regimes, respectively with 0.7, 1.4 and 3.5 million cells. As illustrated in Figure 3, the velocity distributions on the symmetrical surface located downstream of the valve are compared when the leaflet is under the half-open stage. The velocity distribution has little difference for the cases with different grids. Therefore, meshing regime with 1.4 million grids is selected. In order to eliminate the influence of grids during the mesh updating process and initial boundary values on the results, four cardiac cycles are simulated exactly. Considering the time and accuracy of calculation, this work selects the most suitable cardiac cycle for analysis.

2.3. Experimental Validation

In order to verify the accuracy of the numerical results, the opening time and closing time of the valve are compared with the data in the literature [41]. According to results obtained by Choi, the duration of opening stage is 66.2 ms, the duration of closing stage is 35.9 ms. In this paper, the duration of opening stage is 67.7 ms, the duration of closing stage is 37.4 ms. The relative error of the duration of opening stage is 2.3% and the relative error of the duration of closing stage is 4.2%. It can be found that the relative errors between the numerical results and reference values in the literature are very small, which verifies the accuracy of the numerical method.

3. Results and Discussion

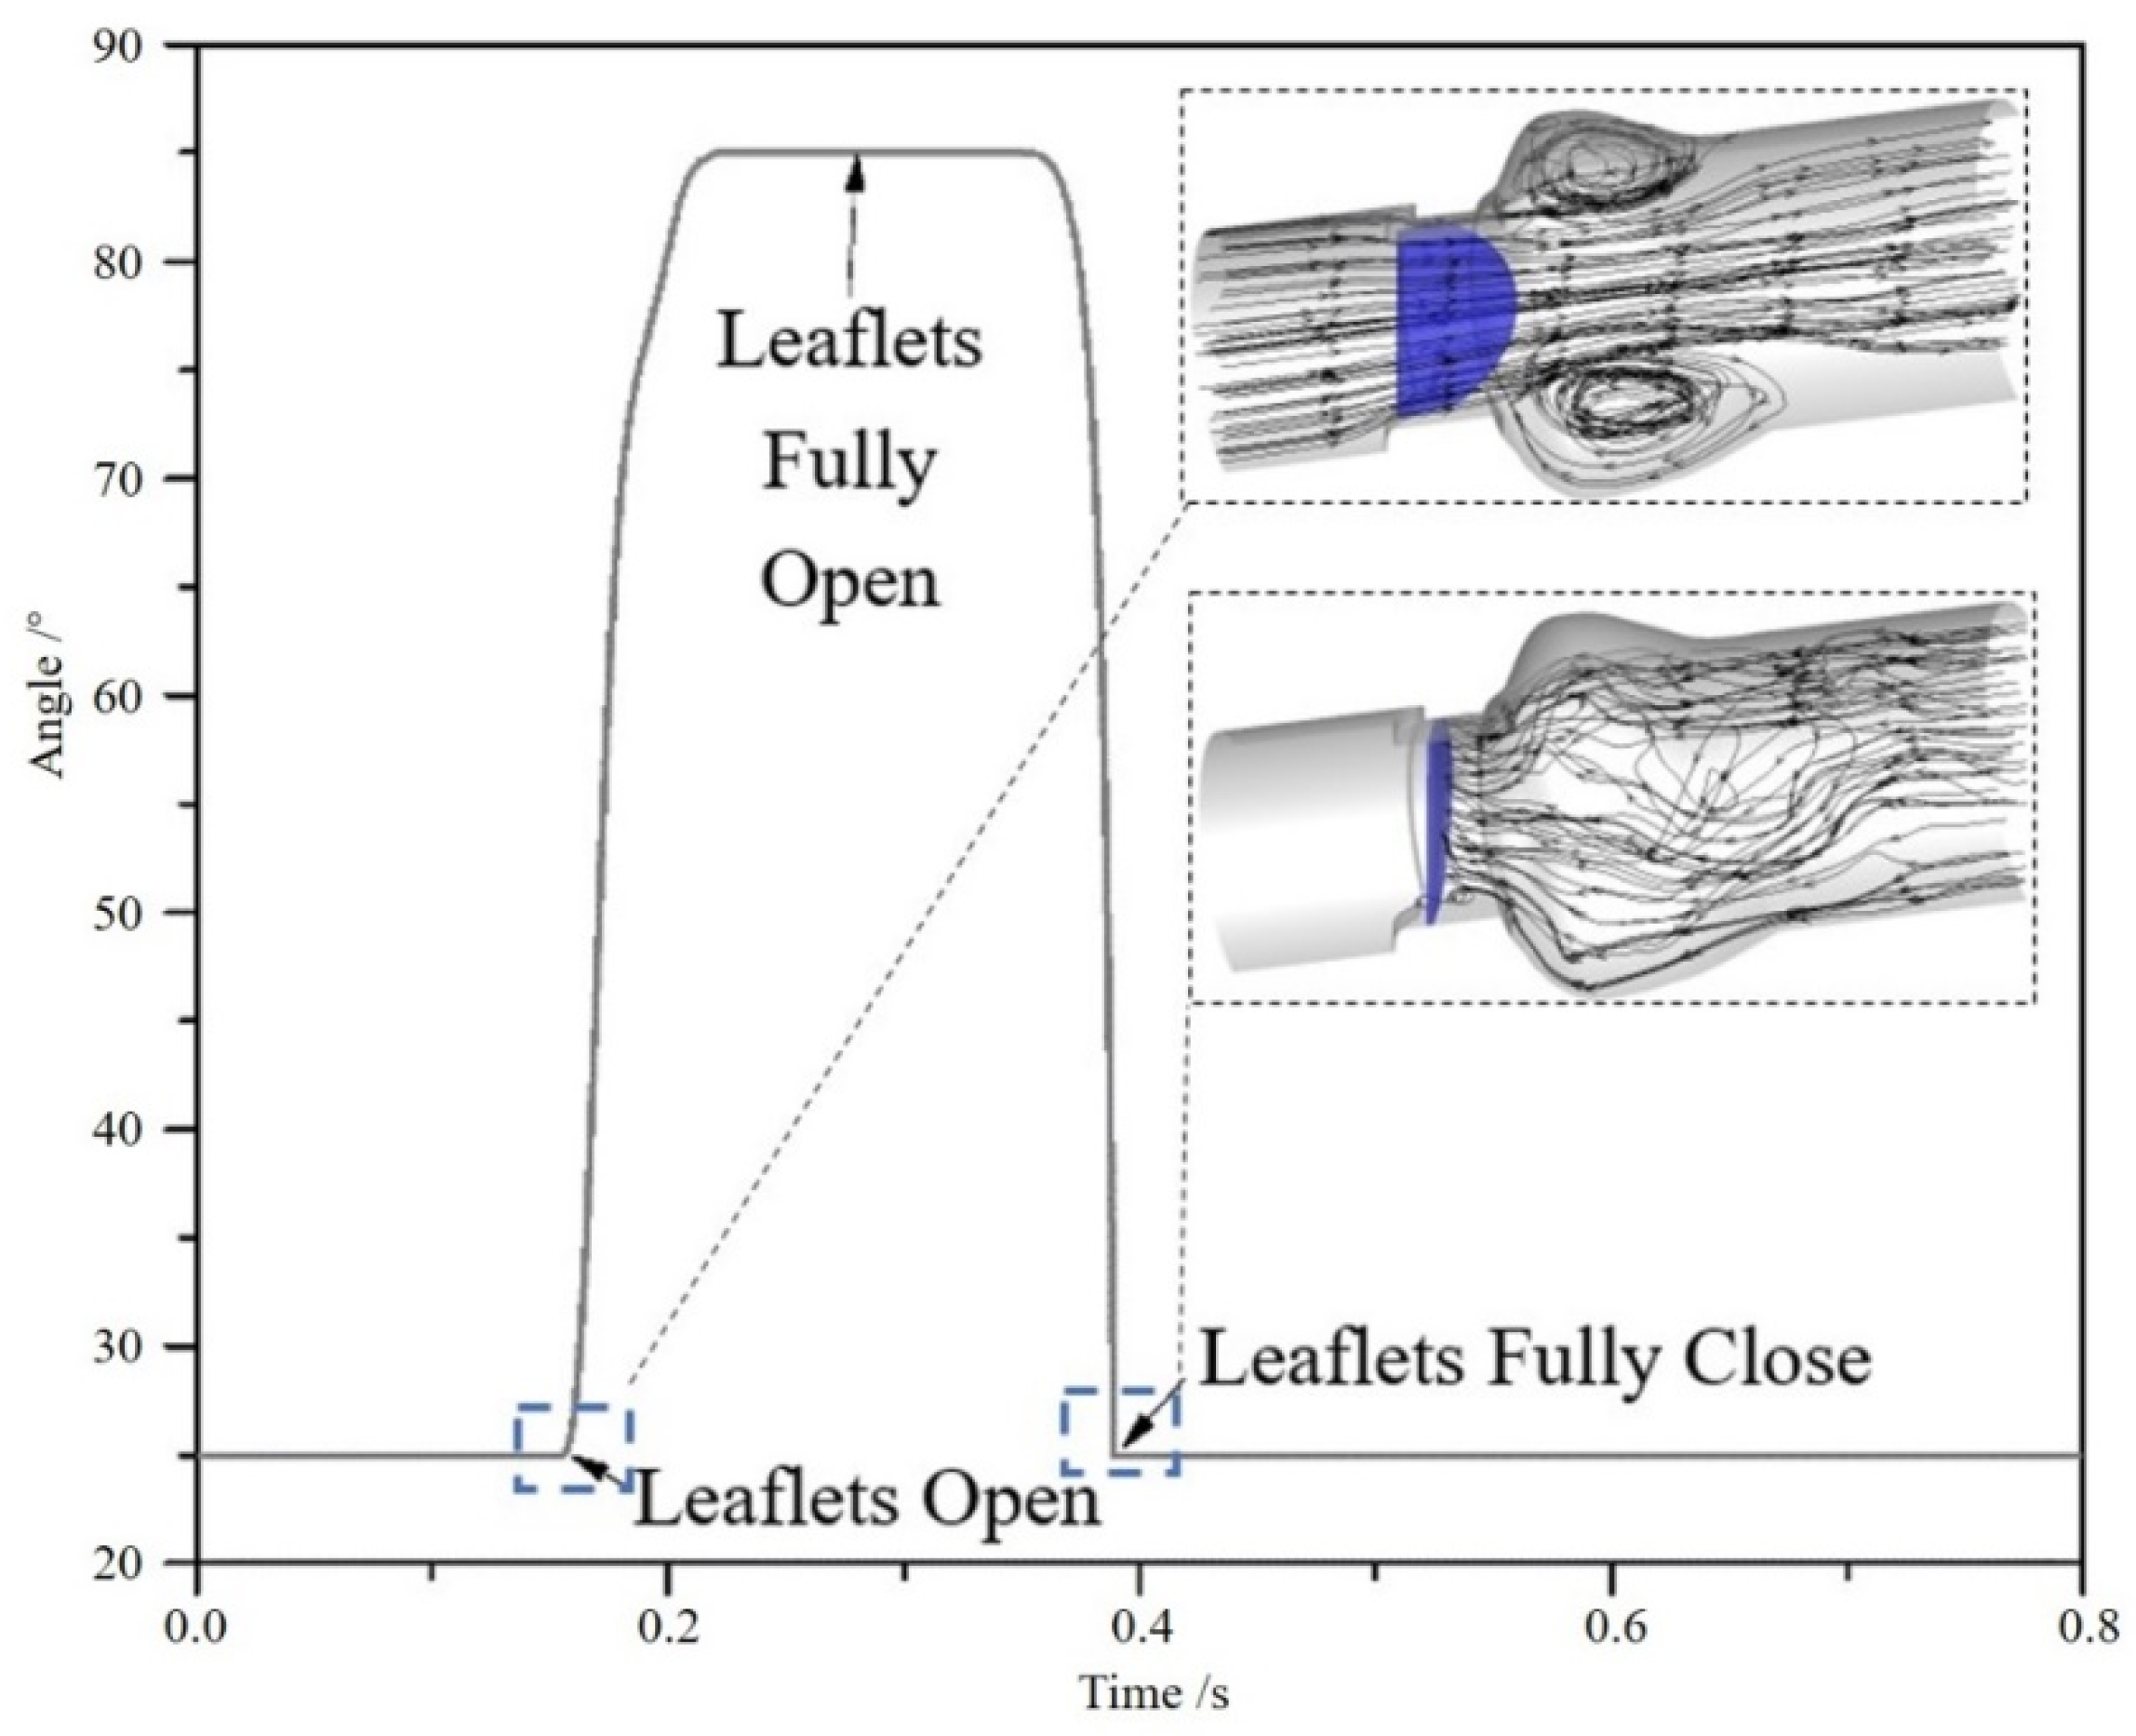
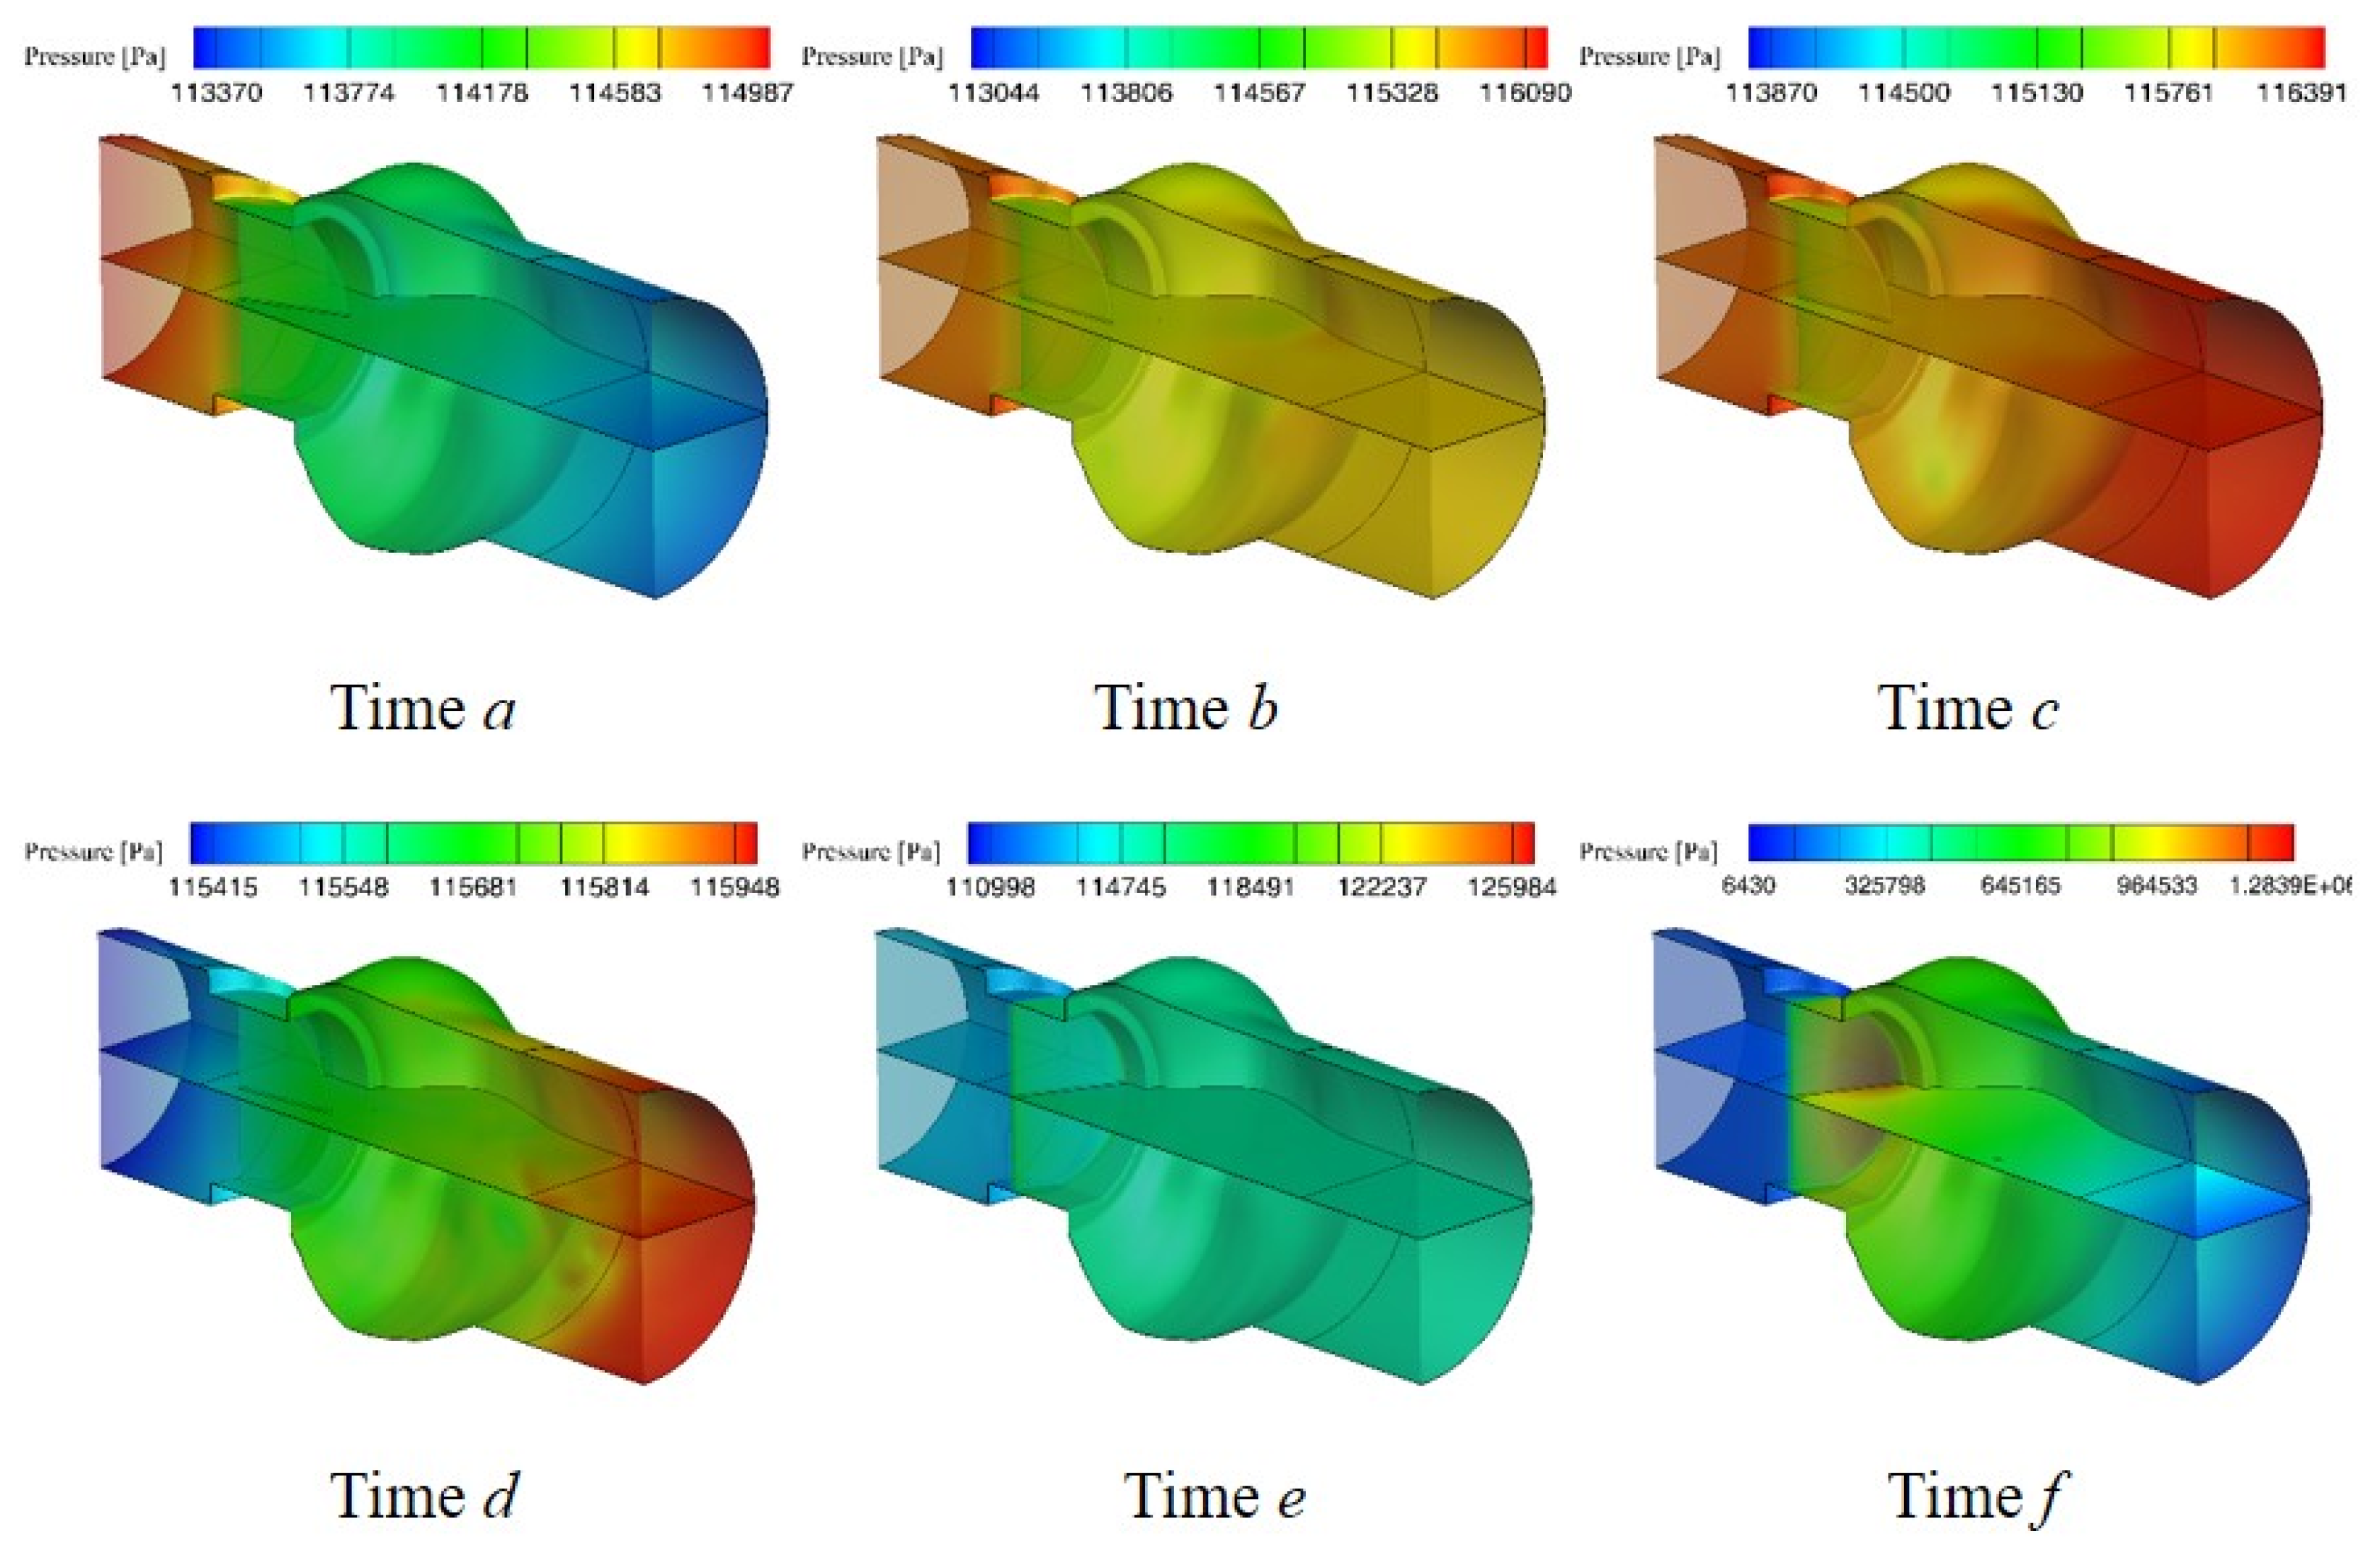
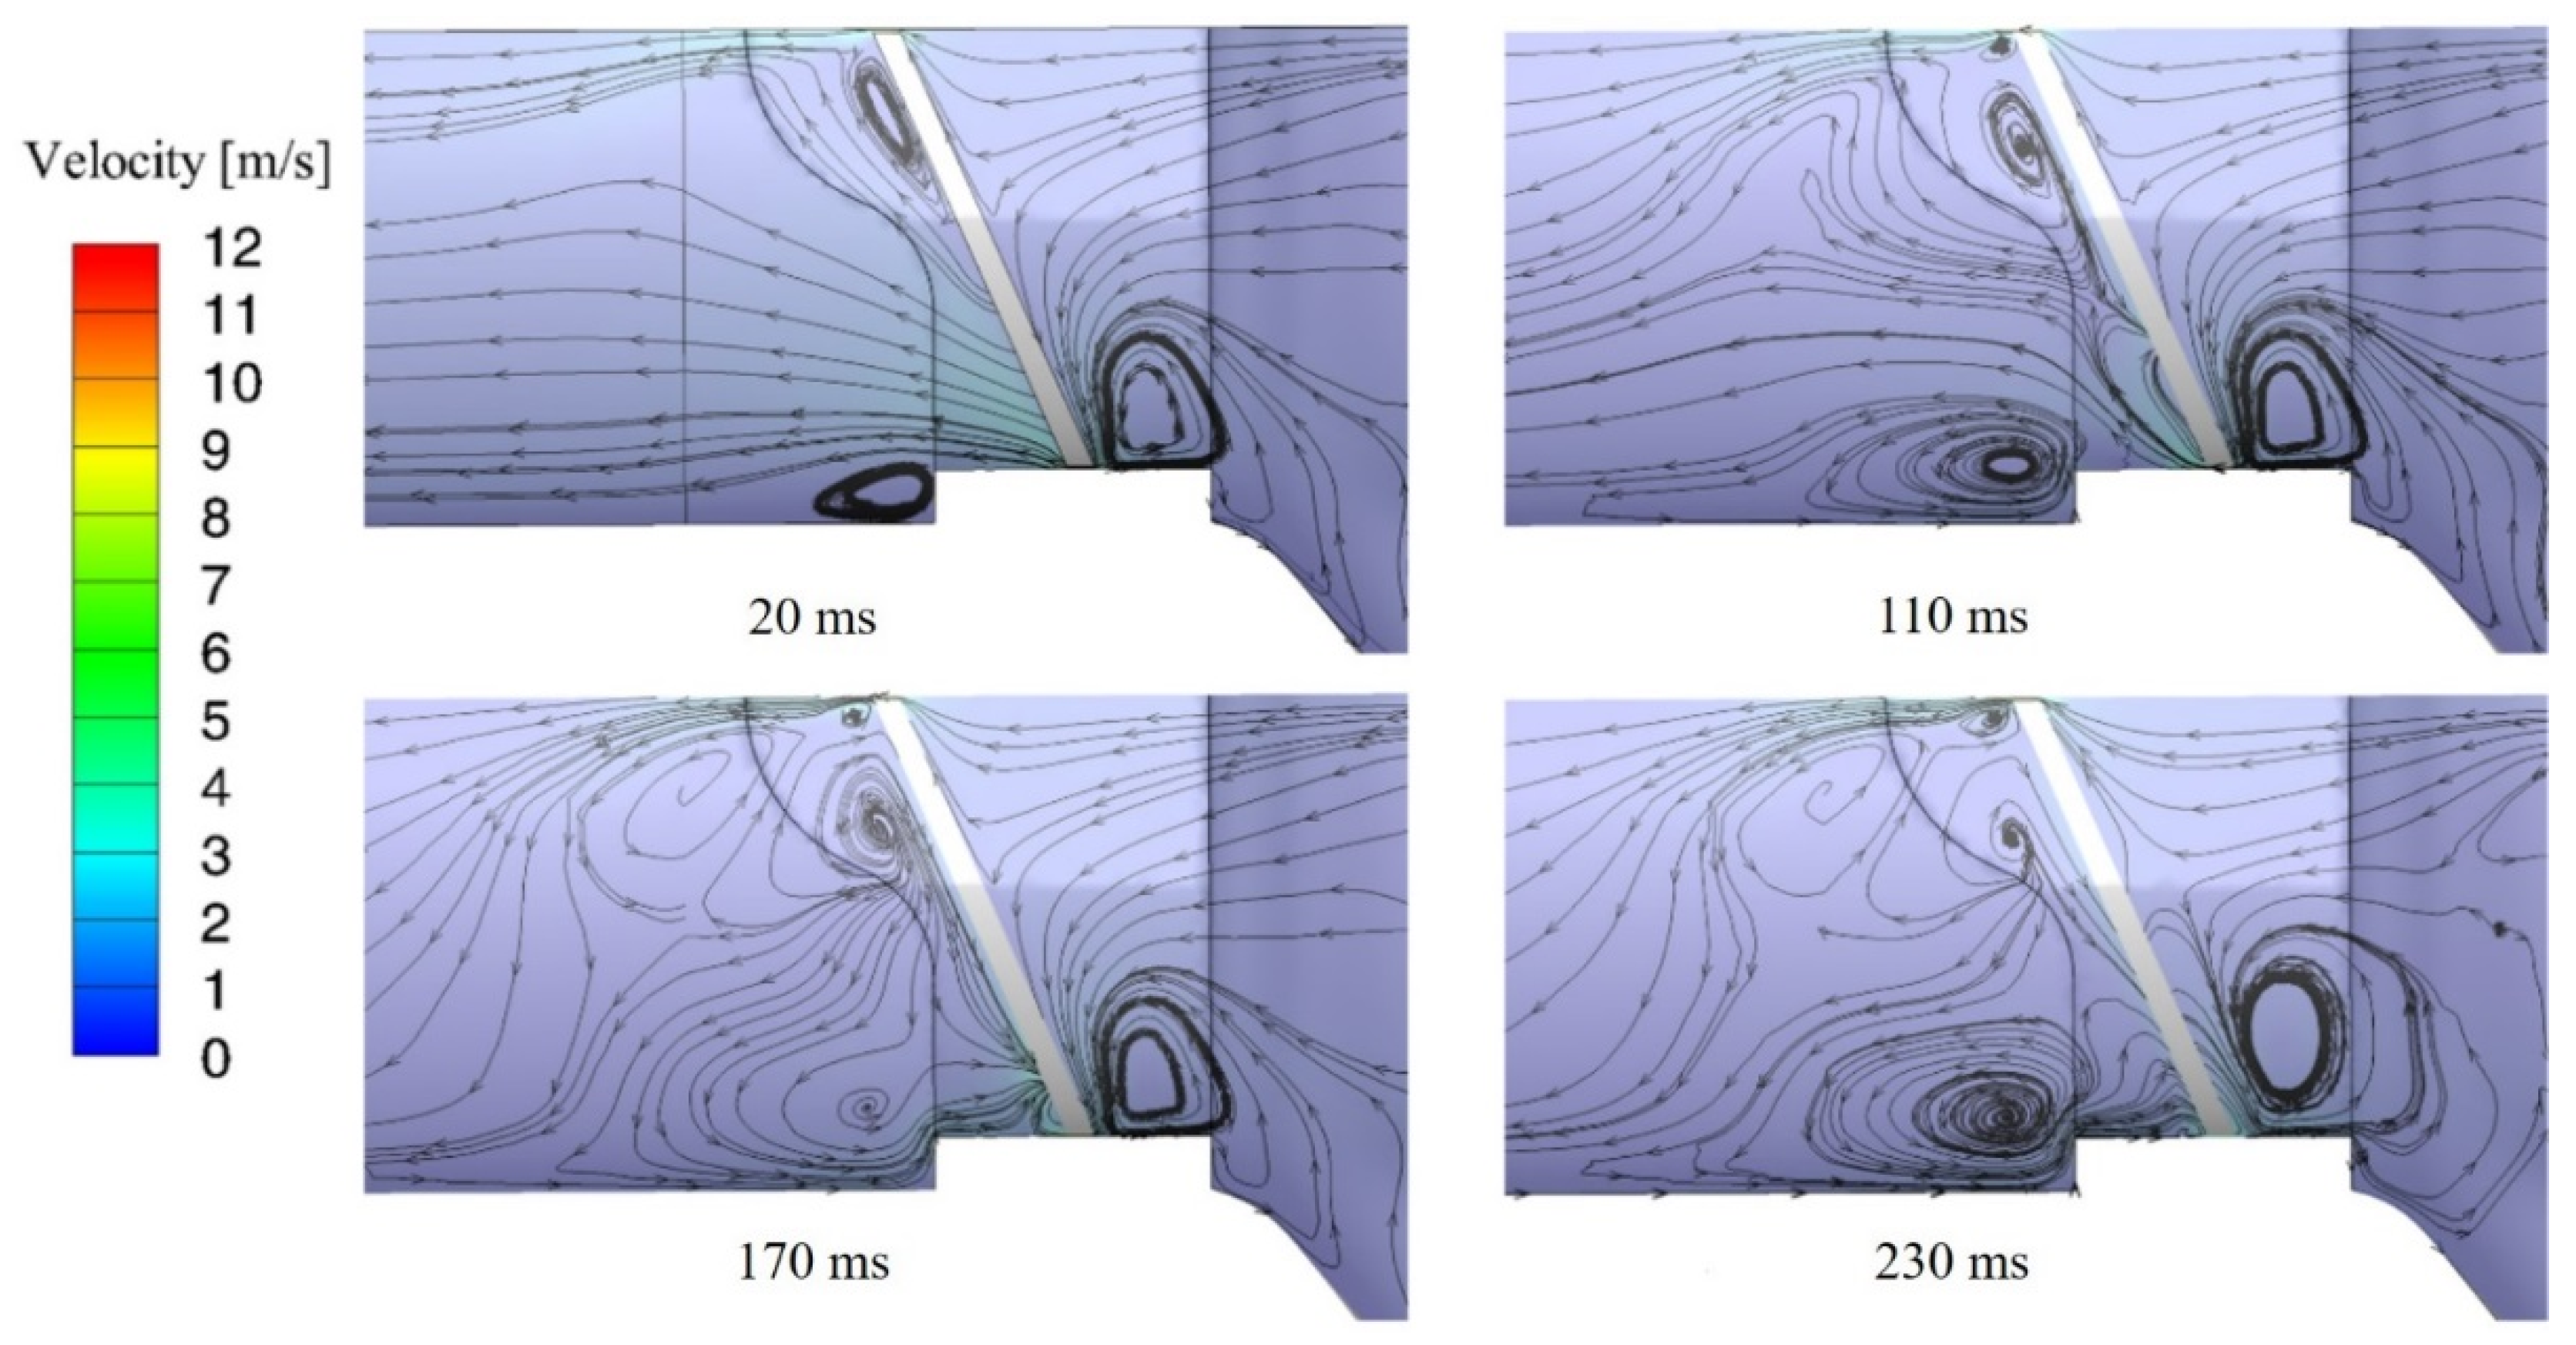
3.1. Flow Characteristics of the Bileaflet Mechanical Heart Valve

Figure 4 shows the motion of the leaflets. Initially, leaflets of the valve are in a closing stage. When the inlet pressure increases rapidly and is higher than the outlet pressure at about 0.155 s, leaflets begin to open. When the time reaches about 0.219 s, the leaflet reaches the fully opened stage. When the time reaches about 0.35 s, the leaflet starts to close because the outlet pressure is higher than the inlet pressure. These four stages, respectively, make up of 8.5%, 16.1%, 4.7% and 70.7% of the total period. It can be found that the closing time of the valve is shorter than opening time. It is caused by the difference between the inlet pressure and outlet pressure. The pressure difference is getting larger and larger and leads to the high-speed of valve leaflets during the closing process.
Figure 5 shows the velocity distribution on the middle plane at different times during the motion of valve leaflets. Time a indicates that leaflets are in the opening process; time b indicates that the valve has just reaches the fully opening stage; time c indicates that the inlet pressure just equals to the outlet pressure; time d indicates that the valve starts to close; time e indicates that leaflet is about to close fully.
From Figure 5, the flow inside the model likes three orifice flows, owing to the existence of the two leaflets. At the beginning of leaflets rotating, the velocity of orifice flows on both sides is higher than that in the middle orifice. As leaflets approach the fully opening stage, the fluid velocity in the middle orifice increases significantly and is larger than that in side orifices. In the meantime, the force acting on the leaflets decreases, so the movement speed of the leaflets decreases. When the outlet pressure is larger than the inlet pressure, the mechanical heart valve starts to close and the flow velocity in the blood vessel starts to decrease. When the leaflets are in the closing stage, the fluid behind the valve is basically blocked by leaflets with a strong leakage flow between the leaflets and the valve housing.
Figure 6 shows the pressure distribution on the middle surface at different times, where time f indicates the valve just reaches the fully closing stage. As can be seen from the Figure 6, during the opening and closing processes of the valve, the pressure is larger than the saturated vapor pressure of blood, indicating that there is no cavitation in the opening stage. When the leaflet just reaches the fully closing stage, as shown in moment f in Figure 6, the pressure has a dramatical variation at the tip of leaflets. The downstream pressure of the valve increases to near 1 MPa, which is about 10 times that of the normal pressure in the model, while the upstream pressure of the valve is significantly reduced to the saturated vapor pressure. The sharp increase of downstream pressure due to valve closing is a common phenomenon of water hammer in hydrodynamics. It indicates that the occurrence of water hammer may be the cause of cavitation in the bileaflet mechanical heart valve.
Figure 7 shows the pressure distribution near the valve leaflet at four different times after the valve is closed. It can be found that after the valve closing, the downstream pressure of the valve leaflet back to normal level, which means the effect of water hammer decreases rapidly in a short time. However, the minimum upstream pressure of the valve is still the saturated vapor pressure, indicating that the occurrence of cavitation is also affected by other factors. From the pressure distribution near the leaflet at 230 microseconds after the valve closing, it can be found that the low-pressure area inside the valve decreases gradually and disappears eventually. In general, the cavitation occurs at the moment of valve closing, and the cavitation intensity increases firstly, then decreases gradually and disappears eventually.

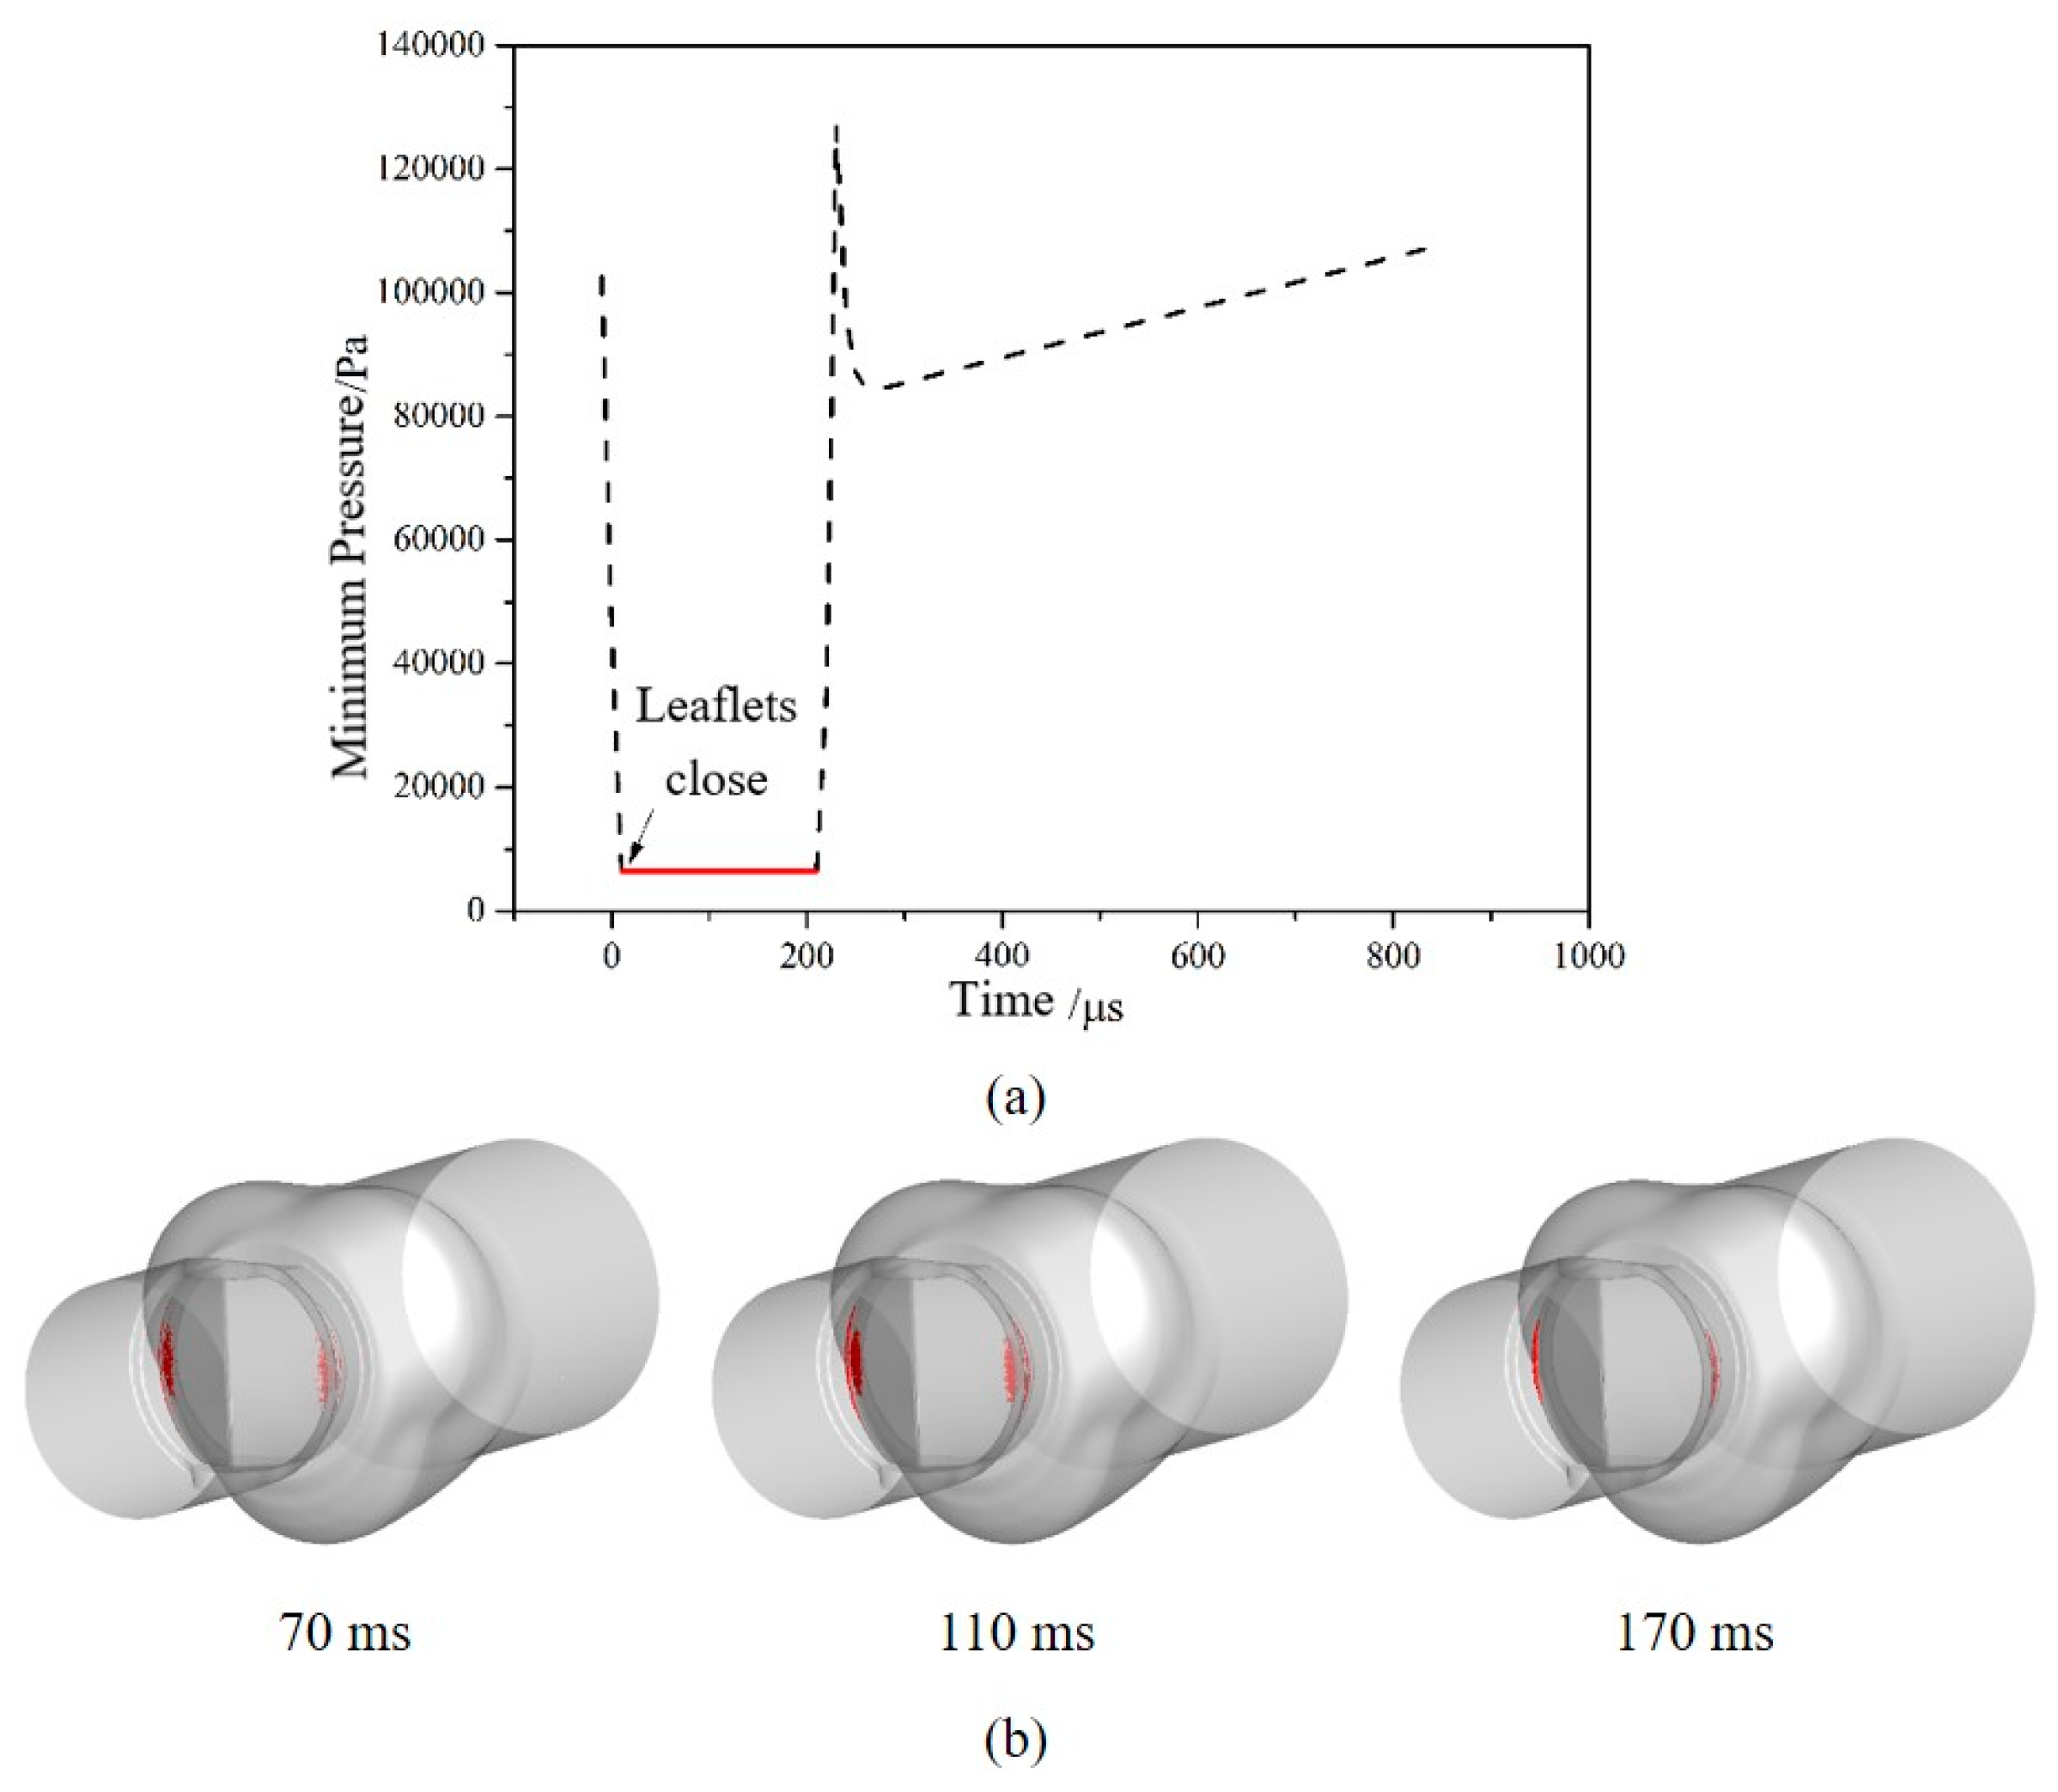
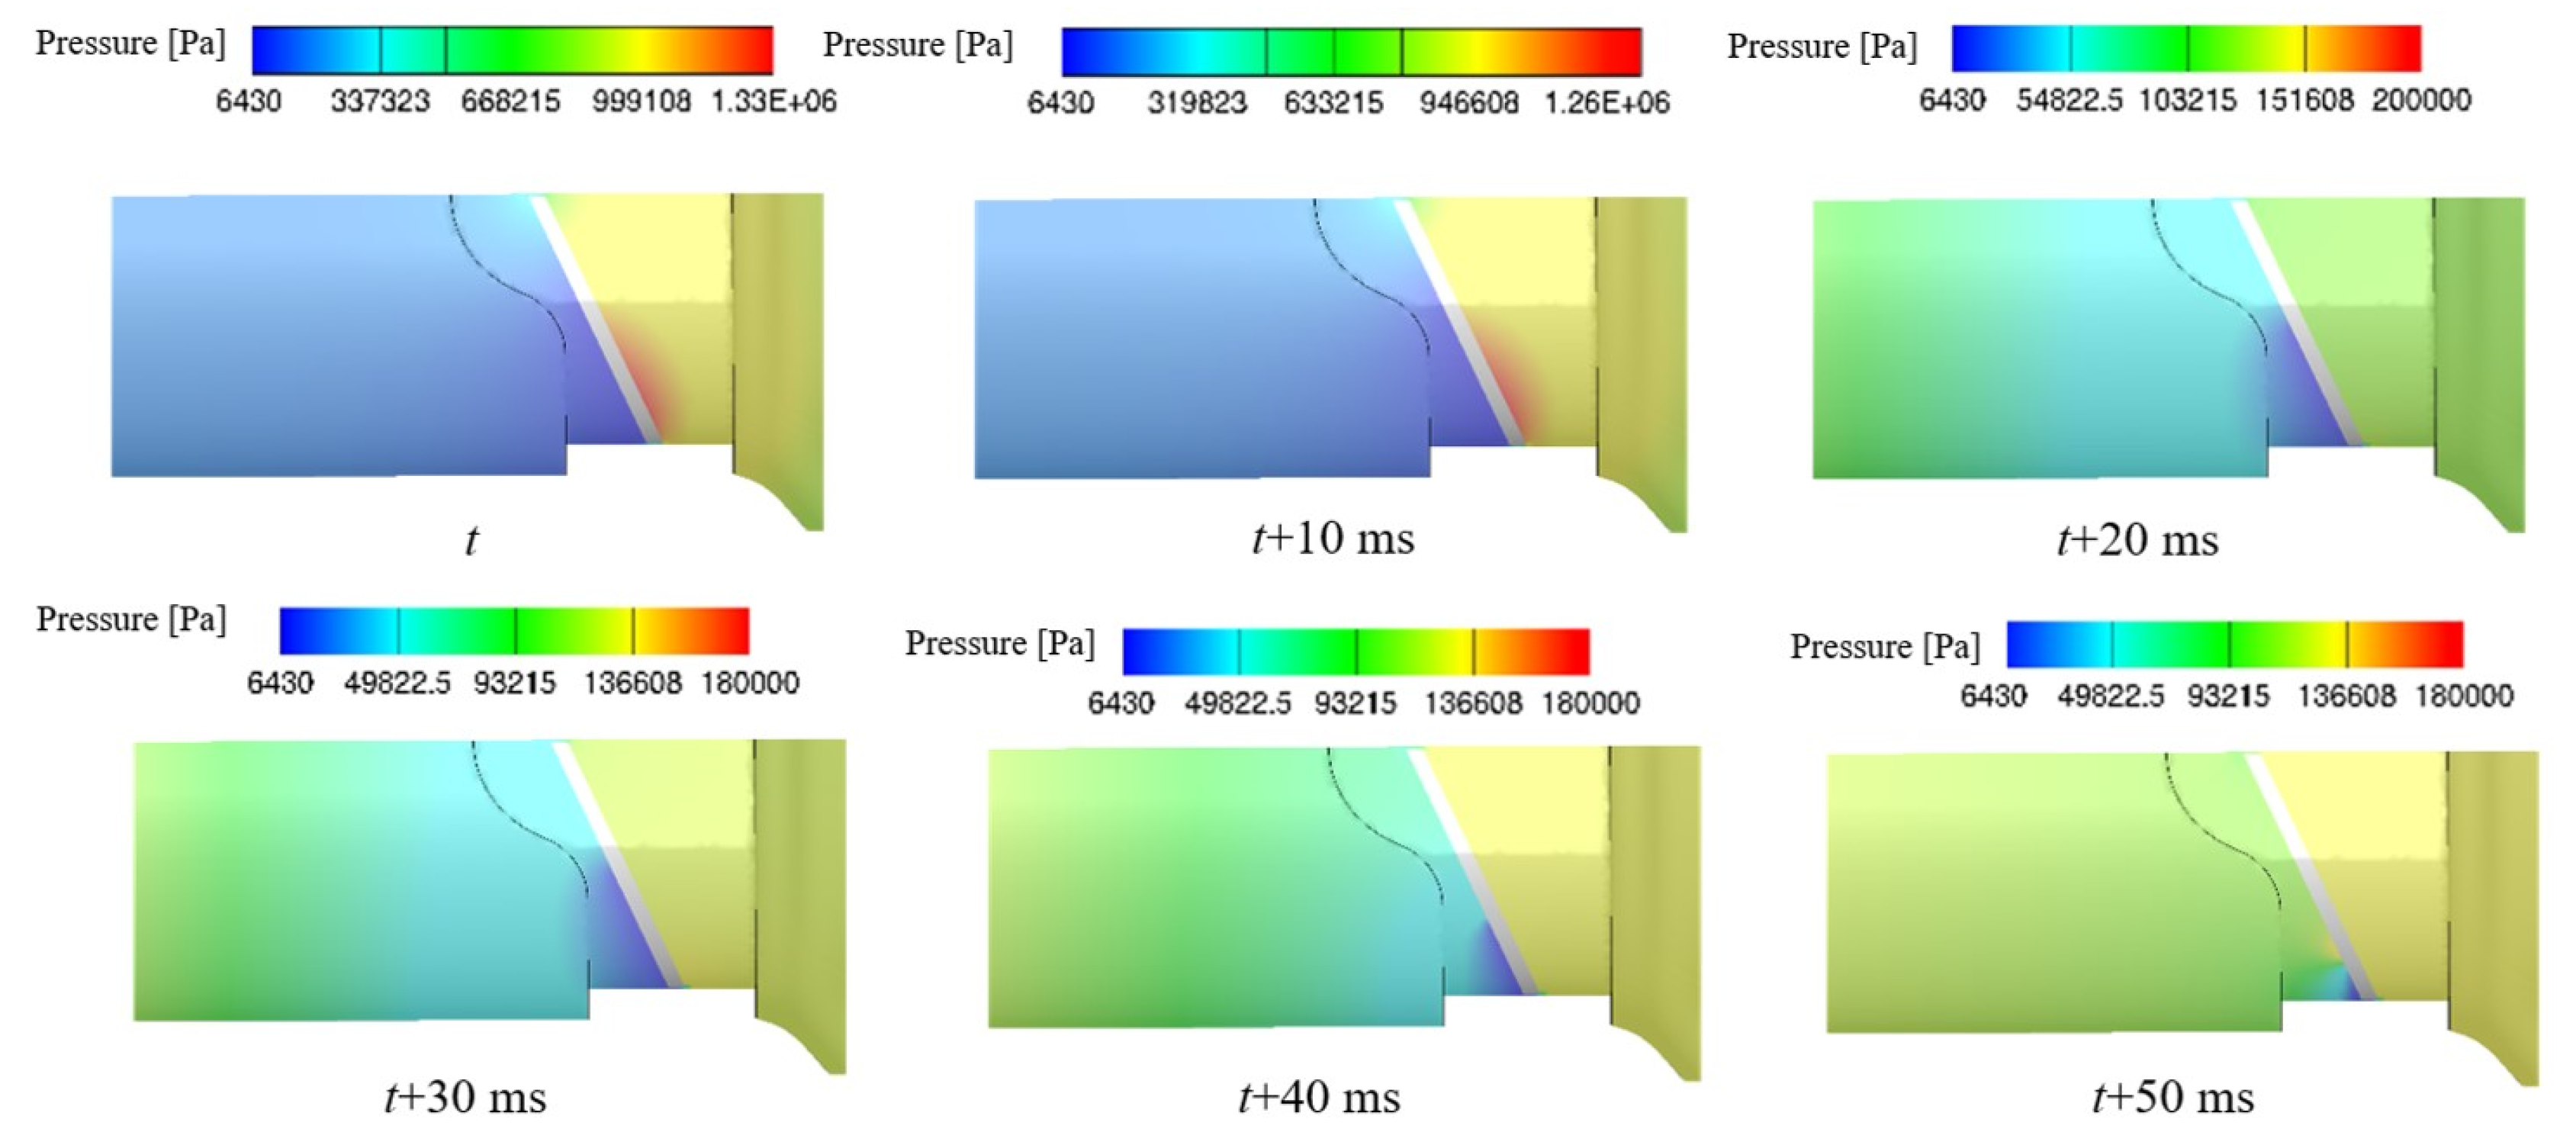
3.2. Cavitation Characteristics of the Bileaflet Mechanical Heart Valve

To investigate the cavitation characteristics of the bileaflet mechanical heart valve, the minimum pressure in the blood vessel is monitored. Figure 8a shows the minimum pressure with time varying in the blood vessel at the moment of valve closing. It can be found that the time length of the saturated vapor pressure in the tube is about 210 microseconds after the moment of valve closing.
Results are consistent with the experimental results of Lee [42], which prove that numerical results are correct and effective. After valve closing, the volume distributions of the vapor phase at three different times are shown in Figure 8b. It can be found that cavitation mainly occurs on the upstream of the valve leaflet, away from the rotating axis and in contact with the valve housing. The area where cavitation occurs decreases gradually and moves to the gap between the leaflet and the valve housing over time.
In order to find out the causes of the cavitation in the blood vessel after the valve is closed, the streamlines distribution near valve leaflets are analyzed. Figure 9 shows the streamlines distribution near valve leaflet at four different times after the valve closing. It can be found that in the initial stage of the valve closing, the main flow at downstream of leaflets is blocked but high-speed leakage flow can be found in the gap between leaflets and the valve housing. The maximum instantaneous velocity reaches 11 m/s, and most of the fluid flows directly are driven back to the inlet of the valve. Then, the flow passes through the gap and is driven back to the upstream surface of the leaflet by the larger pressure from the outlet, causing high-speed leakage flow in the blood vessel. Finally, the flow area and the maximum velocity of high-speed leakage flow decrease.
Figure 10 shows the pressure distribution near leaflets at different times after the valve closing, where t is the time of valve closing. High-pressure can be found downstream of the leaflet when the valve is closed, and then the upstream pressure and the downstream pressure of leaflets return to balance rapidly. However, the high-speed leakage flow at the gap reacts slower than the pressure field and lasts longer time. Based on the above, it can be inferred that the water hammer effect and the high-speed leakage flow effect are the causes of cavitation phenomenon and high-speed leakage flow plays a dominant role.

4. Conclusions

Based on the method of passive dynamic mesh, the transient analysis of the MHV is carried out. By monitoring the self-motion of the valve at the moment of the closing and the flow in the valve, the flow characteristics of the blood in the process of periodic motion are studied, and causes of cavitation emerged are analyzed systematically. The method of updating the grid in this work can avoid the failure of dynamic meshing updating, due to small moments of the inertia of leaflets. It is proven that this method is more stable in the process of numerical calculation. The valve goes through opening stage, fully opening stage, closing stage and fully closing stage in a cardiac cycle, and four stages, respectively, make up 8.5%, 16.1%, 4.7% and 70.7% of the total period, respectively. The cavitation of the bileaflet mechanical heart valve is mainly related to high-speed leakage flow through gap between leaflets and the valve housing, as well as the water hammer effect. The occurrence and intensity of cavitation at the sinus can be characterized by the highest velocity of leaflets rotating at the moment of valve closing. The higher the velocity of leaflets rotating at the moment of valve closing, the higher the possibility of cavitation occurring at the sinus. This study reveals the fundamental flow characteristics of the BMHV at different working conditions and can be referred to for the cavitation suppression of the BHMV and similar valves.

Author Contributions

Conceptualization, Z.-x.G. and W.-q.L.; methodology, Z.-x.G. and W.-q.L.; software, Z.-x.G. and W.-q.L.; validation, W.-q.L. and Z.-x.G.; formal analysis, Z.-x.G.; investigation, W.-q.L.; resources, Z.-x.G.; data curation, Z.-x.G.; writing—original draft preparation, W.-q.L.; writing—review and editing, J.-y.Q.; visualization, W.-q.L. and Z.-x.G.; supervision, J.-y.Q. and Z.-j.J.; project administration, J.-y.Q. and Z.-j.J.; funding acquisition, J.-y.Q. All authors have read and agreed to the published version of the manuscript.

Funding

This research was funded by National Natural Science Foundation of China through grant number 51805470; the Natural Science Foundation of Zhejiang Province through Grant No. LY20E050016; the Science and Technology Department of Zhejiang Province, grant number 2019C01025, and the Youth Funds of the State Key Laboratory of Fluid Power and Mechatronic Systems (Zhejiang University), grant number SKLoFP-QN-1801.

Conflicts of Interest

The authors declare no conflict of interest.

References

  1. Dangas, G.D.; Weitz, J.I.; Giustino, G.; Makkar, R.; Mehran, R. Prosthetic Heart Valve Thrombosis. J. Am. Coll. Cardiol. 2016, 68, 2670–2689. [Google Scholar] [CrossRef]
  2. Del Gaudio, C.; Gasbarroni, P.L.; Romano, G.P. Experimental investigations on the fluid-mechanics of an electrospun heart valve by means of particle image velocimetry. J. Mech. Behav. Biomed. Mater. 2016, 64, 229–239. [Google Scholar] [CrossRef] [PubMed]
  3. Qian, J.-Y.; Chen, M.-R.; Gao, Z.-X.; Jin, Z.-J. Mach number and energy loss analysis inside multi-stage Tesla valves for hydrogen decompression. Energy 2019, 179, 647–654. [Google Scholar] [CrossRef]
  4. Tao, J.; Lin, Z.; Ma, C.; Ye, J.; Zhu, Z.; Li, Y.; Mao, W. An Experimental and Numerical Study of Regulating Performance and Flow Loss in a V-Port Ball Valve. J. Fluids Eng. 2019, 142, 142. [Google Scholar] [CrossRef]
  5. Luraghi, G.; Wu, W.; De Gaetano, F.; Matas, J.F.R.; Moggridge, G.D.; Serrani, M.; Stasiak, J.; Costantino, M.L.; Migliavacca, F. Evaluation of an aortic valve prosthesis: Fluid-structure interaction or structural simulation? J. Biomech. 2017, 58, 45–51. [Google Scholar] [CrossRef] [PubMed] [Green Version]
  6. Qian, J.-Y.; Chen, M.-R.; Liu, X.-L.; Qian, J.-Y. A numerical investigation of the flow of nanofluids through a micro Tesla valve. J. Zhejiang Univ. A 2018, 20, 50–60. [Google Scholar] [CrossRef]
  7. Qian, J.-Y.; Wu, J.-Y.; Gao, Z.-X.; Wu, A.; Jin, Z.-J. Hydrogen decompression analysis by multi-stage Tesla valves for hydrogen fuel cell. Int. J. Hydrogen Energy 2019, 44, 13666–13674. [Google Scholar] [CrossRef]
  8. Abu Bakar, H.; Abas, A.; Mokhtar, N.H.; Razak, N.; Hamid, M.N.B.A. Particle Image Velocimetry and Finite Volume Method Study of Bi-leaflet Artificial Heart Valve. J. Appl. Fluid Mech. 2018, 11, 1365–1375. [Google Scholar] [CrossRef]
  9. Kadhim, S.K.; Nasif, M.S.; Al-Kayiem, H.H.; Al-Waked, R. Computational fluid dynamics simulation of blood flow profile and shear stresses in bileaflet mechanical heart valve by using monolithic approach. J. Soc. Comput. Simul. 2017, 94, 93–104. [Google Scholar] [CrossRef] [Green Version]
  10. Hafizah, M.N.; Aizat, A. Simulation of blood flow in different configurations design of bi-leaflet mechanical heart valve. IOP Conf. Ser. Mater. Sci. Eng. 2018, 370, 012065. [Google Scholar] [CrossRef]
  11. Nguyen, V.-T.; Kuan, Y.H.; Chen, P.-Y.; Ge, L.; Sotiropoulos, F.; Yoganathan, A.P.; Leo, H.L. Experimentally Validated Hemodynamics Simulations of Mechanical Heart Valves in Three Dimensions. Cardiovasc. Eng. Technol. 2011, 3, 88–100. [Google Scholar] [CrossRef] [Green Version]
  12. Bark, D.L.; Vahabi, H.; Bui, H.; Movafaghi, S.; Moore, B.; Kota, A.K.; Popat, K.; Dasi, L.P. Hemodynamic Performance and Thrombogenic Properties of a Superhydrophobic Bileaflet Mechanical Heart Valve. Ann. Biomed. Eng. 2016, 45, 452–463. [Google Scholar] [CrossRef] [Green Version]
  13. De Tullio, M.D.; Nam, J.; Pascazio, G.; Balaras, E.; Verzicco, R. Computational prediction of mechanical hemolysis in aortic valved prostheses. Eur. J. Mech. B/Fluids 2012, 35, 47–53. [Google Scholar] [CrossRef]
  14. Sturla, F.; Votta, E.; Stevanella, M.; Conti, C.A.; Redaelli, A. Impact of modeling fluid–structure interaction in the computational analysis of aortic root biomechanics. Med Eng. Phys. 2013, 35, 1721–1730. [Google Scholar] [CrossRef]
  15. Querzoli, G.; Fortini, S.; Espa, S.; Melchionna, S. A laboratory model of the aortic root flow including the coronary arteries. Exp. Fluids 2016, 57, 134. [Google Scholar] [CrossRef]
  16. Susin, F.M.; Espa, S.; Toninato, R.; Fortini, S.; Querzoli, G. Integrated strategy for in vitro characterization of a bileaflet mechanical aortic valve. Biomed. Eng. Online 2017, 16, 29. [Google Scholar] [CrossRef] [Green Version]
  17. Hanafizadeh, P.; Mirkhani, N.; Davoudi, M.R.; Masouminia, M.; Sadeghy, K. Non-Newtonian Blood Flow Simulation of Diastolic Phase in Bileaflet Mechanical Heart Valve Implanted in a Realistic Aortic Root Containing Coronary Arteries. Artif. Organs 2016, 40, E179–E191. [Google Scholar] [CrossRef]
  18. Haya, L.; Tavoularis, S. Effects of bileaflet mechanical heart valve orientation on fluid stresses and coronary flow. J. Fluid Mech. 2016, 806, 129–164. [Google Scholar] [CrossRef]
  19. Taehyup, H.; Chang, N.K. A numerical analysis of the blood flow around the bileaflet mechanical heart valves with different rotational implantation angles. J. Hydrodyn. 2011, 23, 607–614. [Google Scholar]
  20. Abbas, S.S.; Nasif, M.S.; Said, M.A.M.; Kadhim, S.K. Numerical investigation on effect of aortic root geometry on flow induced structural stresses developed in a bileaflet mechanical heart valve. J. Phys. Conf. Ser. 2017, 908, 12039. [Google Scholar] [CrossRef]
  21. Abbas, S.S.; Nasif, M.S.; Said, M.A.M.; Al-Waked, R.; Kadhim, S.K. Numerical investigation on effect of leaflet thickness on structural stresses developed in a bileaflet mechanical heart valve for its sustainable manufacturing. MATEC Web Conf. 2017, 131, 4004. [Google Scholar] [CrossRef] [Green Version]
  22. Kheradvar, A.; Pedrizzetti, G. Vortex Formation in the Cardiovascular System. Vortex Form. Cardiovasc. Syst. 2012, 3, 45–73. [Google Scholar]
  23. Kheradvar, A.; Assadi, R.; Falahatpisheh, A.; Sengupta, P.P. Assessment of Transmitral Vortex Formation in Patients with Diastolic Dysfunction. J. Am. Soc. Echocardiogr. 2012, 25, 220–227. [Google Scholar] [CrossRef]
  24. Domenichini, F.; Pedrizzetti, G.; Baccani, B. Three-dimensional filling flow into a model left ventricle. J. Fluid Mech. 2005, 539, 179. [Google Scholar] [CrossRef]
  25. Qian, J.-Y.; Hou, C.-W.; Wu, J.-Y.; Gao, Z.-X.; Qian, J.-Y. Aerodynamics analysis of superheated steam flow through multi-stage perforated plates. Int. J. Heat Mass Transf. 2019, 141, 48–57. [Google Scholar] [CrossRef]
  26. Li, C.-P.; Lu, P.-C. Numerical comparison of the closing dynamics of a new trileaflet and a bileaflet mechanical aortic heart valve. J. Artif. Organs 2012, 15, 364–374. [Google Scholar] [CrossRef]
  27. Mirkhani, N.; Davoudi, M.R.; Hanafizadeh, P.; Javidi, D.; Saffarian, N. On-X Heart Valve Prosthesis: Numerical Simulation of Hemodynamic Performance in Accelerating Systole. Cardiovasc. Eng. Technol. 2016, 7, 223–237. [Google Scholar] [CrossRef]
  28. Forleo, M.; Dasi, L.P. Effect of Hypertension on the Closing Dynamics and Lagrangian Blood Damage Index Measure of the B-Datum Regurgitant Jet in a Bileaflet Mechanical Heart Valve. Ann. Biomed. Eng. 2013, 42, 110–122. [Google Scholar] [CrossRef]
  29. Kuan, Y.H.; Kabinejadian, F.; Nguyen, V.-T.; Su, B.; Yoganathan, A.P.; Leo, H.L. Comparison of hinge microflow fields of bileaflet mechanical heart valves implanted in different sinus shape and downstream geometry. Comput. Methods Biomech. Biomed. Eng. 2014, 18, 1785–1796. [Google Scholar] [CrossRef]
  30. Simon, H.A.; Ge, L.; Borazjani, I.; Sotiropoulos, F.; Yoganathan, A.P. Simulation of the Three-Dimensional Hinge Flow Fields of a Bileaflet Mechanical Heart Valve Under Aortic Conditions. Ann. Biomed. Eng. 2009, 38, 841–853. [Google Scholar] [CrossRef] [Green Version]
  31. Klusak, E.; Bellofiore, A.; Loughnane, S.; Quinlan, N. High-Resolution Measurements of Velocity and Shear Stress in Leakage Jets From Bileaflet Mechanical Heart Valve Hinge Models. J. Biomech. Eng. 2015, 137, 111008. [Google Scholar] [CrossRef]
  32. Shadden, S.C.; Astorino, M.; Gerbeau, J.-F. Computational analysis of an aortic valve jet with Lagrangian coherent structures. Chaos Interdiscip. J. Nonlinear Sci. 2010, 20, 017512. [Google Scholar] [CrossRef] [Green Version]
  33. Shahriari, S.; Maleki, H.; Hassan, I.; Kadem, L. Evaluation of shear stress accumulation on blood components in normal and dysfunctional bileaflet mechanical heart valves using smoothed particle hydrodynamics. J. Biomech. 2012, 45, 2637–2644. [Google Scholar] [CrossRef]
  34. Qian, J.-Y.; Gao, Z.-X.; Hou, C.-W.; Jin, Z.-J. A comprehensive review of cavitation in valves: Mechanical heart valves and control valves. Bio-Design Manuf. 2019, 2, 119–136. [Google Scholar] [CrossRef]
  35. Lu, L.; Xie, S.; Yin, Y.; Ryu, S. Experimental and numerical analysis on the surge instability characteristics of the vortex flow produced large vapor cavity in u-shape notch spool valve. Int. J. Heat Mass Transf. 2020, 146, 118882. [Google Scholar] [CrossRef]
  36. Rambod, E.; Beizaie, M.; Shusser, M.; Milo, S.; Gharib, M. A physical model describing the mechanism for formation of gas microbubbles in patients with mitral mechanical heart valves. Ann. Biomed. Eng. 2000, 27, 774–792. [Google Scholar] [CrossRef]
  37. Simcha, M.; Edmond, R.; Chaim, G. Mitral mechanical heart valves: In vitro studies of their closure, vortex and microbubble formation with possible medical implications. Eur. J. Cardio-Thorac. Surg. 2003, 24, 364–370. [Google Scholar]
  38. Qian, J.-Y.; Li, X.-J.; Wu, Z.; Jin, Z.-J.; Sunden, B. A comprehensive review on liquid–liquid two-phase flow in microchannel: Flow pattern and mass transfer. Microfluid. Nanofluidics 2019, 23, 116. [Google Scholar] [CrossRef]
  39. Bluestein, D.; Einav, S.; Hwang, N.H. A squeeze flow phenomenon at the closing of a bileaflet mechanical heart valve prosthesis. J. Biomech. 1994, 27, 1369–1378. [Google Scholar] [CrossRef]
  40. Jin, Z.-J.; Qiu, C.; Jiang, C.-H.; Wu, J.-Y.; Qian, J.-Y. Effect of valve core shapes on cavitation flow through a sleeve regulating valve. J. Zhejiang Univ. A 2020, 21, 1–14. [Google Scholar] [CrossRef]
  41. Choi, C.R.; Kim, C.N. Numerical Analysis on the Hemodynamics and Leaflet Dynamics in a Bileaflet Mechanical Heart Valve Using a Fluid-Structure Interaction Method. ASAIO J. 2009, 55, 428–437. [Google Scholar] [CrossRef]
  42. Lee, H.; Homma, A.; Taenaka, Y. Hydrodynamic Characteristics of Bileaflet Mechanical Heart Valves in an Artificial Heart: Cavitation and Closing Velocity. Artif. Organs 2007, 31, 532–537. [Google Scholar] [CrossRef]
Figure 1. Structure of mechanical heart valve and grid partition.
Applsci 10 02548 g001
Figure 2. Calculation process of fluid flowing in mechanical heart valve.
Applsci 10 02548 g002
Figure 3. Velocity distribution with different kinds of mesh regimes.
Applsci 10 02548 g003
Figure 4. The motion of the leaflets in a cycle and streamlines.
Applsci 10 02548 g004
Figure 5. The variation of velocity in the middle of the channel.
Applsci 10 02548 g005
Figure 6. The variation of pressure in the channel.
Applsci 10 02548 g006
Figure 7. Distribution of downstream pressure after leaflet closing.
Applsci 10 02548 g007
Figure 8. The variation of minimum pressure and volume of vapor phase: (a) The minimum pressure around the moment of valve closing; (b) The volume distribution of the vapor phase after valve closing.
Applsci 10 02548 g008
Figure 9. The streamline distributions after valve closing.
Applsci 10 02548 g009
Figure 10. The pressure distributions after valve closing.
Applsci 10 02548 g010

