Abstract
The performance of Underwater Acoustic Communication (UAC) systems are strongly related to the specific propagation conditions of the underwater channel. Horizontal, shallow-water channels are characterised by extremely disadvantageous transmission properties, due to strong multipath propagation and refraction phenomena. The paper presents the results of communication tests performed during a shallow, inland-water experiment with the use of a laboratory model of a UAC system implementing the Orthogonal Frequency-Division Multiplexing (OFDM) technique. The physical layer of data transmission is partially configurable, enabling adaptation of the modulation and channel coding parameters to the specific propagation conditions. The communication tests were preceded by measurement of the UAC channel transmission properties. Based on the estimated transmission parameters, four configurations of OFDM modulation parameters were selected, and for each of them, communication tests were performed with the use of two Error-Correction Coding (ECC) techniques. In each case, the minimum coding rate was determined for which reliable data transmission with a Bit Error Rate (BER) of less than is possible.
1. Introduction
The designers of shallow-water communication systems try to implement the techniques of modern radiocommunications, but both the BER and data transmission rates achieved are much lower in the case of UAC systems. This is due to the disadvantageous properties of the UAC channels, namely the sea and inland waters, but also due to the technical capabilities of the generation and reception of acoustic waves. The range of a UAC system is determined mainly by the absolute value of absorption attenuation and varies in proportion to the square of the frequency of the system [1]. Differences in attenuation of frequency components of the transmitted signal due to growth in the range have degrading influence on the shape of the signal spectrum, and thus the time-domain waveform is distorted. To avoid these distortions, the bandwidth should be reduced as the system’s range increases. Therefore, the differences in attenuation have a limiting effect on the bandwidth of the system and reduces its throughput. Another phenomenon that strongly impacts the transmission properties of the UAC channel consists of reflections from the sea-bottom and the water’s surface, as well as other objects present in the water. This causes multipath propagation, which goes hand-in-hand with strong refraction, caused by a significant change in sound velocity as a function of depth. Both multipath propagation, as well as refraction, produce time dispersion of the transmitted signal. The time dispersion causes Inter-Symbol Interference (ISI), the consequence of which is frequency-selective fading observed in the received signal spectrum. Moreover, if the UAC transmitter or receiver, or objects reflecting the signal remain in motion, the possibilities of correct information detection are significantly limited due to the Doppler effect causing the signal spectrum distortions, which reveal as Inter-Carrier Interference (ICI) in case of multi-carrier systems.
The Orthogonal Frequency-Division Multiplexing (OFDM) technique is a digital modulation scheme used by many wireless communication standards, such as WiFi (IEEE 802.11 a/g/n), WiMAX (IEEE 802.16), and the fourth generation (4G) cellular systems. The popularity of OFDM stems from its capability to convert a long multipath channel in the time domain into multiple parallel single-tap channels in the frequency domain, thus considerably simplifying receiver design. Such a feature makes OFDM an attractive choice for UAC systems [2]. UAC systems with OFDM technique are characterized by a high flexibility of modulation parameters, which allows the signal to be adapted to the specificity of a particular communication channel. At very short ranges of the order of several hundred meters, OFDM systems work in the frequency bandwidth from several to several dozen kHz, allowing transmission rates of tens of kbps, but with a Bit Error Rate not less than . The use of Error-Correction Coding allows achieving a BER less than , while reducing the transmission rate to single kbps [3,4,5]. At a long distance over 50 km the OFDM technique allows to achieve a transmission rate of several dozen bps, but such a system characterizes with low reliability (BER not less than ), despite the use of ECC [6].
The paper presents the results of underwater acoustic OFDM communication test performed at a distance of 1 km in a very shallow inland-water channel. The aim of the experiment was to adapt the OFDM parameters to the propagation conditions of a shallow-water channel in such a way that it is possible to achieve high reliability of data transmission with a BER less than . Such reliability was achieved using OFDM technique together with the channel equalization using pilot tones and ECC.
A similar OFDM experiment carried out over a distance of 340 m using two pilot tone schemes, but without Error Correction Coding, is described in [7]. The OFDM data transmission was tested with different configurations of modulation parameters. The subcarrier spacing was varying from 78.13 Hz to 1250 Hz, and the OFDM symbol duration was from 0.8 ms to 12.82 ms. The minimum BER achieved was equal to 0.004.
The adaptation of the OFDM modulation scheme parameters, such as symbol duration and subcarrier spacing, to transmission properties of the UAC channel, are well described in literature on wireless communications [8]. However, the detailed procedures of determining the UAC transmission parameters of the channel, such as the delay spread, Doppler spread, coherence bandwidth, and coherence time, are rarely presented. It applies in particular to the threshold levels of relevant transmission characteristics based on which the parameters are determined. The performed underwater acoustic OFDM communication experiment has shown that the choice of the criteria for determining transmission parameters, based on which OFDM modulation scheme is designed, has an impact on the achieved data transmission rate and reliability.
The organization of the paper is as follows. Section 2 describes hardware of the UAC system used during the inland-water experiment as well as a physical layer of the OFDM data transmission. Section 3 presents the results of measurement of an underwater channel and estimation of its basic transmission parameters. In this section the setup of the experiment is described. In Section 4 the results of the OFDM transmission tests are described, which are commented in Section 5.
2. Materials and Methods
The OFDM technique was implemented in a laboratory model of an acoustic data transmission system, designed at the Department of Sonar Systems, Faculty of Electronics, Telecommunications and Informatics, Gdansk University of Technology. The system enables the OFDM modulation parameters and ECC rate to be adjusted to the propagation conditions as to obtain the desired Bit Error Rate, which is less than . Some of the OFDM signal parameters (the signal bandwidth B, the carrier frequency , and the sampling frequency ) are fixed, and they result from the parameters of hardware components such as ultrasonic transducers or underwater telephones. However, two of the key OFDM signal parameters, namely the symbol duration and the subcarrier spacing , are chosen adaptively. Thus, the OFDM data transmission tests of the UAC system are preceded by measurement of the channel’s impulse response and estimation of its transmission parameters, which makes it possible to match the values of and to the specific propagation conditions.
2.1. Instrumentation Used
Both the transmitter and receiver of the laboratory model of the OFDM data transmission system use laptop computers with the Matlab environment for digital signal generation and analysis. Laptop computers communicate with underwater HTL-10 telephones from Sonel Sp. z o.o. The HTL-10 was developed in 2006 for the needs of the Polish Navy as a device to perform underwater communication with the parameters specified in the STANAG 1074 standardisation agreement. It is a compact device enclosed in a cassette with a height of 150 mm, a width of 380 mm, and a depth of 330 mm. It performs the generation of the communication signal, and an analysis of the received signals, with the use of digital signal processors by Texas Instruments: a 16-bit TMS320VC5416 fixed-point processor, and a TMS320C6713B (DSP) 32-bit floating-point processor. It contains multichannel analogue-to-digital converters with a 16-bit resolution and a maximum sampling frequency of 250 kHz. The source of the sampling frequency is an AD9834 direct digital synthesis circuit from Analog Devices. The underwater telephone workes with a NI-USB6363 external recording and generating device from National Instruments. The HTL-10 devices pass the analog signal to a hydroacoustic transducer and receive the signal from a receiving transducer. Both the transmitting and receiving transducers are omnidirectional transducers with a resonant frequency of 34 kHz. The decay of their Transmitting Voltage Response (TVR) is equal to 3 dB in ±5 kHz range from 34 kHz [9].
2.2. Structure of the OFDM Signal
The process of the OFDM signal generation in the transmitter is as follows. The input data stream is formed into complex Binary Phase Shift Keying (BPSK) constellation symbols. Each OFDM frequency domain symbol is composed of samples, of which samples are BPSK symbols, and the remaining samples are zeros. Thus, each of the OFDM subcarriers carries an information bit as a binary phase of value or rad. The ratio between and is equal to , where the transmission bandwidth B is equal to 5 kHz, and the sampling frequency is equal to 200 kHz. The frequency-domain symbols are processed by Inverse Fast Fourier Transformation (IFFT) to obtain time-domain symbols, each of duration . Each of them is extended by the cyclic prefix of duration equal to of the symbol duration . Such prepared OFDM symbols preceded by a synchronisation preamble modulate the carrier wave of frequency equal to 30 kHz, which is different from the resonant frequency of the transmitting and receiving transducers; however, for a broadband system, these frequencies do not need to be precisely equal.
The subcarrier spacing and symbol duration are matched to the transmission parameters of the UAC channel, in which the communication is performed. The coherence bandwidth of the channel sets an upper limit on subcarrier spacing . At the same time, should be much larger than the Doppler spread . The coherence time sets an upper limit on the symbol duration , which, on the other hand, should be longer than the delay spread of the channel [8].
2.3. Pilots Tones and Correction Coefficients
The signal transmitted in the UAC channel suffers from time dispersion, which manifests itself as selective fading of the signal spectrum. To reduce the negative effects of this phenomenon on the information detection process, some of the OFDM symbols’ spectra are used as reference pilot tones to equalise the values of the subcarriers of the symbols which are carrying the data. Every second time domain OFDM symbol is transmitted as a pilot symbol and all of its OFDM subcarriers carry data that is known in the receiver. Such a pilot tone pattern is shown in Figure 1.
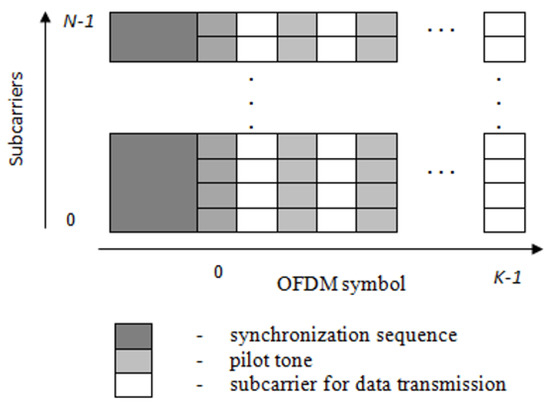
Figure 1.
Pilot tones pattern [7].
For each subcarrier, a correction coefficient is calculated on the basis of a complex value of a given subcarrier at the transmitter and receiver sides [7]:
where:
—correction coefficient for pilot tone number and symbol number k,
—value of transmitted pilot tone number and symbol number k,
—value of received pilot tone number and symbol number k,
N—number of OFDM subcarriers,
K—number of OFDM symbols.
Each subcarrier is corrected by the mean value of the two neighbouring coefficients: for the subcarrier in the preceding and following OFDM symbols (except for the , for which only is taken into account). Thus, the equalised values of subcarriers are calculated as:
Such a pilot tone pattern allows the influence of ISI and noise on the received signal to be suppressed, and thus significantly improves a BER of data transmission.
2.4. Error-Correction Coding
Channel coding is implemented in the OFDM system to protect information bits from errors after transmission through the communication channel. Two classical block coding schemes are used, namely Bose-Chaudhuri-Hocquenghem (BCH) codes, and Reed–Solomon (RS) codes. During the inland-water experiment, the codes of different parameters were tested to find the maximum coding rate that allows reliable transmission with a BER less than to be achieved.
2.5. Data Frame
Each of the OFDM data frames starts with a synchronisation preamble, which is a Pseudo-Random Binary Sequence (PRBS). It is based on an m-sequence of rank 8, which modulates the carrier frequency equal to 30 kHz. The sequence is repeated 20 times and its duration is equal to 1.02 s. The PRBS sequence is followed by the OFDM signal of a duration of 2.5 s. Subsequent data frames contain the synchronisation sequence and the OFDM signal. The duration of each frame is equal to 3.52 s. In each frame, a constant amount of information is sent, which is equal to 5 kbits. Thus, the data transmission rate in the case of ECC not being used, but with the pilot tones technique, is equal to 1.42 kbps. The Bit Error Rate is calculated as , where is the number of incorrectly detected bits in a single transmission frame, and is the number of all transmitted bits.
3. Transmission Parameters of Shallow-Water Channel
In order to estimate the transmission parameters of an inland shallow-water channel, the measurement tests were conducted in Wdzydze Lake on the northern edge of the Bory Tucholskie forest complex ( N E) on 5 May 2017. Wdzydze Lake is a freshwater lake. Its bottom is covered with a layer of mud and it falls steeply into the depths of the water. It is, in many respects, very similar to the Baltic Sea. A significant part of the lake area is more than 40 m deep, and the deepest area is more than 70 m deep. In terms of chemical composition, the waters of Wdzydze Lake represent the calcium bicarbonate type. The water temperature on 5 May 2017 was 15 °C. The weather was windless, it was not raining, and the water surface was calm. The transmission stand was placed on a boat, which was drifted very slowly. The receiving stand was in a measuring container of fixed position, 50 m from the lake shore, by a floating platform. The transmission transducer was sunk to a depth of 10 m, regardless of the water depth of about 20 m. There were no objects in the water near this transducer. The receiving transducer was sunk to a depth of 4 m. The water depth in this place was 7 m [10]. The distance between the transmitter and receiver was 1035 m. This was measured with the use of a 19x HVS GPS receiver by Garmin, which was integrated with MaxSea software by TimeZero and electronic maps by Jepessen. Such a hardware-software set ensured a distance measuring accuracy of 3 m. Figure 2 shows the positions of the transmitting and receiving stands. The water depth on the line between positions of transmitting and receiving stands is varying from 7 to 40 m. Figure 3 shows the sound speed profile measured by using a sound speed meter constructed in Department of Sonar Systems, Gdansk University of Technology. The device uses a direct method of sound speed measurement. Its accuracy is ±0.5 m/s. The sound speed profile was needed for estimating the underwater system range. On the basis of this profile an expected minimum range of the UAC system was calculated equal to 400 m.
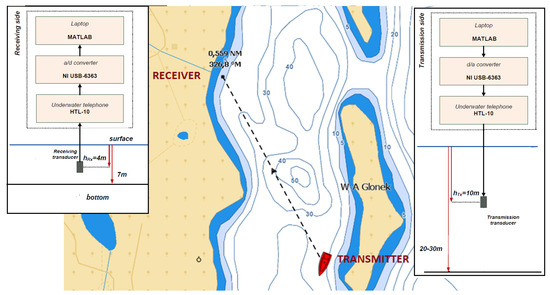
Figure 2.
Localisation of inland water experiment and hardware setup.
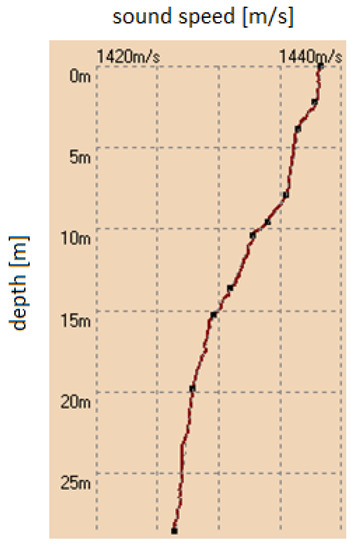
Figure 3.
Sound speed profile measured during inland water experiment.
During the tests, the Time-Varying Impulse Response (TVIR) was measured. In the case of a bandlimited bandpass channel, the TVIR is equivalently described by a time-varying complex baseband impulse response , defined in a window of observation time t and delay , with input and output being the complex envelope of the transmitted and received signal, respectively:
where and are the complex envelopes of transmitted and received passband signals , and * represents convolution operation.
The impulse response was measured by the correlation method with the use of a Pseudo-Random Binary Sequence (PRBS), based on an m-sequence of rank 8, and its duration was equal to 51 ms. It was repeated up to 127 times to gather one TVIR. The bandwidth and the carrier frequency of the probe signal were equal to 5 kHz and 30 kHz, respectively. The sampling frequency was equal to 200 kHz. 16 impulse responses were measured during the tests.
In order to assess the time dispersion and variability of the UAC channel, a stochastic model based on the channel Space-Time-Frequency Correlation Function (STFCF) is used. The STFCF is obtained as an autocorrelation function of a time-varying transfer function of the channel, which, in turn, is calculated as Fourier transform of the impulse response . The STFCF is a function of time and frequency differences under the assumption that the TVIR of the channel represents a wide-sense stationary uncorrelated scattering process [11]. Then, it is possible to calculate the 2-dimensional scattering function:
where and are time and frequency differences, respectively, is the Doppler spread, is the delay, and is the STFCF of the channel. An example module of TVIR and corresponding scattering function are shown in Figure 4. The probable reflections of the transmitted signal are seen as the multipath components of TVIR.
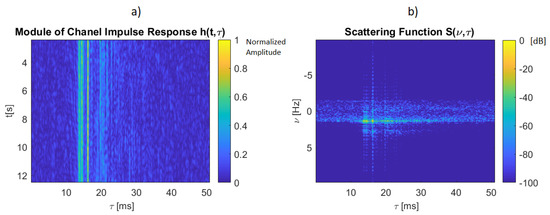
Figure 4.
Module of TVIR (a) measured at a distance of 1035 m and corresponding scattering function (b).
The scattering function is the basis for the calculation of the transmission parameters: delay spread , Doppler spread , coherence time , and coherence bandwidth , which are used for designing the physical layer of the UAC data transmission system [8,12]. The delay spread is calculated on the basis of Power Delay Profile (PDP) , which is obtained as the integral of over the Doppler shift domain. It describes the average signal power reaching the receiver as a function of delay and it characterizes the time dispersion of the channel. The time dispersion can be assessed as a maximum delay spread measured at a given threshold level of , or as an rms value :
where:
The values of delay spread averaged over the results of the analysis of the 16 measured impulse responses are as follows. The maximum delay spread was measured as a time duration between the first and last multipath component of a value higher than a threshold level of 0.1 or 0.01 of a maximum value of ), which corresponds to a decrease of 10 dB or 20 dB from the maximum value, respectively. In the case of a threshold level of 0.1, the maximum delay spread was equal to 8.67 ms, and in the case of a threshold level of 0.01, it was equal to 27.13 ms. The rms value of the delay spread was equal to 17.12 ms. These are values typical for shallow-water channels with multipath propagation.
The integral of over the delay domain gives the Doppler Power Spectral Density (DPSD) . The Doppler spread of the transmitted signal is calculated similarly to the delay spread, that is, as a maximum Doppler spread or rms Doppler spread . The maximum Doppler spread measured as a width of at a threshold level of 0.1 of its maximum value was equal to 2.23 Hz. Changing the threshold level to 0.01 of the maximum value of results in equal to 3.5 Hz. The rms value of the Doppler spread was equal to 0.83 Hz. This is a small value of Doppler spread caused by the slow drift of the boat with the transmitting transducer. Assuming a carrier frequency of the transmitted signal equal to 30 kHz, a Doppler shift of 3.5 Hz corresponds to a motion of 0.17 m/s. The exemplary PDP and DPSD, calculated on the basis of the impulse response presented in Figure 4, are shown in Figure 5.
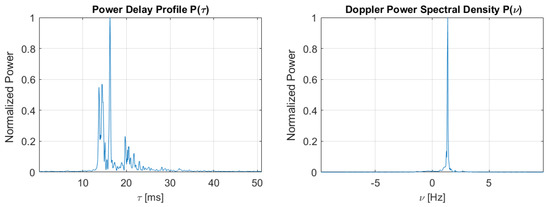
Figure 5.
Power Delay Profile (a) and Doppler Power Spectral Density (b) of the measured UAC channel at a distance of 1035 m.
After averaging over the and domain, Space-Frequency Correlation Function (SFCF) and Space-Time Correlation Function (STCF) are obtained (Figure 6). The coherence bandwidth , in which the signal amplitude spectrum is flat and its phase characteristic is linear, is calculated as the width of at a given threshold level . The threshold level is usually equal to 0.5 or 0.9 in the case of OFDM radiocommunication systems [8]. The coherence time , specifying a time interval at which TVIR remains constant, is calculated in the same manner on the basis of . During the inland-water experiment, both the coherence bandwidth and coherence time were calculated at threshold levels of 0.5, 0.7, and 0.9 of the maximum value of the corresponding correlation function. The coherence bandwidth values obtained were equal to 124.84 Hz, 68.54 Hz, and 36.74 Hz, respectively. These values are typical for shallow-water channels with multipath propagation. Usually, the coherence bandwidth of such a channel is in the order of several dozen Hz. The coherence time was equal to 3.03 s, 1.16 s, and 0.36 s, respectively, for all three cases of threshold levels. The values of all transmission parameters are shown in Table 1.
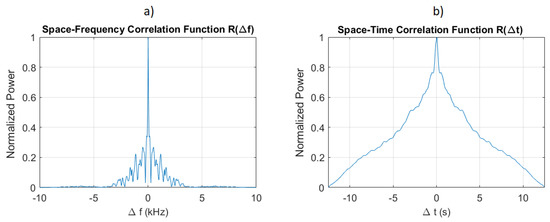
Figure 6.
Space-frequency Correlation Function (a) and Space-Time Correlation Function (b) of the measured UAC channel at a distance of 1035 m.

Table 1.
Transmission parameters of the measured UAC channel at a distance of 1035 m.
4. OFDM Transmission Tests
In order to protect the signal transmitted in the UAC system against the ISI and ICI, the physical layer of data transmission should be matched to the transmission parameters of the channel. The subcarrier spacing should be smaller than the coherence bandwidth and much larger than the Doppler spread. On the other hand, the duration of the OFDM symbol should be longer than the delay spread, and much shorter than the coherence time of the channel [8]. The transmission parameter values described in Section 3 differ significantly depending on the method of their determination. For example, the coherence bandwidth determined as the width of SFCF at the threshold level of 0.5 of the maximum value is almost four times larger than the coherence bandwidth determined at the threshold level of 0.9. Depending on the particular transmission parameters set, different subcarrier spacing and symbol duration values meet the physical layer designing rules. Thus, four possible OFDM modulation schemes were chosen for the inland-water experiment, differing in the number of subcarriers, which was equal to 64, 128, 256, or 512. The number of subcarriers determines the values of subcarrier spacing and symbol duration , as it is shown in Table 2. The reliability of the data transmission with the use of such a configured OFDM waveform was tested during the inland-water experiment.
Table 2.
Configurations of OFDM signal parameters and BER achieved during the inland-water experiment.
The OFDM signal bandwidth B was the same as in the case of the PRBS probe signal, that is 5 kHz, around the carrier frequency of 30 kHz. For each of the OFDM parameter configurations, 20 transmission tests were performed and the mean BER was calculated (Table 2). The lowest BER was obtained in the case of 256 subcarriers with subcarrier spacing equal to 19.53 Hz and symbol duration equal to 51.20 ms. In the case of 512 subcarriers, the BER was significantly higher than for other subcarrier configurations. As can be seen, in the case of using pilot tones as the only technique of ISI suppression, it is possible to obtain data transmission with a BER less than . The data transmission rate, in this case, is equal to 1.42 kbps.
The next experimental tests were conducted using BCH and Reed–Solomon Error-Correction Coding of different number of information bits and message length , where . The results of BER values depending on the code rate are shown in Figure 7. From among the ECC parameter configurations, those were chosen that allow obtaining the BER less than , , or with the lowest possible redundancy, and thus the highest possible coding rate. The transmission rates obtained with these encoding parameters are shown in Table 3.
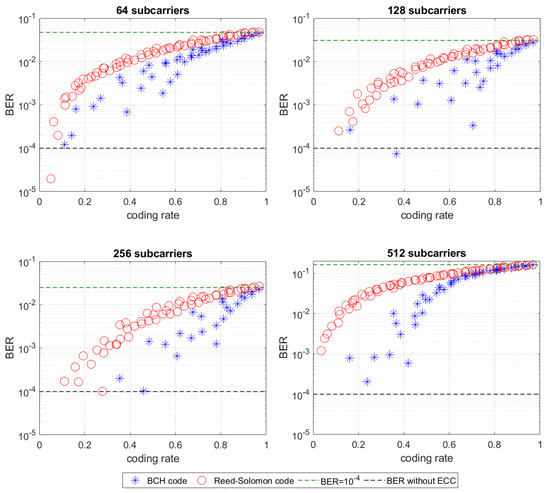
Figure 7.
BER of OFDM data transmission as a function of ECC rate: BCH (*) and Reed–Solomon (o); black line indicates BER equal to ; green line indicates BER of transmission without ECC.
Table 3.
Coding rates and data transmission rates during transmission with ECC.
5. Discussion
During the tests without the ECC technique implemented, the lowest BER was obtained in the case of 256 OFDM subcarriers with the subcarrier spacing of 19.53 Hz and symbol duration equal to 51.20 ms. Such a subcarrier spacing is smaller than the coherence bandwidth measured at the threshold level of 0.9 of the maximum value of the SFCF of the channel. In the 64 subcarriers case, in which the BER is almost twice as high as in the case of 256 subcarriers, the subcarrier spacing is larger than the measured at the threshold levels of 0.7 and 0.9, but not 0.5. Thus, the threshold level of 0.5 of the maximum value of the SFCF seems to be too low as the indicator of the strong correlation of frequency components of the channel’s transfer function, and thus it shouldn’t be used to choose the subcarrier spacing in UAC OFDM system.
In the case of 512 subcarriers, a BER was significantly higher than for other subcarriers configurations. Such a number of subcarriers located in the 5 kHz band at a sampling rate of = 200 kHz may cause that DFT used for OFDM symbols processing has insufficient resolution. Moreover, although the subcarrier spacing equal to 9.77 Hz is greater than each of the three Doppler spread values shown in Table 1, the difference is too small and the Doppler shift may affect the OFDM signal spectrum causing the ICI. Thus, it seems that it is worth using Doppler spread measure that achieves the highest values, i.e., the maximum spread at the threshold level of −20 dB relative to the maximum value of Doppler Power Spectral Density of the channel. The subcarrier spacing should be much larger than the maximum Doppler spread calculated this way.
In each of the OFDM configurations, the OFDM symbol duration was longer than the maximum value of the delay spread measured at the threshold level of −10 dB relative to the maximum value of the Power Delay Profile. In the case of 64 subcarriers, the OFDM symbol duration was no longer than the maximum value measured at the threshold level of −20 dB and no longer than the rms value of the delay spread of the channel. In the case of 256 subcarriers, for which the lowest BER was achieved, the symbol duration was longer than the maximum delay spread measured at the threshold level of −20 dB. Thus it seems it is worth using the latter measure of time dispersion of the UAC channel in the process of designing the physical layer of the OFDM data transmission system. In all OFDM subcarrier configurations, the OFDM symbol duration was much shorter than the coherence time of the channel.
Implementing the ECC technique allowed obtaining the BER less than in the case of 64, 128, and 256 subcarriers. Only in the case of 256 subcarriers, it was possible using both types of ECC: BCH codes and Reed-Solomon codes. The highest transmission rate with the BER less than was obtained using Reed–Solomon code and it was equal to 653.63 bps. Thus, applying the ECC reduces more than twice the transmission rate compared to the configuration without ECC, but with a significant gain on reliability.
6. Conclusions
The communication tests performed during the shallow inland-water experiment with the use of the laboratory model of an OFDM system have shown that it is possible to achieve reliable data transmission with Bit Error Rate less than . The tested UAC channel was about 1 km long and the depth was variable along this distance from 20 to 40 m. Thus, it was a typical case of a very shallow channel characterised by numerous reflections of the transmitted signal from the bottom and surface of the water. Obtaining such a low BER required the use of two techniques of ISI suppression, namely pilot tones and Error-Correction Coding. Achievable BER and data transmission rates were measured for four different configurations of OFDM signal parameters, selected to match the physical layer of data transmission to the transmission parameters of the channel, calculated on the basis of the measured Time-Varying Impulse Reponses.
The lowest BER was obtained in the case of subcarrier spacing which was less than the coherence bandwidth measured at the threshold level of 0.9 of the maximum value of the Space-Frequency Correlation Function (SFCF) of the channel. At the same time, the subcarrier spacing was much larger than the maximum Doppler spread measured at the threshold level of −20 dB relative to the maximum value of Doppler Power Spectral Density. The OFDM symbol duration was longer than the delay spread of the channel measured at the threshold level of −20 dB relative to the maximum value of Power Delay Profile.
In case of the largest number of subcarriers, i.e., 512, reliable data transmission could not be obtained. For the smallest number of subcarriers, i.e., 64, the data transmission rate of 72.42 bps was obtained after using the BCH code of rate of 0.051. For 128 and 256 subcarriers, transmission rates of hundreds of bps were achieved, which is sufficient for most applications of reliable underwater communications, such as submarine-to-submarine or submarine-to-surface platform communications, monitoring of bottom installations or AUV remote control.
Funding
This research received no external funding.
Acknowledgments
Special thanks to Jan Schmidt and Krzysztof Liedtke for technical support in experimental tests.
Conflicts of Interest
The author declare no conflict of interest.
Abbreviations
The following abbreviations are used in this manuscript:
| ADC | Analog-to-Digital Converter |
| BCH | Bose–Chaudhuri–Hocquenghem Codes |
| BPSK | Binary Phase Shift Keying |
| DAC | Digital-to-Analog Converter |
| DPSD | Doppler Power Spectral Density |
| ECC | Error-Correction Coding |
| ICI | Inter-Carrier Interference |
| IFFT | Inverse Fast Fourier Transformation |
| ISI | Inter-Symbol Interference |
| OFDM | Orthogonal Frequency-Division Multiplexing |
| PDP | Power Delay Profile |
| PRBS | Pseudo-Random Binary Sequence |
| RS | Reed–Solomon Codes |
| SFCF | Space-Frequency Correlation Function |
| STCF | Space-Time Correlation Function |
| STFCF | Space-Time-Frequency Correlation Function |
| TVIR | Time-Varying Impulse Response |
| TVR | Transmitting Voltage Response |
| UAC | Underwater Acoustic Communication |
References
- Salamon, R. Systemy Hydrolokacyjne; Gdańskie Towarzystwo Naukowe: Gdansk, Poland, 2006; ISBN 83-87359-98-X. [Google Scholar]
- Zhou, S.; Wang, Z. OFDM for Underwater Acoustic Communications; John Wiley & Sons Ltd.: Chichester, UK, 2014; ISBN 9781118458860. [Google Scholar]
- Bradbeer, R.; Law, E.; Yeung, E. Using Multi-frequency Modulation in a modem for the transmission of near realtime video in an underwater environment. In Proceedings of the 2003 IEEE International Conference on Consumer Electronics, ICCE, Los Angeles, CA, USA, 17–19 June 2003; pp. 360–361. [Google Scholar] [CrossRef]
- Chitre, M.; Ong, S.H.; Potter, J. Performance of coded OFDM in vary Shallow water channels and snapping shrimp noise. In Proceedings of the OCEANS 2005 MTS/IEEE, Washington, DC, USA, 17–23 September 2005; Volume 2, pp. 996–1001. [Google Scholar] [CrossRef]
- Kang, T.; Iltis, R.A. Iterative carrier frequency offset and channel estimation for underwater acoustic OFDM systems. IEEE J. Sel. Areas Commun. 2008, 26, 1650–1661. [Google Scholar] [CrossRef]
- Leus, G.; van Walree, P.A. Multiband OFDM for covert acoustic communications. IEEE J. Sel. Areas Commun. 2008, 26, 1662–1673. [Google Scholar] [CrossRef]
- Kochanska, I.; Schmidt, J.H.; Marszal, J. Shallow Water Experiment of OFDM Underwater Acoustic Communications. Arch. Acoust. 2020, 45, 11–18. [Google Scholar] [CrossRef]
- Sklar, B. Rayleigh fading channels in mobile digital communication systems. I. Characterization. IEEE Commun. Mag. 1997, 35, 90–100. [Google Scholar] [CrossRef]
- Schmidt, J. The development of an underwater telephone for digital communication purposes. Hydroacoustics 2016, 19, 341–352. [Google Scholar]
- Schmidt, J.H.; Kochańska, I.; Schmidt, A.M. Measurement of Impulse Response of Shallow Water Communication Channel by Correlation Method. Hydroacoustics 2017, 20, 149–158. [Google Scholar]
- Kochanska, I. Assessment of Wide-Sense Stationarity of an Underwater Acoustic Channel Based on a Pseudo-Random Binary Sequence Probe Signal. Appl. Sci. 2020, 10, 1221. [Google Scholar] [CrossRef]
- Kochanska, I.; Schmidt, J.; Rudnicki, M. Underwater Acoustic Communications in Time-Varying Dispersive Channels. In Proceedings of the 2016 Federated Conference on Computer Science and Information Systems (FedCSIS), Gdansk, Poland, 11–14 September 2016; pp. 467–474. [Google Scholar]
© 2020 by the author. Licensee MDPI, Basel, Switzerland. This article is an open access article distributed under the terms and conditions of the Creative Commons Attribution (CC BY) license (http://creativecommons.org/licenses/by/4.0/).