1. Introduction
Flat-panel loudspeakers are becoming increasingly important for today’s consumer market [
1]. The invisible integration, wide and diffused radiation and improved room interaction are features of flat-panel loudspeakers, mentioned by Bank [
2], for improving the perceived audio quality. Furthermore, large and more powerful devices can be integrated without disturbing customers’ views or disrupting the aesthetics of a room. However, in addition to invisible integration, flat-panel loudspeakers must posses acoustic quality that is comparable to that of conventional systems. Klippel [
3] reported that customers of audio devices expect that the audio signal can be reproduced at a sufficient amplitude and quality. The acoustic quality can be expressed in terms of frequency limits, the maximum sound pressure level, the flatness of the pressure response, the harmonic and nonlinear distortions and the radiation characteristics [
4,
5].
This study concentrates primarily on the flatness of the response, which is essential to the listener preference rating emphasized by Olive [
6]. Flat panel loudspeakers have higher deviations than conventional systems. In particular, in the low-frequency range, the modal density is low on the logarithmic frequency scale [
7]. To optimize the spectrum of flat-panel loudspeakers, Borwick [
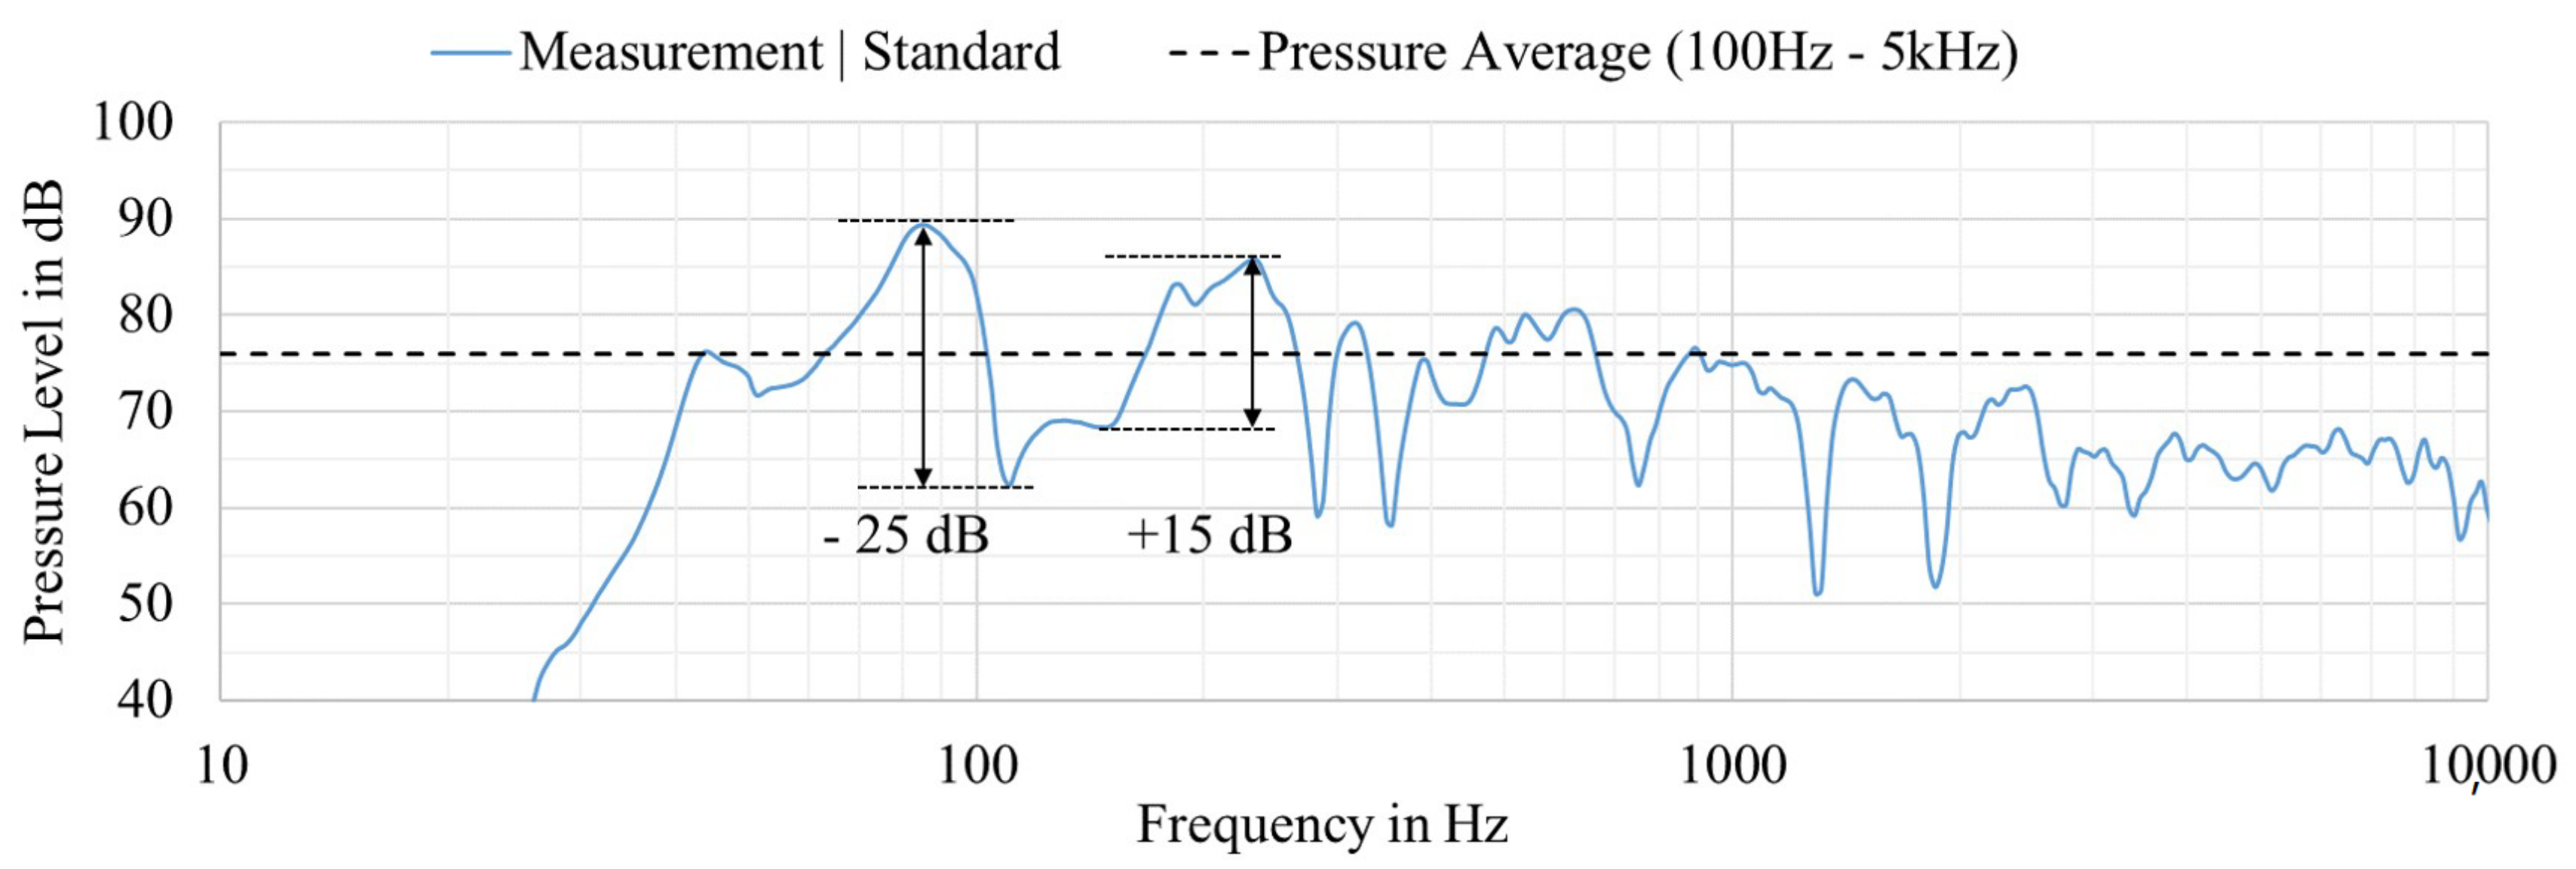
8] recommended optimizing the distance between the modal frequencies to give the illusion of a continuous spectrum. However, in many cases, it is not possible to increase the modal density in the low frequency range: the material properties, the thickness of the panel and the design are fixed. Therefore, the lack of a low-frequency response needs to be resolved by construction or excitation. An example of an insufficient frequency response is shown in
Figure 1. Deviations of more than 20 dB in the lower frequency range are possible. The deviations decrease for higher frequencies.
Several constructive and control approaches have already been developed to improve the flatness of flat-panel loudspeaker responses. It is known that the damping of the boundary conditions, as well as the stiffness and damping of the coupled air volume (panel volume) or individual attached concentrated masses, have a positive influence on the pressure response [
9,
10,
11,
12]. Another sufficient control variable is the position of the exciter. This can be optimized with a numerical analysis to find the best excitation positions in a fast and automatized way [
13]. The achievable effect is physically limited. A single force driver is not able to excite all eigenmodes in an efficient way. Consequently, individual modes are excited with different levels of intensity, which occurs due to the superposition as a flatter pressure response. An alternative solution was presented by Anderson [
14], who recommended the usage of an array of force drivers to selectively excite the lowest eigenmodes of the flexible panel. This construction enables the same acoustic performance as a conventional speaker within the array-addressable frequency region. However, it increases the costs and complexity due to the higher number of exciters and controlled outputs of the DSP. The last approach is known as the paneled woofer design introduced by Zenker [
15]. A conventional woofer radiates into a small air gap between the panel and a separation plate and excites the panel uniformly. This results in a flat response, which is comparable to a conventional woofer design. This design is limited to higher frequencies and needs to be supplemented by an exciter.
This paper presents a new control variable—modal related air compliance. It is known that the spring of the panel volume has a strong modal-dependent influence and can shift modes individually based on their effective radiating area [
16,
17]. Furthermore, the panel volume is connected with a significant increase in the system’s resonance frequency, but the air spring-related stiffness is independent of the enclosure shape, as reported by Beer [
18]. This statement is contradicted in this paper. The different local air compliance of an irregular shaped enclosure is used to change the mode shape of the individual structural modes and suppress the panel’s anti-phase components. Compared to a simple cuboid enclosure, the irregular shaped enclosure can create local pressure changes that can cause a local panel stiffening. This minimizes dips and improves the frequency response without adding mass to the system. This concept is comprehensively discussed and analyzed with real prototypes. By using numerical approaches, an optimization algorithm is implemented, which further improves this systems behavior, resulting in a flatter frequency response.
In the first section, a prototype with high deviations in the frequency response is introduced and reproduced with a simulation tool. The simulated results are validated with real measurements of a prototype. This allows a decomposition to find the root causes of the dips in the frequency response in
Section 2. Based on these results, a constructive solution for an irregular shaped panel volume is presented in
Section 3. This design is analyzed with measured and simulated results and compared to a standard system. Different analyzing methods are compared and a numerical model is built to visualize the influence of the air-spring effect in detail. In the last section, a variation routine is performed, which further optimizes the frequency response by changing the shape of the enclosure.
2. Introduction and Modeling of a Standard System
This section introduces the adaptable prototype of a flat panel loudspeaker in the configuration of a standard system. This configuration has high dips and peaks in the frequency response, especially at lower frequencies. To analyze the root cause of the dips and peaks in the frequency response, a numerical simulation is set up and validated. These results are used to analyze the radiation behavior in detail in
Section 3.
2.1. Adaptable Prototype—Introduction of the Standard Configuration
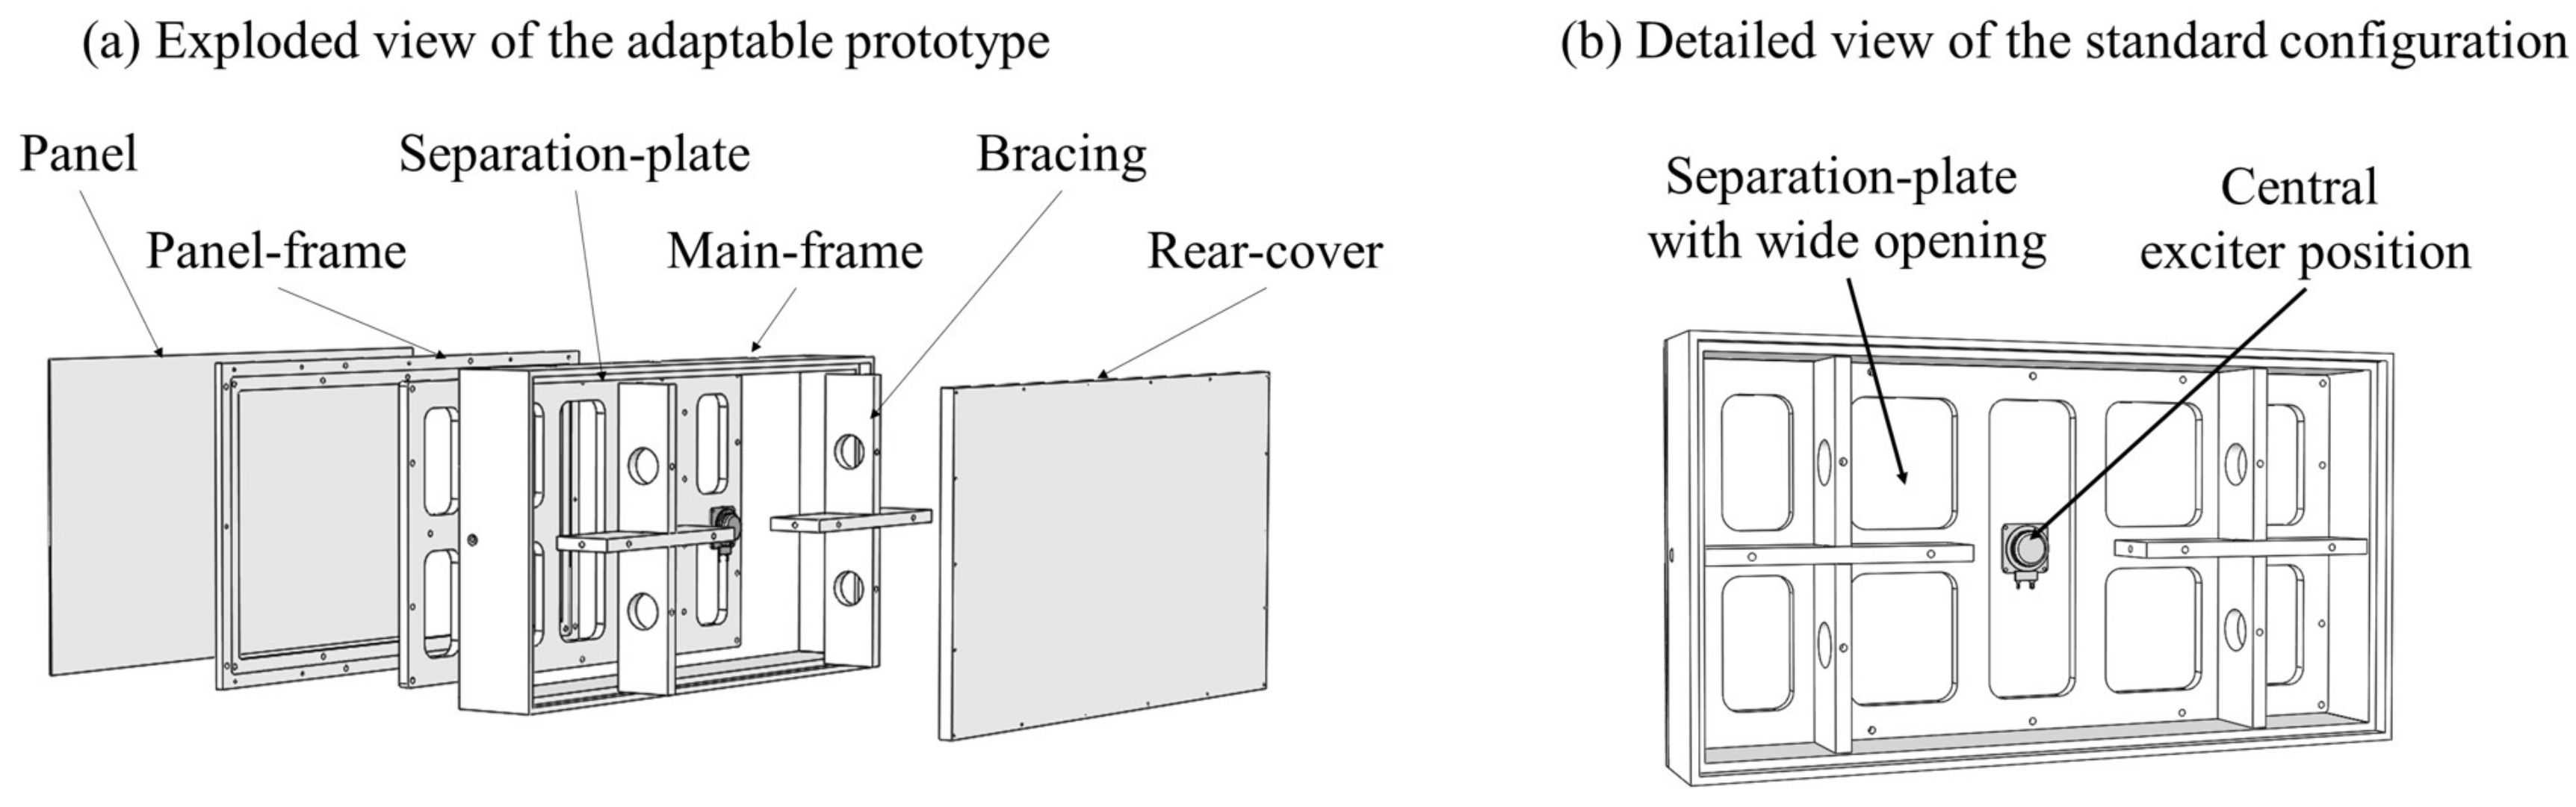
To guarantee similar boundary conditions (e.g., the same panel or enclosure), an adaptable prototype was constructed to evaluate various configurations of the flat-panel loudspeaker. An exploded view of the adaptable prototype is shown in
Figure 2a. The prototype has overall dimensions of 855 mm × 467 mm. The panel is glued on the 40 mm wide panel frame to ensure rigid boundary conditions. Therefore, the moving panel dimensions are 775 mm × 387 mm, which results in an overall panel surface of 0.3 m
2 with a ratio of 2. The additional bracing is crucial to suppress the separation plate’s and the rear cover’s vibrations, which could have a high impact on the pressure response due to the large dimensions of the prototype.
Figure 2b shows the standard configuration for this paper, which represents simple flat-panel loudspeaker construction. The exciter is placed in the center to have a configuration with significant peaks and dips of this configuration. It is known that a position change will improve the deviations in the frequency response [
13]. This case will help to separate the reasons for the anti-phase components caused by individual modes because a central exciter position drives only uneven modes. This provides a very useful model for demonstrating and analyzing the influence of the additional modal-dependent air stiffening shown in later sections. The large openings in the separation plate prevent additional stiffening of the panel by an irregular shaped air volume. Furthermore, they allow the integration of additional bracing to reduce enclosure vibrations to a minimum.
2.2. Introduction to the Simulation Model
The simulation model represents the mechanical and acoustic mathematical relationships. It was set-up with the software tool wave6 [
19].
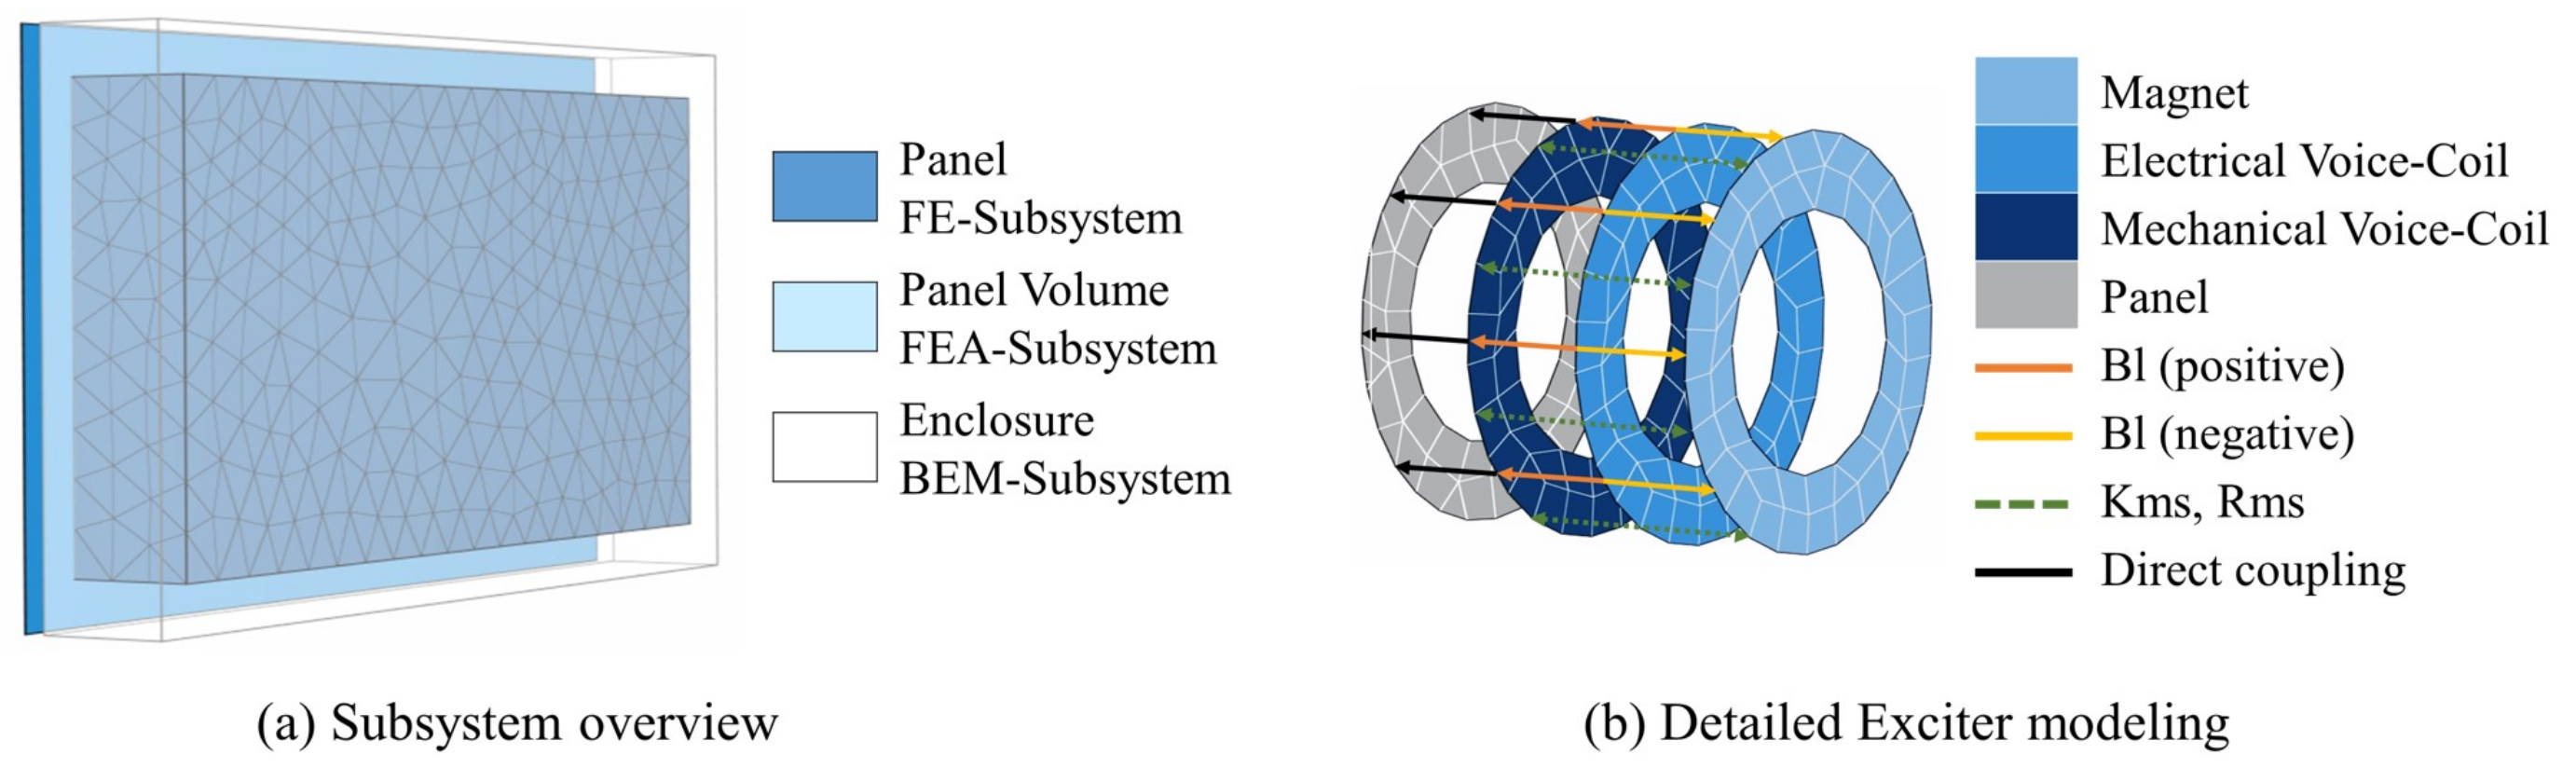
Figure 3a shows the coupled field simulation model consisting of the finite element mechanical (FEM), finite element acoustical (FEA) and boundary element method (BEM) subsystems. The excitation is modeled as a lumped parameter model, analogous to a previous exciter study [
15]. The exciter consists of three finite element (FE) parts representing the masses of the magnet and the electrical and mechanical part of the voice coil shown in
Figure 3b. Moreover, the mechanical, electrical and magnetic properties are applied via the boundary and transfer impedance according to the equivalent electromechanical network. The exciter is a system with two DOFs, as both the magnet and the voice coil can vibrate independently. Both DOFs are coupled with a compliance-related transfer impedance, in which the former voice coil is directly connected to the panel. The numerical errors of the FE and FEA solvers are estimated with convergence analysis. It is known that more accurate information is obtained by increasing the number of elements or reducing the mesh size. An h-refinement test was performed considering the deviation of the calculated eigenfrequencies of less than 1%. The h-refinement routine works as follows: a fine mesh is used to model the problem and used as a reference mesh. In further steps, the mesh size is increased and the results are changed. If the difference of the reference mesh and the coarser mesh are below 1%, the failure caused by the mesh density is negligible.
The FE part is modeled with CQUAD8 FE elements (second order isoparametric shell quadrangle with four nodes associated with the vertices and four with the edges) with an element length of 10 mm. The elastic properties of the panel were determined with experimental modal analysis. All panel eigenmodes are solved up to 2 kHz. Furthermore, the panel is coupled to an air volume (panel volume), which represents an air stiffness as frequency-dependent acoustical compliance. This subsystem is modeled with an FEA approach. All modes up to 2 kHz are solved so that a total of 100 acoustic eigenmodes are taken into account. The FEA part is modeled with TET10 elements (a 10-node second-order isoparametric tetrahedral element with four nodes associated with the vertices and six with the edges) with 1 mm element size, causing a minor error of less than 1%. The sound radiation is solved with a BEM-approach. Based on the panel’s vibration behavior, the BEM-subsystem calculates the sound radiation on certain data recovery points in the far field. According to Marburg [
20], at least six elements per wavelength are required, so the BEM subsystem is meshed with TRIA6 elements (six-node second-order triangle element with three nodes associated with the vertices and three with the edges) and a medium element size of 25 mm, providing at least six elements per wavelength for the highest simulated frequency of 2 kHz.
2.3. Acoustical Measurement
This paper validates the numerical results with measurements of real prototypes. All essential models were reproduced with real prototypes, and the quality of the simulation model was evaluated. All acoustic measurements were performed in the anechoic chamber at the Technical University Dresden. The microphone was placed at a distance of 1 m focusing on the panel’s center, and the measurements were performed with a 2 Vrms input signal in the form of a sweeping sine wave averaged 16 times. The following equipment was used:
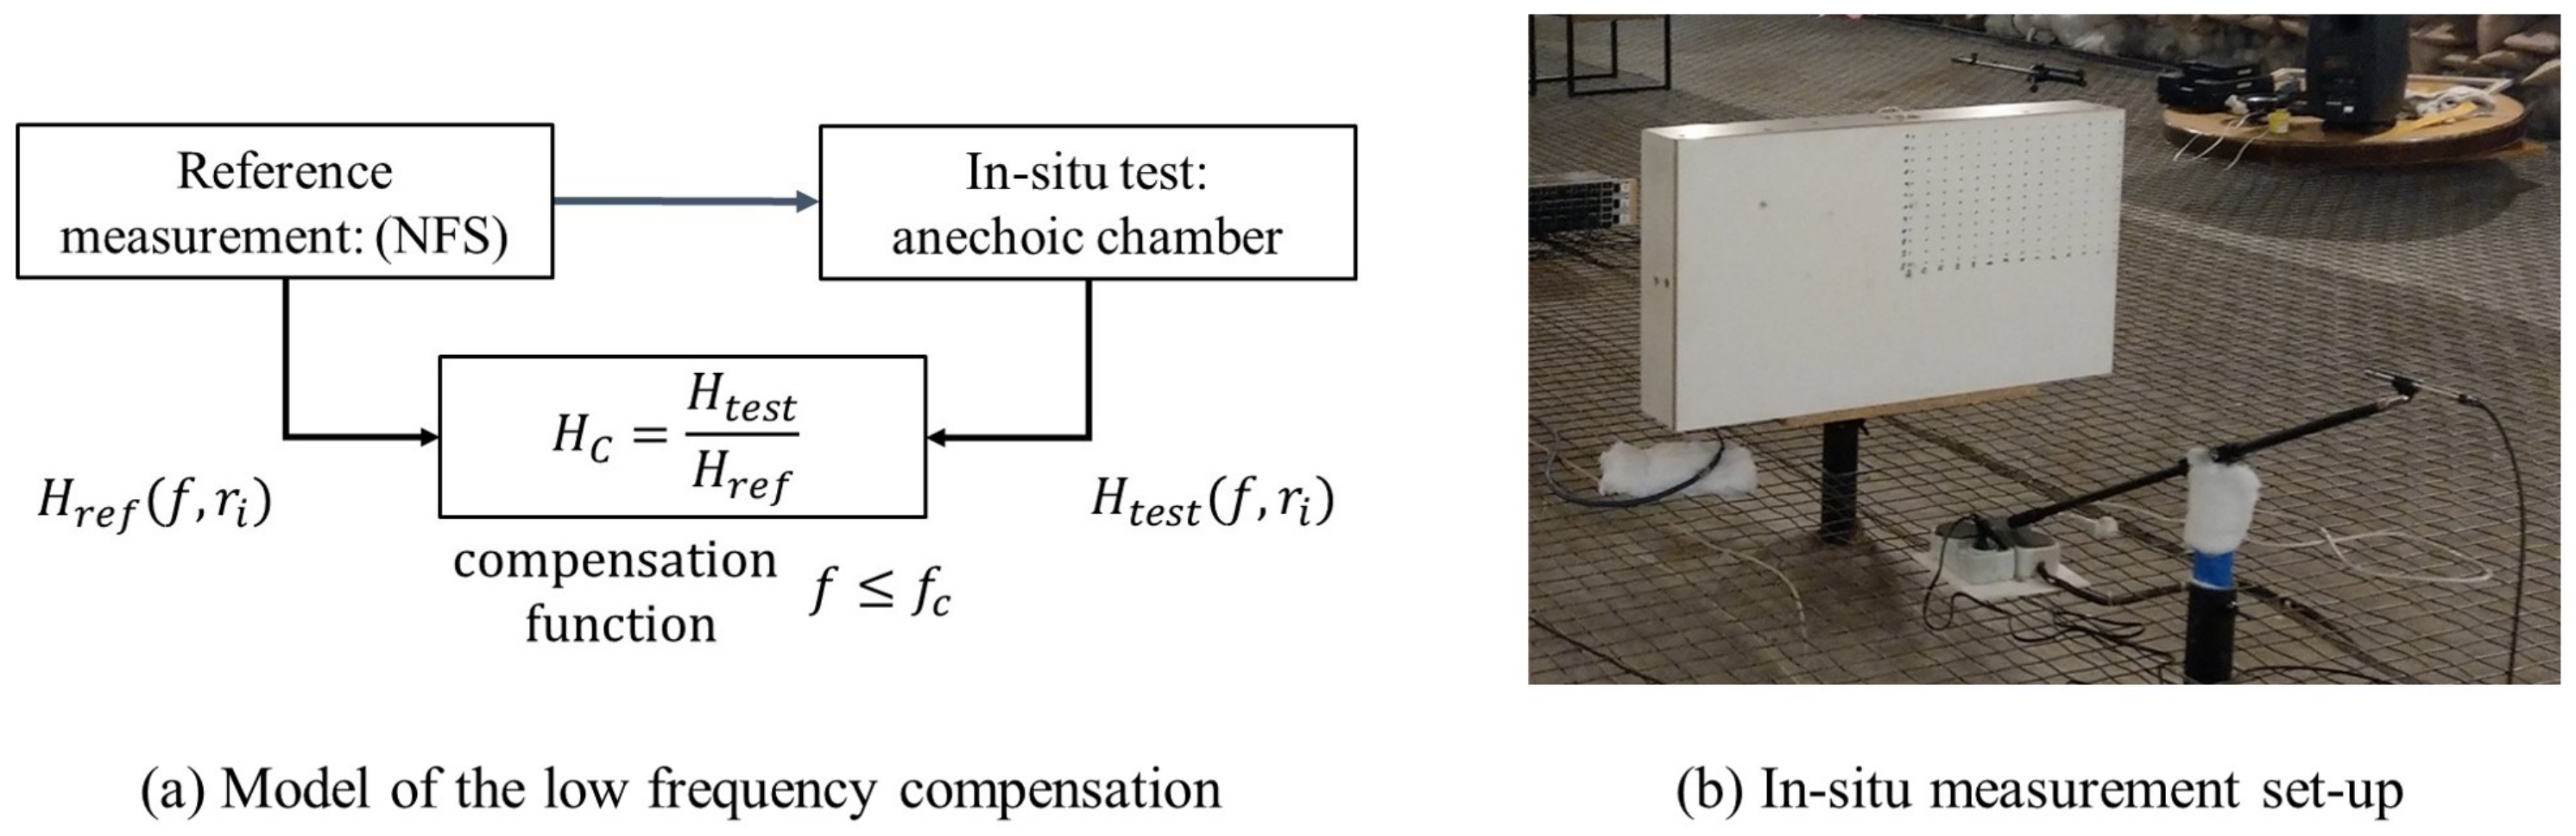
It is known that even the largest anechoic chamber is limited to lower frequencies. In this case, the critical frequency
is 70 Hz, and, below
, a correction is essential. The correction curves were estimated as shown in
Figure 4. The compensation function
was calculated by comparing a reference measurement with the Klippel near field scanner (NFS) and the in-situ tests at a certain location in the anechoic chamber. The resulting compensation function is applied for all measurements below
. The applied room-correction curve has a range of ±2.5 dB in the frequency range of 20–70 Hz.
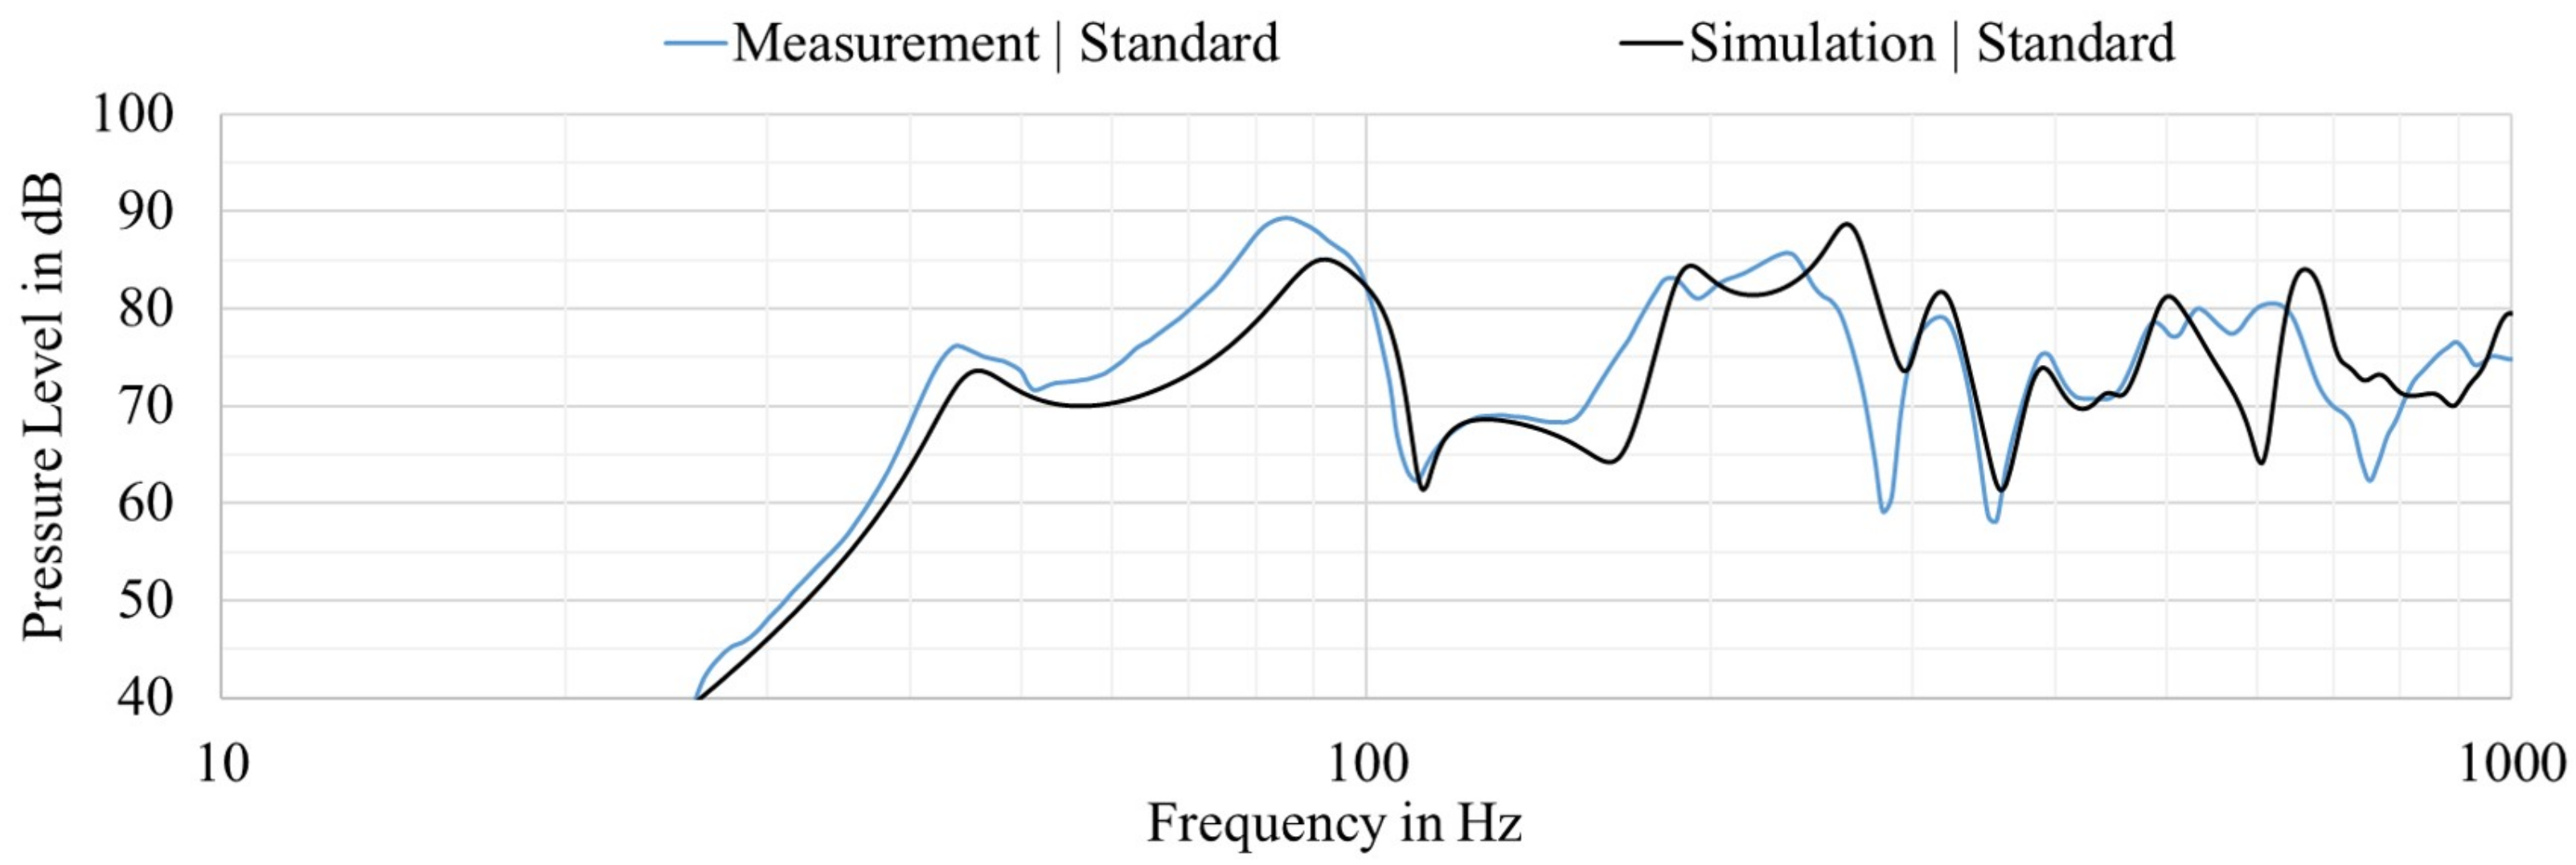
2.4. Validation of the Simulated Pressure Response
This subsection presents the performance of the numerical simulation in comparison to experimental data.
Figure 5 shows the simulated and measured SPL transfer functions referenced to an input voltage of 2.83 Vrms. A small shift occurs between the simulation model and the real measurement. To estimate the accuracy of a simulation model the total fitting error (TFE) is used [
21]. If the average of the TFE is lower than −10 dB, which corresponds to a deviation of 10%, the model is accurate enough to simulate the behavior of the panel. The calculated average TFE is −10.68 dB in the frequency range from 20 to 1000 Hz, which leads to a sufficient fit between the simulation and measurement results. This shift is acceptable since the shape of the curve fits the measurement, and conclusions regarding frequency-dependent behavior can be extracted. However, the steep decay at low frequencies can be accurately described. Furthermore, an increase at 90 Hz and a deep dip of approximately 25 dB in the range of 110–150 Hz are clearly displayed in the simulation model. Additionally, the pressure level increases again by 20 dB at 180 Hz, and the following individual peaks and dips show only a minimal frequency shift between the simulation model and the measurement. For these reasons, the simulation model is sufficiently accurate for analyzing the sound radiation behavior in further applications. However, the acoustic measurement of the pressure level has a substantial disadvantage. It does not provide any information about the causes of large deviations in the response. Therefore, modal and sound pressure-related decomposition is performed in the following subsection.
3. Numerical Analysis of the Pressure Deviations
The following sections present the detailed radiation characteristic analyses of the numerical prototype in the standard configuration. The root causes of dips and peaks are analyzed and visualized by using modal and sound pressure-related decomposition. This allows a separation of in-phase, anti-phase and quadrature components and back-tracing to causes of individual modes. Based on these results, the concept of modal-dependent air-spring design is introduced.
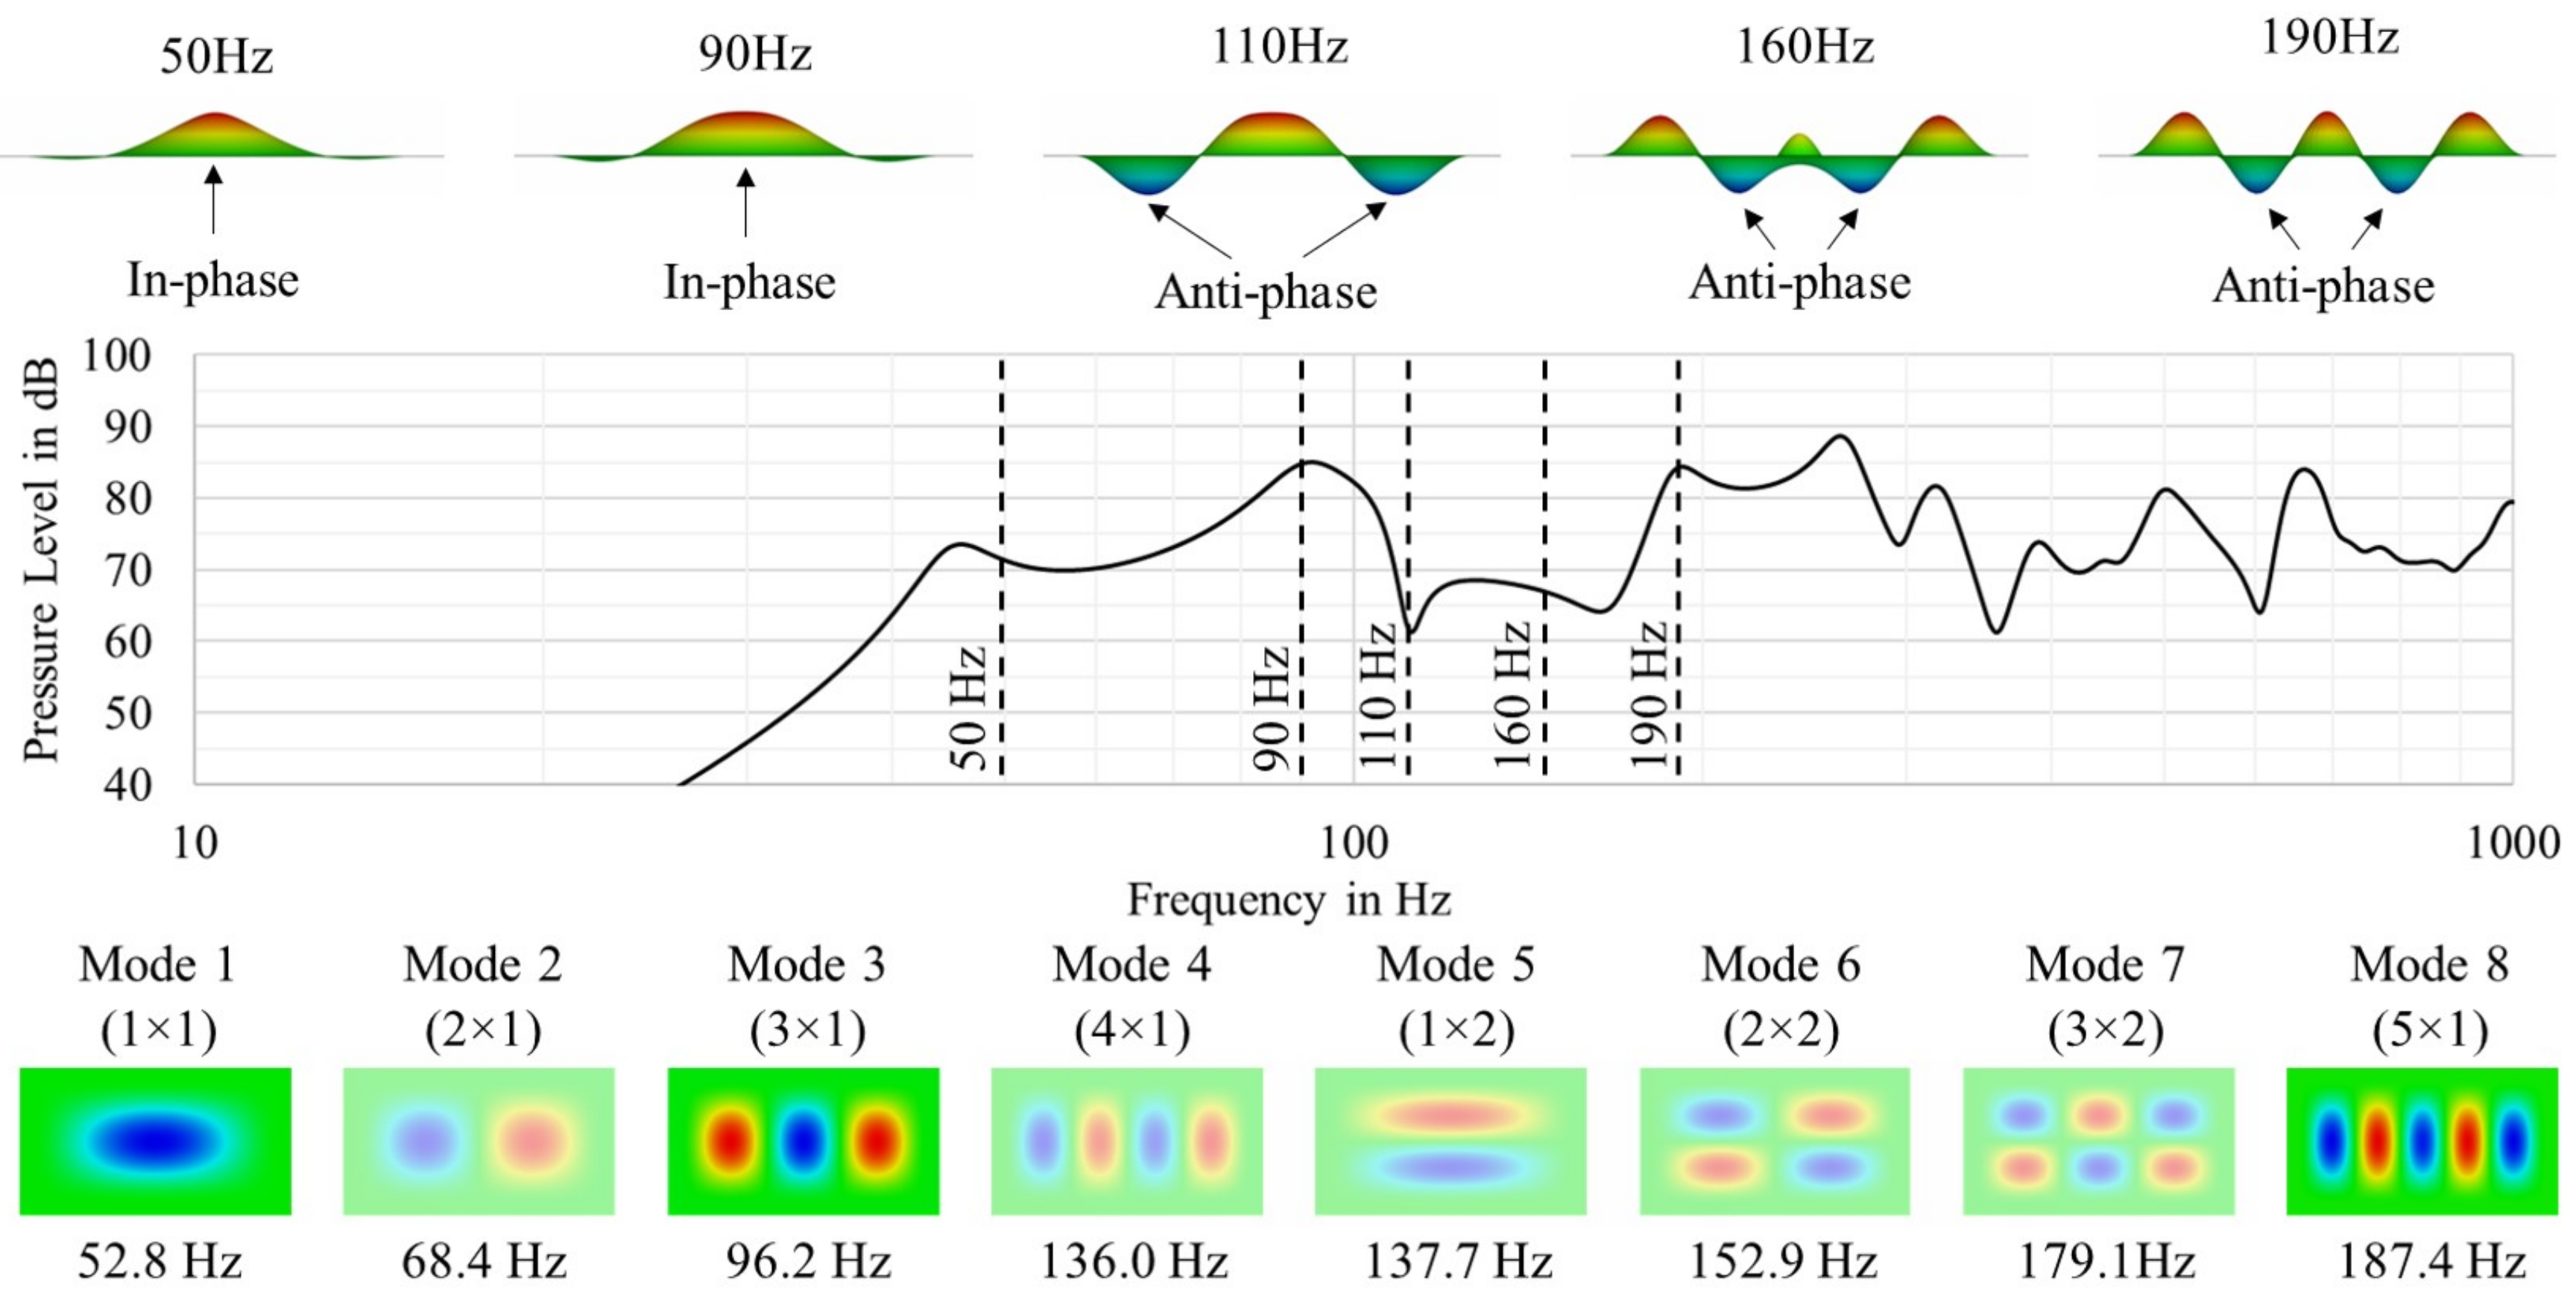
3.1. Root Causes of Dips in the Frequency Response
Figure 6 shows the simulated pressure response, the displacements of the panel at different frequencies on the upper side and the relevant modes on the lower side. No even modes were excited by the central excitation. The natural frequencies correspond to the panel without coupling to a back chamber volume.
Figure 6 shows that the frequency response is directly related to the shape of the panel displacement. If the panel bends primarily in one direction, a flat frequency response is reached. These components are also called in-phase components. If the panel breaks up and moves with a larger portion in the opposite direction, acoustic cancellation occurs. These cancellations are called anti-phase components. A strong dip at 110 Hz results from a similar amount of anti-phase and in-phase components. The superposition of Modes 1 and 3 results in strong cancellation and inefficient radiation. However, broadband dips in the frequency response are more critical than peaks since they require more additional power to be compensated and will result in acoustical distortion [
17].
3.2. Introduction of Modal Related Decomposition and Sound Pressure Related Decomposition
The distributed parameter model of flat panel loudspeakers represents every single mode as a separate network. Bright [
22] introduced an electromechanical circuit, which illustrates the coupling of the mechanical modes to the electrical and acoustical domains. The contributions of each mode can be represented as an analogous electrical circuit, which is summed up to the complex movement of the whole panel. Each mode has its own circuit, and the overall results are a superposition of all modes. With the simulation tool used, it is possible to decompose each mode’s ratio to the overall performance. The result of all the modes
compared with the individual parts of Mode 1
to Mode 11
is shown in
Figure 7.
Another evaluation method was presented by Klippel [
23]. The sound-pressure-related decomposition is an efficient postprocessing method to identify regions on the loudspeaker or panel that effectively contribute to the total radiated pressure level at a certain observation point. The structural vibration is decomposed by using the AAL (accumulated acceleration level). The separation contains the following components: in-phase components
, anti-phase components
and quadrature components
. The in-phase components have a constructive contribution to sound radiation. In contrast, the anti-phase components counteract sound radiation. The quadrature components have no contribution to the radiated sound at all. The
is the superposition of all components and represents the total movement of the panel as shown in Equation (
1):
The total pressure
is the result of the in-phase
and anti-phase pressure components
presented in Equation (
2). The
is twenty times the base-10 logarithm of the ratio of the total pressure to reference pressure value.
Furthermore, the following relationships are valid. The in-phase component can be larger than the total but never exceeds the . However, a small difference between the in-phase and anti-phase component causes acoustical cancellation and dips in the .
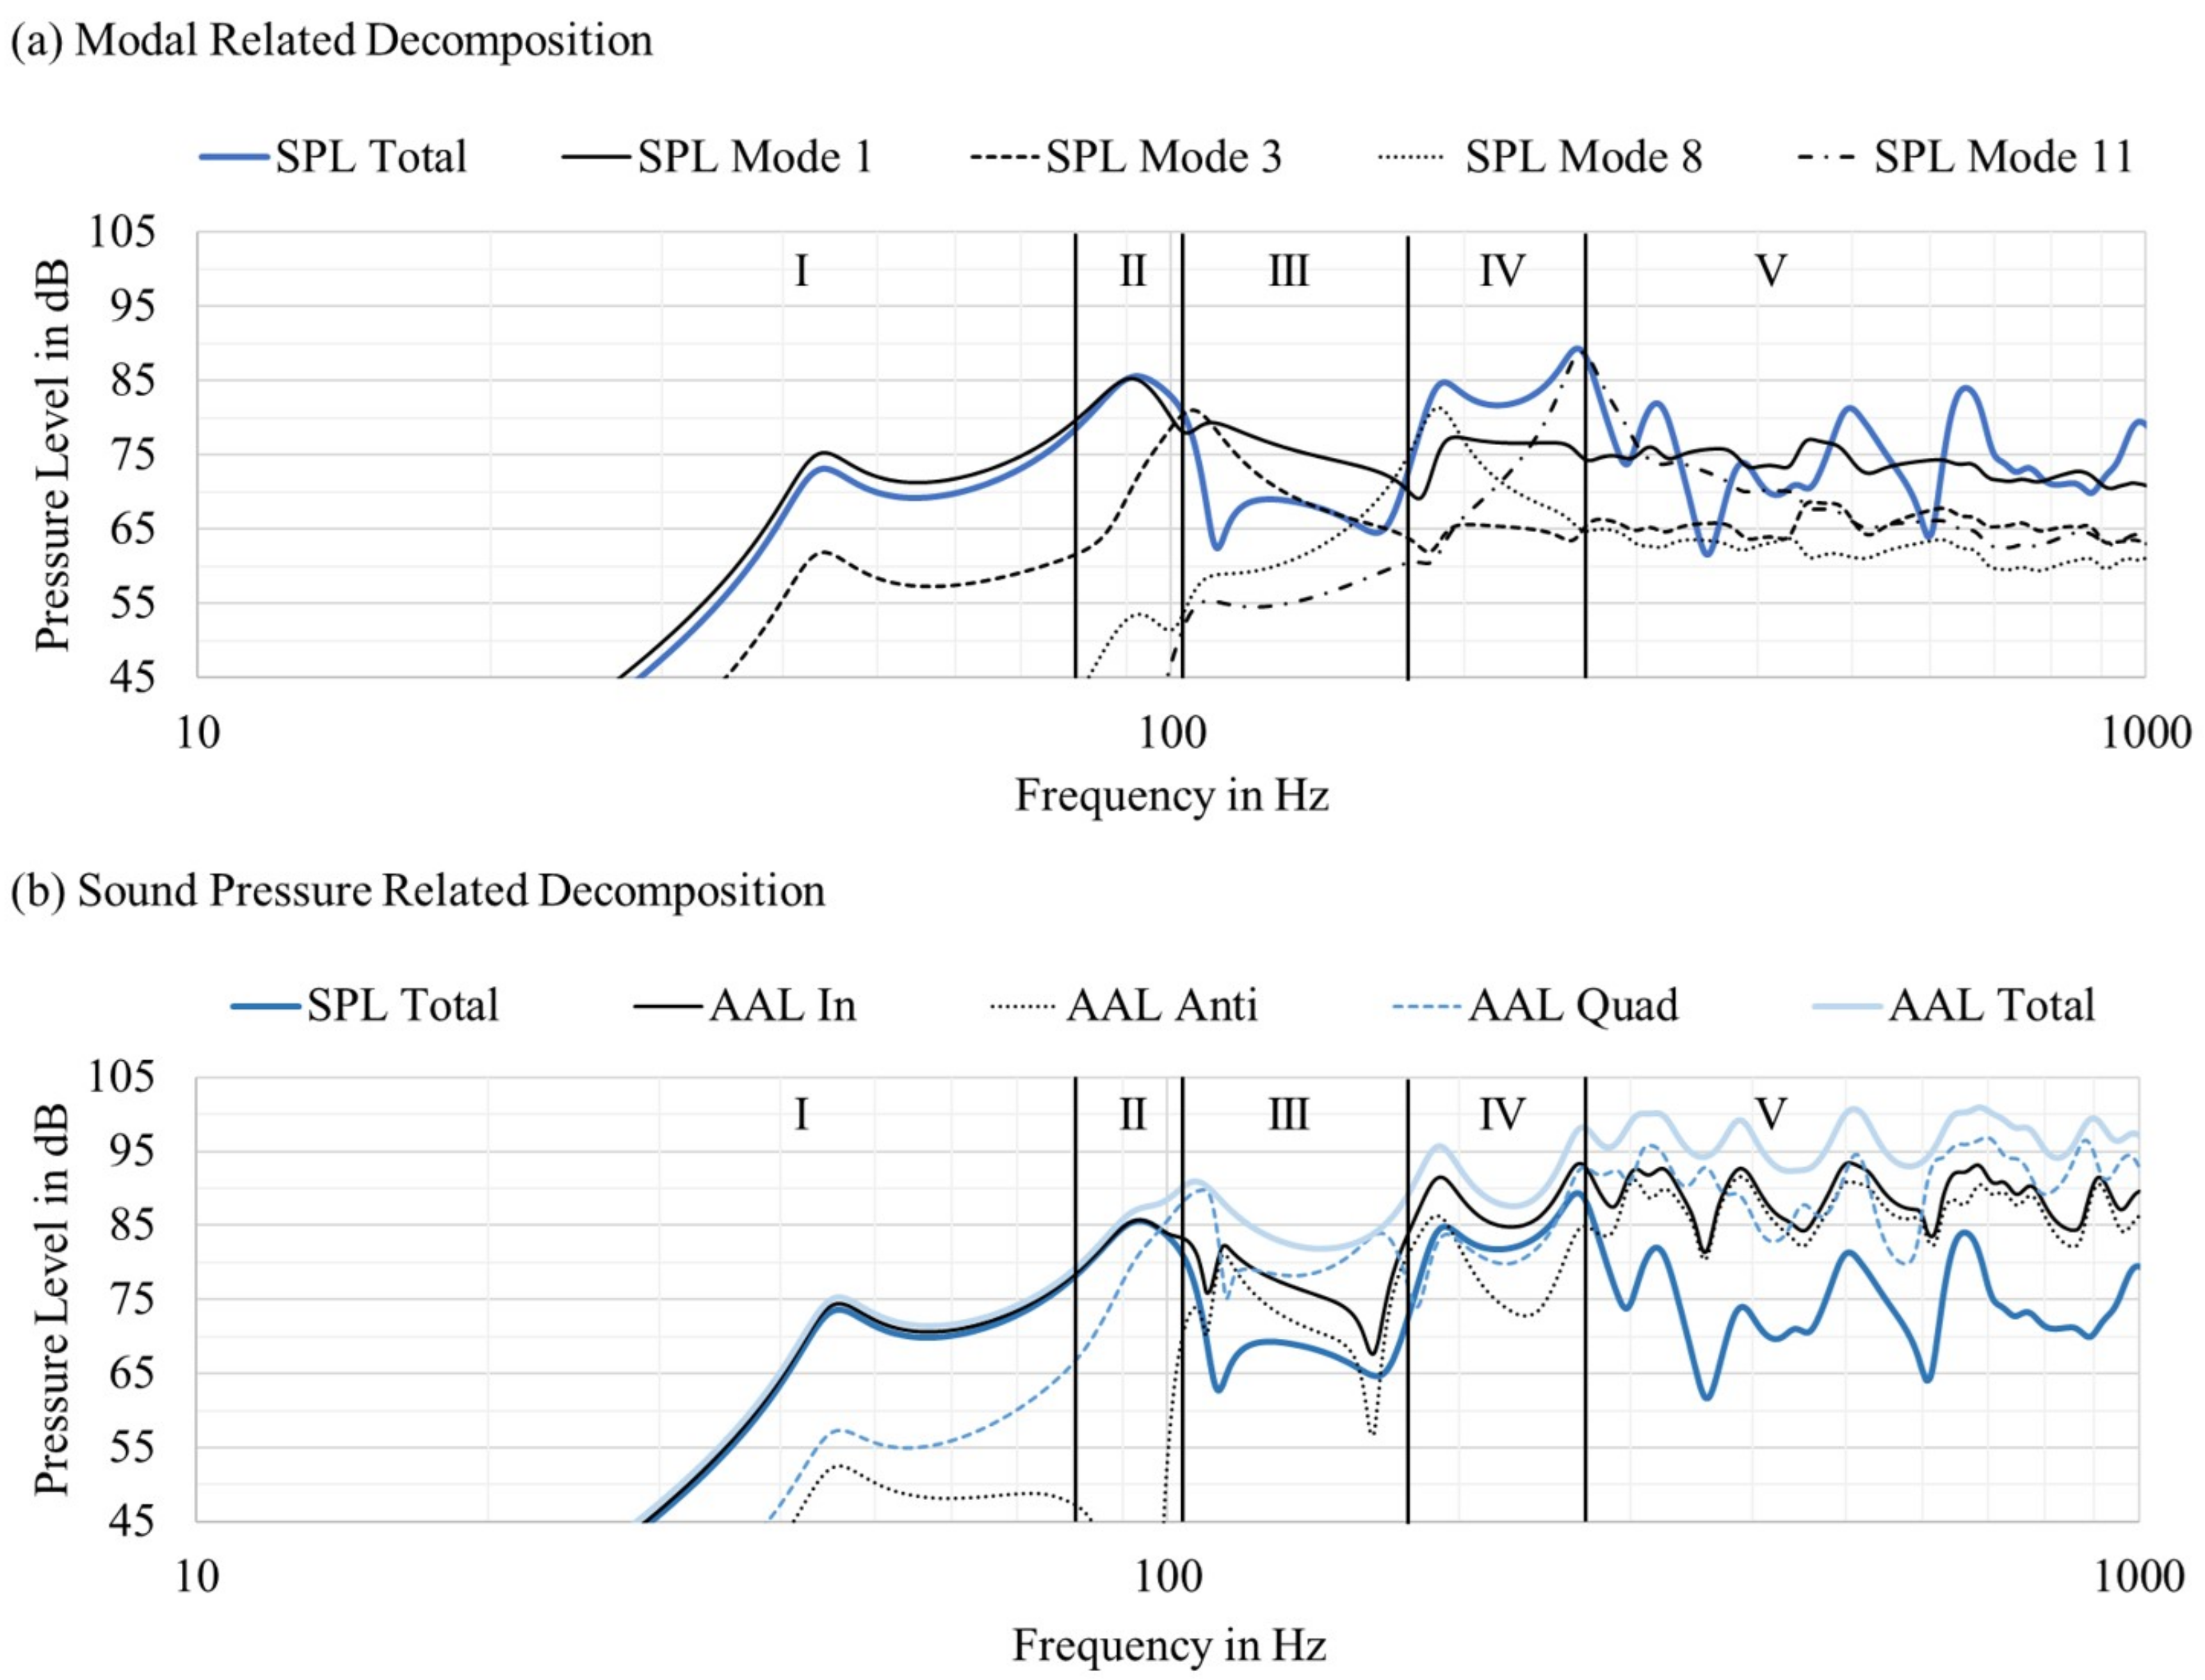
3.3. Evaluation of both Decomposition Methods
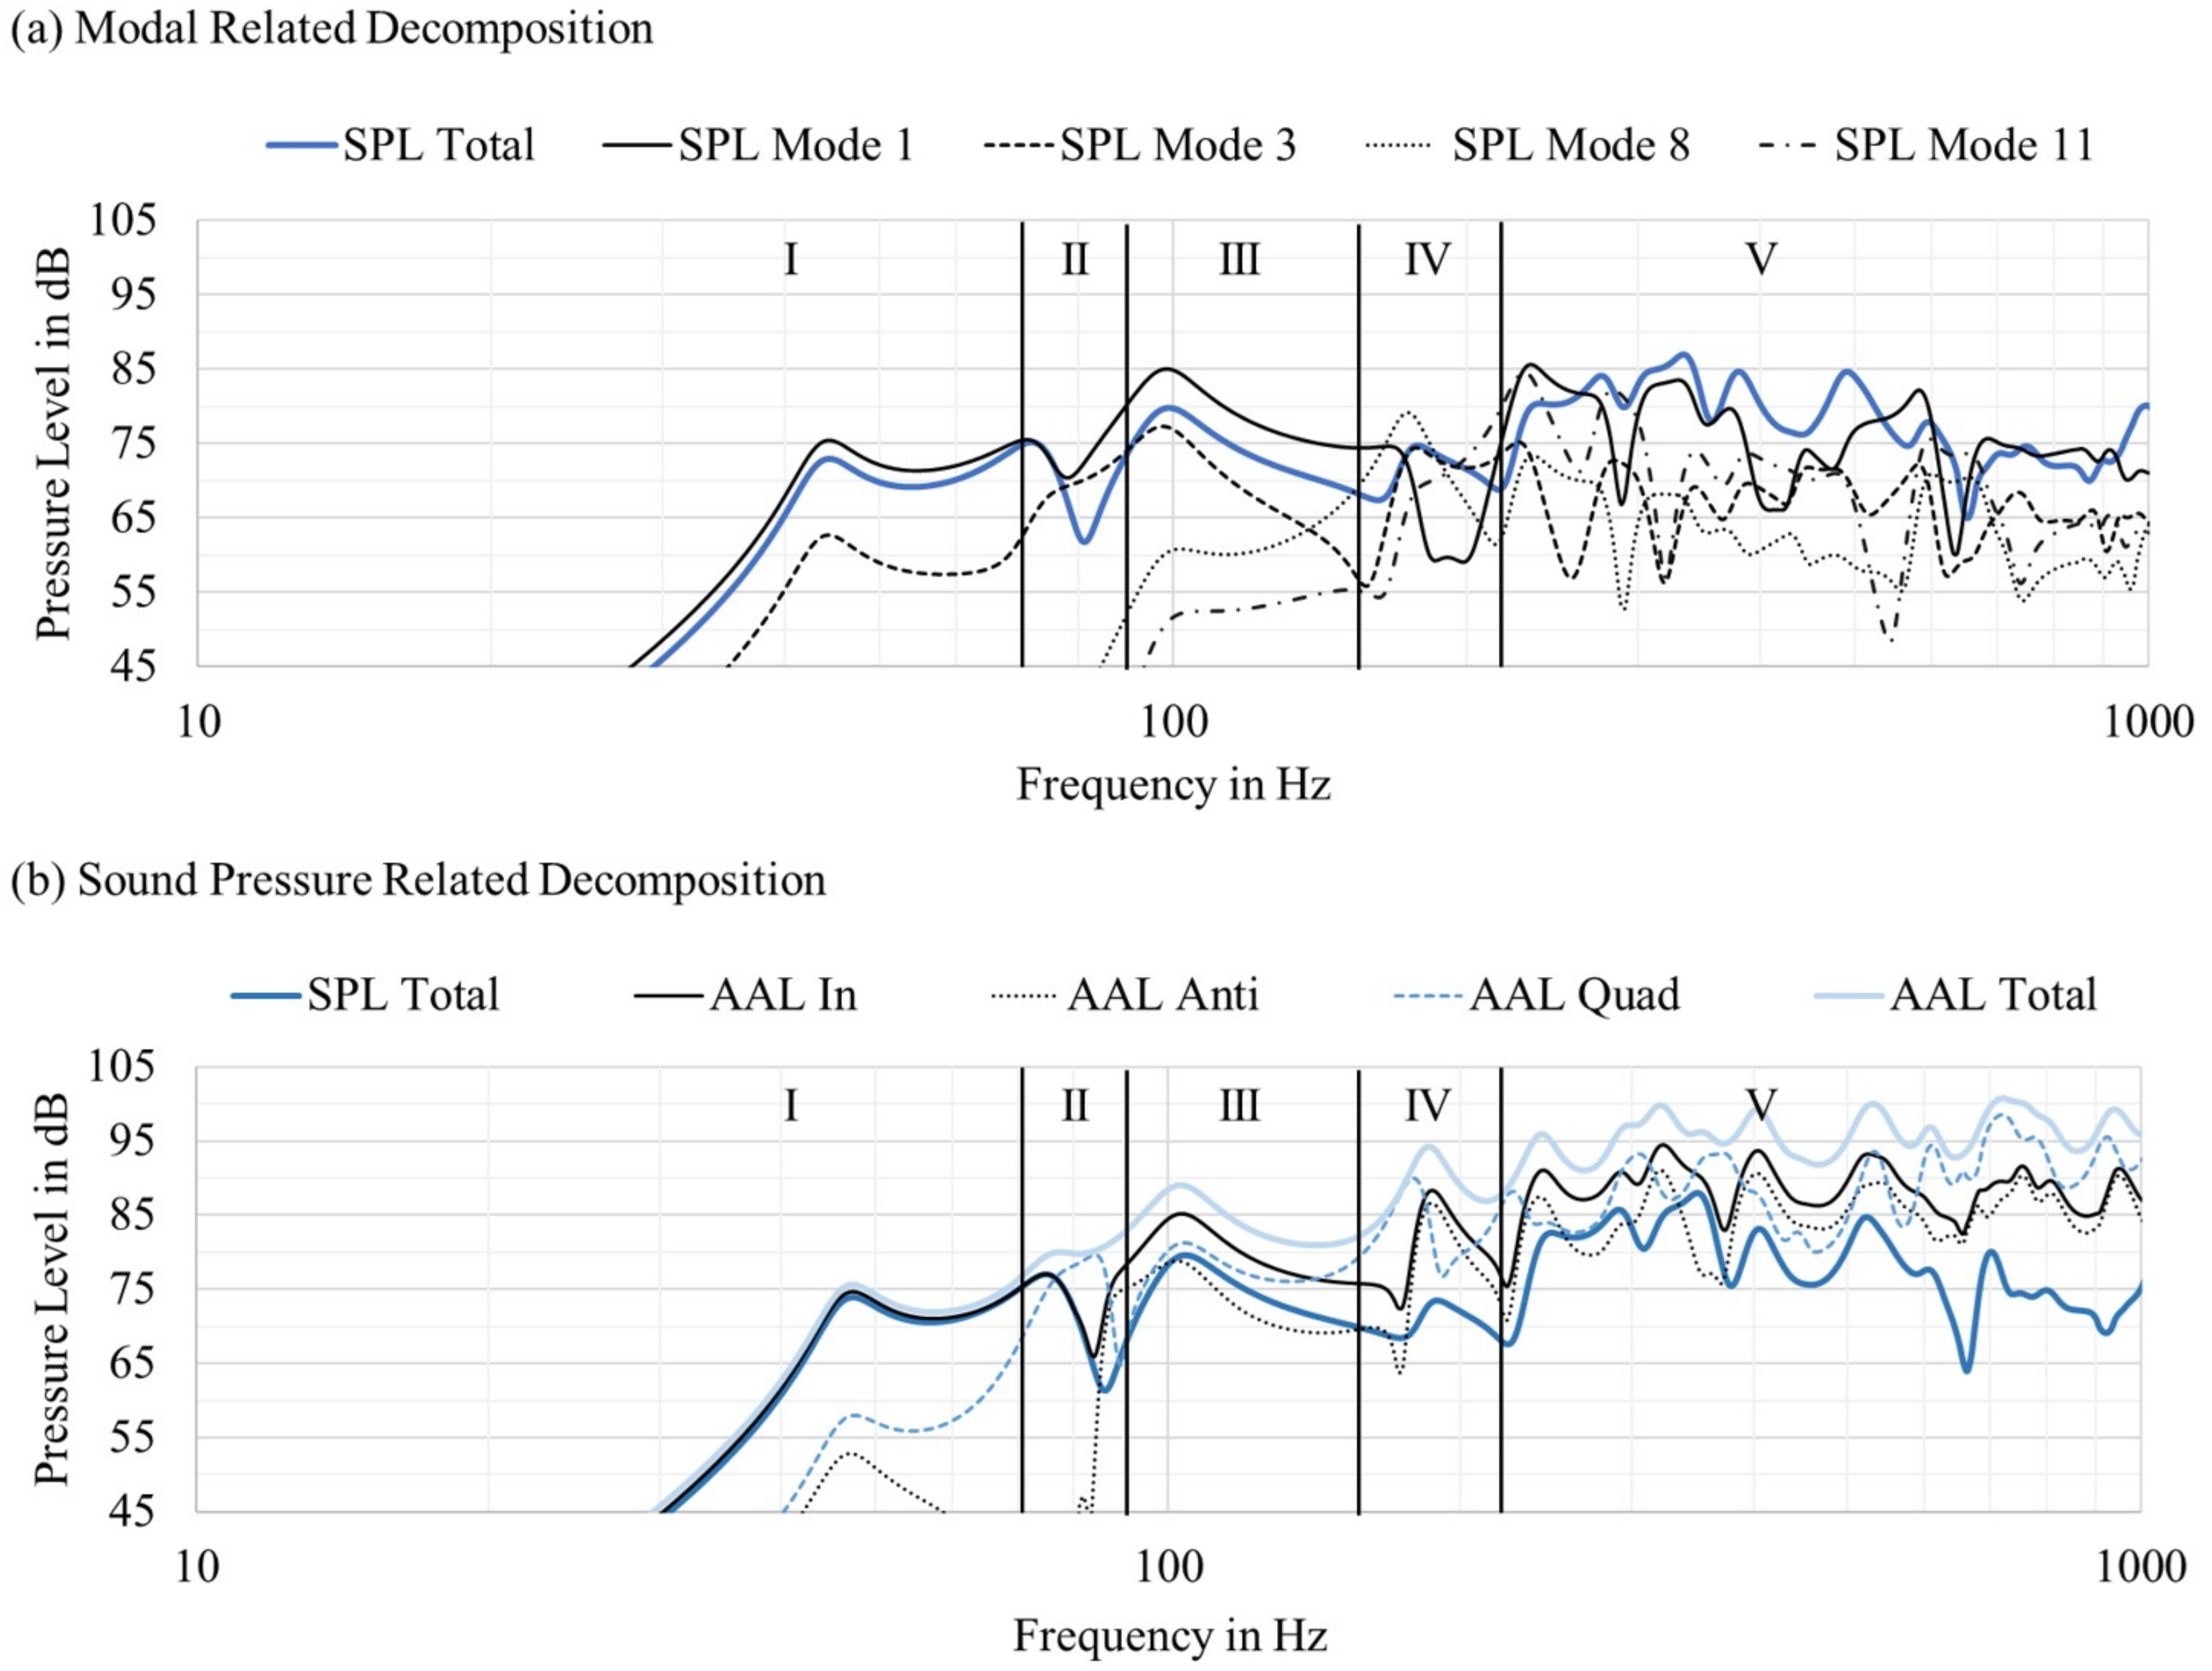
Figure 7 shows both decomposition methods. The modal-related decomposition shows the amount of every single driven mode. All even-numbered modes are not excited and have no effect on the overall performance. Therefore, these modes are not presented. It becomes clear that the excitation of every mode will result in a peak in the frequency response. Therefore, it is crucial to increase the modal density and find a position of the exciter that excites almost all modes. The frequency response between the two modes is critical and can result in an acoustic addition or subtraction dependent on the individual radiation area and phase. It can be concluded that the conversion from one mode to another mode can result in a new shape, resulting in strong acoustic cancellation or in acoustic addition with higher output.
represents a reasonable reference to estimate higher output through individual modes or the acoustic cancellation caused by individual modes. To analyze this in more detail,
Figure 7 is subdivided into five areas (I–V).
Area I (20–80 Hz): In the lower frequency range, only and contribute to overall performance. The pressure response of is lower than the response of . This shows an anti-phase component of , which minimizes the . Furthermore, the is close to the , and the radiation is nearly ideal. There are only a small number of anti-phase components in addition to the in-phase components.
Area II (80–102 Hz): This area shows a positive modal overlay. The pressure of is higher than the response of or . After the resonance of , a phase shift occurs, and and radiate in phase. This is also visible by the reduced level of the anti-phase components.
Area III (102 Hz–165 Hz): This band shows a significant dip at 110 Hz. and contribute nearly at a similar level, whereby has a higher contribution than , especially at 110 Hz. The resulting level of the is lower compared to and , and the amounts of in-phase and anti-phase components are nearly equal. Therefore, the resulting radiating area is reduced. The result is substantial surface movement with less radiation.
Area IV (165–265 Hz): This band shows the possibility of an in-phase overlay of modes. The is higher than the response of , or . and are radiating in phase. The level differences of the in-phase and anti-phase components are 5–10 dB, which results in a larger radiating surface area and a high output.
Area V (265–1000 Hz): This band shows in-phase and anti-phase overlays of the modes. The is at certain frequencies higher and lower than the radiation of . This visualizes the modes that are not radiating in phase with and will reduce the overall output. Furthermore, the level difference of the in-phase and anti-phase components are reduced, which will end up in a smaller radiating surface area, even if substantial motion occurs on the surface. The does not decrease to higher frequencies.
4. Prototyping and Simulation of the Modal Related Air Compliance
The material parameters, thickness and shape of the panel, additional bracings and position of the force excitation are essential options to tune the frequency response to low deviations. Many of these approaches prevent symmetry and suppress strong anti-phase components. This section presents the idea of the modal-related air compliance and shows the improved frequency response of the updated prototype with an irregular shaped enclosure. Furthermore, the frequency-dependent mode shape and chamber pressure are visualized to understand the stiffening effect of the acoustic compliance in comparison to the standard version.
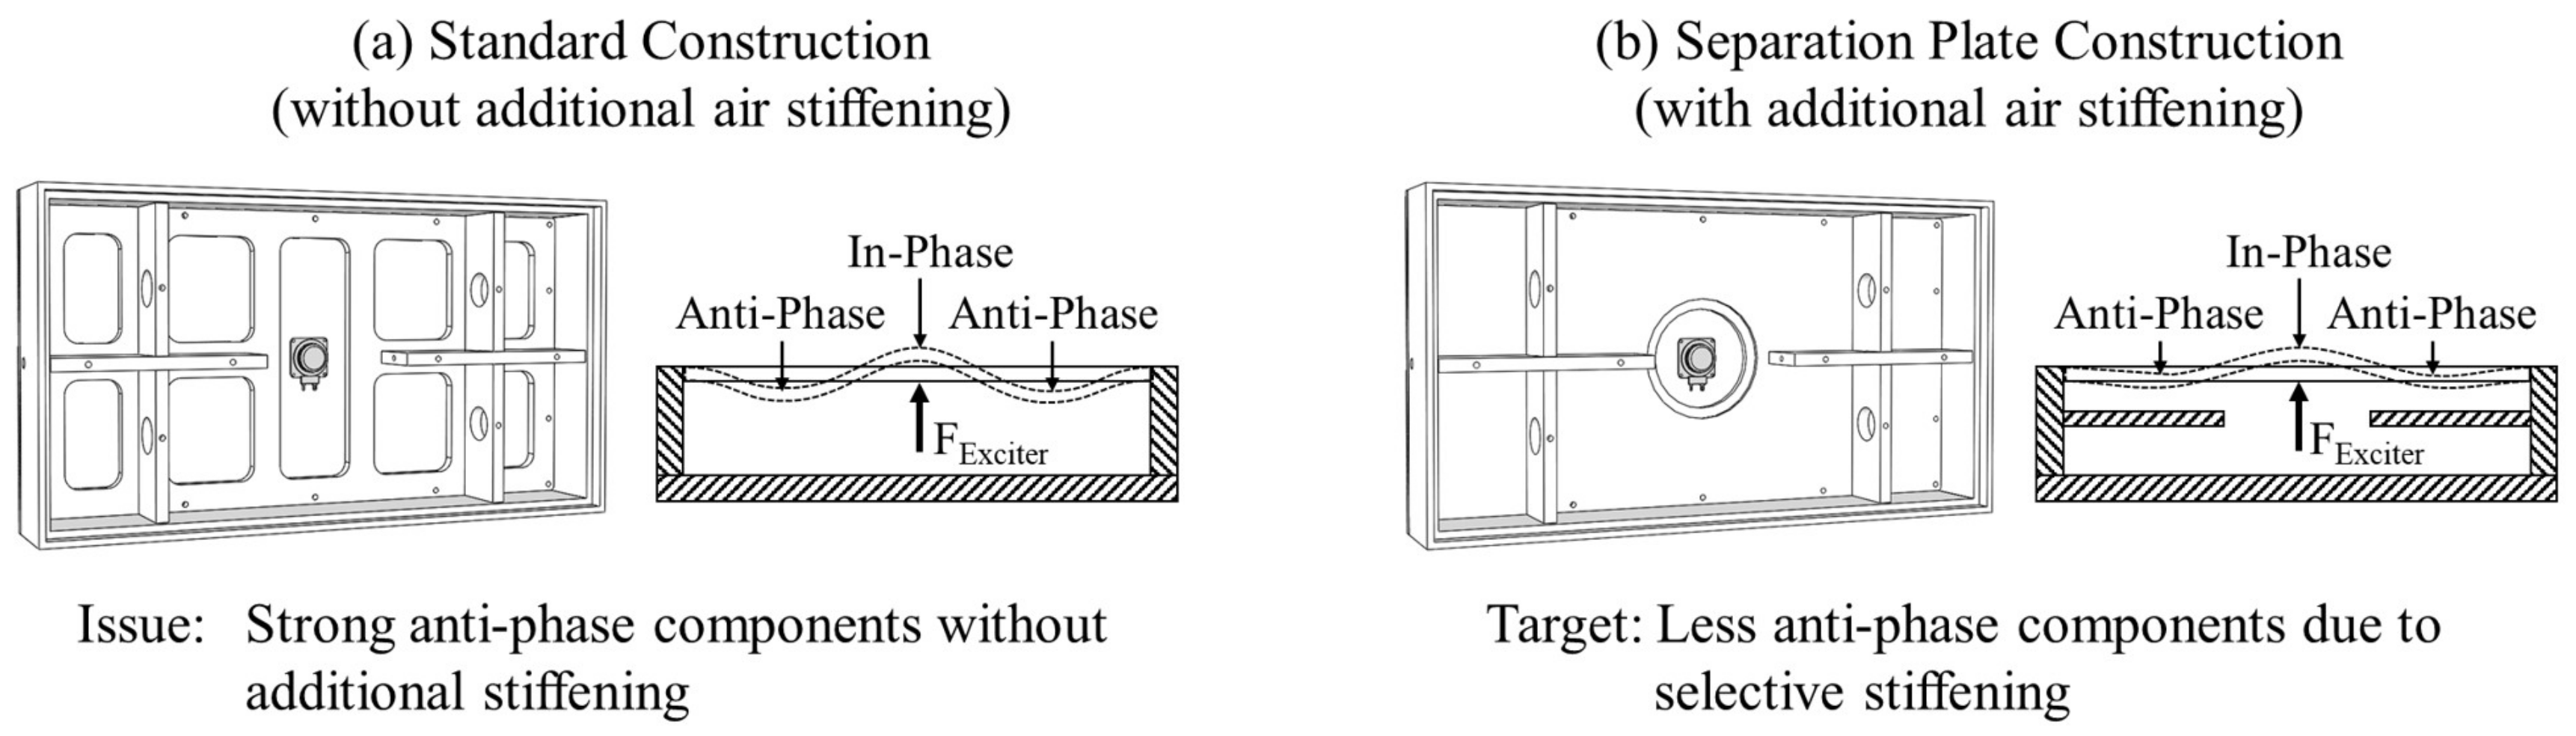
4.1. Prototype of the Modal Related Air-Compliance
The modal-related air compliance aims to change the mode shape of specific panel modes to suppress anti-phase components. The acoustic performance is predominantly driven by Mode 1, which has the largest displacement in the center of the panel. Consequently, only minor stiffening should be applied in the central area near the exciter. In particular, Mode 3 causes acoustic cancellation and thus produces dips in the frequency response. Therefore, areas closer to the edge should be stiffened by the air volume to minimize anti-phase components. A possible solution is shown in
Figure 8. A separation plate is mounted behind the panel with a small air gap. Furthermore, a cut out in the area of the exciter is integrated to minimize local stiffening. The goal is to stiffen the off-center areas with the air spring to minimize the bending of the panel. This results in a frequency-dependent air spring effect, which stiffens the panel frequency and modal selectivity.
4.2. Comparison of a Standard and a Separated System
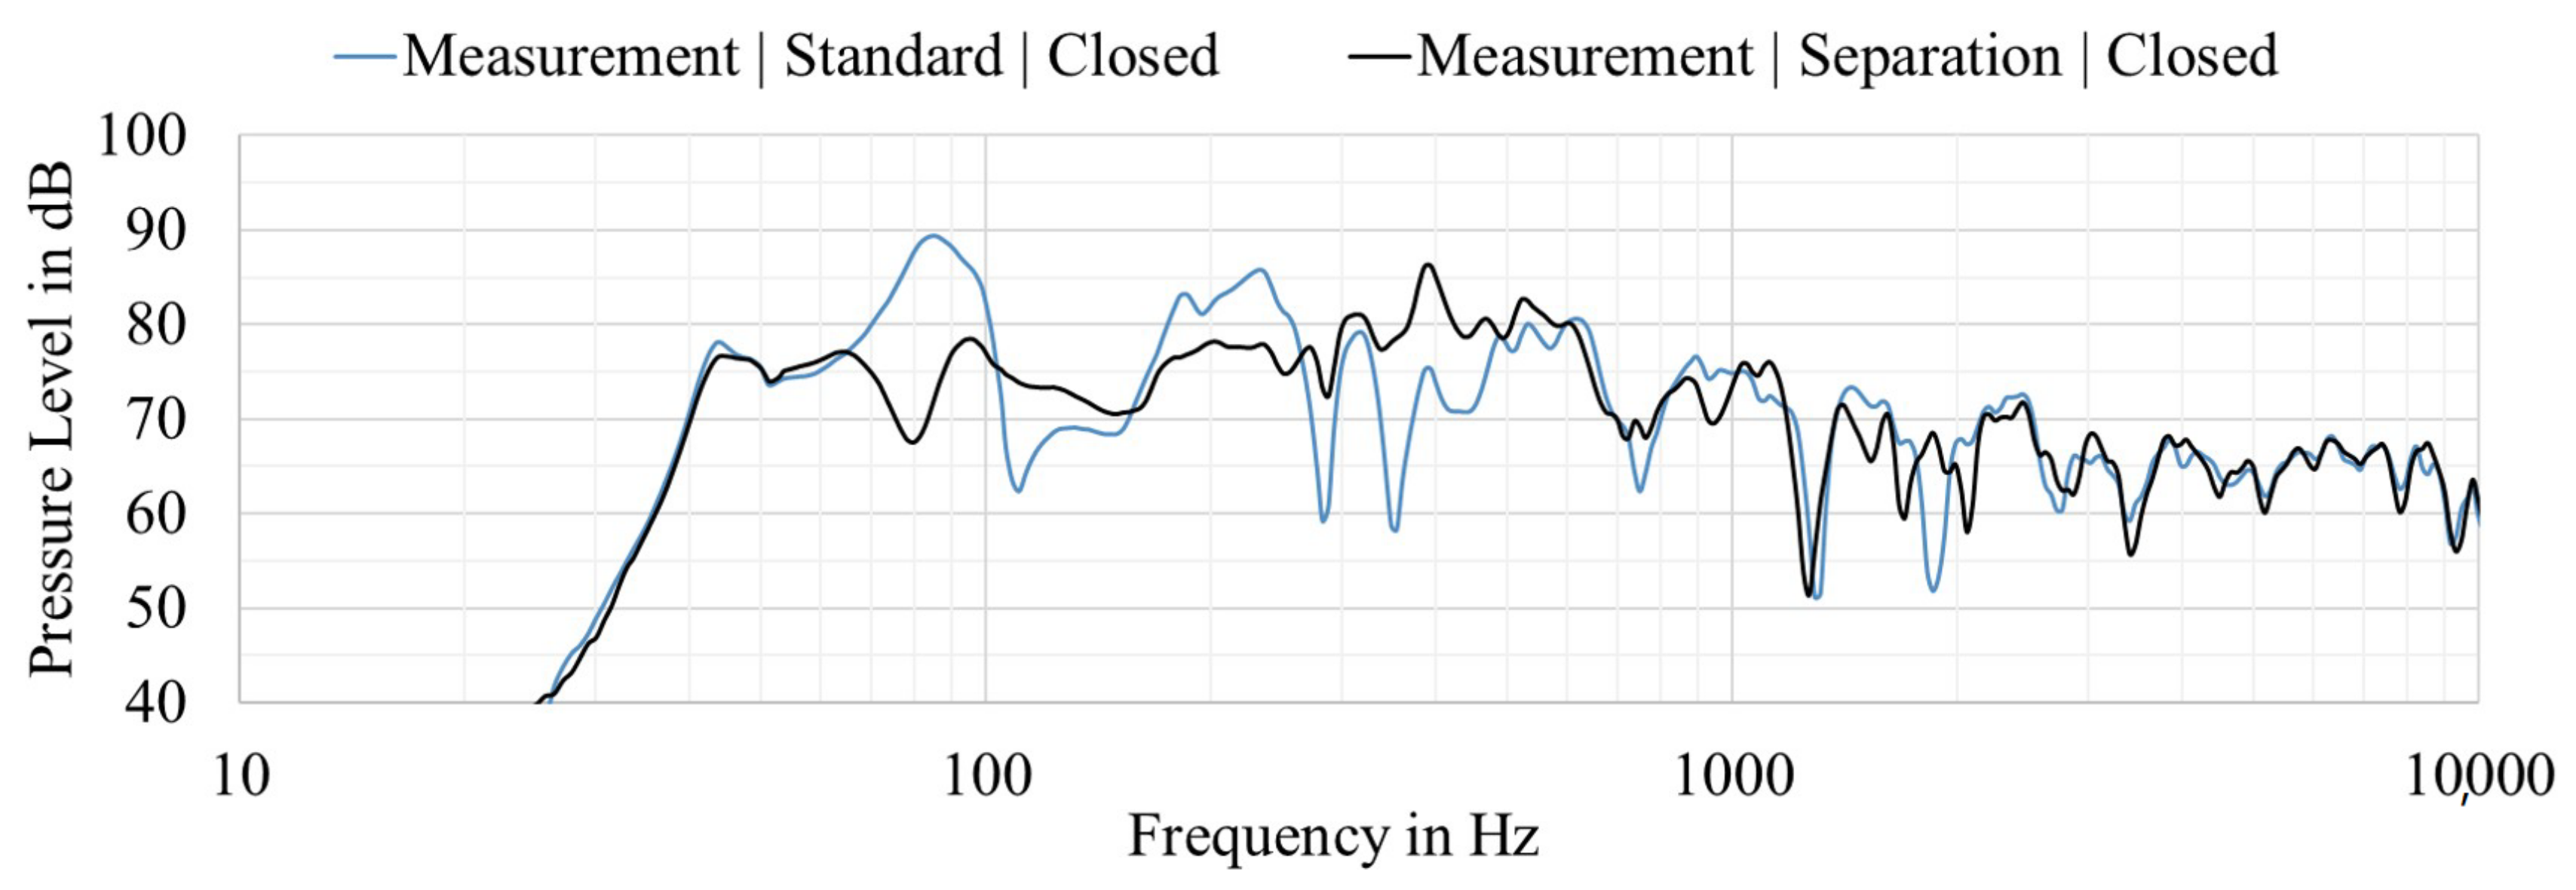
Figure 9 illustrates the measured frequency responses of the standard construction and the configuration with the separation plate. The influence of the separation plate is large at lower frequencies and decreases with increasing frequency. The transfer function is affected by the separation plate up to 600 Hz. At higher frequencies, the difference can be neglected since the displacement and the volume change decrease. By stiffening the panel through the air spring effect, the frequency response can be significantly smoothed. In particular, the broadband dips at 100–160 and 300–500 Hz as well as the peaks at 65–100 and 160–260 Hz are attenuated. In addition, small dips at 290 and 340 Hz are also eliminated. Moreover, the lower frequency limit and the edge steepness remain unchanged. The design with a separation plate or with an irregular shaped enclosure enables a much flatter frequency response in comparison to the standard system in the low-frequency range until 600 Hz. It is important to note that only on-axis measurements are compared. Due to the large wavelength, the directivity index is close to zero and very homogeneous. For this reason, the changes of the separation plate can be described by on-axis measurement only and different angles do not need to be considered.
4.3. Simulation Model to Represent the Modal Related Air Compliance
The numerical simulation model is very similar to the introduced model in
Section 1. The exciter and panel properties remain unchanged. The separation plate changes the shape of the original FEA subsystem. For the discretization of the air volume with finite elements, the local mesh size was reduced to ensure that the FEA subsystem’s narrow part was meshed with at least three elements in thickness direction. Furthermore, TET10 elements were used to reduce artificial stiffening effects.
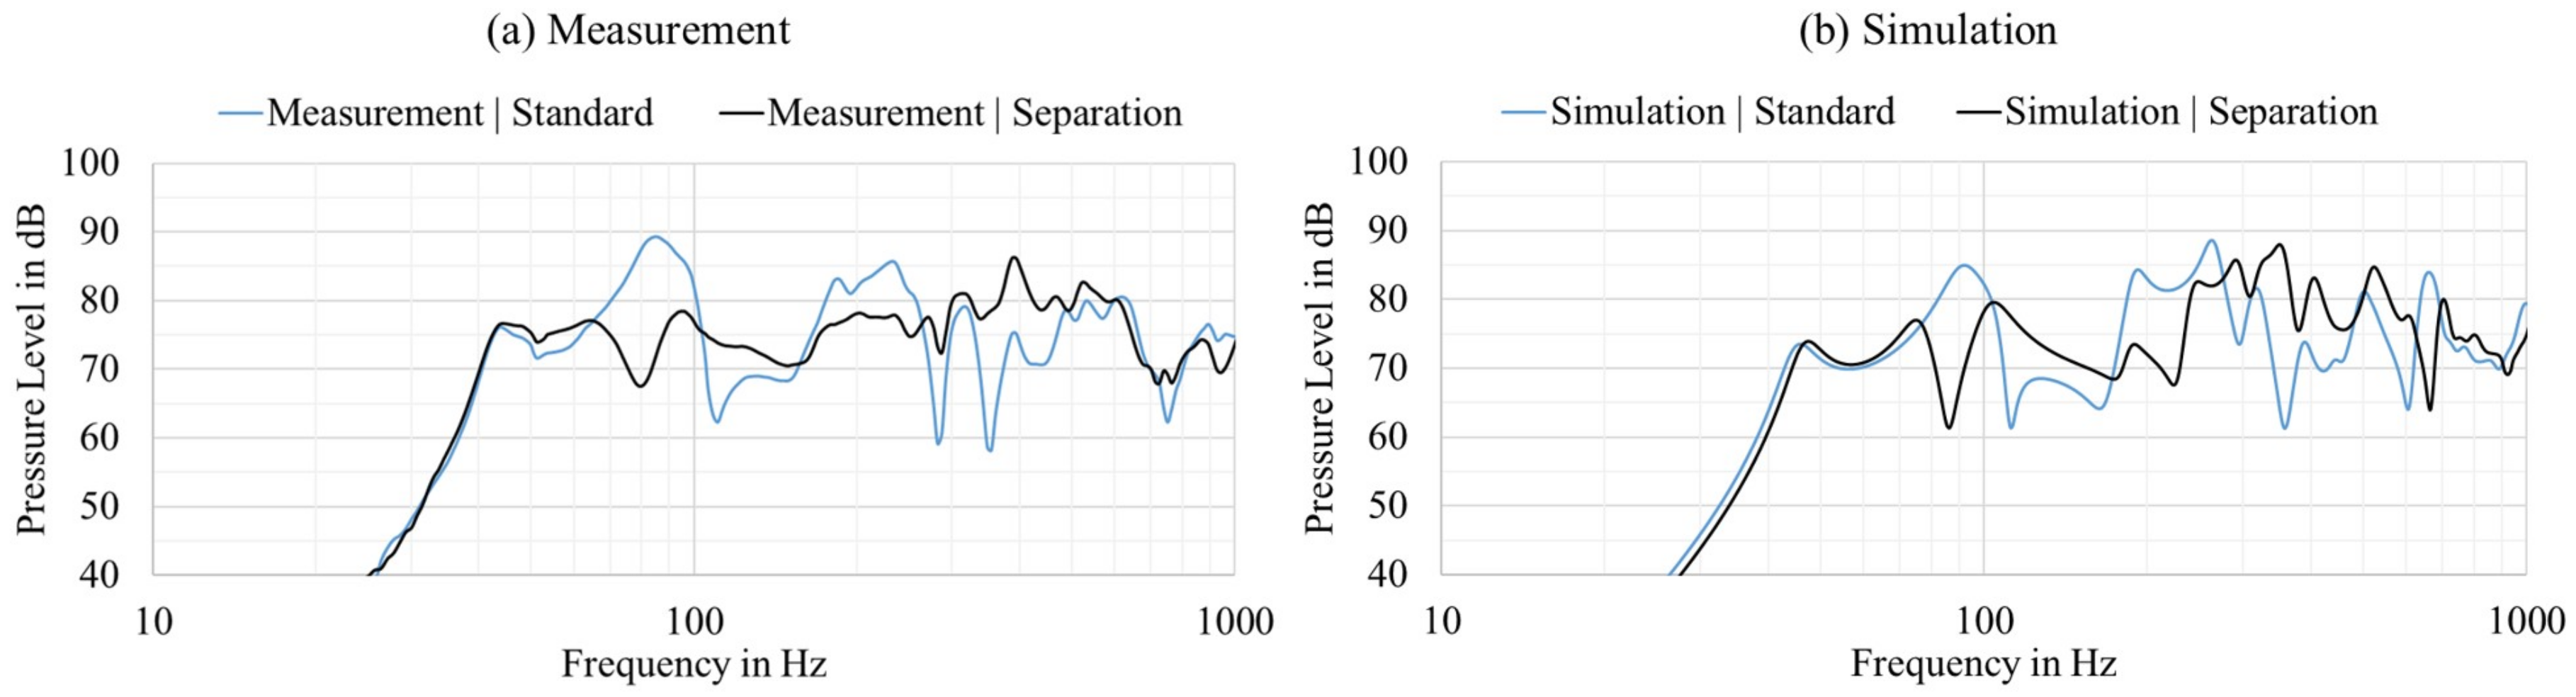
Figure 10 presents the measured and simulated pressure levels at a 1 m distance with 2.83 Vrms input. The calculated average TFE, in the frequency range from 20 Hz to 1000 Hz, is −10.25 dB. Therefore, a sufficient fit of the simulation model and the measured result is presented. The simulation model can predict the separation plate’s influence as the curve shape and pressure levels correlate.
However, deviations regarding the resonance peaks can be detected, caused by slightly imprecise damping properties. There is a low impact below the exciter’s resonance frequency. The standard and separation construction behave similarly. Furthermore, a dip at 80 Hz caused by the separation plate becomes visible, which is slightly steeper than the simulation model compared to the real prototype. The next important frequency band is above 100 Hz, where the standard construction shows the dip caused by anti-phase components and the separation plate construction results in a higher sound pressure level. The simulation model will verify this effect. Other effects, such as the lower level of the separation plate from 200 to 300 Hz and the higher-level from 300 to 500 Hz, can be seen clearly. Therefore, the simulation model is sufficiently accurate to analyze the construction influence of the separation plate in detail in the next subsection. Furthermore, this model can be used as a basis for the optimization loop presented in
Section 4.
4.4. Visualization of the Panel Displacement and the Chamber Pressure
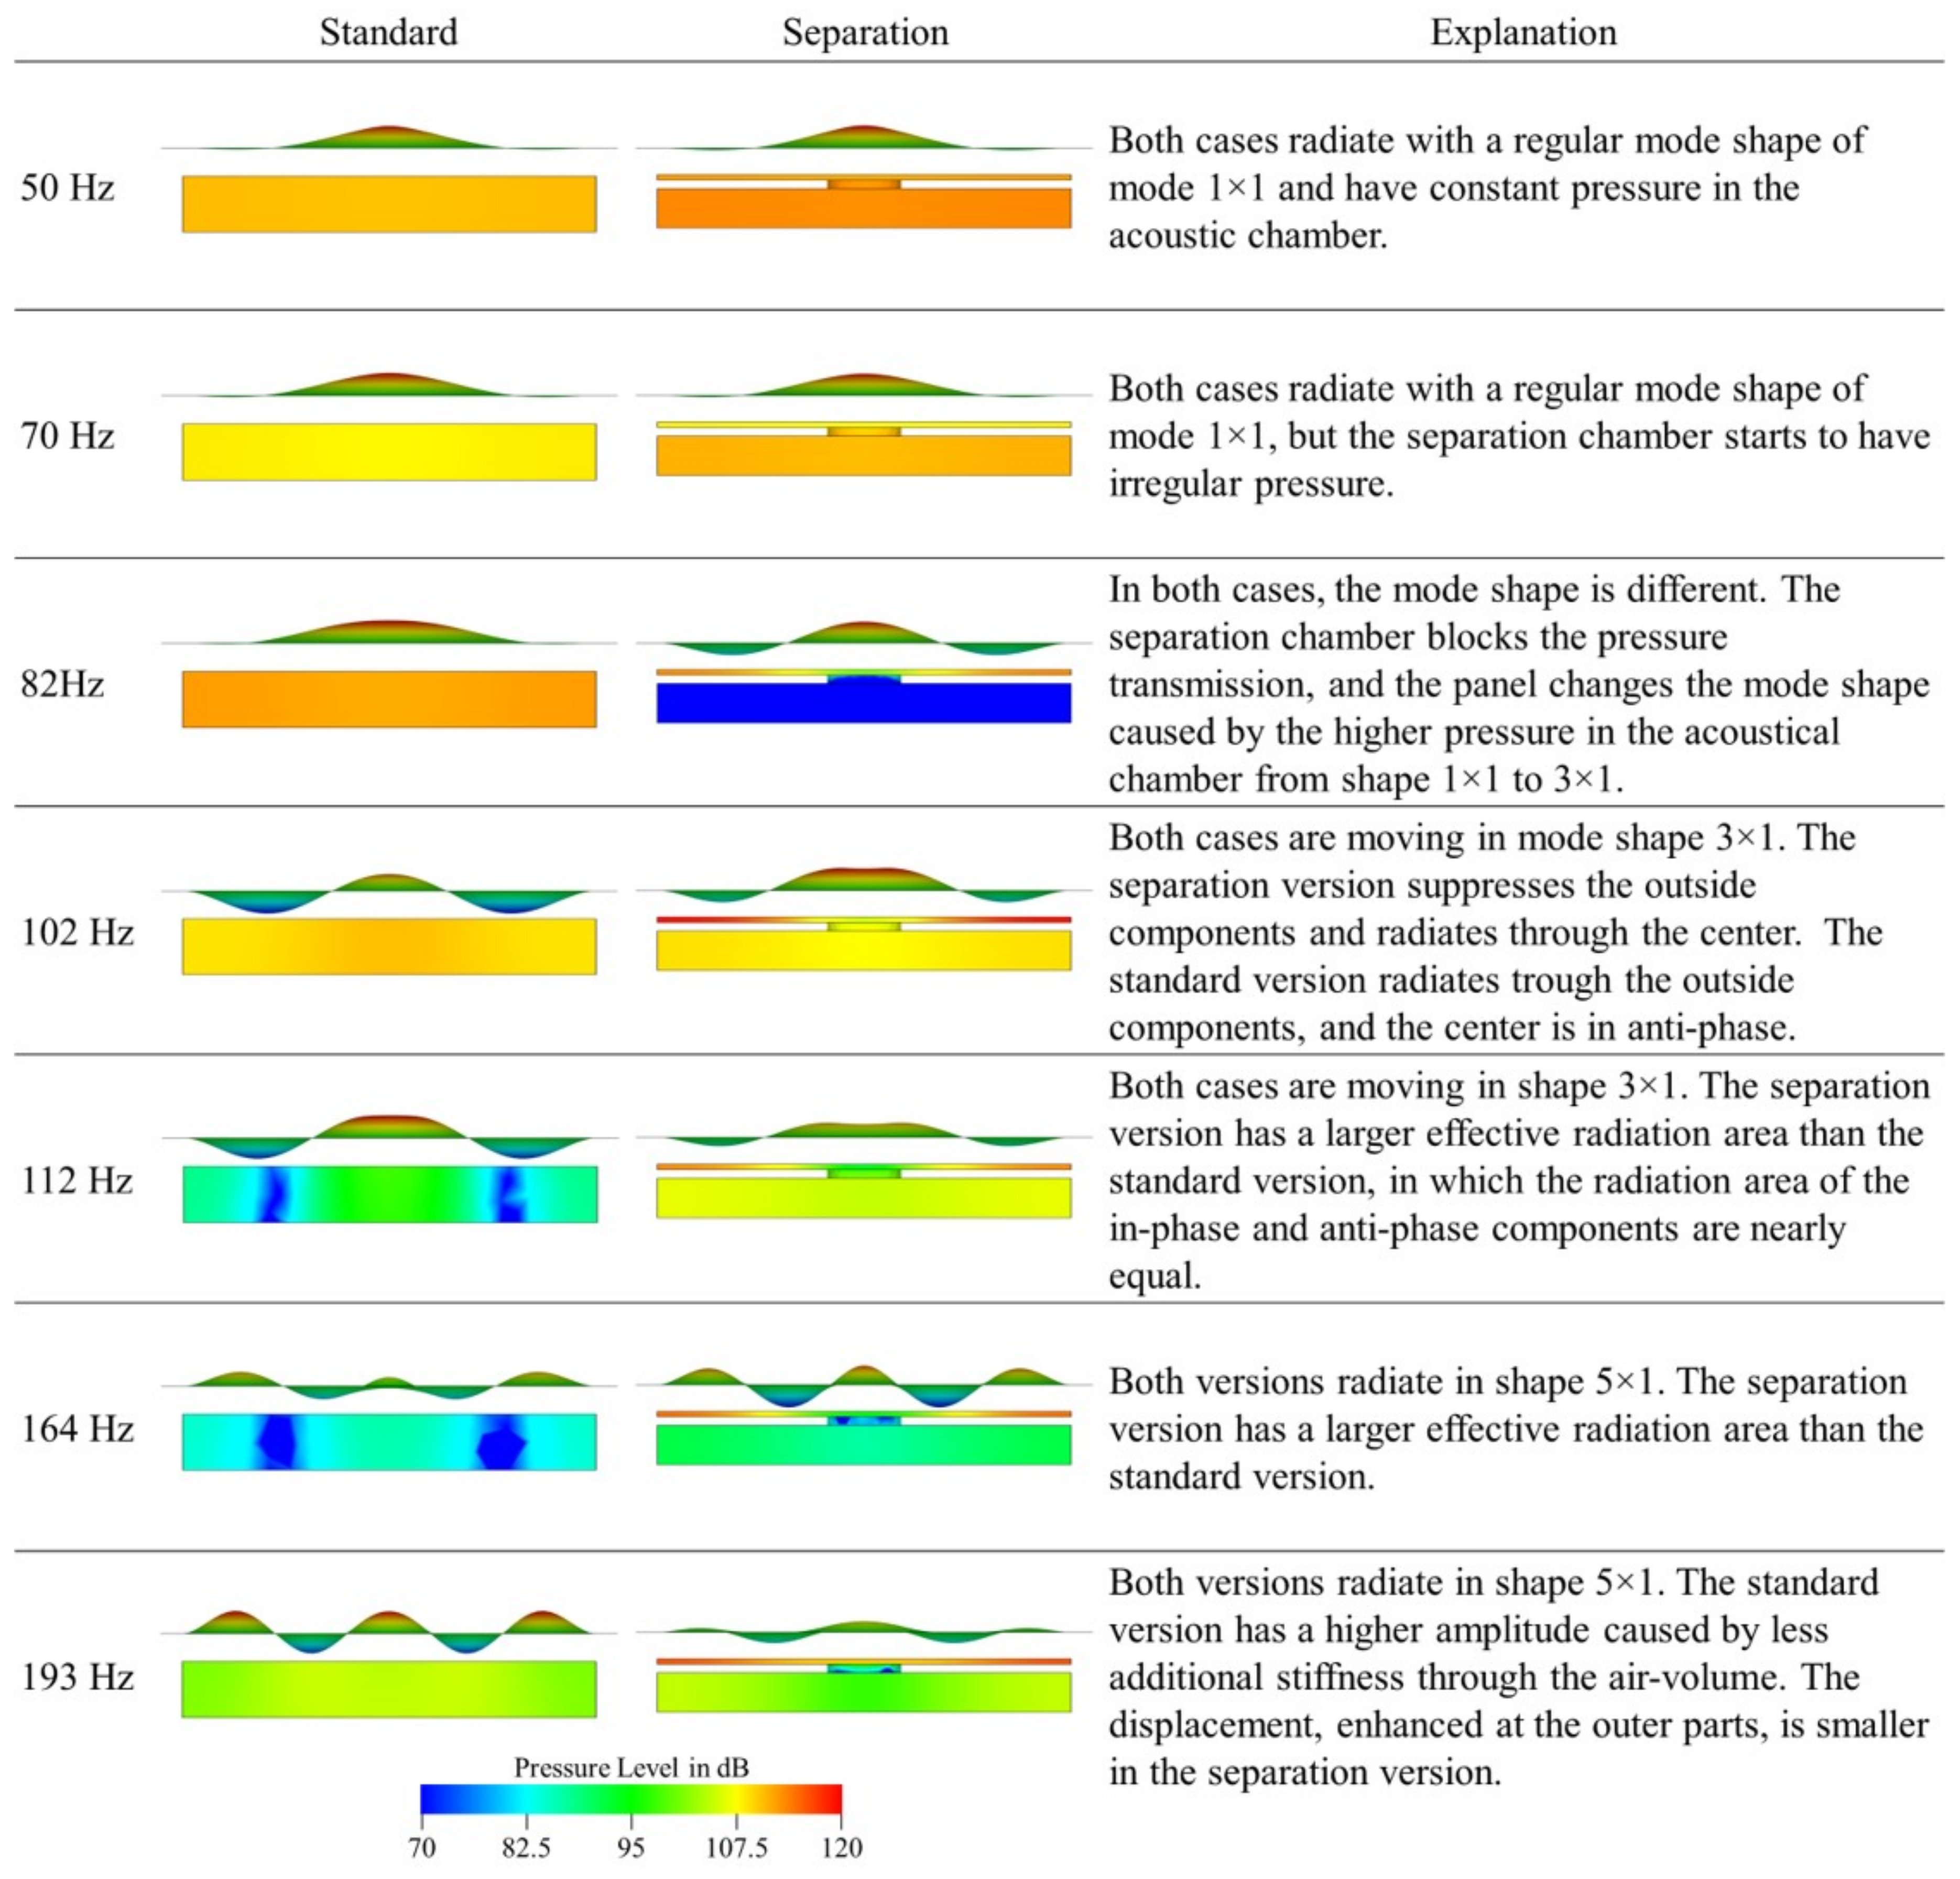
Figure 11 visualizes the panel displacement and the pressure in the acoustic chamber of the standard version against the separation version.
Figure 11 shows another advantage of the simulation tools by visualizing the internal pressure, which is nearly impossible to measure with a sufficient resolution. The impact of modal-related air stiffening can be seen. At low frequencies, the pressure in the acoustic chamber is nearly constant, as in the standard version. By increasing the frequency, the front chamber pressure increases compared to the pressure in the back chamber. Furthermore, the pressure distribution is not homogeneous. Close to the edges, the internal pressure is higher than the pressure in the center. This allows a higher panel center movement compared to the panel edges, which minimizes the acoustic cancellation caused by anti-phase components. The acoustic stiffening’s influence decreases to higher frequencies as the panel’s displacement decreases and the pressure change in the rear volume decreases.
4.5. Modal and Sound Pressure Related Decomposition of Optimized Construction
Figure 12 illustrates the modal-related decomposition and the sound pressure-related decomposition of the model with a separation plate. This shows the individual modal stiffening through the air compliance.
is clearly suppressed compared to
, which is visible in fewer levels of
and fewer anti-phase components. The number of in-phase components is not larger than that in the standard version. However, the reduced amount of anti-phase components increases the resulting sound pressure. In this case, the system works very well because dips and low-level areas are amplified and peaks are minimized. A detailed analysis is performed below, where the response is divided into five frequency areas. At very low and high frequencies, in Areas I and IV/V, respectively, the acoustic performances of both configurations are very similar. At low frequencies, the sound radiation is dominated by
, which is not influenced by the additional air stiffness. In the upper frequency range, higher order modes with lower amplitude occur and in the influence of the separation plate is negligible. The standard construction has a significant dip between 100 and 200 Hz due to the reversed phase behavior of
and
. Because of the separation plate
is shifted in phase at a lower frequency, the proportion of the anti-phase component in the overall sound pressure is reduced. Consequently, the frequency response of the standard configuration is smoothed by using an additional modal air stiffness. The same working principle is responsible for smoothing the transfer function up to approximately 500 Hz. Due to the modal stiffness of the additional air volume, certain modes are suppressed, which either leads to dips or peaks in the frequency response. A detailed analysis is performed below.
Area I (20–70 Hz): In the lower frequency range, and predominantly contribute to the overall performance. Furthermore, the is almost identical to the ; consequently, the radiation is nearly ideal. The sound pressure response of all modes is lower than the response of , as there are anti-phase components evoked by .
Area II (70–90 Hz): This band shows a significant dip at 80 Hz. and contribute nearly equally, which increases the anti-phase components .
Area III (90–170 Hz): This band shows the large difference between separation and standard construction. The sound pressure response of all modes is below the pressure response of the single . relates to anti-phase components. However, the significant change is the pressure difference of the in-phase components and the anti-phase components , which is approximately 5 dB or more. Even with a lower total displacement of the panel, the sound pressure can be higher due to the reduced amount of anti-phase components. This results in a flatter response compared to the standard construction with higher sensitivity.
Area IV (170–220 Hz): This band shows substantially high movement of the panel with less output. This is a superposition of , , and . This results in high in-phase and high anti-phase components. The resulting pressure response is lower than that in Area III. In comparison to the standard construction, the deviation is reduced.
Area V (220–1000 Hz): This band shows a similar behavior compared to the standard construction. The influence of the separation plate decreases. The increases to higher frequencies, but the decreases. This is caused by the nearly similar amounts of in-phase and anti-phase components. This ends up in a smaller radiating surface area, even if more motion occurs.
5. Optimization Based on Geometrical Variations
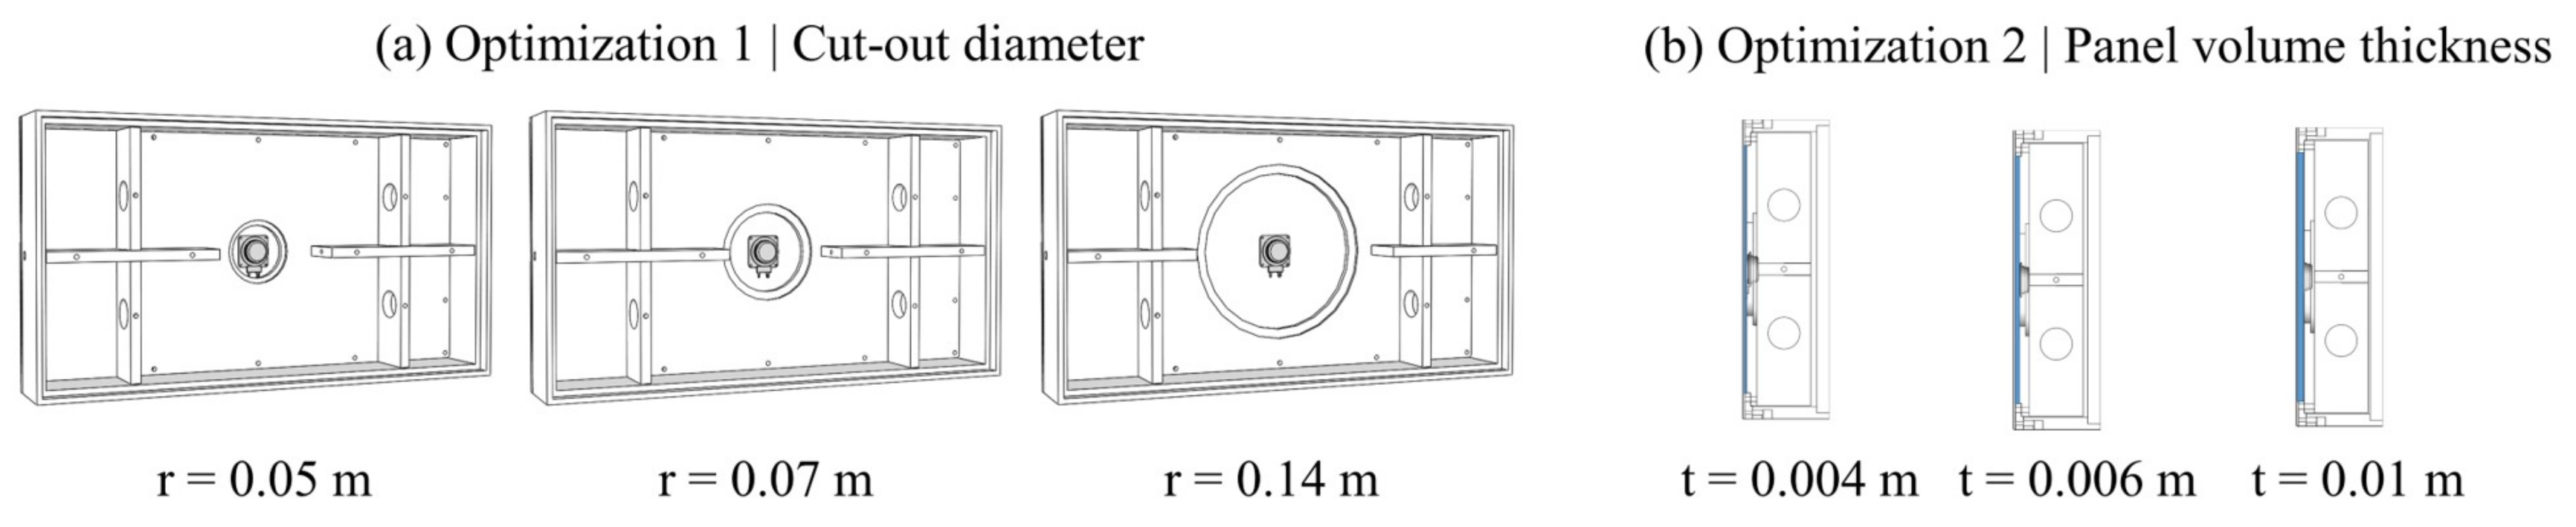
The last sections introduce the improvement of the frequency response due to the modal related air compliance. This is only one example for a potential solution. The following section presents the influence changes of the irregular enclosure shape and shows further improvements by optimizing the cut-out diameter and the thickness of the panel volume as shown in
Figure 13. Therefore, the panel volume as well as the size of the cut-out diameter are changed and analyzed with real prototypes in the first step. Furthermore, both parameters vary in an optimization algorithm to find an optimum panel volume and the cut-out diameter.
5.1. Variation of the Cut-Out Radius
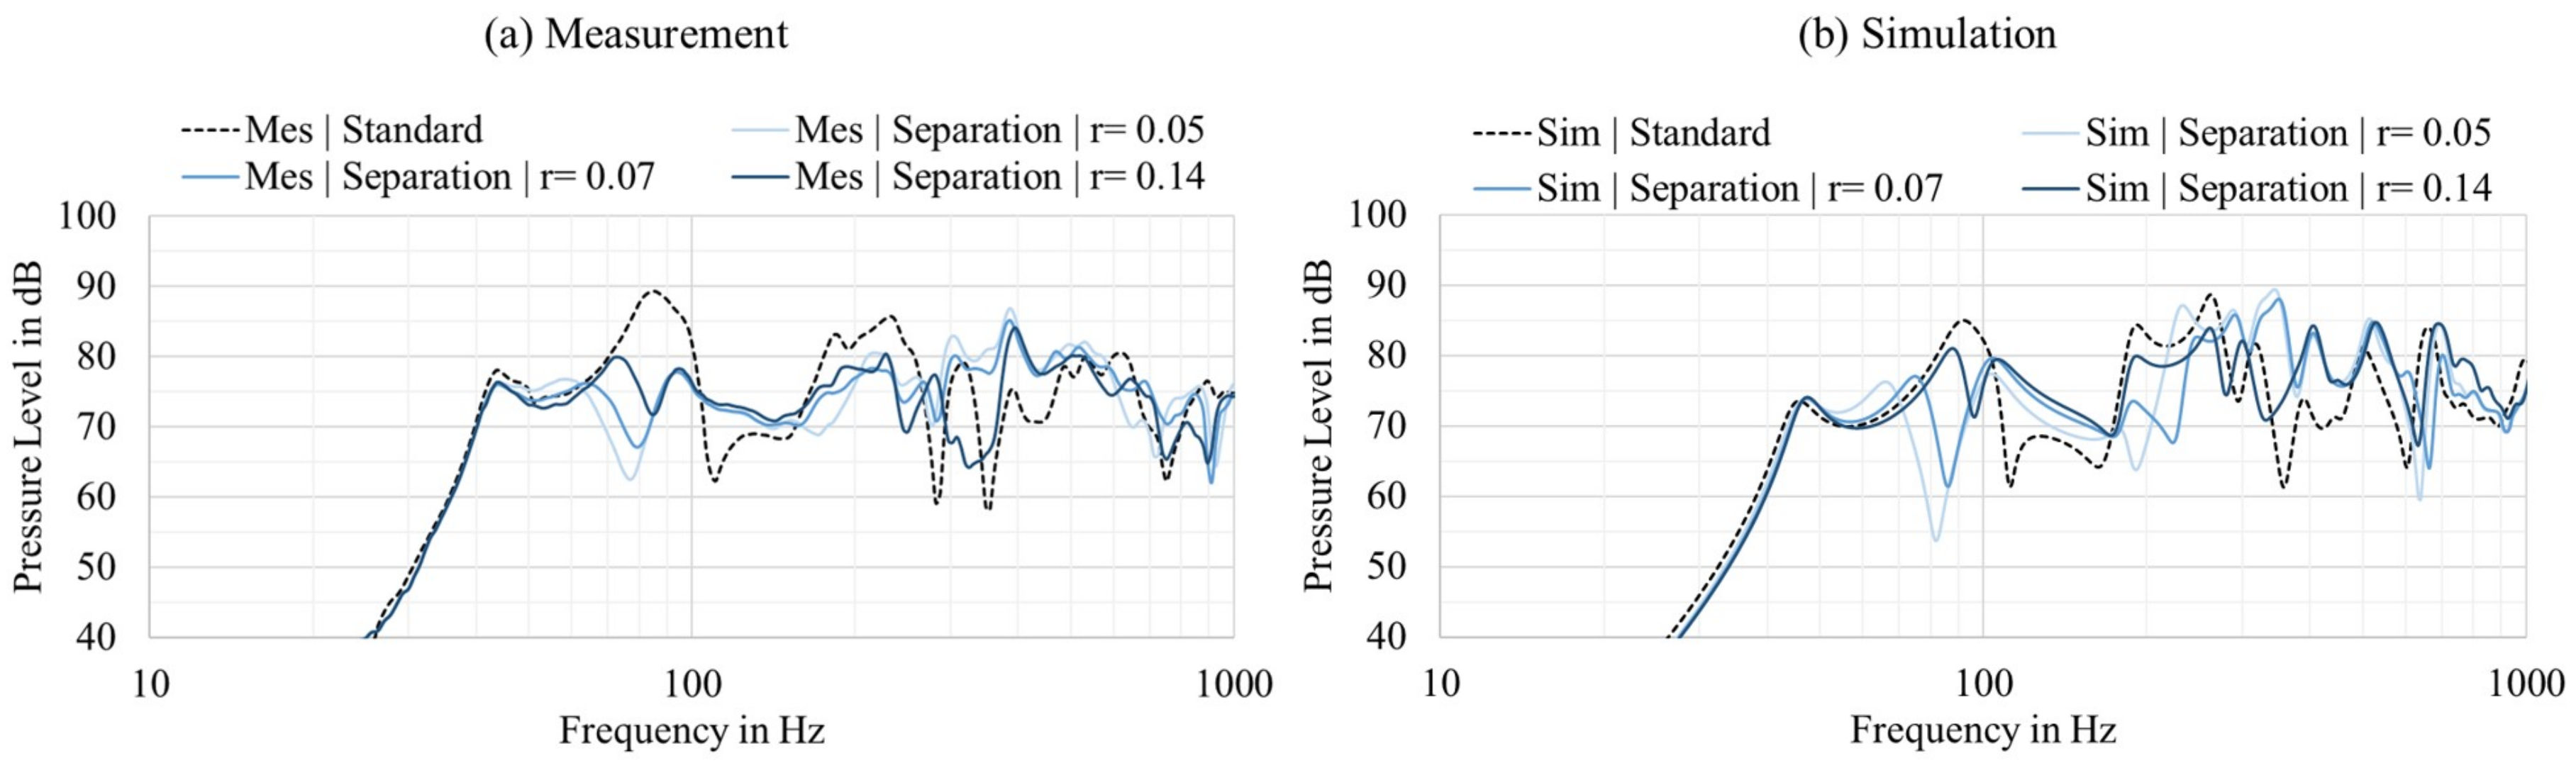
This diameter variation changes the coupling of the two air springs, which are connected in series. In
Figure 14, the measured (
Figure 14a) and simulated (
Figure 14b) transfer functions of the flat panel loudspeaker with different opening diameters are illustrated. Both simulation and experimental data are shown to indicate that the numerical model can predict the system’s behavior. In general, the simulation can reproduce the physical changes. Regardless of the hole size, the frequency response can be improved compared to the standard configuration, as both the broadband superelevation at 60–100 Hz and the dip at 100–160 Hz can be smoothed. However, the quality of correction depends on the diameter of the hole. If the cut-out diameter is chosen to be too large, then the behavior approaches that of the standard system. In contrast, a tiny centered hole partially stiffens the system too much, leading to dips in the frequency response. In the present case, a centered hole with a radius of 0.14 m provides the flattest transfer function.
5.2. Variation in the Panel Volume Thickness
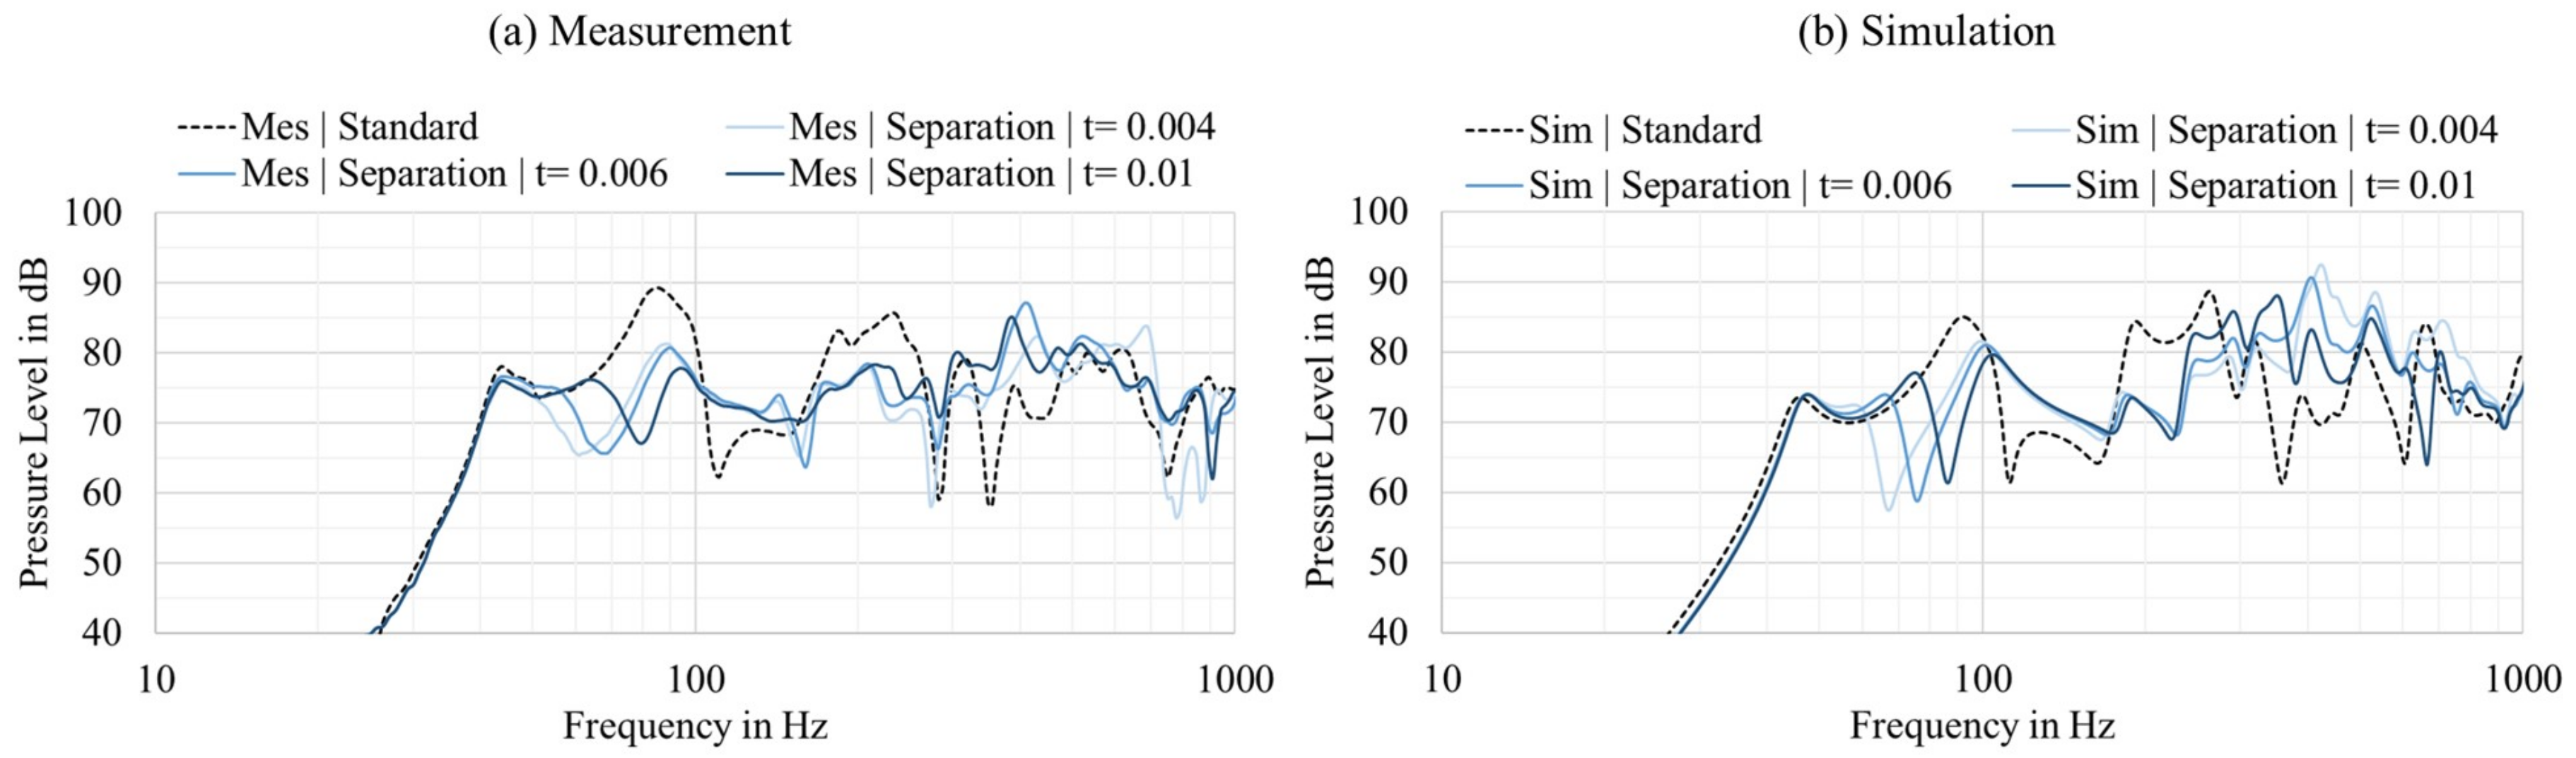
In a second optimization step, the thickness of the paneled volume and the air spring stiffness of that volume are varied.
Figure 15 shows the influence of the thickness of the paneled volume on the frequency response for the measurement (
Figure 15a) and simulation (
Figure 15b) results. It can be derived that the simulation can sufficiently predict the influence of the paneled volume. There is a difference in the dip shapes, but all cases are on the same order and behave similarly to that of the standard construction. The system behavior is not affected at low frequencies due to a thickness variation in the paneled volume. The significant dips are shifted on the frequency axis. The influence decreases at higher frequencies, as the stiffness properties are predominantly relevant for the lower frequency range. The thickness variation is more complex when determining an optimum compared to the variation in the cut-out diameter. Considering the measurement data, a panel volume with a thickness of 10 mm seems to provide the flattest frequency response. To better compare the frequency responses, an optimization parameter is introduced in the next subsection.
5.3. Optimization Based on the Radius and Thickness
The results in the last subsections visualize the complexity to optimize this problem. The simulation results are sufficiently accurate compared to the real measurements. Therefore, the simulation can be used to find an optimum for this multidimensional problem.
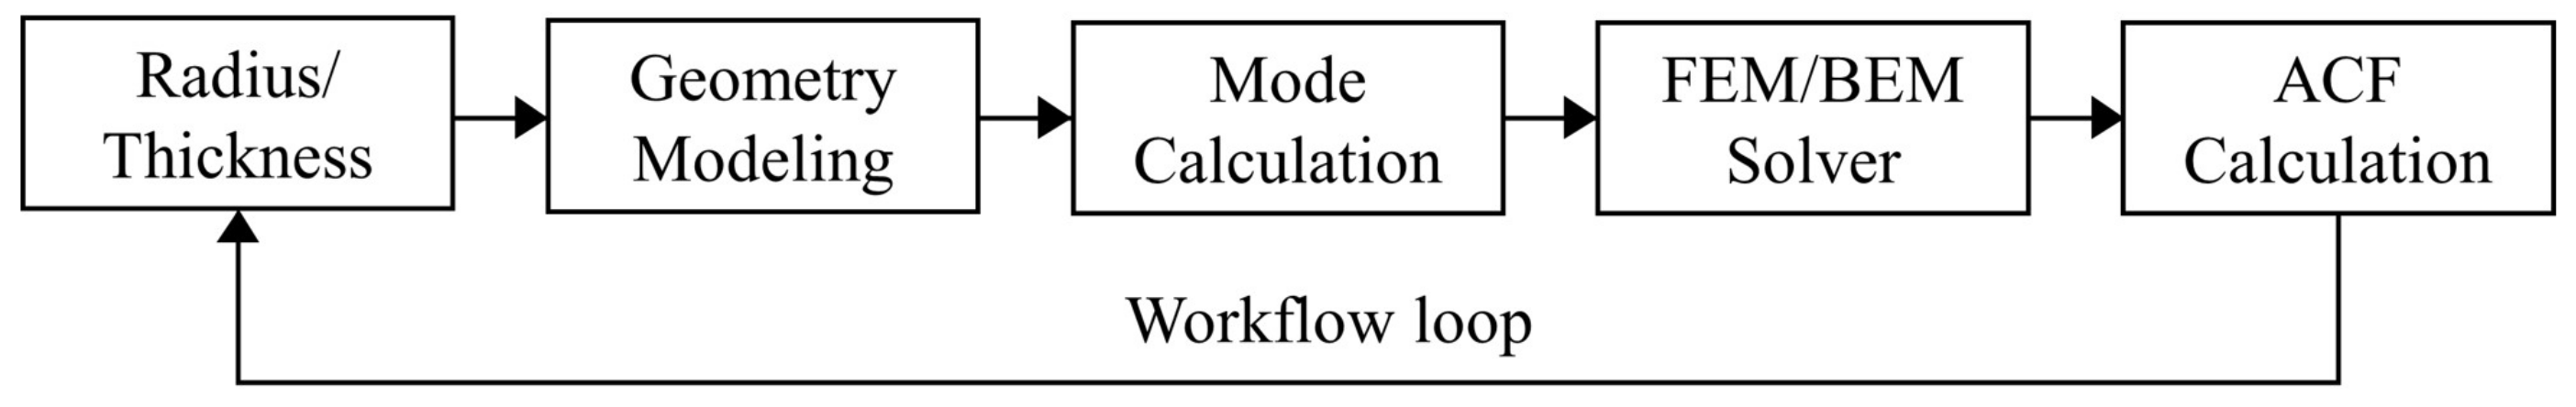
Figure 16 visualizes the optimization loop. The two parameters of the radius
r and panel volume thickness
t are varied in an automated loop scripted in Python to optimize this multidimensional problem. Consequently, the geometry was created and meshed for all desired configurations of
r and
t, and afterward the numerical model was solved.
The frequency responses for all parameter combinations of
r and
t were calculated, and the optimum must now be identified with a suitable criterion. The ACF (amplitude correction factor) is a suitable assessment tool, as it takes into account both the mean sensitivity and the flatness of the response [
7]. The ACF
is not only a standard deviation for the transfer function, as it references the maximum sensitivity value
of the result matrix. A lower ACF corresponds to less needed correction to achieve a flat response with high sensitivity. The ACF value as well as the maximum sensitivity are determined for a frequency range of 50–500 Hz. It is calculated with Equation (
3):
The mean value
m of the averaged pressure level
is calculated by the mean of the squares of the sound pressure of each band
k in the chosen frequency range from 50 to 500 Hz. The pressure
is logarithmically reduced to K steps with a resolution of 40 points per octave. The
represents the maximum value of all mean sensitivity values
of each combination of
r and
t.The mean pressure values are calculated with Equations (
4) and (
5):
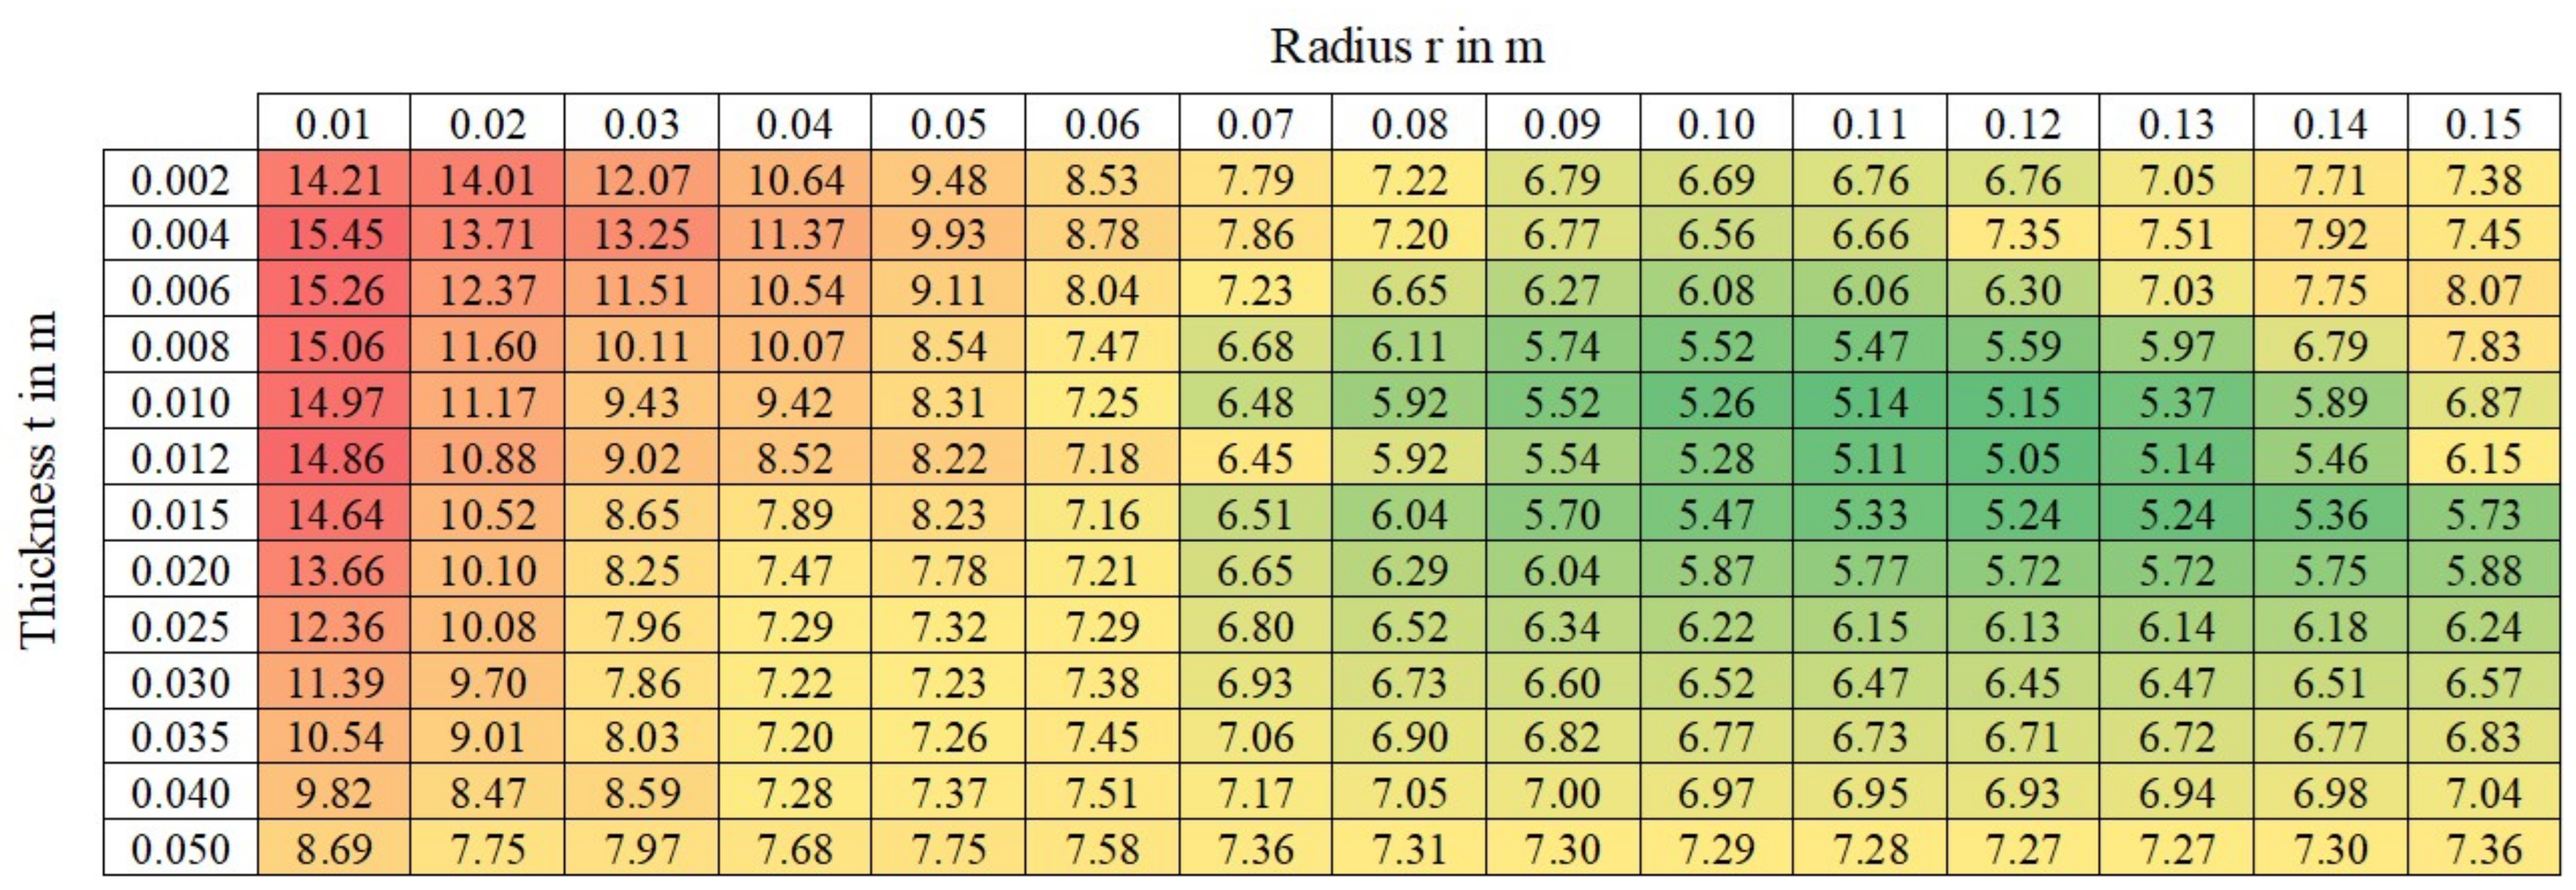
An overview of the calculated ACF values for all simulated configurations is shown in
Figure 17. It can be deduced that a clear optimum is emerging for this problem with an ACF of 5.05. The radius of the cut-out should be 0.12 m and the thickness of the panel volume should be 0.012 m. The optimization result confirms the conclusions of
Section 4.1 and
Section 4.2; consequently, a diameter and panel volume thickness larger than in the standard configuration increase the sound pressure level by 80 Hz and minimize the dip below 100 Hz.
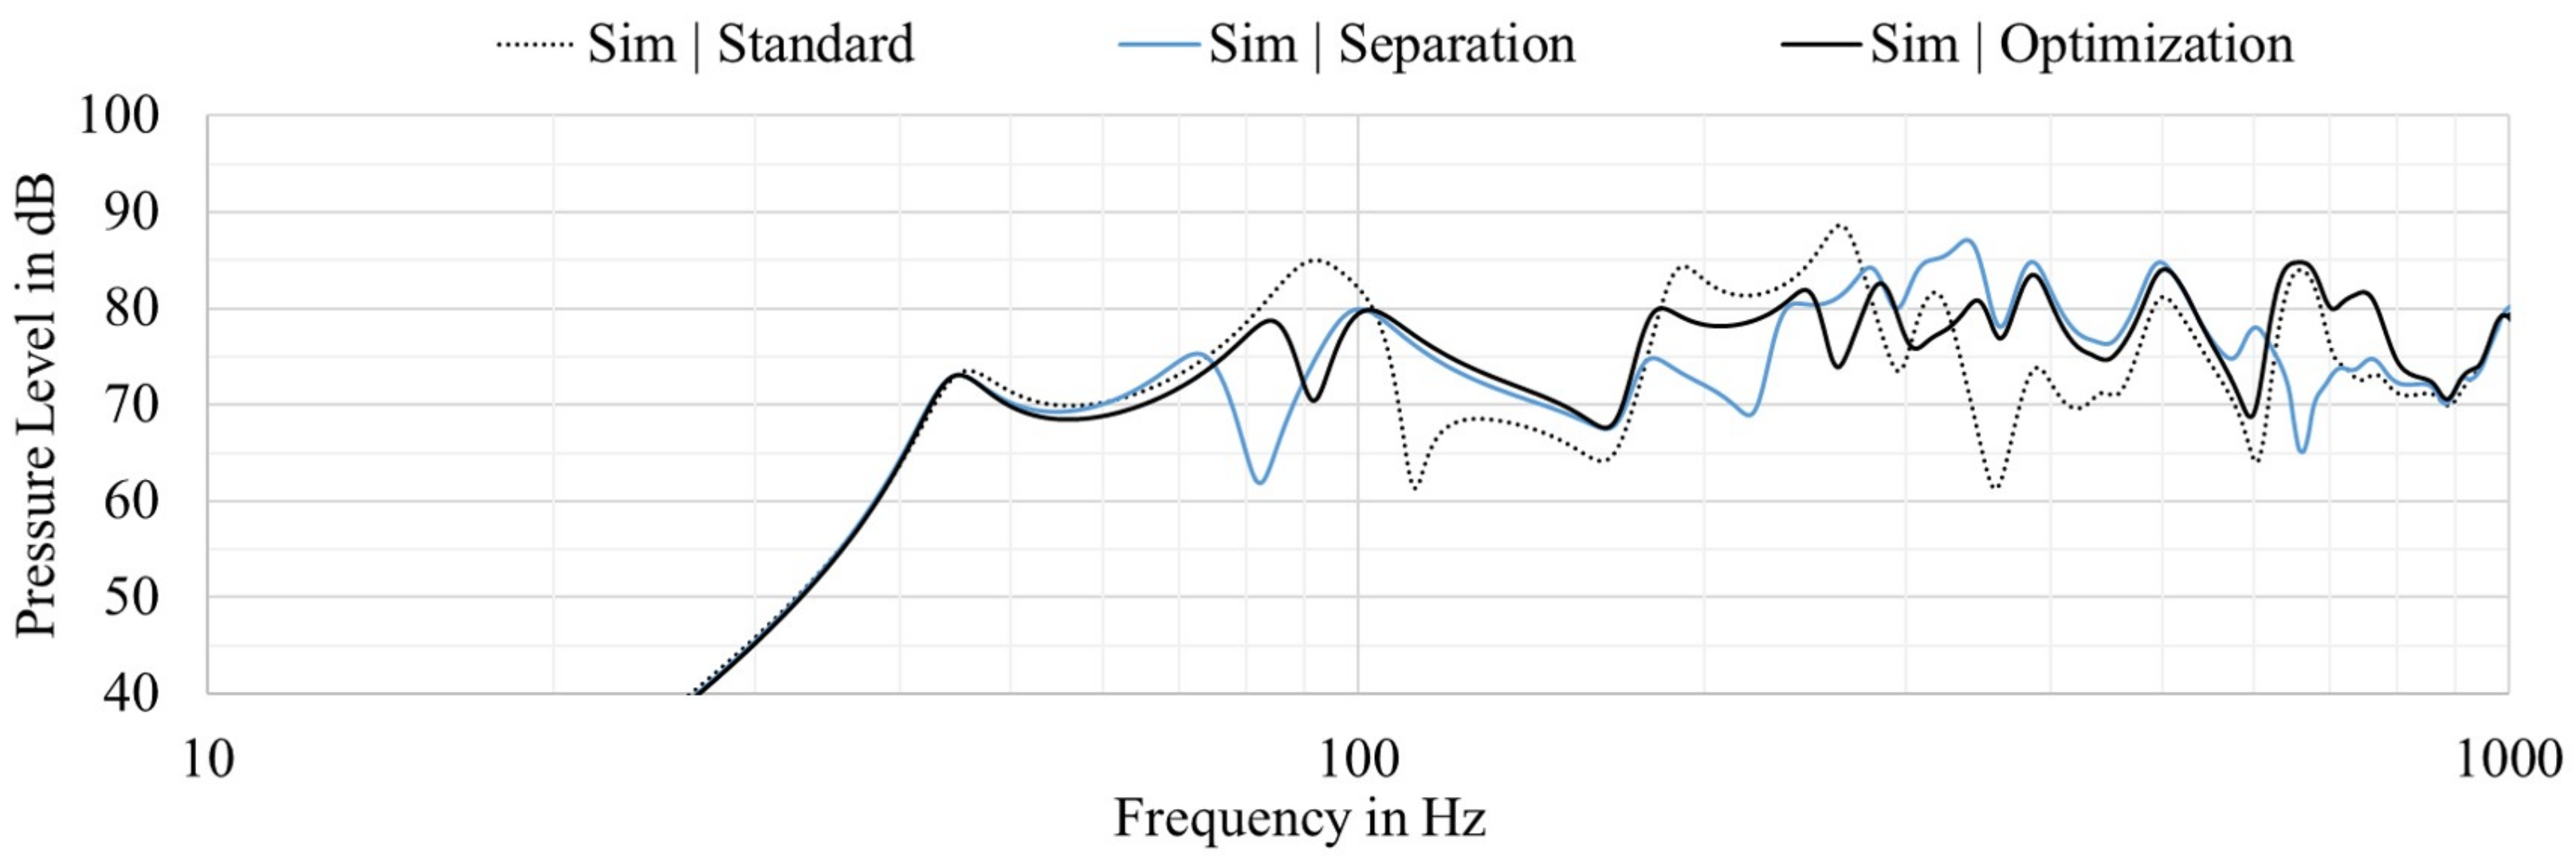
In
Figure 18, the frequency responses of the standard configuration, the configuration with a separation plate and the optimized parameters are illustrated. It is evident that the optimization procedure achieves an even smoother frequency response. In the improved configuration, the dips at 80 and 300–350 Hz are suppressed, and, at the same time, the sound pressure level is increased between 180 and 240 Hz. In addition, both the upper and lower cut-off frequencies are not affected. This example illustrates that the frequency response can be linearized in frequency ranges with a low modal density with a new control variable.
6. Summary
This paper introduces an alternative constructive approach to improve the frequency response of an exciter-driven flat-panel loudspeaker. The introduced modal-related air compliance is used to suppress modes with a high amount of anti-phase components. This is realized with a separation plate, which is mounted at a certain distance directly behind the panel to create an irregular shaped enclosure. The panel is stiffened due to the additional air spring caused by the paneled volume leading to a flatter transfer function. This design can also be used for existing flat panel loudspeakers with an open backside.
This concept is developed based on the modal and sound pressure-related decomposition results. The numerical results were verified with a real adaptable prototype, which shows a sufficient fit. It could be shown that dips in the frequency response are not necessarily caused by a lack of kinetic energy in the panel, rather by high anti-phase components. These anti-phase components minimize the acoustic output, although the panel has considerable movement.
Based on these results, a design for the separation plate is introduced, which provides additional stiffening for the anti-phase components caused by Mode 3. The separation plate design smooths the frequency response. The influence is large at lower frequencies, and changes decrease with increasing frequency. Above 500 Hz, nearly no changes are detectable, which is caused by the decreasing displacement and pressure change at higher frequencies. Furthermore, a numerical simulation model is developed to analyze the system’s behavior. Modal-dependent air stiffening reduces anti-phase components, which minimizes dips and peaks in the frequency response. In the last section, the cut-out diameter and the thickness of the paneled volume are varied to achieve an optimal frequency response. With the help of simulation tools, an optimum irregular enclosure shaped, based on thickness and cut-out diameter variation, can be presented.
The prospective impact on the temporal behavior should also be mentioned. Due to the strong suppression of peaks due to the irregular shaped enclosure, the temporal behavior of the loudspeaker is also improved and the transient response is shorter. As a result, this system can also be used to improve the temporal behavior. This has to be investigated in further experiments and the efficiency for various configurations has to be confirmed.
This work is to be seen as the basis for a new design method of an irregular shaped enclosure. This paper presents a significantly smoothed frequency response by a constructive approach that changes the modal structure of the system without modifying the panel. It is advised to investigate this research topic further. Very important points are the limits of this system and the versatility of its applicability. Therefore it is recommended to analyze the system for other flat panel loudspeakers (with different sizes, different panels or ratios) and to analyze the achievable optimizations. However, the geometrical properties need to be adapted according to the present system. Therefore, the design of the separation plate has to be designed for each case individually. The presented workflow can be used to minimize the anti-phase components of individual systems.
Author Contributions
Conceptualization, B.Z. and R.S.; methodology, B.Z. and R.S.; software, B.Z.; validation, B.Z. and R.S.; formal analysis, B.Z. and S.M.; investigation, B.Z. and R.S.; resources, M.E.A.; data curation, B.Z.; writing—original draft preparation, B.Z., R.S and S.M.; writing—review and editing, B.Z., S.M and M.E.A; visualization, B.Z.; and supervision, S.M. and M.E.A. All authors have read and agreed to the published version of the manuscript.
Funding
This research received no external funding.
Conflicts of Interest
The authors declare no conflict of interest.
Abbreviations
The following abbreviations are used in this manuscript:
| AAL | Accumulated Acceleration Level |
| ACF | Amplitude Correction Factor |
| BEM | Boundary Element Method |
| CQUAD8 | Second order isoparametric shell quadrangle with 4 nodes associated with the vertices and 4 with the edges |
| FE | Finite Element |
| FEA | Finite Element Acoustics |
| FEM | Finite Element Mechanical |
| NFS | Near Field Scanner |
| SPL | Sound Pressure Level |
| TET10 | 10-node second order isoparametric tetrahedral element with 4 nodes associated with the vertices and 6 with the edges |
| TFE | Total Fitting Error |
| TRIA6 | 6-node second order triangle element with 3 nodes associated with the vertices and 3 with the edges |
References
- Zenker, B.; Merchel, S.; Altinsoy, M.E. Rethinking Flat Panel Loudspeakers—An Objective Acoustic Comparison of Different Speaker Categories; Audio Engineering Society Convention; Technical University Dresden: Dresden, Germany, 2019. [Google Scholar]
- Bank, G.; Harris, N. The Distributed Mode Loudspeaker-Theory and Practice. In Proceedings of the UK 13th Conference: Microphones & Loudspeakers, Huntingdon, UK, 1 March 1998. [Google Scholar]
- Klippel, W. Green Speaker Design (Part 1: Optimal Use of System Resources); Audio Engineering Society Convention 146; Klippel GmbH: Dresden, Germany, 2019. [Google Scholar]
- Toole, F.E. Loudspeaker Measurements and Their Relationship to Listener Preferences: Part 1. J. Audio Eng. Soc. 1986, 34, 227–235. [Google Scholar]
- Klippel, W. Assessing the Subjectively Perceived Loudspeaker Quality on the Basis of Objective Parameters. In Proceedings of the 88th Convebtuion, Montreux, Switzerland, 13–16 March 1990. [Google Scholar]
- Olive, S.E. A Multiple Regression Model for Predicting Loudspeaker Preference Using Objective Measurements: Part II—Development of the Model; Audio Engineering Society Convention 117; Harman International Industries, Inc.: Northridge, CA, USA, 2004. [Google Scholar]
- Zenker, B.; Merchel, S.; Altinsoy, M.E. Optimized Exciter Positioning Based on Acoustic Power of a Flat Panel Loudspeaker; Audio Engineering Society Convention 146; Technical University Dresden: Dresden, Germany, 2019. [Google Scholar]
- Borwick, J. Loudspeaker and Headphone Handbook, 3rd ed.; Focal Press: Oxford, UK, 2001. [Google Scholar]
- Prokofieva, E.; Horoshenkov, K.V.; Harris, N. The acoustic emission of a distributed mode loudspeaker near a porous layer. J. Acoust. Soc. Am. 2005, 111, 2665–2670. [Google Scholar] [CrossRef] [PubMed]
- Pueo, B.; Escolano, J.; López, J.J.; Bleda, S. Analysis of Edge Boundary Conditions on Multiactuator Panels. In Proceedings of the 123rd Convention, New York, NY, USA, 5–8 October 2007. [Google Scholar]
- McMillan, J.; Keane, A.J. Shifting resonances from a frequency band by applying concentrated masses to a thin rectangular plate. J. Sound Vib. 1996, 192, 549–562. [Google Scholar] [CrossRef][Green Version]
- Lu, G.; Shen, Y. Model optimization of orthotropic distributed-mode loudspeaker using attached masses. J. Acoust. Soc. Am. 2009, 126, 2294–2300. [Google Scholar] [CrossRef] [PubMed]
- Zenker, B.; Rawoof, S.S.A.; Merchel, S.; Altinsoy, M.E. Low Deviation and High Sensitivity—Optimized Exciter Positioning for Flat Panel Loudspeakers by Considering Averaged Sound Pressure Equalization; Audio Engineering Society Convention 147; Technical University Dresden: Dresden, Germany, 2019. [Google Scholar]
- Anderson, D.A.; Heilemann, M.C.; Bocko, M.F. Optimized Driver Placement for Array-Driven Flat-Panel Loudspeakers. Arch. Acoust. 2017, 42, 93–104. [Google Scholar] [CrossRef]
- Zenker, B.; Schurmann, R.; Merchel, S.; Altinsoy, M.E. Low Frequency Performance of a Woofer-Driven Flat Panel Loudspeaker (Part 1: Numerical System Analysis); Audio Engineering Society Convention 149; Chair of Acoustics and Haptic Engineering, Dresden University of Technology: Dresden, Germany, 2020. [Google Scholar]
- Azima, H.; Panzer, J.; Reynaga, D. Distributed-Mode Loudspeakers (DML) in Small Enclosures; Audio Engineering Society Convention 106; New Transducers Ltd.: Huntingdon, UK, 1999. [Google Scholar]
- Zenker, B.; Heinl, M.; Merchel, S.; Altinsoy, M.E. Low Frequency Performance of a Woofer-Driven Flat Panel Loudspeaker (Part 2: Numerical System Optimization and Large Signal Analysis); Audio Engineering Society Convention 149; Chair of Acoustics and Haptic Engineering, Dresden University of Technology: Dresden, Germany, 2020. [Google Scholar]
- Beer, D.; Jahr, M.; Reich, A.; Schuster, M. The Air Spring Effect of Flat Panel Speakers. In Proceedings of the 124th Convention, Amsterdam, The Netherlands, 17–20 May 2008. [Google Scholar]
- Wave6. Dassault Systemes SIMULIA Corporation; Version 2020.4. Available online: https://www.3ds.com/products-services/simulia/products/wave6/ (accessed on 14 December 2020).
- Marburg, S. Six boundary elements per wavelength: Is that enough? J. Comput. Acoust. 2002, 10, 25–51. [Google Scholar] [CrossRef]
- Klippel, W.; Bellmann, C. Holographic Nearfield Measurement of Loudspeaker Directivity; Audio Engineering Society Convention 141; Klippel GmbH: Dresden, Germany, 2016. [Google Scholar]
- Bright, A.P.; Jacobsen, F.; Polack, J.-D.; Rasmussen, K.B. Active Control of Loudspeakers: An Investigation of Practical Applications; Orsted·DTU, Acoustic Technology; Technical University of Denmark: Lyngby, Denmark, 2002. [Google Scholar]
- Klippel, W.; Schlechter, J. Measurement and Visualization of Loudspeaker Cone Vibration; Audio Engineering Society Convention 121; Klippel GmbH: Dresden, Germany, 2006. [Google Scholar]
Figure 1.
Measured result of a standard flat panel loudspeaker prototype with high deviations in the frequency response at a 1 m distance with 2.83 Vrms input.
Figure 1.
Measured result of a standard flat panel loudspeaker prototype with high deviations in the frequency response at a 1 m distance with 2.83 Vrms input.
Figure 2.
(a) Drawing of the adaptable prototype, which allows for an individual configuration of different flat-panel loudspeakers with the same boundary conditions. (b) Detailed view of the standard configuration with wide openings in the separation plate to minimize air compliance-related stiffening.
Figure 3.
Overview of the simulation model. (a) Description of the individual subsystems consisting of the FE, FEA and BEM subsystems. (b) Detailed exciter modeling to visualize the model of the magnet mass, which is coupled via a transfer impedance to the mechanical part of the voice coil.
Figure 3.
Overview of the simulation model. (a) Description of the individual subsystems consisting of the FE, FEA and BEM subsystems. (b) Detailed exciter modeling to visualize the model of the magnet mass, which is coupled via a transfer impedance to the mechanical part of the voice coil.
Figure 4.
(a) Generating the compensation function based on a reference measurement with Klippel near field scanner (NFS); and (b) an in situ test for low-frequency measurements in the test environment.
Figure 4.
(a) Generating the compensation function based on a reference measurement with Klippel near field scanner (NFS); and (b) an in situ test for low-frequency measurements in the test environment.
Figure 5.
Validation of the measured and simulated pressure response of the panel with the exciter (standard construction) with a closed backside at a 1 m distance and with 2.83 Vrms input.
Figure 5.
Validation of the measured and simulated pressure response of the panel with the exciter (standard construction) with a closed backside at a 1 m distance and with 2.83 Vrms input.
Figure 6.
Simulated pressure response of the standard prototype with the visualization of the front displacement at discrete frequencies in the upper part. In the lower part, an overview of the relevant modes is presented. All even modes are not excited by the central excitation.
Figure 6.
Simulated pressure response of the standard prototype with the visualization of the front displacement at discrete frequencies in the upper part. In the lower part, an overview of the relevant modes is presented. All even modes are not excited by the central excitation.
Figure 7.
Simulated modal related and sound pressure related decomposition of the panel with an exciter (standard construction). The contribution of Modes 1–11 is extracted. All symmetrical eigenmodes are not excited due to the centered exciter position.
Figure 7.
Simulated modal related and sound pressure related decomposition of the panel with an exciter (standard construction). The contribution of Modes 1–11 is extracted. All symmetrical eigenmodes are not excited due to the centered exciter position.
Figure 8.
Visualization of the selective air stiffening caused by an additional separation plate exemplary for the third structural mode.
Figure 8.
Visualization of the selective air stiffening caused by an additional separation plate exemplary for the third structural mode.
Figure 9.
Comparison of the pressure level of the standard volume versus the construction with a separation plate measured at a 1 m distance with 2.83 Vrms input under free-field conditions.
Figure 9.
Comparison of the pressure level of the standard volume versus the construction with a separation plate measured at a 1 m distance with 2.83 Vrms input under free-field conditions.
Figure 10.
Validation of the measured and simulated pressure response of the standard panel and the panel with separation plate construction at 1 m distance and with 2.83 Vrms input.
Figure 10.
Validation of the measured and simulated pressure response of the standard panel and the panel with separation plate construction at 1 m distance and with 2.83 Vrms input.
Figure 11.
Visualization of the displacement and pressure in the acoustic chamber of the standard against the separation version. The displacement scale is adjusted for every frequency, but both versions are scaled to the same range. The pressure scale is in dB and the frequencies are similar for all cases.
Figure 12.
Simulated modal related and sound pressure related decomposition of the panel with an exciter (separation construction). The contribution of Modes 1–11 is extracted. All symmetrical eigenmodes are not excited due to the centered exciter position.
Figure 12.
Simulated modal related and sound pressure related decomposition of the panel with an exciter (separation construction). The contribution of Modes 1–11 is extracted. All symmetrical eigenmodes are not excited due to the centered exciter position.
Figure 13.
Illustration of the individual optimization parameters: (a) changes of the cut-out diameter; and (b) changes of the panel volume.
Figure 13.
Illustration of the individual optimization parameters: (a) changes of the cut-out diameter; and (b) changes of the panel volume.
Figure 14.
Influence of the radius in the separation plate: (a) measurement; and (b) simulation.
Figure 14.
Influence of the radius in the separation plate: (a) measurement; and (b) simulation.
Figure 15.
Comparison of the influence of the thickness of the paneled volume: (a) measurement; and (b) simulation.
Figure 15.
Comparison of the influence of the thickness of the paneled volume: (a) measurement; and (b) simulation.
Figure 16.
Optimization workflow with the variation in the thickness t and the radius r of the separation plate design.
Figure 16.
Optimization workflow with the variation in the thickness t and the radius r of the separation plate design.
Figure 17.
ACF values for various combinations of thickness t and radius r of the separation plate design. An optimized result is clearly visible.
Figure 17.
ACF values for various combinations of thickness t and radius r of the separation plate design. An optimized result is clearly visible.
Figure 18.
Comparison of the simulation results of the standard version, the separation (r = 0.07 m, t = 0.01 m) and the optimized version (r = 0.12 m, t = 0.012 m).
Figure 18.
Comparison of the simulation results of the standard version, the separation (r = 0.07 m, t = 0.01 m) and the optimized version (r = 0.12 m, t = 0.012 m).
| Publisher’s Note: MDPI stays neutral with regard to jurisdictional claims in published maps and institutional affiliations. |
© 2020 by the authors. Licensee MDPI, Basel, Switzerland. This article is an open access article distributed under the terms and conditions of the Creative Commons Attribution (CC BY) license (http://creativecommons.org/licenses/by/4.0/).


