Abstract
As the demand for agricultural electric vehicles increases, it is becoming important to conduct noise reduction in consideration of the characteristics of an electric powertrain. This study was conducted to optimize the shape design of gearbox housing for radiated noise reduction of an agricultural electric vehicle gearbox. The noise and vibration of the gearbox were measured considering the noise characteristics of the electric vehicle gearbox, which radiates high-frequency pure tone noise. The main noise source radiated by the structural vibration of the gearbox housing was identified and considered when modeling the loading conditions in the numerical analysis. To improve the reliability, the finite element (FE) model was updated and validated. Internal machine elements were modeled as a substructure through a reduced-order modeling method to reduce the computing time and apply a constant gear excitation force. The weak areas of structure were determined and it was used as the design area for optimization. The topology optimization technique was used to reduce the equivalent radiated power (ERP) which was used as an indicator of radiated noise level. The maximum value of the ERP decreased under all operating conditions at the rated speed.
1. Introduction
With increasing interest in reducing greenhouse gases and fine dust, the development and dissemination of eco-friendly vehicles is expanding. In the agricultural machinery industry, the demand for the development of electric vehicles is increasing as a result of the electrification of power transmission systems [1]. The electric motor of an electric vehicle is operated at a relatively high rotational speed and low torque compared to the engine of an internal combustion locomotive. Therefore, to adjust the driving speed of the electric vehicle to the internal combustion locomotive, a speed-reducing gearbox is required [2].
For a conventional engine-driven vehicle, the engine is the main noise source; however, for an electric vehicle, there is no engine noise, but the gear noise owing to the driving of the electric motor is the main noise source [3]. The noise of the motor and gearbox generated during driving shows relatively high-frequency characteristics compared to that of the engine noise. Depending on the rotational speed, specific pure tone noise occurs at the torque ripple frequency of the electric motor and gear mesh frequencies of the gearbox. The pure tone generated in the wide frequency band coincides with the natural frequency of the system, which can cause resonance and enhance noise [4]. Pure tone acts as a hissing noise in the high-frequency region and booming noise in the low-frequency region. The higher the frequency of noise, the greater the discomfort to the operator [5]. Therefore, to improve the working environment of the operators, noise reduction in agricultural electric vehicles should be studied.
Fang et al. [6] measured radiated noise using a microphone to analyze the noise characteristics of an electric powertrain and measured the vibration using an accelerometer on a bearing block. The noise and vibration were analyzed by classifying electromagnetic noise, inverter noise, and gear whine noise; the high-speed gear whine noise dominates the sound quality at high speed. As a result of evaluating the sound quality through experiments, the electric powertrain exhibited a high-frequency characteristic, and produced more discomfort than that by the conventional engine. As described above, to reduce noise in an electric vehicle, a process of analyzing structure-borne noise caused by gear mesh excitation force generated in the gearbox is required. Brecher et al. [7] produced a simple experimental model consisting of two-speed gear trains to analyze the noise characteristics of the gearbox and compared the noise levels of the first and second gear trains. A rotational acceleration sensor and a microphone were used to measure the structure-borne noise due to gear excitation. The analysis of the noise according to the order component of the first and second gear meshes confirmed that the first gear mesh was dominant in the noise level by operating at a relatively high speed.
Inoue et al. [8] conducted a study on the optimization of the stiffener to reduce the noise and vibration of the gearbox housing and revealed a correlation between the vibration reduction design and noise reduction design. In addition, to minimize the structure-borne noise of the gearbox housing, the vibration energy of the mode existing in the frequency domain of interest was reduced; this method was most effective when the stiffener was positioned between the bearing and housing fixing. Liang et al. [9] experimentally measured the load at the bearing position to realize the dynamic load acting on the gearbox and verified it by comparing it with the simulation model. The natural frequency of the housing increased by modifying the shape of the housing through a topology optimization technique. Wang et al. [10] optimized the dynamic performance of sawing machine gearbox using topology optimization. The internal components were modeled as point masses to reduce the computational burden. The natural frequencies were used as the output design variables. However, since the noise of electric vehicles has high-frequency characteristics, the resonance avoidance design is not sufficient to account for the high-frequency excitation force [11]. Liu et al. [12] predicted the sound pressure level of a gearbox at a specific field point. The load was modeled as a simulated reaction force at the bearing position. Using a topology optimization technique, the sound pressure level was reduced with objective function of minimizing the housing surface velocity.
The studies mentioned above have the following limitations: (i) the change in the reaction force of the internal mechanical elements, such as the gears, shafts, and bearings, according to the shape modification of a gearbox housing was not considered; (ii) model updating and validation procedures for optimization using finite element (FE) analysis were not performed; (iii) the objective function for optimization mainly focused on the natural frequencies or noise characteristic at a specific region, and (iv) the design area of the optimization was specified based on experience or without clear criteria.
The objective of this study is to reduce the structural vibration of the gearbox housing owing to the gear mesh excitation force and resulting radiated noise. To achieve this purpose, the root cause of structural vibration should be identified, and noise and vibration should be reduced through an objective and reliable method. In this study, the main noise source and excitation force considering the noise characteristics of the electric vehicle gearbox were identified with the experimental measurement. Since the topology optimization technique was used to reduce the radiated noise, the FE model was updated and validated to develop a reliable analysis model. The housing shape design was optimized by redesigning the weak areas against noise and vibration through sound power analysis. Topology optimization technique was used to reduce the radiated noise of the gearbox. In order to optimize the material distribution in the redesign area, the equivalent radiated power with sound properties regardless of location was used as the output variable. Figure 1 shows the entire procedure for this study.
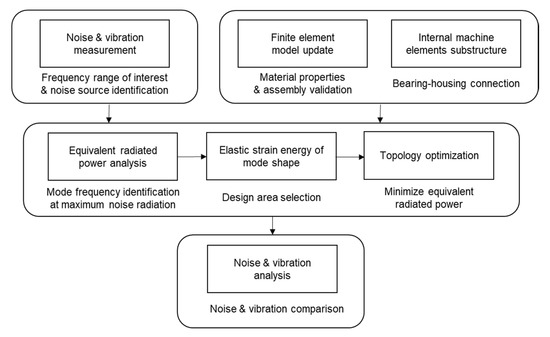
Figure 1.
Flowchart for optimizing the shape of the gearbox housing.
2. Noise and Vibration Measurement of the Gearbox
2.1. Agricultural Electric Vehicle Gearbox
The gearbox used in this study is mounted on an agricultural electric vehicle. The vehicle is a utility terrain vehicle designed for the purpose of transporting agricultural products at a close distance. It is equipped with a 7 kW electric motor that operates at a rated speed of 2650 rpm. The gearbox consists of two-stage reduction gear trains with the input shaft, intermediate shaft, and output shaft, and it is designed to transmit power from a single electric motor to both wheels using differential gears. The first-stage gear pair consists of a 14 teeth pinion and 46 teeth gear, and the gear ratio is 3.29. The second-stage gear pair consists of a 21 teeth pinion and 79 teeth gear, with a gear ratio of 3.76. The total gear ratio of the gearbox is 12.37. The gearbox housing is made of aluminum and is lightweight, as shown in Figure 2.

Figure 2.
Gear train of reduction gearbox. (a): Power flow; (b): Number of gear teeth.
2.2. Gear Whine Noise
Imperfect motion transfer in gears owing to geometrical insufficiencies, such as manufacturing tolerances, deviations in the manufacturing procedure of the gears, and elastic deflections and deformation under loads in the operating conditions, result in variations in the gear excitation force, that is, transmission error. The gear mesh excitation is transmitted through the shaft and bearing to the housing, and structural vibration of the housing occurs, and radiated noise is generated, which is called gear whine noise [13]. Gear whine is characterized by pure tone noise, which occurs at a certain frequency. This frequency is determined by the rotational speed of the shaft and the number of teeth of the gear, which is called the gear mesh frequency (GMF).
When the rotational speed of the input shaft is determined by the driving of the motor, the rotational speeds of the middle shaft and output shaft are determined by the gear ratio of the gear train. The excitation frequency caused by the gear mesh is determined by the rotational speed of each shaft and the number of gear teeth, as shown in Equation (1). GMF represents a harmonic component according to an integer multiple. For example, the rotational speeds of the input shaft, middle shaft, and output shaft at the rated speed are listed in Table 1. The GMF values at the rated speed are listed in Table 2:
Here, is the gear mesh frequency in Hz, and is an integer (1, 2, 3, …).

Table 1.
Rotational speed of the shaft at the rated speed.
Table 1.
Rotational speed of the shaft at the rated speed.
| Part | Rotational Speed, rpm | Shaft Frequency, Hz | Gear Ratio |
|---|---|---|---|
| Input shaft | 2650 | 44.2 | Stage 1: 3.29 |
| Mid shaft | 806.5 | 13.4 | |
| Stage 2: 3.76 | |||
| Output shaft | 214.4 | 43.6 |
Table 2.
Gear mesh frequency (GMF) at the rated speed.
Table 2.
Gear mesh frequency (GMF) at the rated speed.
| GMF and Its Harmonics, Hz | ||||
|---|---|---|---|---|
| 1st | 2nd | 3rd | 4th | |
| Stage 1 | 618.3 | 1236.7 | 1855.0 | 2473.3 |
| Stage 2 | 282.3 | 564.6 | 846.8 | 1129.1 |
2.3. Order Analysis
To analyze the noise source of the gearbox and set the frequency range of interest, the noise and vibration should be measured. The main excitation frequencies in the gearbox are determined by the rotational speed of the shaft, number of gear teeth, and rolling element characteristics of the bearing. Therefore, the noise and vibration levels should be analyzed in the frequency domain according to the rotational speed of the input shaft [14]. This process is called order analysis. A tachometer is used to measure the rotational speed, and a microphone and an accelerometer are used to measure noise and vibration. The information of the rotational speed can be used to calculate the GMF defined in Section 2.2. By comparing the measurement result of noise and vibration with GMF, it is possible to analyze the noise source. The accelerometer was attached to the housing where the bearing was mounted. This makes it possible to measure structural vibrations caused by gear excitation forces. The radiated noise caused by structural vibration of the gearbox housing was measured by placing the microphone in the same row as the gearbox. The measurement results of noise and vibration were analyzed in the frequency domain through fast Fourier transform (FFT).
To operate the gearbox under the same conditions as the actual operating conditions, speed control was performed on the input shaft, and the torque was controlled on the output shaft using the dynamometers. The torque was measured using a torque meter mounted on the output shaft. As a result of checking the measured value with a torque meter, the load was set equal to the rated condition of the motor. The configuration of the order analysis test is shown in Figure 3 and listed in Table 3.
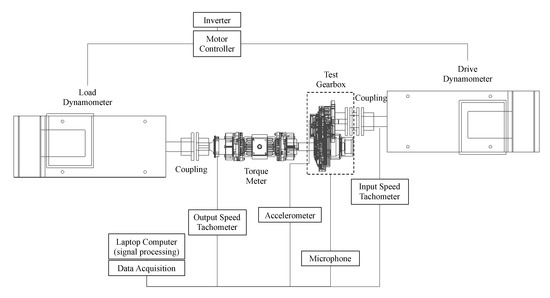
Figure 3.
Test layout for order analysis.
Table 3.
Specification of test equipment for order analysis.
The noise and vibration levels measured using a microphone and an accelerometer are shown in Figure 4 as the sound pressure level and acceleration in decibels. Since the order analysis process is based on rotational speed information, the horizontal axis of the contour graph represents the frequency and the vertical axis represents the rotational speed. Considering that the rated speed of the test gearbox was 2650 rpm, the driving range was set to approximately 1.5 times to drive up to 4000 rpm. The frequency range for the frequency analysis was set to 4000 Hz to consider the fourth harmonic component for the GMF of the stage 1 gear pair.
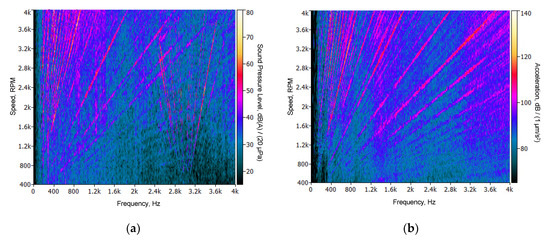
Figure 4.
Results of the noise and vibration measurement. (a): Sound pressure level; (b): Acceleration level.
In the frequency analysis results of the sound pressure level and acceleration level, as shown in Figure 5, the frequencies at which the high noise and vibration levels appear were changed depending on the rotational speed. Therefore, the main noise of the gearbox was owing to the rotating components, such as the gears, bearings, and shafts, and the main noise was generated from the gears through comparison with GMFs. High noise around 3000 Hz did not appear in the vibration data, therefore this noise is not radiated noise caused by the structural vibration of the gearbox. Considering the constant frequency component without respect to the rotational speed and because the sideband component appears in a V-shape according to the rotational speed, this noise is considered to be the switching noise and its side band components of the inverter.
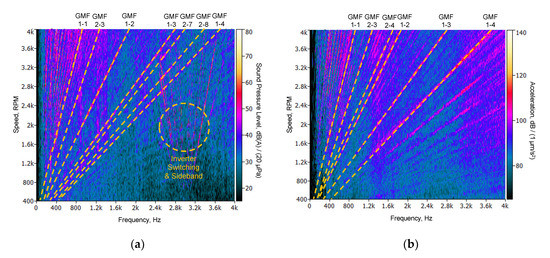
Figure 5.
Order analysis of the noise and vibration with gear mesh frequency (GMF). (a): Sound pressure level; (b): Acceleration level.
In Figure 6, the frequency analysis was performed with FFT results of noise and vibration when the rotational speed was fixed at the rated speed of 2650 rpm. Two of the three main noises indicating a noise above 60 dB (A) were the gear mesh components; the other noise was a value not present in the vibration data, indicating an inverter switching noise. The high noise values in the low-frequency range (300–400 Hz) are the resonance effect due to the natural frequency around 400 Hz when compared with the frequency response function results of the gearbox, as shown in Figure 7.
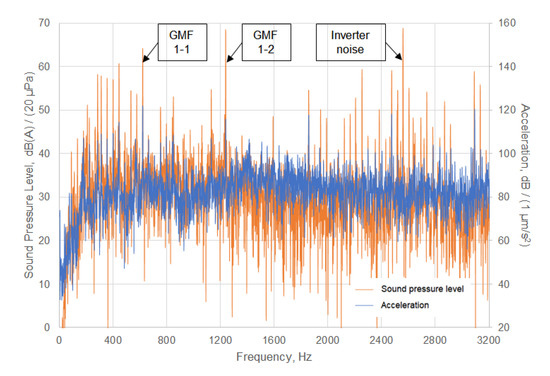
Figure 6.
Frequency analysis of the noise and vibration at rated speed.

Figure 7.
Frequency response functions of the test gearbox.
From the measured noise data, only the GMF components were extracted, and the contribution to the total noise was analyzed according to the rotational speed of the input shaft. The GMF components were extracted up to the fourth harmonic component for the first and second stages of the gear train measured up to 4000 Hz. In Figure 8, the overall noise occurred from approximately 64 dB (A) to 82 dB (A) depending on the rotational speed of the input shaft. In the first stage of the gear train, the first and second harmonic components contributed to the noise at a level within 10 dB (A) compared to the total noise level. For the first harmonic, the contribution was high in the 1500–2000 rpm range and the 3000–4000 rpm range and for the second harmonic, the contribution was high in the 2000–3000 rpm range. In the second stage of the gear train, none of the harmonic components contributed significantly to the overall noise.

Figure 8.
Sound pressure level comparison to the overall noise. (a): At gear mesh frequency of stage 1 (first to fourth harmonics); (b): At gear mesh frequency of stage 2 (first to fourth harmonics).
The radiated noise measured in the gearbox was caused by structural vibration of the housing. Since the structural vibration of the housing occurs mainly at the GMF, it can be seen that the gear excitation force is the main noise source, which is consistent with the results of previous studies. Due to the structural vibration of the gearbox used in this study, the first and second harmonic components of the first stage of the gear train act as the main noise source. The results of these tests were able to identify the noise source as specific harmonic components. These components were used as loading conditions for the FE model in the next section.
3. Finite Element Modeling of the Gearbox
3.1. Finite Element Model Update and Validation
To obtain reliable results from the numerical analysis of the noise and vibration based on the finite element method (FEM), it is necessary to validate whether the dynamic characteristics of the actual model are reflected by the FE model. In this study, the natural frequency, mode shape, and damping ratio were measured through an experimental modal analysis (EMA) to understand the dynamic characteristics of the actual model. The FE modeling and the numerical mode analysis was performed in the Ansys Workbench (v19.0) commercial software. Based on this, the FE model was updated and validated. In the process of the model update, the material properties of the gearbox housing and the contact method between the housings were set as variables. The natural frequency of the updated model and actual gearbox housing showed an error of approximately 2.8%. For the mode shape, the FE model was validated by comparing the modal assurance criterion (MAC) value, which is an index that analyzes the correlation of the mode shapes between models. This portion of the study was based on the detailed process and results of the update and validation of the FE model in a previous study conducted by Son et al. [11].
3.2. Modeling of the Internal Machine Elements
To numerically analyze the noise and vibration of the gearbox using the FE model, the bearing reaction force should be inputted as an excitation force. The gear mesh force is transmitted to the housing through the shaft and bearing, and the force transmitted to the housing is called the bearing reaction force. In a previous study, the bearing reaction force calculated by the dynamic analysis was only applied as a loading condition. However, this method is not suitable because the bearing reaction force does not change and is constant despite the housing shape changes during the optimization process. In this study, internal machine elements such as gears, bearings, and shafts were modeled as substructures using a reduced-order model technique [15] and connected to the FE model of the gearbox housing using RomaxNEXUS (R19) and Opti-struct (v2019) commercial software. This method is suitable for use in the optimization procedure because the excitation force changes according to the shape change of the housing [16]. The first and second harmonic components of the first stage of the gear train, which is shown as the main source of noise in Section 2, were applied as the excitation forces, and the bearing node and housing nodes were connected by a rigid body element.
4. Radiated Noise Reduction Using Topology Optimization
4.1. Equivalent Radiated Power
To optimize the shape design of the gearbox housing to reduce radiated noise, the weak areas of the structure against noise and vibration should be identified, and the design areas should be modeled. To analyze the weak areas of the structure, the sound power according to the gear mesh excitation was predicted using a validated FE model. The design areas were modeled based on the operating deflection shape (ODS) and elastic strain energy (ESE) in the relevant mode under operating conditions for high radiated noise.
As sound power represents the properties of a sound source, it does not depend on distance and direction, unlike sound pressure or sound intensity, which represents the properties of a sound wave at an arbitrary point in space. In a vibroacoustic problem, the surface velocity of the vibrating structure is the same as the velocity of the air particles at the interface owing to the speed continuity. Accordingly, the sound power can be expressed as shown in Equation (2), as a function of the surface velocity of the structure:
Here, is the sound power, W; is the sound radiation efficiency; is the density of air, ; is the speed of sound, ; is the vibrating surface area, ; is the root mean square value of surface velocity at the vibrating structure, .
In the sound power analysis based on the FEM, Equation (2) can be calculated by discretizing in finite elements, and the prediction can be made by assuming the sound radiation efficiency as a unit value. This is called equivalent radiated power (ERP) and can be calculated as shown in Equation (3) [17]. Since the radiation efficiency is assumed to be 1, the ERP can be calculated to be larger than the actual sound power; however, the upper bound of the sound power radiated by structural vibration can be approximately estimated:
Here, is the equivalent radiated power, W; is the surface area of the finite element at the vibrating structure, ; is the RMS surface velocity of the finite element at the vibrating structure, ; is the number of finite elements.
Depending on the rotational direction of the input shaft, the gear mesh force transmitted to the housing is changed. In this study, to consider the forward and reverse motions of an agricultural electric vehicle, ERP values were calculated when the input shaft was rotated clockwise (CW) and counterclockwise (CCW), respectively. Figure 9 shows the direction of the bearing reaction force along the rotational direction of the input shaft.
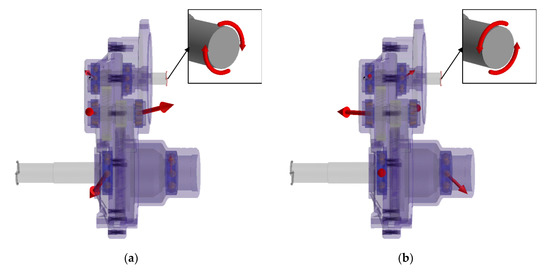
Figure 9.
Bearing reaction force according to the rotational direction of the input shaft. (a): Clockwise rotation of the input shaft; (b): Counterclockwise rotation of the input shaft.
A modal frequency response analysis was performed for the ERP analysis. Figure 10 shows the ERP results when the first and second harmonic components of the first stage of the gear train were applied as the excitation force. When the input shaft was rotated in the CW direction, the ERP value was high at approximately 3500 rpm in the first harmonic component and approximately 2636 rpm in the second harmonic component. When the input shaft was rotated in the CCW direction, the ERP value was high at approximately 3788 rpm in the first harmonic component and approximately 2724 rpm in the second harmonic component. The rotational speed range at which the peak value appears depending on the gear mesh excitation was similar to the experimental noise measurement result in Figure 8, and this could confirm the reliability of the FEM-based numerical analysis results.
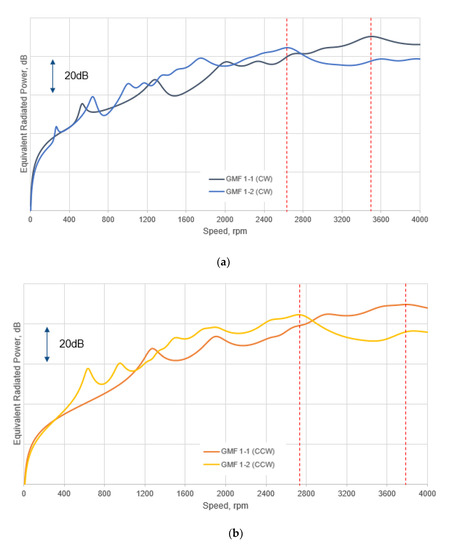
Figure 10.
Results of the equivalent radiated power analysis. (a): Clockwise rotation of the input shaft; (b): Counterclockwise rotation of the input shaft.
4.2. New Design Areas for Optimization
The operating conditions with high response levels for each excitation component were confirmed from the ERP analysis results. After the ODS was predicted under these conditions, the ESE was analyzed for the mode causing the relevant deflection, and the location had the greatest influence on the deflection. This location was determined as the weak areas against noise and vibration for reinforcement. The original shape of the gearbox housing before optimization is shown in Figure 11.
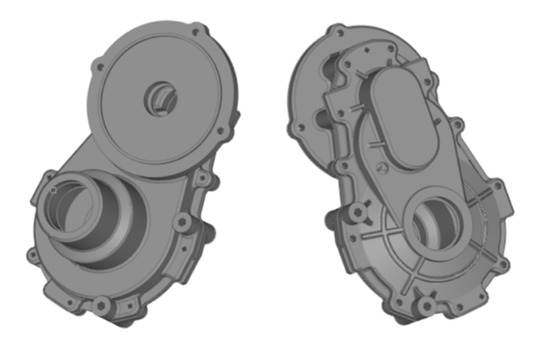
Figure 11.
Original shape of the gearbox housing.
When the input shaft rotated in the CW direction, the ERP value peaked at 3500 rpm for the first harmonic component and at 2636 rpm for the second harmonic component. The GMF can be calculated according to Equation (1) using the order of the harmonic components and the rotational speed. The GMF of the first harmonic component is 817 Hz at 3500 rpm, and the GMF of the second harmonic component is 1230 Hz at 2636 rpm. Comparing these excitation frequencies with the natural frequencies of the gearbox, the closest mode frequencies were 813 and 1238 Hz, respectively. Figure 12 shows the ODS under operating conditions with high ERP values for CW driving, and Figure 13 shows the ESE of the mode shape causing the relevant deflection.
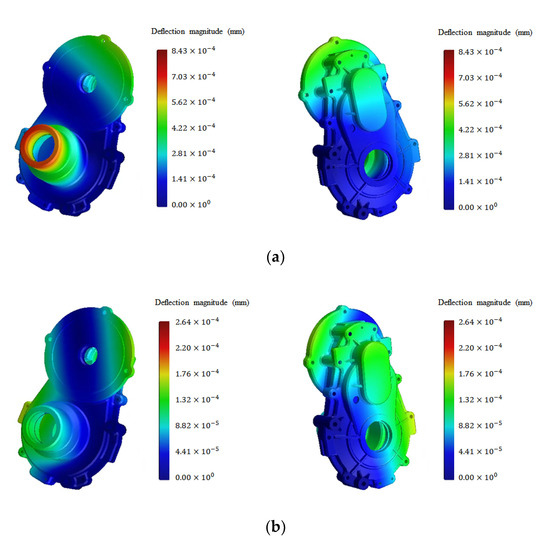
Figure 12.
Operating deflection shape (ODS) for clockwise drive. (a): ODS excited by gear mesh stage 1-first harmonic at 3500 rpm; (b): ODS excited by gear mesh stage 1-second harmonic at 2636 rpm.

Figure 13.
Elastic strain energy (ESE) for clockwise drive. (a): ESE of mode shape at 813 Hz; (b): ESE of mode shape at 1237 Hz.
When the input shaft rotated in the CCW direction, the ERP value peaked at 3788 rpm for the first harmonic component and at 2724 rpm for the second harmonic component. The GMF of the first harmonic component is 884 Hz at 3788 rpm, and the GMF of the second harmonic component is 1271 Hz at 2724 rpm. Comparing these excitation frequencies with the natural frequencies of the gearbox, the closest mode frequencies were 885 and 1280 Hz, respectively. Figure 14 shows the ODS under operating conditions with high ERP values for CCW driving, and Figure 15 shows the ESE of the mode shape causing the relevant deflection.
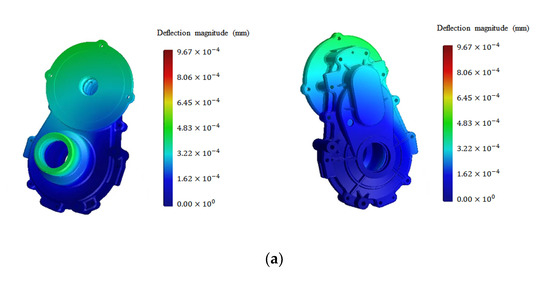
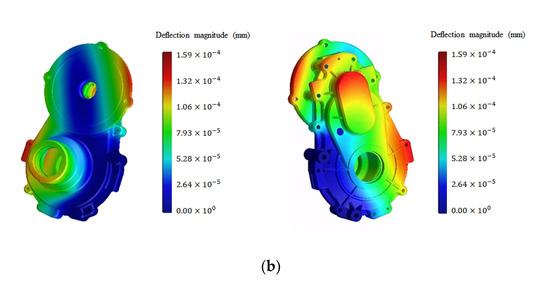
Figure 14.
Operating deflection shape for counterclockwise drive. (a): ODS excited by gear mesh stage 1-first harmonic at 3788 rpm; (b): ODS excited by gear mesh stage 1-second harmonic at 2724 rpm.

Figure 15.
Elastic strain energy for counterclockwise drive. (a): ESE of mode shape at 885 Hz; (b): ESE of mode shape at 1280 Hz.
From the ESE analysis results, the location that had the greatest influence on the large deflection of the ODS was the points at which the ESE showed a large value. As this location was confirmed to be weak areas against noise and vibration, reinforcement was required. The reinforcing design for the housing was performed to reduce the deflection by increasing the stiffness of the weak areas against noise and vibration and to reduce the radiated noise owing to the structural vibration of the gearbox housing. The new design area for optimizing the shape design was modeled, as shown in Figure 16.

Figure 16.
New design area (red) for optimization.
4.3. Topology Optimization
The topology optimization technique was used to optimize the shape design using Opti-struct (v2019) commercial software. Topology optimization is a design technique that determines the density distribution of optimized materials to achieve the design goals in a FE model. It is used in the initial design stage to determine the optimal material distribution for a given boundary condition [18]. To determine the distribution of the material, the value of the relative density of each element in the designated design area is defined as a design variable. According to the optimization function, the density of the required area is regarded as 1 and completely filled, and the density of the unnecessary area is regarded as 0 and removed. In this study, the design area for optimization was defined in Section 4.2, and the optimization response value was defined as the ERP value and the housing volume; thus, the objective function for minimizing the ERP value and constraints for preventing the weight increase from exceeding 20% compared to the existing housing were set.
Figure 17 shows the modified housing shape from the topology optimization result. The distribution of the optimized materials could be confirmed through the relative density of the finite elements, which are the variables of optimization. In this study, the optimized shape of the housing was modeled by considering the finite elements with a relative density of 0.8 or more as fully filled elements. The weight of the housing before optimization was 4.84 kg, and the weight increased by approximately 12% to 5.44 kg after optimization.
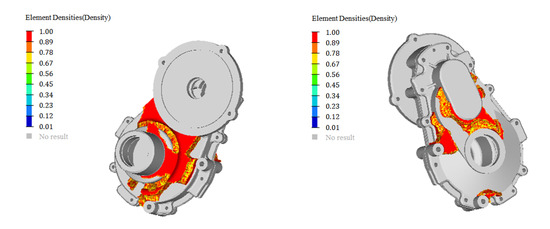
Figure 17.
Result of topology optimization.
Figure 18 and Figure 19 show the changes in the ERP values before and after performing shape design optimization through topology optimization. Most of the maximum ERP values were reduced under all operating conditions. When the input speed of the gearbox was rated at 2650 rpm, the ERP value decreased by approximately 9.7 dB for the first harmonic and 4.2 dB for the second harmonic in the first-stage gear mesh for CW driving. The ERP value decreased by approximately 2.7 dB for the first harmonic and 5.7 dB for the second harmonic in the first-stage gear mesh for CCW driving.
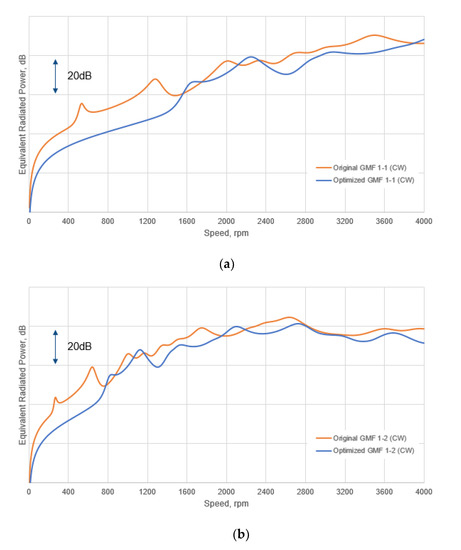
Figure 18.
Equivalent radiated power (ERP) comparison for clockwise drive. (a): ERP excited by gear mesh stage 1-first harmonic; (b): ERP excited by gear mesh stage 1-second harmonic.
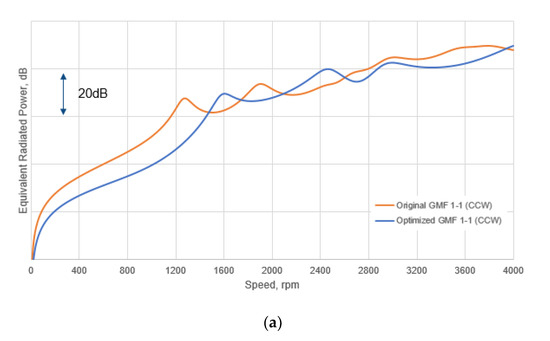
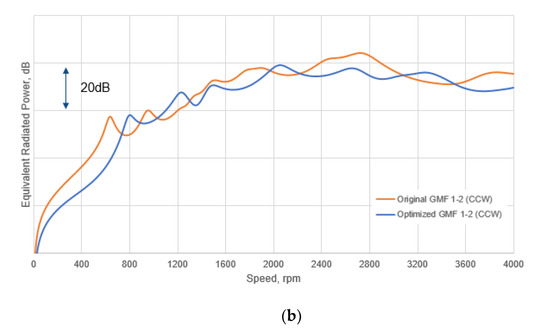
Figure 19.
Equivalent radiated power comparison for counterclockwise drive. (a): ERP excited by gear mesh stage 1—first harmonic; (b) ERP excited by gear mesh stage 1—second harmonic.
After optimization, the housing shape has not been laid out to a level that can be actually manufactured, which shows the limitation that the topology optimization technique is used in the initial design stage rather than to make the final shape. However, this technique is more objective and reliable than design that relies on experience because it proceeds according to the variables and objective functions designated by the designer. As a result of the optimal design, the ERP value decreased in most operating conditions including the rated speed, but the ERP value increased in some operating conditions. It is believed that this phenomenon may be caused by a different resonance mode due to the housing shape change. The shape of the housing, initially designed through the topology optimization technique, should be designed in detail taking into account manufacturing.
5. Conclusions
This study aimed to reduce the structural vibration of the gearbox housing owing to the gear mesh excitation force and resulting radiated noise. The whole procedure of this study focused on the objectivity and reliability for reducing the radiated noise in agricultural electric vehicle gearbox. The noise and vibration of the gearbox were measured and analyzed by considering the load characteristics of the gearbox for agricultural electric vehicles. A FE model, which was validated through an experimental modal analysis, was used, and the internal machine elements were modeled. This process is suitable for optimization because it provides accurate bearing reaction force even if the shape of the housing changes. Numerical analysis on the noise was performed using the validated FE model, and the shape of the gearbox housing was optimized using topology optimization technique. Since the value of the equivalent radiated power in the frequency range of interest was used as the output variable for the topology optimization, results were obtained regardless of the measurement location. In conclusion, the shape design process, which was previously dependent on experience, was performed through an objective and reliable process.
The main conclusions from this study are as follows.
- The whine noise of the gearbox represents the pure tone characteristics occurring at a specific frequency, and this frequency is determined by the rotational speed of the input shaft. Therefore, to analyze the noise and vibration considering these characteristics, an order analysis test was performed to analyze the data according to the rotational speed of the input shaft. To reduce the radiated noise owing to the structural vibration of the gearbox housing, the contribution level was evaluated by comparing the GMF component with the overall noise level according to the rotational speed. As a result, the first and second harmonic components of the first stage of the gear train were evaluated as the main noise sources.
- Through the EMA, the dynamic characteristics of the actual housing were identified, and the FE model was updated and validated based on this result. In the model update process, the material properties of the gearbox housing and the contact method between the housings were set as variables. The natural frequency of the improved model and the actual model showed an error of approximately 2.8%. For the mode shape, the FE model was validated by comparing the MAC value. The internal machine elements, such as the gears, shafts, and bearings, were modeled in a substructure using a reduced-order modeling technique and were connected to the housing.
- To optimize the shape design of the gearbox housing for reducing radiated noise, the design areas were modeled by analyzing the weak areas against noise and vibration. ERP analysis was performed according to the rotational direction of the input shaft and gear excitation force. The new design areas were determined through the ODS analysis under the operating conditions where the ERP value was high and the ESE analysis in the mode causing the relevant deflection. To optimize the shape design, a topology optimization technique was used to determine the optimum material distribution in the design areas, and the minimization of the ERP value was set as the objective function. After optimization, the maximum ERP value decreased under all operating conditions; however, the weight of the housing increased by approximately 12%. When the input speed of the gearbox was rated at 2650 rpm, the ERP value decreased by approximately 9.7 dB for the first harmonic and 4.2 dB for the second harmonic in the first-stage gear mesh for CW driving. The ERP value decreased by approximately 2.7 dB for the first harmonic and 5.7 dB for the second harmonic in the first-stage gear mesh for CCW driving.
Author Contributions
Conceptualization, Y.-J.P.; Data curation, G.-H.S. and S.-J.C.; Investigation, B.-S.K.; Methodology, Y.-J.P.; Software, G.-H.S. and B.-S.K.; Supervision, Y.-J.P.; Validation, G.-H.S. and S.-J.C.; Writing—original draft preparation, G.-H.S.; Writing—review and editing, Y.-J.P. All authors have read and agreed to the published version of the manuscript.
Funding
This research was conducted using the RomaxNEXUS, Romax Technology Ltd.
Conflicts of Interest
The authors declare no conflict of interest.
References
- McFadzean, B.; Butters, L. An investigation into the feasibility of hybrid and all-electric agricultural machines. Sci. Pap. Ser. A Agron. 2017, 60, 500–511. [Google Scholar]
- De Santiago, J.; Bernhoff, H.; Ekergard, B.; Eriksson, S.; Ferhatovic, S.; Waters, R.; Leijon, M. Electrical motor drivelines in commercial all-electric vehicles: A review. IEEE Trans. Veh. Technol. 2012, 61, 475–484. [Google Scholar] [CrossRef]
- Govindswamy, K.; Eisele, G. Sound Character of Electric Vehicles; SAE Technical Paper 2011-01-1728; Proceesing of the SAE 2011 Noise and Vibration Conference and Exhibition; SAE International: Warrendale, PA, USA, 2011. [Google Scholar]
- Bassett, T.W.; Tate, S.; Maunder, M. Study of high frequency noise from electric machines in hybrid and electric vehicles. In Proceedings of the INTER-NOISE and NOISE-CON Congress and Conference, Melbourne, Australia, 16–19 November 2014. [Google Scholar]
- Meunier, S.; Rabau, G.; Friot, E. Annoyance and Loudness of Pure Tones in Noise: Application to Active Control of Fan Noise; CFA/DAGA 04; SFA: Paris, France, 2004. [Google Scholar]
- Fang, Y.; Zhang, T. Sound quality investigation and improvement of an electric powertrain for electric vehicles. IEEE Trans. Ind. Electron. 2018, 65, 1149–1157. [Google Scholar] [CrossRef]
- Brecher, C.; Schroere, M.; Lopenhaus, C. Experimental analysis of the dynamic noise behavior of a two-stage cylindrical gearbox. Prod. Eng. 2017, 11, 695–702. [Google Scholar] [CrossRef]
- Inoue, K.; Yamanaka, M.; Kihara, M. Optimum stiffener layout for the reduction of vibration and noise of gearbox housing. J. Mech. Des. 2002, 124, 518–523. [Google Scholar] [CrossRef]
- Liang, M.; Hu, J.; Li, S.; Chen, Z. Topology optimization of transmission gearbox under multiple working loads. Adv. Mech. Eng. 2018, 11, 1–7. [Google Scholar] [CrossRef]
- Wang, Y.; Ni, P.; Wen, D.; Lin, Q.; Wang, D.; Rao, Y.; Wang, H.; Tan, D. Dynamic performance optimization of circular sawing machine gearbox. Appl. Sci. 2019, 9, 4458. [Google Scholar] [CrossRef]
- Son, G.-H.; Cho, S.-J.; Park, Y.-J. Rib Design for improving the local stiffness of gearbox housing for agricultural electric vehicles. Appl. Sci. 2019, 9, 4571. [Google Scholar] [CrossRef]
- Liu, G.; Wang, J.P.; Chang, S. Optimal rib layout design of gearbox for the reduction of radiated noise. In Proceedings of the ASME 2017 International Design Engineering Technical Conferences and Computers and Information in Engineering Conference, Cleveland, OH, USA, 6–9 August 2017. [Google Scholar]
- Nayak, U.; Aravind, S.; Aundhekar, S. Influence of gear geometry on gearbox noise reduction—An experimental investigations. SAE Int. J. Commer. Veh. 2014, 7, 746–752. [Google Scholar] [CrossRef]
- Colabawala, M.; Sorenson, J.; Houser, D. An Experimental Characterization of Gear Whine Noise in a Variety of Vehicle Application; SAE Technical Paper 2003-01-1488, SAE 2003 Noise and Vibration Conference and Exhibition; SAE International: Warrendale, PA, USA, 2003. [Google Scholar]
- Bampton, M.C.; Craig, J.R.R.R. Coupling of substructures for dynamic analyses. AIAA J. 1968, 6, 1313–1319. [Google Scholar]
- Jauregui, J.C.; Torres, I.; Garcia, R.; Leon, A. Housing stiffness influence on gearbox dynamic loading for wind turbine applications. In Proceedings of the ASME Turbo Expo 2012, Copenhagen, Denmark, 11–15 June 2012. [Google Scholar]
- Fritze, D.; Marburg, S.; Hardtke, H.J. Estimation of radiated sound power: A case study on common approximation methods. Acta Acust. United Acust. 2009, 95, 833–842. [Google Scholar] [CrossRef]
- Bendose, M.P.; Kikuchi, N. Generating optimal topologies in structural design using a homogenization method. Comput. Methods Appl. Mech. Eng. 1988, 71, 197–224. [Google Scholar] [CrossRef]
Publisher’s Note: MDPI stays neutral with regard to jurisdictional claims in published maps and institutional affiliations. |
© 2020 by the authors. Licensee MDPI, Basel, Switzerland. This article is an open access article distributed under the terms and conditions of the Creative Commons Attribution (CC BY) license (http://creativecommons.org/licenses/by/4.0/).