Featured Application and Simple Summary
The work hold the wide prospect of understanding of wall rocks alteration zonation and of formation of high-grade iron ore bodies through hyperspectral mapping, which can be indicator of water-rock reaction and vector of deposit exploration.
Abstract
Research on wall rock alteration is of great importance to the understanding and exploration of ore deposits. The microscopic changes of the same mineral in different alteration zones can provide information about the migration and enrichment of ore-forming elements. In this paper, a typical profile of a high-grade iron ore body in Gongchangling iron deposit was investigated and sampled. The samples were checked by polarized microscopy, and alterations zonation were delineated according to the hydrothermal mineral assemblages and paragenesis. Moreover, hyperspectral images of wall rocks from each alteration zone were obtained by Norsk Elektro Optikk (NEO) HySpex-320 m imaging system. A customer Interactive Data Language (IDL) software package was used to process the images, and spectral features were extracted from the selected samples. The results indicate that spectral characteristics manifest obviously regular variations; i.e., from proximal to distal for the high-grade iron ore body, the wavelengths at ca. 1200 nm of chlorite and garnet, which accounts for most of the hydrothermal alteration minerals, become longer, and the absorption depths gradually smaller. The spectral features at 1200 nm of chlorite and garnet are always caused by the crystal field effect of Fe2+; therefore, the wavelength variations indicate the increase of Fe2+ and a reduced environment, which can provide more detailed information about the metallogeny and water–rock interaction. Since the hyperspectral features of the altered rocks can disclose unique mineralogical and structural information, the conventional classification of alteration zonation should be combined with the spectral feature, i.e., spectral alteration zonation, which is of great help to the understanding of the forming conditions of wall rock alteration and also the high-grade iron ore bodies.
1. Introduction
Hydrothermal alteration is a common phenomenon in mineral deposits, which is of great significance to the metallogenic stage analysis and mineral exploration [1]. The wall rock alterations have zoning characteristics, where the mineral assemblage can be used to recognize the mineralization characteristics and element migration rules [2]. In general, the scope of the alteration far exceeds the size of the deposit, which reduces the scale of the exploration effectively [3]. Based on the observations in the field, the different alteration mineral assemblages and the ACF-AKF (A = Al2O3 + Fe2O3 − (Na2O + K2O), C = CaO, F = FeO + MgO + MnO, K = K2O) diagram, a limited number of alterations occurring in nature can be seen [4], which can be used to infer the physicochemical conditions of the alteration reactions.
The traditional methods for identifying wall rock alterations include using a magnifying glass, using a polarizing microscope, X-ray diffraction (XRD), electron probe microanalysis (EPMA), whole rock geochemistry, etc. However, the composition always changes regularly in the same mineral, which contains vital indications at the micro scale for the processes of alteration and mineralization. In recent years, with the rapid development of analysis methods, some methods, such as inductively coupled plasma mass spectrometry (ICP-MS), produce an energy spectrum that can provide greatly accurate information about mineralogical composition, texture and polytype information but they are known as expensive and time-consuming. Hyperspectral technology is widely used in the geology field due to its advantages in indication at the micro scale for processes of alteration and mineralization and for being non-destructive [5,6,7,8,9]. The wavelength positions of spectral absorption features characterizes the differences of specific chemical bonds or special elements in the altered minerals [10,11,12]. Karim Lenhard et al. performed calibration of instrument and equipment errors in 2015 [13]. Magali Mathieu et al. applied HySpex SWIR-320 m to uranium ore prospecting and exploration in 2017, which reduced working time and improved working accuracy due to its high resolution [6]. Greenberger et al. obtained the hydrothermal mineralization model and analyzed volcano and lakes on Mars, based on the HySpex image and continuous composition data [14]. Graham et al. observed that clinochlore is related to white mica with a longer wavelength at the scale of hand specimens and in the field, which is concerned with the mineralization of porphyry copper [15]. If mineral species are determined [16], the spectral absorption depth is usually positively related to mineral content [17,18,19,20]. Murphy et al. predicted the relative abundance of clay minerals by absorption depth [21]. Dalm et al. calculated the degree of crystallization of alteration minerals in hand specimens, used to identify the grade of minerals [22]. This method is also widely used to obtain the alteration information in porphyry Cu–Au deposits, skarn-type deposits and non-metallic deposits due to its characteristics of high resolution and effectivity [23,24,25,26].
The Gongchangling iron deposit—Algoma-type banded iron formations (BIFs)—has the most high-grade iron ore in Anshan-Benxi area [27]. Previous studies have focused on the origins of high-grade iron ore, and the major opinion accepted by most scholars is that the magnetite quartzite is modified to form high-grade iron ore by a hydrothermal solution, accompanied by chlorite, garnet and other altered minerals [28,29,30,31]. At present, the source of hydrothermal fluid is argued as either hydrothermal from magma [32,33], or the metamorphic hydrothermal fluid in the regional metamorphism process [34,35,36,37]. Anyway, there are hydrothermal (gas) altered rocks around the high-grade iron ore. The altered rocks are vein or layer-like, and several meters to dozens of meters thick [38], indicating that they are closely related to the genesis of high-grade iron ore [39,40]. In this paper, the altered rocks near the high-grade iron ore in Gongchangling iron deposit were carefully sampled according to their mineral compositions and field occurrence. The NEO HySpex-320 m spectrometer was used to collect the hyperspectral images of the alteration rocks, and the spectral information of minerals in each alteration zone were extracted. Finally, the concept of spectral alteration zonation was proposed and discussed due to the unique information extracted from the hyperspectral images.
2. Geological Settings and Sampling
2.1. Regional Geology
The Anshan-Benxi area is located in the northeastern margin of the North China Craton (NCC, Figure 1) and is mainly composed of the Archean Anshan Group and the subordinate Paleoproterozoic Liao-he Group, together with Paleozoic and Cenozoic strata, among which Anshan Group is the host bed of Anshan-type iron mine [27,37]. The faults in this area are quite developed, and the north northeast (NNE) Tanlu fault, and northeast (NE) Hanling fault have great influence on the geological structure in this area. Archean granite occurs widely in this region, accompanied by small plutons of Mesozoic Yanshanian granites and diabases. Lots of large-scale iron deposits, such as Xianshan, Donganshan, Yanqianshan, Yingtaoyuan, Hujiamiaozi, Gongchangling, Nanfen, Waitoushan and Huanxiling, and many other medium-sized iron deposits, are scattered in the area [41,42,43]. All the ore deposits are dominated by lean ore, while some of them contain high-grade iron ore bodies of different sizes. The Gongchangling high-grade iron ore bodies, with great economic interest, are the largest and the most typical ones in Anshan-Benxi area. The Gongchangling iron deposit lies in the Archaean greenstone belt in Anshan-Benxi area and is tectonically located in the Anshan uplift [40,44]. Distributed from northwest to south east, the Gongchangling is comprised of number 1, number 2, number 3 and the Dumu mining district (Figure 1) [29]; 138 high-grade iron ore bodies have been proven in the mining area, among which the three largest in the number 2 mining area account for 0.4% of the total reserves.
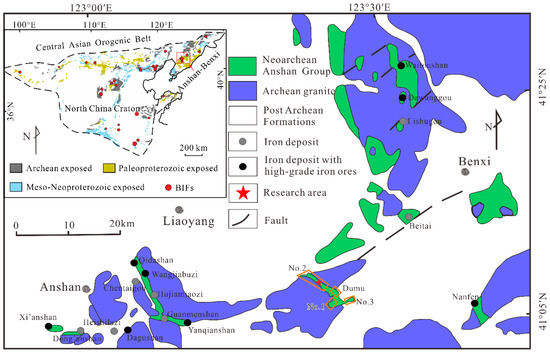
Figure 1.
Geological map of the Anshan–Benxi area, Liaoning Province. Modified after [27,45].
2.2. Ore Deposit and Sampling
The largest high-grade iron ore body RI in Gongchangling iron deposit (Figure 2): located in the sixth layer of iron ore, occurring in the strike fault, it accounts for 58.5% of total reserves of high-grade iron ore. The length of the ore body is 2840 m along the strike, with elevation generally below −500 m. The occurrence of the ore body is roughly consistent with that of the lean ore. The samples used in this paper were taken near this high-grade iron ore body.
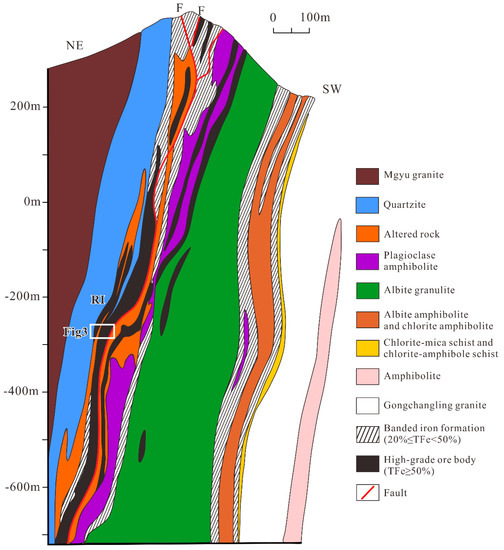
Figure 2.
Geological cross-section of the Gongchangling number 2 mining area. Modified after [27,29].
In consideration of the influence of surface weathering, the mineral assemblage, the spatial distribution pattern and the contact relationship between the high-grade iron ore and altered rocks, a total of 9 samples were taken for further investigation (Figure 3). The cross-section of the sample was cut into chips for HySpex imaging hyperspectral measurement, and the opposite side was used for thin sections.
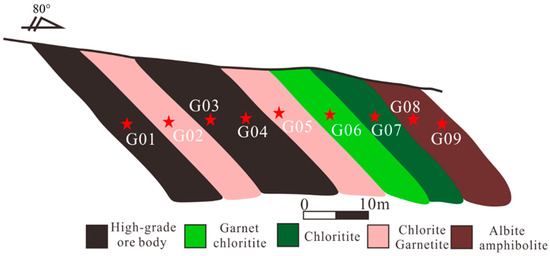
Figure 3.
Schematic diagram of profile sampling.
3. Methods
3.1. Data Acquisition
The microscope used for thin sections was Leica DM4P polarizing microscope, Leica Biosystems Nussloch GmbH in Heidelberger, Germany, mounted by a Leica DMC4500 digital camera. The main tech specifications of the Leica DM4P are that it is a transmission polarized light+ reflected polarized light+ fluorescence system microscope—5×, 10×, 20×, 50×, 63×—with a normal temperature polarized light objective—10×, 25× eyepieces. It is equipped with Leica original DMC4500 (5 million physical pixels) color digital CCD camera, and Leica Application Suite (LAS) measurement software.
The spectrometer used to obtain hyperspectral imaging data was HySpex, a Norwegian company of NEO, in the Planetary Mineralogy and Spectroscopy Laboratory at the University of Hong Kong. The system has a very high acquisition rate, and is mainly composed of a sensor, a central computer, a measurement platform and a short-wave infrared (SWIR) sensor. It can simultaneously obtain imaging hyperspectral data of 1000–2500 nm. The main technical parameters of the sensor are shown in Table 1. Furthermore, the parameters to evaluate the performance of the spectrometer are spectral sample and S/N. The spectral sampling interval of HySpex can reach 0–5 nm and the spatial resolution is as high as 0.3 × 0.3 mm [46], allowing obtaining the information for pure mineral per pixel. However, there was still a distance of 0.5 m between the sample and the lens during testing, leading to the occurrence of a little noise in the resulting data, which can be removed during spectral preprocessing [6,13,46]. A standard grey plate was imaged simultaneously in order to correct the digital number (DN) value to reflectivity.

Table 1.
Main technical parameters of HySpex imaging spectrometer.
3.2. The HySpex Data Processing
Since the data were taken from the laboratory, the distance between the camera lens and the target object was very short, so the influence of the atmosphere could be ignored. However, chaotic noise due to environmental interference and equipment defects still exists, resulting in a certain deviation. Therefore, the collected spectral data had to be specially processed (Figure 4).
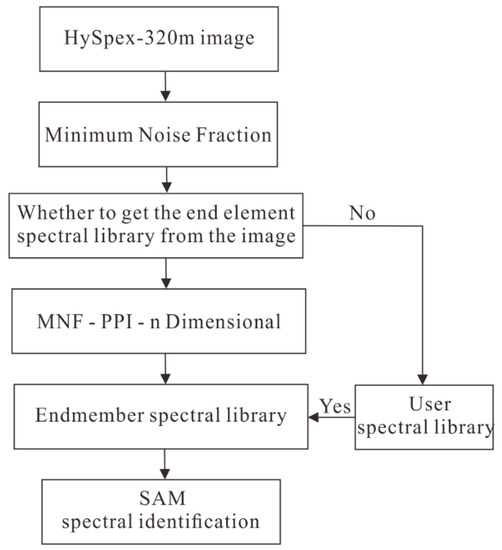
Figure 4.
Spectral analysis and identification process.
(1) Preprocessing: In order to minimize the influence of noise during imaging: Firstly, the hyperspectral images were calibrated to reflectance through the following steps: (a) dark current subtraction, (b) flat field correction, (c) correction for the absolute reflectance properties of Spectralon. Step a removed instrument spatial and spectral non-uniformities, while steps b and c corrected for reflectance data. Then, the Savizky–Golay filtering (SG) method [47,48] was selected to fit the data to improve the signal-to-noise ratio (S/N) [49].
(2) Image processing: The SWIR hyperspectral images were processed using ENVI 4.7 processing software. The mineral represented by each reference spectrum was determined by comparing the spectrum with the SWIR spectral United States Geological Survey (USGS) spectral library [50]. A customer library was established for mineral identification.
(3) Mineral recognition: To address the dimensionality and separate the noise from the data problem of hyperspectral data, a forward maximum noise fraction (MNF) transform was performed on the image. The pixel purity index (PPI) of HySpex data was calculated, based on the data transformed by MNF, using PPI tools, to obtain the purest pixel of spectrum. We combined the n-D Visualizer tool with results after MNF and PPI, used to localize, recognize and collect the purest pixel of data, to obtain pure end member spectrum. Next came matching pixel and reference spectra in n-D angle, using spectrum angle mapping (SAM), and judging the similarity of end member and reference spectra by calculating the angle between them—the smaller the angle is, the higher the degree of matching and similarity (Figure 4).
(4) Spectral parameter extraction: The feature minerals of chlorite and garnet in the alteration map were masked to obtain the single thematic layer. The mineral map of hySpex data was extracted from mineral spectral parameters (the absorption wavelength position and depth of samples) by continuum-removal.
An initial set of reference spectra by manually selecting some to represent the observed variability in the measured SWIR hyperspectral images. As shown in Figure 5b, chlorite SMR-13 standard spectrum in USGS spectrum library refers to when G 05 is a filter and spectral angle matching is carried out. Among them, the most sensitive wavelength is located near 2250 nm. Figure 5a shows the quartz spectral characteristics in the high-grade iron ore, which is slightly more weakly absorbing than quartz HS32 in the standard spectrum, and the overall waveform is consistent. Namely, it is mainly composed of water absorption characteristics of 1400 and 1900, and absorption characteristics of Fe and Mg around 2250–2350 nm. Figure 5c refers to an arbitrary garnet short-wave infrared spectrum. This mineral is different from chlorite and quartz, and the overall spectrum is relatively gentle. Note the obvious absorption feature near 1200 nm, which probably resulted from the Fe2+ crystal field effect of garnet.
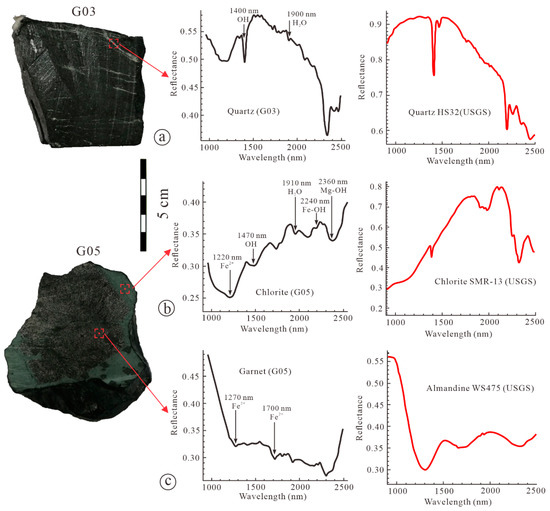
Figure 5.
Spectral curves of different rock types and standard spectrum: (a) quartz; (b) chlorite; (c) garnet.
4. Results
4.1. Microscopic Mineral Identification and Alteration Zonation
The main minerals in this sampling cross-section were magnetite, chlorite and garnet, with a small amount of quartz. The magnetite was black and massive. There were two types of magnetite, one of which was fine grained and denser with high iron content, and the other coarse grained, euhedral and with low content (Figure 6a,b). The main altered rocks closely related to the mineralization were dark green, and were mainly composed of garnet and chlorite. From the high-grade iron ore to the periphery, the garnet in the alteration wall rocks gradually decreases, while the chlorite increases. According to the hydrothermal minerals and their paragenesis, the alteration types can be classified into three categories, i.e., the proximal chlorite-garnetization, the transitional garnet-chloritization and the distal chloritization (Figure 6).
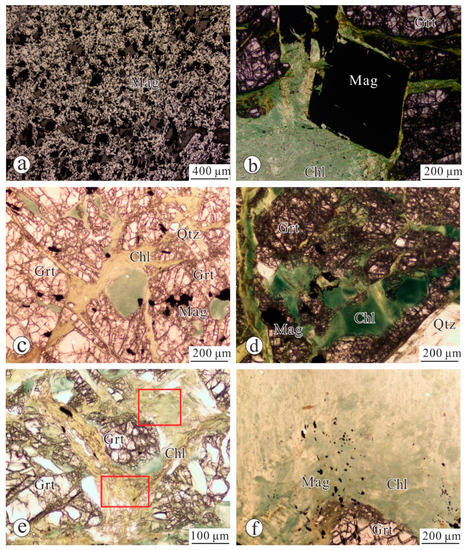
Figure 6.
Photomicrographs showing the representative mineral assemblage and texture of iron ore and wall-rock from the Gongchangling number 2 mining area. (a) high-grade magnetite (Mag) under a reflected light microscope; (b) magnetite of large grain size (c) chlorite garnetite consisting of garnet (Grt) and chlorite (Chl), showing porphyroblastic texture (plane-polarized light); (d) garnetic chloritite; (e) and (f) chloritite.
Proximal to the high-grade iron ore body, G 05 is the chlorite–garnetite, and garnet accounts for more than 75%. It is stratiform and occurred in the top and bottom of the high-grade iron body. Garnet is broken, fleshy red, subhedral-anhedral and has no zoning structure. Quartz and magnetite are mostly scattered in the garnet. Chlorite is mainly disseminated around garnet or in the cracks. Chlorite is mostly dark green or yellowish green (Figure 6c).
In transitional zone, G 06 is the garnetic chloritite, mainly composed of garnet, chlorite and a small amount of quartz and magnetite. The chlorite is greenish to dark green and accounts for more than 60% of total content of the rock. Usually the chlorite is scattered within garnet in the form of stockwork. The garnet is subhedral-anhedral, relatively small and grayish brown. In most cases, the content of garnet in this alteration zone is less than 30% (Figure 6d).
G 07 belongs to the distal chloritite zone, and mainly consists of dark or emerald green chlorite (more than 75%) with a variable amount of garnet debris (less than 20%), whose grain size is too small to be recognized by naked eyes. Occasionally there occur small amounts of magnetite and quartz. Magnetite usually scatters in chlorite. As shown in red box in Figure 6e, some garnet is probably metasomatized into chlorite, especially at the boundary (Figure 6e,f).
4.2. Hyperspectral Mapping Alteration Minerals
Generally, the rock chips are larger than the thin sections, which means that the results of hyperspectral mineral mapping can indicate the mineral types and their distributions at a larger scale. Figure 7 illustrates that the results of hyperspectral mineral identification are in excellent agreement with the overall mineral identification of the sample and microscopic identification. G 05, G 06 and G 07 are altered surrounding rocks, and the following is a detailed description of the form of alteration zoning.
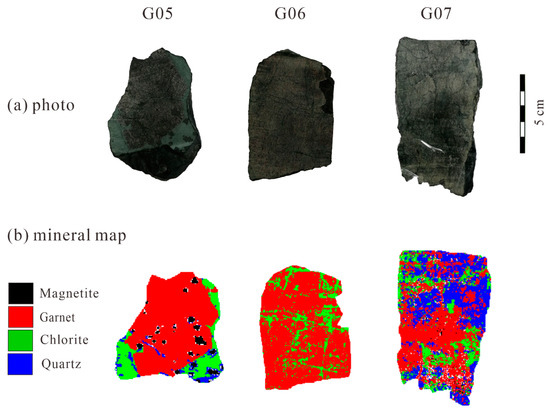
Figure 7.
Identified minerals derived from the HySpex image.
G 05, adjacent to the high-grade iron ore, is the altered wall rock and mainly contains garnet, chlorite and magnetite, in which garnet accounts for about 75% and the chlorite accounts for about 20%. Chlorite grows around garnet and contains a few fine grains of quartz. The garnet grains are relatively complete and are infilled slightly by chlorite. As shown in Figure 7, some small magnetite grains are contained in garnet and show straight boundaries with garnet and chlorite.
G 06 mainly consisted of garnet and chlorite, in which garnets accounted for about 90% of the whole sample; chlorite accounted for 10%. The distribution was concentrated for chlorite, while dispersed for garnet. The garnet always displayed cataclastic texture, and was infilled and replaced by chlorite as veins. Compared to G 05, The content of chlorite increased obviously.
G 07 is mainly composed of chlorite, garnet and quartz, in which garnet accounts for about 40%, chlorite accounts for about 30% and quartz accounts for about 30%. Disseminated chlorite grows around garnet and infills cracks in garnet, and quartz veins filled the boundary between garnet and chlorite. Garnet, including a few fine grains of magnetite, is infilled and replaced by chlorite and quartz. It is worth noting that there is a quartz veinlet on the upper part, which is supposed to be the late stage of alteration. The concentrating degree of garnets is decreasing from the proximal to distal part of high-grade iron ore.
The spectrum results are consistent with the observation of hand specimens and results under a microscope. The relative contents of garnet in the three samples are higher than the identification results under microscope, possibly resulting from the loss of chlorite, a soft phyllosilicate, during rock chipping.
4.3. Mapping Spectral Features of Alteration Zonation
The mineral composition of altered surrounding rocks in the Gongchangling rich iron deposit is relatively simple. In consideration of alteration classification scheme proposed by Meyer and Hemley [4], combining the research habits of most domestic scholars, the alteration zonation was divided into the most abundant minerals in the altered rock: i.e., a chlorite–garnet zone, a garnet–chlorite zone and a chlorite zone.
There are many spectral parameters in the short-wave infrared spectrum, and the spectral information such as wavelength position and absorption depth are most used at present. The wavelength is usually sensitive to the chemical compositions of specific minerals, while the absorption depth is often related to the mineral abundance. Based on the macroscopic zonation, the spectral parameters of the extracted single mineral were analyzed to obtain more detailed characteristic information. Since garnet and chlorite are closely related to the mineralization of high-grade iron ore, their spectral features can provide subtle information on the physiochemical conditions of ore-forming processes. Therefore, the spectral characteristics at ca. 1200 nm, which are considered to be caused by Fe2+ [51,52] being shared by the two minerals, have been selected to characterize the intrinsic chemical and/or structural variations of the specific minerals. To highlight the transformation regular, a threshold was set, according to the spectral features at 1200 nm of chlorite and garnet, for the classifying spectrum. The threshold was 20 nm for wavelength position, and 0.02 for absorption depth.
In the garnet-chlorization zone, the wavelength position of chlorite ranges from 1210.0 to 1230.0 nm and 1250.0 to 1270.0 nm, and absorption depth from 0.02 to 0.06; as for garnet, the wavelength position ranges from 1190.0 to 1210.0 nm and 1250.0 to 1270.0 nm, and absorption depth from 0.02 to 0.06, a very small part of 0.06–0.08 (Figure 8). The overall spectral features can be summarized as “intermediate wavelength of garnet–chlorite; intermediate depth of garnet–chlorite.”
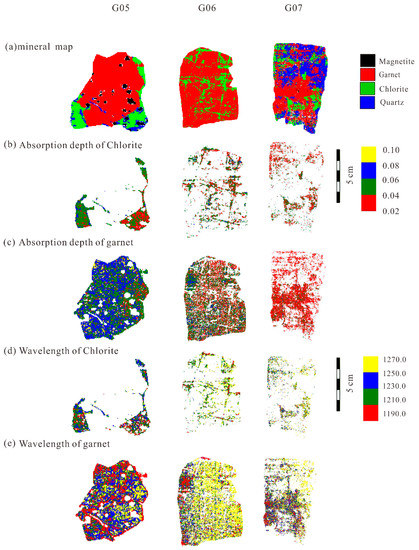
Figure 8.
Map of spectral absorption depth and wavelength position at 1200 nm, showing the variability of the alterations in the rock.
In the chloritization zone, the wavelength position of chlorite ranges from 1250.0 to 1270.0 nm, and absorption depth from 0.02 to 0.04; as for garnet, the wavelength position ranges from 1190.0 to 1210.0 nm and 1250.0 to 1270.0 nm, and absorption depth from 0.02 to 0.04 (Figure 8). In comparation with those in the other two zones, the overall spectral features can be summarized as “longer wavelength and small depth of chlorite.” Garnet’s concentration area can be seen as a little shallow spectrally, and the scattered visible part of chlorite at the intersection of chlorite and garnet has greater absorption depth.
5. Discussion
The features of the wall rock in Gongchangling high-grade iron ore were studied by systematic sampling, observation under microscope and identification of HySpex hyperspectral images. Chlorite, garnet and other silicates have regular evolutionary sequences in different geological environments. In turn, the reaction sequences of typical minerals can be used as indicators of their geological environmental formation to a large extent [53]. HySpex hyperspectral data show that the spectral parameters always changed regularly in the same mineral and in different alteration zones, which contains vitally more accurate indication on the micro scale for processes of alteration and mineralization. There is a gradual change between the altered rock and the ore-rich body, and the spectral information is obviously zonal [11].
5.1. Spectral Parameters and Their Implications for Redox Conditions
In alteration wall rocks of Gongchangling high-grade iron ore, the changes of wavelength position and absorption depth at ca. 1200 nm wavelength position represent the content Fe2+ in octahedron lattice position for chlorite and dodecahedron lattice position for garnet. With the gradual increase content of Fe2+, the wavelength position moves towards the short wavelength direction and the absorption depth increases dependently [11,54,55,56].
The chlorite and garnet in alteration rocks of Gongchangling iron deposit were analyzed emphatically. Fe2+ could result in a crystal field effect, due to the spin-allowed transition between the Eg and T2g levels into which the D ground state splits in an octahedral field, which is the most important factor for the spectroscopy [57]. In previous research, the absorption band, caused by the crystal field effect and electron transition of Fe2+ at 1000–1200 nm, resulted from to the large amount of Fe2+ in chlorite and other phyllosilicates [57]. The absorption peak wavelength position moves towards the long wavelength direction with decreased content of Fe2+ [52,56]. The absorption characteristic of Fe2+ at 1200 nm generally is sixth coordination divalent iron for chlorite, and eighth coordination iron divalent for garnet [11]. If iron ion is located in a complete octahedral lattice site, and only one spin allows transition, it will produce a characteristic band in the visible and near-infrared region. However, when the octahedral position is distorted and the iron ion is in the non-equivalent position, another characteristic transition will occur [57]. Therefore, the spectral features of Fe2+ have been used to obtain information on the changes of mineral texture and implications for mineralization environment.
From proximal ore bodies to the outer zones of wall rocks, the movement of wavelength position towards the long wavelength direction and the decreases of absorption depth for chlorite and garnet indicated a gradual decrease in the content of Fe2+, a change of water–rock interaction and a relatively reductive environment of the formation for the whole altered rock. Additionally, it is implied that the garnet’s formation environment is more reductive and higher in water–rock interactions in proximal than distal ore bodies. That is consistent with the previous research; therefore, the content of Fe2+ revealed by HySpex spectrum can be vector of deposit exploration.
5.2. Spectral Alteration Zonation
Traditional zoning, based on mineral assemblage and a symbiotic relationship, has been widely used to solve many problems. The spectral features can reveal some features of mineralogy more deeply, so spectral alteration zonation is proposed. In this paper, the relative content changes of chlorite and garnet are used as indicators for identifying minerals. Therefore, the alteration information of Fe2+ in alteration rocks was extracted separately, and the spectral alteration zoning was studied according to the microscopic alteration phenomenon, which is used as the micro prospecting standard for the Gongchangling magnetite deposit. It is divided into three spectral alteration zones, the shorter-wavelength zone, the transitional zone and the longer-wavelength zone.
The combination of traditional and spectral alteration zones can better indicate the regular change of alteration rock during mineralization. In Gongchangling deposit, magnetite mineralization and wall rock alterations are consistent in both time and space, and each are relatively reductive environments, which was revealed by the HySpex spectrum data and results of traditional geological methods and is in consistent with the previous studies, including fluid inclusions, whole rock geochemistry analysis and rare earth trace elements analysis [27,29,36,40]. Hence, the alteration zonation results according to the HySpex spectrum are credible.
According to the real geological background, the shorter-wavelength zone corresponds to the high-grade iron ore, while the longer-wavelength zone corresponds to distal alteration of the wall rock, which is a visual indicator and estimates marking on the macroscopic scale for the HySpex spectrum. It can not only indicate the existence of blind ore bodies, but also predict the locations of ore bodies according to the types and characteristics of altered rocks.
6. Conclusions
Spectral alteration zoning proved to be a fast and effective method to indicate systematic changes in data extracted from mineralogical maps. The same mineral composition changes to some degree, and this method can easily identify the microscopic mineral differences between the alteration rocks with the same or similar mineral assemblages. In this paper, the HySpex imaging hyperspectral data of Gongchangling high-grade ore in Anshan-Benxi area were used for mineral identification and spectral alteration zoning, and the following conclusions are drawn:
1. The microscopic observation and hyperspectral mineral identification indicate that the main minerals in the altered rocks of Gongchangling high-grade ore are garnet, chlorite, quartz and magnetite. According to the type, content and paragenesis of hydrothermal minerals, the alteration type can be divided into three alteration zones: the chlorite–garnet zone, the garnet–chlorite zone and the chlorite zone.
2. The wavelength positions of characteristic altered minerals in the altered wall rocks shift significantly. The absorption depth of chlorite and garnet increases from proximal to distal to the high-grade iron ore body. It is indicated that with the gradual decrease in the content of Fe2+, there is a change in the water–rock interaction and the relatively reductive environment of the formation for whole alteration rock. This rule can be used as an exploration rule of similar rich iron ore bodies in the future.
3. Since the spectral features of some specific minerals can manifest special mineralogical, compositional or crystal information, the convectional alteration zonation combined with the hyperspectral features of particular minerals can provide more detailed metallogenetic information; thus, the nomenclature of spectral alteration zonation is promoted in this paper. As for Gongchangling high-grade iron ore, three spectral alteration zones were allocated, i.e., the proximal short-wavelength large depth chlorite–garnet zone, the transitional garnet–chlorite zone and the distal long-wavelength small depth of chlorite zone.
4. Using the regular changes of the spectral characteristics of Fe2+ at 1200 nm as the basis for zonation, we proposed a new concept of spectral alteration zonation, which could obtain more information concerning mineralization. The method of spectral alteration zoning mainly studies information of altered minerals, such as texture, composition and crystal coordination, to reveal the genesis of ore deposits, which is suitable not only for iron ore deposits but also for hydrothermal deposits developed by other altered rocks.
Author Contributions
Conceptualization and writing—original draft preparation, K.S.; Writing—review and editing and supervision, E.W.; methodology and software, Y.Y. and J.F.; validation, X.Y. and D.H. All authors have read and agreed to the published version of the manuscript.
Funding
This research was funded by the National Key Research and Development Program of China (grant 2016YFC0801603).
Acknowledgments
We thank DiMap for access to the HySpex instruments used in the PSML, and we are also deeply indebted to the Gongchangling iron deposit, Anshan Iron and Steel Group, for their kind help in field investigation and sampling.
Conflicts of Interest
The authors declare no conflict of interest.
References
- Rose, A.W.; Burt, D.M. Hydrothermal Alteration. In Geochemistry of Hydrothermal Ore Deposits; Barnes, H.L., Ed.; Library of Congress: Washington, DC, USA, 1979; pp. 176–227. [Google Scholar]
- Pirajno, F. Hydrothermal Processes and Mineral Systems; Springer Netherlands: Amsterdam, The Netherlands, 2009. [Google Scholar]
- Meyer, C. Wall rock alteration. In Geochemistry of Hydrothermal Ore Deposits; Barnes, H.L., Ed.; Holt, Rinehart and Winston, Inc.: New York, NY, USA, 1967; pp. 166–235. [Google Scholar]
- Meyer, C.; Hemley, J. Hydrothermal Alteration in Some Granodiorites. Clays Clay Miner. 1957, 6, 89–100. [Google Scholar] [CrossRef]
- Asadzadeh, S.; de Souza Filho, C.R. Spectral remote sensing for onshore seepage characterization: A critical overview. Earth Sci. Rev. 2017, 168, 48–72. [Google Scholar] [CrossRef]
- Mathieu, M.; Roy, R.; Launeau, P.; Cathelineau, M.; Quirt, D. Alteration mapping on drill cores using a HySpex SWIR-320m hyperspectral camera: Application to the exploration of an unconformity-related uranium deposit (Saskatchewan, Canada). J. Geochem. Explor. 2017, 172, 71–88. [Google Scholar] [CrossRef]
- Greenberger, R.N.; Ehlmann, B.L.; Jewell, P.W.; Birgenheier, L.P.; Green, R.O. Detection of organic-rich oil shales of the green river formation, Utah, with ground-based imaging spectroscopy. In Proceedings of the 2016 8th Workshop on Hyperspectral Image and Signal Processing: Evolution in Remote Sensing (WHISPERS), Los Angeles, CA, USA, 21–24 August 2016; pp. 1–5. [Google Scholar]
- Krupnik, D.; Khan, S. Close-range, ground-based hyperspectral imaging for mining applications at various scales: Review and case studies. Earth Sci. Rev. 2019, 198, 102952. [Google Scholar] [CrossRef]
- Greenberger, R.N.; Mustard, J.F.; Ehlmann, B.L.; Blaney, D.L.; Cloutis, E.A.; Wilson, J.H.; Green, R.O.; Fraeman, A.A. Imaging spectroscopy of geological samples and outcrops: Novel insights from microns to meters. GSA Today 2015, 25, 4–10. [Google Scholar]
- Hunt, G.R. Visible and near-infrared spectra of minerals and rocks: I silicate minerals. Mod. Geol. 1970, 1, 283–300. [Google Scholar]
- Hunt, G.R. Spectra of altered rocks in the visible and near-infrared. Econ. Geol. 1979, 74, 1613–1629. [Google Scholar]
- Clark, R.N. High Spectral Resolution Reflectance Spectroscopy of Minerals. J. Geophys. Res. 1990, 95, 12653–12680. [Google Scholar] [CrossRef]
- Lenhard, K.; Baumgartner, A.; Schwarzmaier, T. Independent Laboratory Characterization of NEO HySpex Imaging Spectrometers VNIR-1600 and SWIR-320m-e. IEEE Trans. Geosci. Remote Sens. 2015, 53, 1828–1841. [Google Scholar] [CrossRef]
- Greenberger, R.N.; Mustard, J.F.; Cloutis, E.A.; Mann, P.; Wilson, J.H.; Flemming, R.L.; Robertson, K.M.; Salvatore, M.R.; Edwards, C.S. Hydrothermal alteration and diagenesis of terrestrial lacustrine pillow basalts: Coordination of hyperspectral imaging with laboratory measurements. Geochim. Cosmochim. Acta 2015, 171, 174–200. [Google Scholar] [CrossRef]
- Graham, G.E.; Kokaly, R.F.; Kelley, K.D.; Hoefen, T.M.; Johnson, M.R.; Hubbard, B.E. Application of Imaging Spectroscopy for Mineral Exploration in Alaska: A Study over Porphyry Cu Deposits in the Eastern Alaska Range. Econ. Geol. 2018, 113, 489–510. [Google Scholar] [CrossRef]
- Kumar, V.; Mohan, A.; Agarwal, S.; Siddiqui, A. Evaluating the Close Range Hyperspectral Data for Feature Identification and Mapping. J. Indian Soc. Remote 2019, 47, 447–454. [Google Scholar] [CrossRef]
- Haest, M.; Cudahy, T.; Laukamp, C.; Gregory, S. Quantitative Mineralogy from Infrared Spectroscopic Data. I. Validation of Mineral Abundance and Composition Scripts at the Rocklea Channel Iron Deposit in Western Australia. Econ. Geol. 2012, 107, 209–228. [Google Scholar] [CrossRef]
- Haest, M.; Cudahy, T.; Laukamp, C.; Gregory, S. Quantitative Mineralogy from Infrared Spectroscopic Data. II. Three-Dimensional Mineralogical Characterization of the Rocklea Channel Iron Deposit, Western Australia. Econ. Geol. 2012, 107, 229–249. [Google Scholar] [CrossRef]
- Fox, N.; Parbhakar-Fox, A.; Moltzen, J.; Feig, S.; Goemann, K.; Huntington, J. Applications of hyperspectral mineralogy for geoenvironmental characterisation. Miner. Eng. 2017, 107, 63–77. [Google Scholar] [CrossRef]
- Meer, F.v.d. Near-infrared laboratory spectroscopy of mineral chemistry: A review. Int. J. Appl. Earth OBS 2018, 65, 71–78. [Google Scholar] [CrossRef]
- Murphy, R.J.; Van Kranendonk, M.J.; Kelloway, S.J.; Wainwright, I.E. Complex patterns in fossilized stromatolites revealed by hyperspectral imaging (400–2496 nm). Geobiology 2016, 14, 419–439. [Google Scholar] [CrossRef]
- Dalm, M.; Buxton, M.W.N.; van Ruitenbeek, F.J.A. Discriminating ore and waste in a porphyry copper deposit using short-wavelength infrared (SWIR) hyperspectral imagery. Miner. Eng. 2017, 105, 10–18. [Google Scholar] [CrossRef]
- Thompson, A.J.B. Alteration mapping in exploration: Application of short wave infrared (SWIR) spectroscopy. Econ. Geol. Newsl. 1999, 30, 13. [Google Scholar]
- Huston, D.L.; Kamprad, J. Zonation of Alteration Facies at Western Tharsis: Implications for the Genesis of Cu-Au Deposits, Mount Lyell Field, Western Tasmania. Econ. Geol. 2001, 96, 1123–1132. [Google Scholar] [CrossRef]
- Van Ruitenbeek, F.J.A.; Cudahy, T.J.; van der Meer, F.D.; Hale, M. Characterization of the hydrothermal systems associated with Archean VMS-mineralization at Panorama, Western Australia, using hyperspectral, geochemical and geothermometric data. Ore Geol. Rev. 2012, 45, 33–46. [Google Scholar] [CrossRef]
- Kokaly, R.F.; Hoefen, T.M.; Graham, G.E.; Kelley, K.D.; Johnson, M.R.; Hubbard, B.E.; Goldfarb, R.J.; Buchhorn, M.; Prakash, A. Mineral information at micron to kilometer scales: Laboratory, field, and remote sensing imaging spectrometer data from the orange hill porphyry copper deposit, Alaska, USA. In Proceedings of the 2016 IEEE International Geoscience and Remote Sensing Symposium (IGARSS), Beijing, China, 10–15 July 2016; pp. 5418–5421. [Google Scholar]
- Li, H.; Zhang, Z.; Li, L.; Zhang, Z.; Chen, J.; Yao, T. Types and general characteristics of the BIF-related iron deposits in China. Ore Geol. Rev. 2014, 57, 264–287. [Google Scholar] [CrossRef]
- Wang, S.L. The genetic types of rich iron deposits of Anshan roup in AnShan-Benxi area. Miner. Depos. 1986, 5, 14–22, (In Chinese with English abstract). [Google Scholar]
- Zhou, S.T. Geology of BIF Iron Deposits in Anshan-Benxi; Geology Press: Beijing, China, 1994; pp. 1–278. (In Chinese) [Google Scholar]
- Zhen, Z.; Lan, H.Y. Discussion on geological characteristics and genesis of Gongchangling Rich iron ore deposit. Modern Mine 2009, 25, 67–70. (In Chinese) [Google Scholar]
- Liu, J.; Jin, S.Y. Geochemical characteristics and original rock restoration of plagioclase amphibolites in the Gongchangling iron deposit, Liaoning Province. Geol. China 2010, 37, 84–93, (In Chinese with English abstract). [Google Scholar]
- Cheng, Y.C. Problems on the genesis of the high-grade ore in the pre-sinian (pre-cambrian) banded iron ore deposits of the Anshan-type of LiaoNing and ShanTung provinces. Acta Geol Sin. 1957, 37, 39–136, (In Chinese with English abstract). [Google Scholar]
- Zheng, B.D. Several problems for the fomation of Gongchangling iron ore. Geol. Explor. 1958, 12, 12–20. (In Chinese) [Google Scholar]
- Guan, G.Y. On the significance of metamorphism in the formation of anshan type iron ore deposits. Acta Geol. Sin. 1961, 41, 67–78. (In Chinese) [Google Scholar]
- Li, H.M.; Liu, M.J.; Li, L.X.; Yang, X.Q.; Chen, J.; Yao, L.D.; Hong, X.K.; Yao, T. Geology and geochemistry of the marble in the Gongchangling iron deposit in Liaoning Province and their metallogenic significance. Acta Petrol. Sin. 2012, 31, 69–84, (In Chinese with English abstract). [Google Scholar]
- Wang, E.D.; Xia, J.M.; Fu, J.F.; Jia, S.S.; Men, Y.K. Formation mechanism of Gongchangling high-grade magnetite deposit hosted in Archean BIF, Anshan-Benxi area, Northeastern China. Ore Geol. Rev. 2014, 57, 308–321. [Google Scholar]
- Wang, E.D.; Han, C.I.; Xia, J.M.; Fu, J.F.; Li, G.S.; Jia, S.S.; Men, Y.K. Geochemical characterization of Archaean amphibolites from the eastern part of Anshan–Benxi iron producing area, northeastern China: Implication for tectonic setting of BIFs. Geol. J. 2016, 51, 480–498. [Google Scholar]
- Shen, B.F. The Archean Geology and Mineralization of the Northern—Jinan; Geology Press: Beijing, China, 1994; pp. 1–255. [Google Scholar]
- Li, H.-M.; Yang, X.-Q.; Li, L.-X.; Zhang, Z.-C.; Liu, M.-J.; Yao, T.; Chen, J. Desilicification and iron activation–reprecipitation in the high-grade magnetite ores in BIFs of the Anshan-Benxi area, China: Evidence from geology, geochemistry and stable isotopic characteristics. J. Asian Earth Sci. 2015, 113, 998–1016. [Google Scholar] [CrossRef]
- Li, L.-X.; Zi, J.-W.; Li, H.-M.; Rasmussen, B.; Wilde, S.A.; Sheppard, S.; Ma, Y.-B.; Meng, J.; Song, Z. High-Grade Magnetite Mineralization at 1.86 Ga in Neoarchean Banded Iron Formations, Gongchangling, China: In Situ U-Pb Geochronology of Metamorphic-Hydrothermal Zircon and Monazite. Econ. Geol. 2019, 114, 1159–1175. [Google Scholar] [CrossRef]
- Chen, G.Y.; Li, M.H.; Wang, X.F.; Sun, D.S.; Sun, C.M.; Wang, Z.F.; Su, Y.X.; Lin, J.X. Genetic mineralogy of Gongchangling Iron Mine. Mineral. Petrol. 1984, 4, 7–19. (In Chinese) [Google Scholar]
- Li, Y.; Hou, K.; Wan, D.; Zhang, Z.; Yue, G. Precambrian banded iron formations in the North China Craton: Silicon and oxygen isotopes and genetic implications. Ore Geol. Rev. 2014, 57, 299–307. [Google Scholar]
- Wan, Y.; Xie, S.; Yang, C.; Kroner, A.; Ma, M.; Dong, C.; Du, L.; Xie, H.; Liu, D. Early Neoarchean (2.7 Ga) tectono-thermal events in the North China Craton: A synthesis. Precambrian Res. 2014, 247, 45–63. [Google Scholar]
- Shen, Q.H.; Song, H.X. Progress, prospecting and key scientific problems in origin researches of high-grade iron ore of the banded iron formation (BIF) in the North China Craton. Acta Petrol. Sin. 2015, 31, 2795–2815. [Google Scholar]
- Zhai, M.; Zhu, X.; Zhou, Y.; Zhao, L.; Zhou, L. Continental crustal evolution and synchronous metallogeny through time in the North China Craton. J. Asian Earth Sci. 2020, 194, 104169. [Google Scholar] [CrossRef]
- Kurz, T.H.; Buckley, S.J.; Howell, J.A. Close-range hyperspectral imaging for geological field studies: Workflow and methods. Int. J. Remote Sens. 2013, 34, 1798–1822. [Google Scholar] [CrossRef]
- Ruffin, C.; King, R.L.; Younan, N.H. A Combined Derivative Spectroscopy and Savitzky-Golay Filtering Method for the Analysis of Hyperspectral Data. GISci. Remote Sens. 2008, 45, 1–15. [Google Scholar] [CrossRef]
- Chen, J.; Jönsson, P.; Tamura, M.; Gu, Z.; Matsushita, B.; Eklundh, L. A simple method for reconstructing a high-quality NDVI time-series data set based on the Savitzky–Golay filter. Remote Sens. Environ. 2004, 91, 332–344. [Google Scholar] [CrossRef]
- Hao, D.; Yao, Y.; Fu, J.; Michalski, J.R.; Song, K. The Laboratory-Based HySpex Features of Chlorite as the Exploration Tool for High-Grade Iron Ore in Anshan-Benxi Area, Liaoning Province, Northeast China. Appl. Sci. 2020, 10, 7444. [Google Scholar] [CrossRef]
- Clark, R.N.; Swayze, G.A.; Wise, R.A.; Livo, K.E.; Hoefen, T.M.; Kokaly, R.F.; Sutley, S.J. USGS Digital Spectral Library Splib06a; No. 231; US Geological Survey: Reston, VA, USA, 2007.
- Burns, R.G. Origin of electronic spectra of minerals in the visible and near-infrared region. In Remote Geochemical Analysis: Elemental and Mineralogical Composition; Cambridge University Press: New York, NY, USA, 1993; pp. 3–30. [Google Scholar]
- Bishop, J.L.; Lane, M.D.; Dyar, M.D.; BROWN, A.J. Reflectance and emission spectroscopy study of four groups of phyllosilicates: Smectites, kaolinite-serpentines, chlorites and micas. Clay Miner. 2008, 43, 35–54. [Google Scholar]
- Hunt, G.R.; Salisbury, J.W. Visible and near-infrared spectra of minerals and rocks: XII. Metamorphic rocks. Mod. Geol. 1976, 5, 219–228. [Google Scholar]
- Chakraborty, S. Compositional Zoning and Cation Diffusion in Garnets. Diffus. Atomic Ordering Mass Transp. Adv. Geochem. 1991, 8, 120–175. [Google Scholar]
- Burns, R.G. Mineralogical Applications of Crystal Field Theory; Cambridge University Press: London, UK, 1993. [Google Scholar]
- King, T.V.V.; Clark, R.N. Spectral characteristics of chlorites and Mg-serpentines using high-resolution reflectance spectroscopy. J. Geophys. Res. Solid Earth 1989, 94, 13997–14008. [Google Scholar] [CrossRef]
- Clark, R.N. Spectroscopy of rocks and minerals, and principles of spectroscopy. In Remote Sensing for the Earth Sciences; Rencz, A.N., Ed.; John Wiley and Sons: New York, NY, USA, 1999; pp. 3–58. [Google Scholar]
Publisher’s Note: MDPI stays neutral with regard to jurisdictional claims in published maps and institutional affiliations. |
© 2020 by the authors. Licensee MDPI, Basel, Switzerland. This article is an open access article distributed under the terms and conditions of the Creative Commons Attribution (CC BY) license (http://creativecommons.org/licenses/by/4.0/).