Abstract
General studies examining reservoir bank deformation during its impoundment primarily consider the coupling effect between the seepage field and the stress field, but thermal field variation in the bedrock and its effect are rarely considered. In this paper, a case study concerning a 285.5 m high arch dam project, where a valley narrowing deformation occurs after the initial impoundment, is implemented. An analysis of in situ measurement is given to interpret the causes of the unique hydro-thermal phenomenon of the project. Possible reasons for the valley narrowing deformation pattern are discussed. A numerical model based on the thermo-hydro-mechanical (THM) coupling theory of porous medium is used to calculate the evolution processes of the thermal, seepage, and stress fields of the area after impoundment of the reservoir. The simulated deformation trend and pattern of the river valley are consistent with the monitoring data. The results demonstrate that water infiltration after impounding cools the bedrock and the temperature decrease makes the bedrock contract, which induces the narrowing deformation of the valley. Factor analysis of the hydrothermal field shows that temperature variation is the main cause of long-term deformation. Thus, it shall be considered as a key factor in terms of structural safety assessment. Furthermore, sensitivity analysis of the hydraulic conductivities of rock strata suggests that future development of the deformation can be eased off if the anti-seepage method is adopted on the bedrock.
1. Introduction
Valley narrowing deformation is a phenomenon that riverbanks deform to their free faces and narrow the valley width. High arch dams, which are mainly located in narrow valleys, are sensitive to this kind of deformation because of their particular shape. Several arch dams were squeezed to crack by the valley narrowing deformation, such as the Beauregard arch dam in northwestern Italy [1] and Zeuzier arch dam in Switzerland [2]. In China, the same kind of deformation has also been reported at the Lijiaxia project [3], Jinping-I project [4], Xiluodu project [5], and several other high arch dams since their initial impoundments. It is a key step to figure out the valley narrowing mechanism to assess the structural safety of a certain dam [6].
Currently, the corresponding mechanisms for valley narrowing deformation of different arch dams are diverse. Classic theory on valley deformation mainly focuses on the slope stability directly affected by stress field changes and seepage field variations [7,8,9]. In the case of the Beauregard arch dam, a deep-seated gravitational slope deformation after impounding was confirmed using long-term monitoring data by integrated techniques [10]. Because of the impoundment, the pore-pressure increased. The increased pore-pressure reduced the effective stresses along the basal shear zone. And the shear strength reduction of the rupture surface induced the plastic deformation of the slope [11]. Research works on the Zeuzier case by Lombardi [2,12] show that the Zeuzier valley was narrowed due to the consolidation settlement of the bedrock, which was induced by tunnel excavation. It was the same case in the Swiss Alps valley. The deformation of several arch dams was observed after the excavation of the Gotthard base tunnel [13,14]. Further studies on horizontal deformation of the Alps valley reveal that cyclic water-table fluctuations in the mountain slopes could induce a cyclic deformation process [15,16,17]. The aforementioned studies examine the mechanism of valley deformation from the perspective of the hydro-mechanical coupling process in the bedrock of arch dams. Both elastic and plastic deformations in the reservoir banks can be induced by the pore-pressure variation because of impoundment, tunnel excavation, or seasonal precipitation changes. In the scope of dam engineering, the valley narrowing deformation is always explained to be a consequence of seepage variation while the effect of thermal field change is often neglected. In fact, the effect of subsurface temperature change on rock deformation has gradually been recognized by studies on tunnels [18], alpine geosystems [19], radioactive waste repositories [20], and many other kinds of fractured rock systems. Gunzburger [21] marks the daily fluctuation of surface temperature as the main cause of the rockfall at Rochers de Valabres slope in France. In the research on a rock slope at Randa (Switzerland), Gischig [22] demonstrates that the thermal effects driven by near-surface temperature cycles can lead to the deformation of deep rock slope. Gruber [23] suggests that a 0.5 °C temperature rise has the potential to induce slope instability.
In Xiluodu, the traditional hydro-mechanical (HM) coupling theory has insufficient explanation because of the project’s unique geological context and deformation pattern. On the one hand, pre-project exploration data spotted the existence of hot spring and abnormal high ground temperature beneath the dam site. On the other hand, the valley narrowing process does not coincide with the reservoir water level or seepage pressure fluctuation. Moreover, the valley narrowing deformation at Xiluodu high arch dam has reached 78 mm in seven years since the initial impoundment, which is near twice as much as the deformation of similar hydropower projects. Thus, new factors shall be taken into account to appropriately explain the deformation mechanisms and evaluate the dam’s long-term safety.
In this paper, basic information and geological features of the reservoir are firstly described and a summary of former analysis [24,25,26] on the geological profile is given to reveal the causes of the project’s geological uniqueness based on observed data (Details in Section 2). After that, seven-year in situ monitoring data of plumb lines and survey lines is closely examined and a unique deformation mode of bedrock is derived (Details in Section 3). Qualitative analysis shows that the valley deformation after the impoundment is consistent along both the river direction and the vertical direction with no sign of interlayer sliding. Based on the analysis above, a three-dimensional coupling thermos-hydro-mechanical (THM) model is reasonably adopted to study the variations of thermal field and seepage field and their effect on the valley narrowing deformation. The numerical results are consistent with displacement and temperature monitoring data recorded at the dam site for over 7 years. The numerical results show that the thermal field variation is the main cause of the long-term deformation after the initial impoundment and it cannot be neglected. The magnitude of valley narrowing is sensitive to the permeability of the bedrock underneath the dam structure. Thus, anti-seepage methods are recommended to reduce further deformation development.
2. Project Overview and Geological Context
Located in the lower reaches of the Jinsha River, Yunnan Province in Southwest China, the Xiluodu hydropower project is China’s second-largest and the world’s third-largest hydropower project, with the total capacity up to 1.267 × 10¹⁰ m3. It is a double curvature arch dam that is 285.5-m high with a 200-m radius. The absolute altitude of the dam’s foundation is 324.5 m. By contrast, the designed normal pool level of the reservoir is 600 m and the corresponding valley width is approximately 500 m. Thirty-one monoliths are planted across the river. The transversal section of the dam is curve-shaped, 14 m wide at the crest, and 60 m wide at the footing. As a typical project for China’s 300 m-high arch dam, it began casting concrete in March 2009. The reservoir began its initial impoundment in March 2012 when the dam was under construction [27]. In September 2014, the reservoir reaches the designed storage water level.
The reservoir area of the dam project is located in the center of a synclinal basin surrounded by limestone outcropped areas as shown in Figure 1. The natural water level of the river varies from 370 m to 390 m above sea level. Geological exploration shows that the river valley is the main outlet of the subsurface runoff.
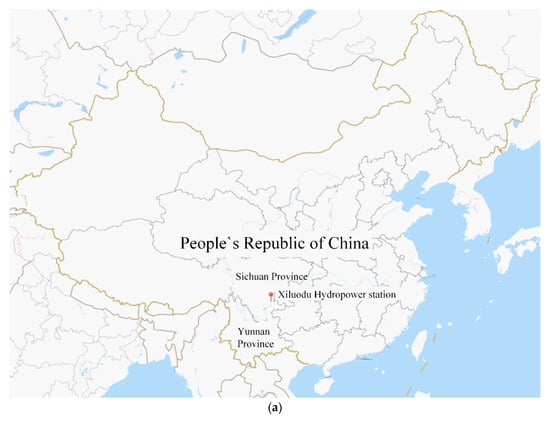
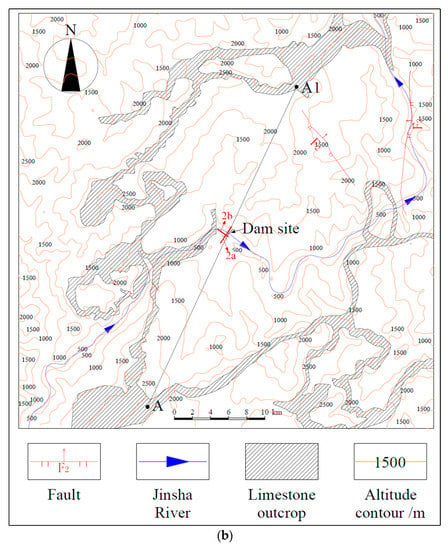
Figure 1.
Overview of the Xiluodu Project: (a) regional location of Xiluodu Project; (b) outline of the limestone outcrops.
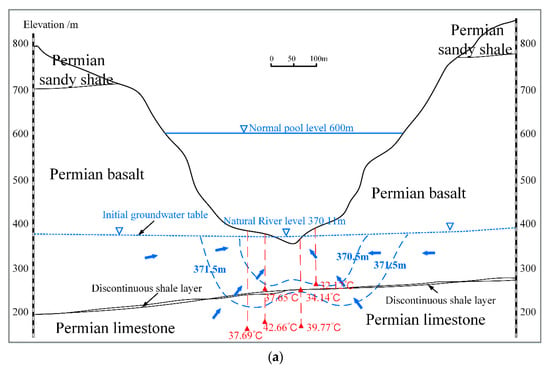
As shown in Figure 2, the reservoir banks are steep and the valley section is nearly U-shaped. Both sides of the valley slope and the river bedrock at the dam site are mainly composed of Permian basalt strata, which are hard, intact, and suitable for arch dam construction. On top of the basalt strata is Permian sandy shale. Approximately 500 m thick Permian limestone stratum lies under the Permian basalt strata with a shale sediment layer between them.
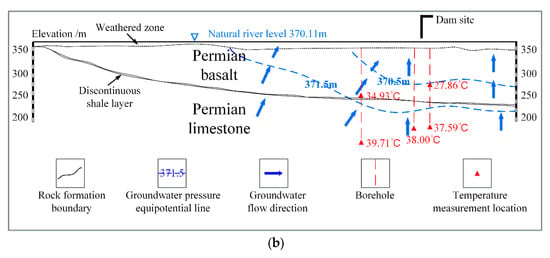
Geological exploration before the construction of the dam showed signs of hot springs and a relatively high geothermal field at the dam site. Temperature measurements in the boreholes revealed that the ground temperature in limestone could be up to 49.6 °C as shown in Figure 3. The average ground temperature in basalt was around 35 °C while the water temperature in the Jinsha River varied from 8 °C to 22 °C.
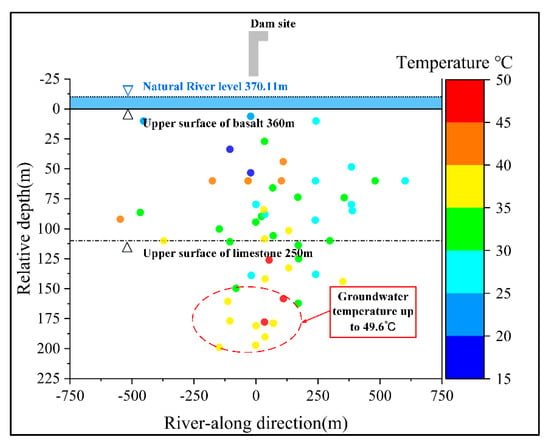
Figure 3.
Measurement during pre-project exploration, the high geothermal phenomenon is revealed near the dam site.
Researchers have tried to explain the high geothermal phenomenon in the aspect of rock permeability [25], groundwater circulation [24], and chemical water-rock interaction [26].
According to the previous studies, the river valley is the main outlet of three different strands of groundwater. The sand shale (P2x) has a low vertical permeability, which means the surface water can only run down along the hillside without infiltrating into the basalt. Thus, the initial groundwater level in basalt is lower than 400 m and mainly controlled by the variation of the river level. The shale sediment layer (P2βn) is a fine aquifuge, causing hydraulic head discontinuity between basalt and limestone. The supply region of groundwater in underlying limestone is its stratum outcrops around the basin where the altitude is above 2000 m. The subsurface runoff is heated up by geothermal flux, which causes geothermal springs and relatively high ground temperature at the dam site. The schematic diagram of groundwater circulation is shown in Figure 4.
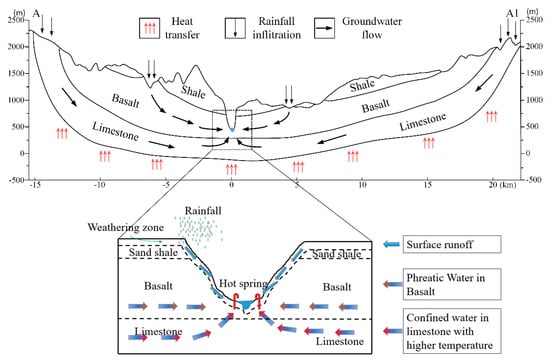
Figure 4.
Schematic diagram of groundwater circulation along the A–A1 section in Figure 1.
3. In Situ Measurement and Analysis on Deformation Pattern
3.1. In Situ Measurement Overview
3.1.1. Valley Narrowing Process
Seven survey lines have been set up to monitor the valley deformation at the dam site. The survey line measures the distance between two points on both sides of the valley, i.e., the valley width, by the laser range finder. The information of the survey lines is shown in Table 1.

Table 1.
Information on the survey line to monitor valley deformation.
Figure 5 shows the location and deformation process of seven survey lines for the valley width with the reservoir level-rising process. The valley width continues decreasing since the beginning of the impoundment. A special trend is observed: All seven survey lines share similar tendencies and deformation amplitudes, regardless of their installation position and elevation. The deformation process has slowed since the first flood season but has not ceased until now. The latest monitoring data shows that the shrinkage deformation is up to 78 mm from 20 December 2012 to 26 July 2019 on average.
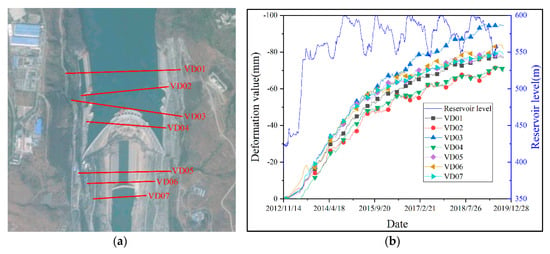
Figure 5.
Basic information on the survey line monitor system: (a) spatial location of seven survey lines; (b) valley narrowing process since the initial impoundment.
3.1.2. Seepage Pressure Process
In the spring of 2019, several boreholes were carried out and seepage measurements were implanted at the bottom of each borehole to obtain the groundwater pressure in limestone. The spatial locations and seepage pressure progress of these boreholes are shown in Figure 6.
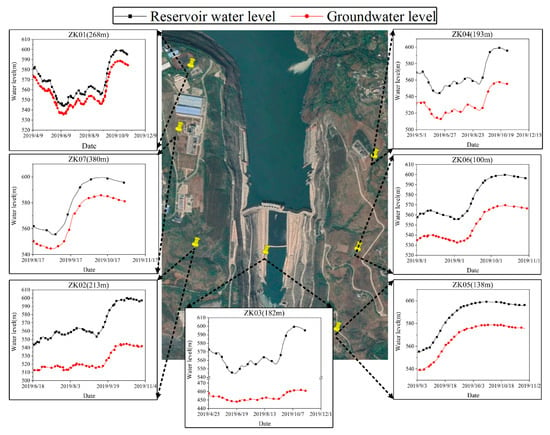
Figure 6.
Location and bottom elevation of the boreholes and their seepage pressure process.
3.1.3. Thermal Field Process
Figure 7 shows two typical curves of upstream and downstream bedrock temperature. The temperature has dropped to 17.5 °C as the reservoir impounded, and the descending trend has not fully converged yet. The previous studies [28,29] have shown that the water temperature at the bottom of the reservoir stabilizes at about 14.5 °C. Therefore, the cooling process of bedrock is still in progress.
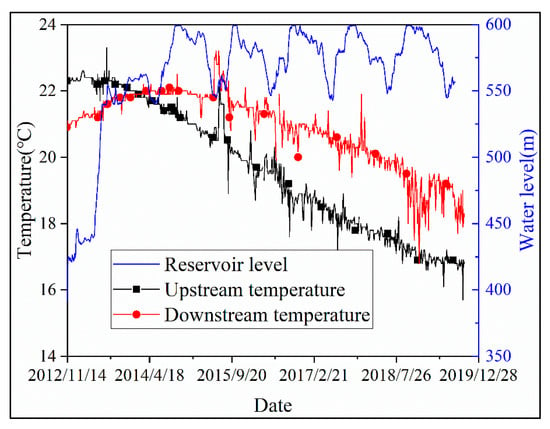
Figure 7.
The process at the bottom of the dam site.
3.2. Bedrock Deformation Results
As shown in Table 2, a strongly positive correlation between reservoir water level and groundwater pressure in limestone is observed while the valley narrowing process has not totally converged yet. Meanwhile, the temperature beneath the dam site decreases to 17.5 °C and is still in progress. Based on the comprehensive consideration of these tendencies, bedrock deformation is derived from the deformation monitoring system and closely examined.

Table 2.
Correlation coefficients between reservoir water level and groundwater level in limestone.
Seven plumb lines and several external deformation supervision points are installed inside the dam to monitor the deformation of the dam. As shown in Figure 8, the red vertical lines represent the plumb lines implanted in the dam, while the blue circles represent external deformation supervision points.
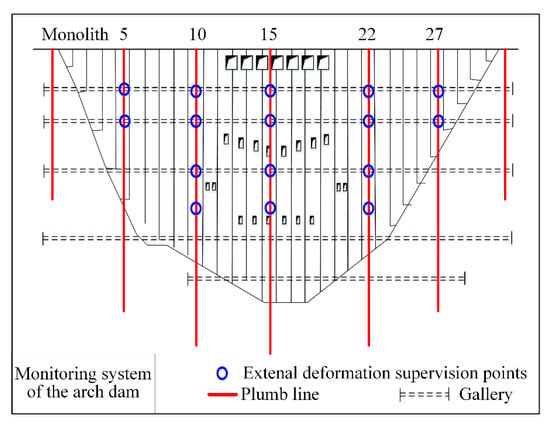
Figure 8.
Layout of the plumb line system and external deformation supervision system.
As plumb lines can monitor the relative deformation between anchoring joints and monitoring points, it is possible to derivate the deformation pattern of bedrock by combining the plumb line with external deformation supervision measurements. More details about the calculation method have been discussed by [30].
The result of bedrock deformation is shown in Figure 9. Two deformation characteristics shall be highlighted. Firstly, the transverse deformation along the vertical direction remains constant, which excludes the possibility of interlayer-gliding. Secondly, the deformation of the riverbed is larger than the dam abutment, which indicates that the limestone underneath the riverbed is the main deform zone, rather than the slope.
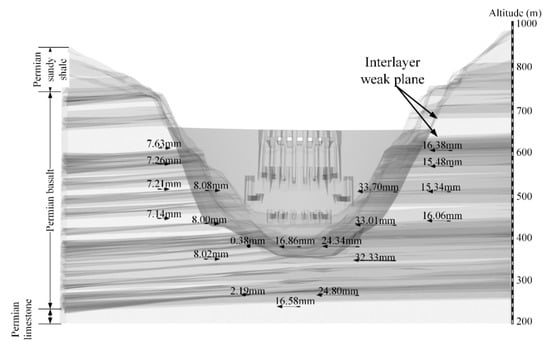
Figure 9.
Horizontal deformation pattern of the rock base (upstream view, November 2012–November 2019).
These are the most unique and important features that have rarely been observed in other similar projects. As many cases can be interpreted as landslides or local surficial movements due to changes in the seepage field. The main deform zone is always the river valley itself. Thus, a new physical model of the valley narrowing deformation shall be proposed to explain the deformation pattern. The effect of thermal field variation has been gradually recognized based on the comprehensive consideration of the abnormal geothermal field before the impoundment and the unique deformation features after the impoundment.
3.3. Qualitative Analysis of the Deformation Mechanism
The novel deformation process of Xiluodu River valley since the initial impoundment has drawn wide attention from researchers and engineers [31,32,33]. It affects the deformation state of the arch dam and threatens the long-term security of the project [34]. Using hydrogeological profiles and analyzing the monitoring deformation process, we list and discuss several potential driven mechanisms for the valley deformation in this study.
3.3.1. Plastic Deformation along the Interlayer Faces of Basalt
For the saturated rupture surface, the increasing pore-pressure reduces the effective normal compressive stress and its shear strength [35]. The reduction in shear strength can induce landslide, e.g., the Beauregard case [1]. For the unsaturated rupture surface, which becomes submerged after the reservoir impoundment, complex physical and chemical reactions may occur between the infiltrated water and the rock mass and they could weaken the rock mass [36,37]. The results in both cases are irreversible plastic deformation of the slope. For the Xiluodu case, the class of unweathered basalt is II and the class of interlayer faces of basalt is III according to the RMR system. The range of the drill core RQD (%) of unweathered basalt is 80–90. The range of drill core RQD (%) of interlayer faces is 50–80. The orientation of the rock strata is 3°–7°. The rock strata at the dam site are intact and nearly horizontal according to pre-project exploration. The monitored deformation pattern during the initial impoundment shows no obvious jump across interlayer weak planes, which should be rupture surfaces (Figure 9). Thus, the possibility of plastic deformation along the rupture surface in the dam abutment is low.
3.3.2. Confined Aquifer Influence
The groundwater level in limestone rises by 100 m after the reservoir impounds, which makes the explanation of confined aquifer influence tempting. However, the groundwater head fluctuates with reservoir water level (Figure 6) while valley deformation does not (Figure 5). Besides, the stratum is horizontal at the dam site. The confined water pressure shall lead to uplift deformation rather than valley shrinkage. Therefore, the possibility of a confined aquifer influence is relatively low.
3.3.3. Thermal Field Variation
A comparison of bedrock temperature before and after reservoir impoundment demonstrates that the reservoir water affects not only the seepage field but also the thermal field. The valley contraction and bedrock temperature drop occur simultaneously. Based on those observed phenomena, we proposed a valley deformation mechanism driven by thermal field variation. The basic principle is shown in Figure 10.
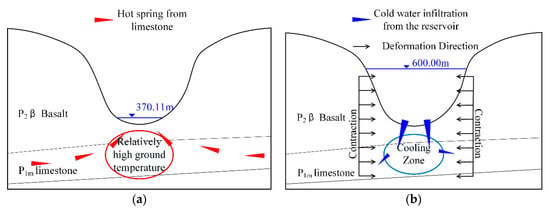
Figure 10.
Valley deformation mechanism is driven by thermal field variation: (a) hydrogeological condition before impoundment; (b) deformation pattern caused by cold water infiltration after impoundment.
As the water level rises, the reservoir water with low temperature infiltrates into the rock mass, which originally has a higher temperature as described above. The cooling effect is likely to induce rock contraction at the bottom of the valley and consequently narrows the valley.
4. Numerical Simulation and Discussion
The behavior of dam-reservoir-foundation systems, particularly their fluid transport and nonlinear mechanics characteristics, is affected by complex interactions among multiple physical and geochemical processes [38,39]. Dam-reservoir-foundation systems are designed to raise the water level for flood control and hydropower generation. The rising water level in the reservoir causes tremendous changes in pressure and temperature, which induce dynamic redistribution of the in-situ stress. Subsequently, hydraulic properties such as permeability and porosity are affected by the geometrical changes of fractures and pore spaces. Thus, interactions occur between fluid and rock. Additional coupling occurs through pressure- and temperature-dependent material properties.
4.1. Governing Equations and Constitutive Models
The physical system of dam-reservoir-foundation incorporates a non-isothermal fluid flow in a deforming porous medium. The governing equations are derived from the local equilibrium of thermodynamics and macroscopic balance equations. Thus, the liquid phase pressure p, temperature T, and displacement vector U are the corresponding dependent variables.
4.1.1. Seepage Flow
The seepage flow process in a saturated porous medium is described by the following mass balance equation with Darcy’s law,
where is the water density, is the intrinsic permeability of rock mass, is the water viscosity, is gravity, D is the vertical coordinate, S is the storage coefficient, is the volumetric strain of the rock mass, and Q is a fluid source/sink term [38].
The specific storage coefficient S can be interpreted as weighted compressibility of the bulk aquifer material and fluid in the pores. Thus, S is derived as
where α is Biot–Willis coefficient, is the porosity, Ks is the solid bulk modulus (the inverse of the fluid compressibility), and Kw is the water bulk modulus [40].
The fluid viscosity significantly affects the fluid flow and strongly depends on the temperature [41]. To consider the effects of temperature variation on seepage flow, a fitting function used to describe the dependency relation is expressed as [42]
where T denotes the temperature in Kelvin.
4.1.2. Heat Transfer
The heat transfer process in a saturated porous medium consists of convective and diffusive fluxes. The energy balance equation for heat transfer is
where is the porosity. is the equivalent volume heat capacity, is the specific heat capacity of water, is the specific heat capacity of solid, and is the solid density [43]. The fluid velocity u is included in the convection term. denotes the equivalent heat conductivity of a porous medium, is heat conductivity of water, and is the heat conductivity of solid.
4.1.3. Equilibrium Equation
The deformation process of a saturated porous medium is assumed to be isotropic linear elastic. Considering the contribution of the pore-pressure with the principle of effective stress and thermal stress, the local equilibrium equation in terms of Lame constant can be written as
where λ and μ are Lame constants, F is the body force, α is Biot–Willis coefficient, β is the thermal expansion coefficient, and Uj is the displacement component [40].
Equation (5) describes an equilibrium state which neglects the inertial effects. Its application to the case of time-dependent flow and heat transfer model is valid because the time scale of the structural response is generally many orders of magnitude faster than the time scale of the flow and heat transfer. Thus, even the change in stress and strain with time in equation appears stationary, and the structure-to-fluid coupling term, which involves the rate of strain, is nonzero [40].
4.2. The Definition of Model Parameters
4.2.1. Spatial Discretization
Based on the hydrogeological profiles of the reservoir area, a finite element model is developed considering the rock strata distribution and main hydraulic structures, which include the arch dam, underground powerhouses, and their grouted curtain, as shown in Figure 11. The defined model area is 5 km wide perpendicular to the river at the dam site and 4 km long along the river. The bottom of the model is set to −1 km above sea level. Due to the irregular terrain, the model geometry is discretized with 155,951 tetrahedrons and 5508 triangular prisms.
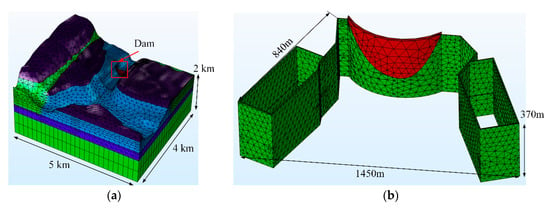
Figure 11.
Finite element model of the reservoir area: (a) reservoir area; (b) arch dam and grouted curtain.
4.2.2. Boundary Conditions
Prior to the numerical calculation, boundary conditions of the reservoir area should be defined according to the pre-project hydrogeological explorations in Section 2. For the mechanical boundary conditions, normal constraints are assigned to the truncated boundaries of the simulated area. A 400 m-head is provided to the vertical boundaries around the model based on linear interpolation of the measured seepage pressure. An impermeable boundary is also assigned to the bottom of the model. The hydraulic head in the river valley is set at 370 m before impounding to simulate a stationary state. After impoundment, the hydraulic head of the upstream valley in the reservoir is set to be the dynamic reservoir level () based on the daily water level measurement which has been shown in Figure 5 and Figure 7. The downstream valley remains unchanged. A heat-insulated boundary condition is assigned to the vertical boundaries. A constant temperature of 45 °C is set for the bottom of the model, according to a former study on the geothermal field [24,25]. The top surface of the model is set to the mean annual temperature, except the river valley is set to the water temperature (14.5 °C) according to the former study [28,29]. The schematic boundary conditions are shown in Figure 12.
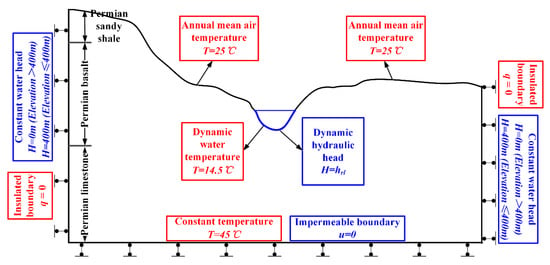
Figure 12.
Boundary condition setup.
4.2.3. Material Parameters
According to field test data, the basic material parameters of the numerical model are shown in Table 3. Specifically, the hydraulic conductivity of the weathered zone near the river valley varies dramatically with respect to the buried depth, as shown in Table 4.

Table 3.
Material parameters of the finite element method (FEM) model.

Table 4.
Hydraulic conductivity of the weathered zone in the river valley.
4.3. Numerical Results
The multi-field response of the study area was obtained by using the transient finite element solver in COMSOL Multiphysics®. The calculation is divided into two stages: A stationary state before impoundment and a transient state after impoundment. The pre-project exploration data are used to calibrate the model in the stationary state. Next, the transient state of the study area is calculated with the initial multi-field distribution, which is obtained from the calibrated stationary state results. Two specific sections shown in Figure 13 are used to represent the simulation result in the following chapters.
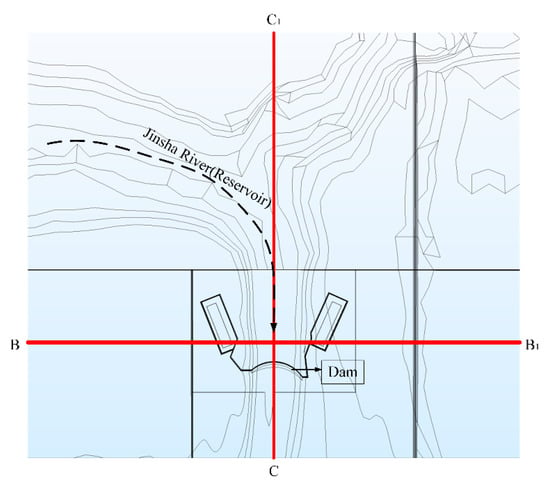
Figure 13.
2D sections used for displaying the simulation result (B–B1: Transversal section, C–C1: Longitudinal section).
4.3.1. Thermal and Seepage Field before Impoundment
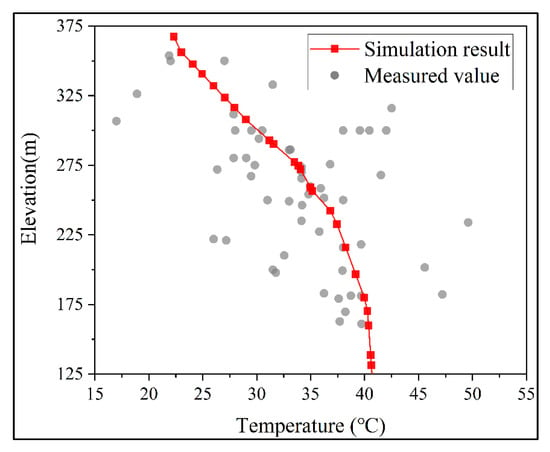
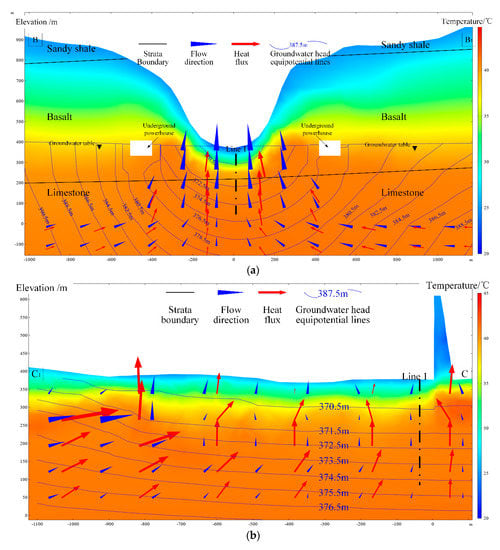
The simulated thermal and seepage fields are shown in Figure 14. The calculation result fits the previous study on the hydrogeological context which has been discussed in Section 2. As it has been pointed out, the upward water brings heat from limestone and causing abnormally high ground temperature near the dam site. Simulated temperature distribution near the dam site is extracted and compared to the measured values. As shown in Figure 15, the calculated multi-field distribution of the stationary state is consistent with the hydrogeological exploration results in Figure 3. It has to be noted that the underlying limestone stratum with higher permeability is the key, which plays as a seepage channel and makes the upward seepage flow happen.
4.3.2. Thermal and Seepage Variation after Impoundment
The reservoir began the initial impoundment at the end of 2012, and the reservoir level rises from 370 m to 600 m. Because of the impoundment, the hydraulic head in the rock mass near the valley increases drastically to match the reservoir level. As shown in Figure 16, the previous seepage direction at the bottom of the valley was reversed. Though the waterproof curtain can reduce the horizontal seepage flow. It is not able to prevent infiltration along the vertical direction. Thus, the water in the reservoir will infiltrate downward to the limestone and then bypass the waterproof curtain. The infiltration of cold water will form a cooling zone underneath the river bed which leads to the valley shrinkage.
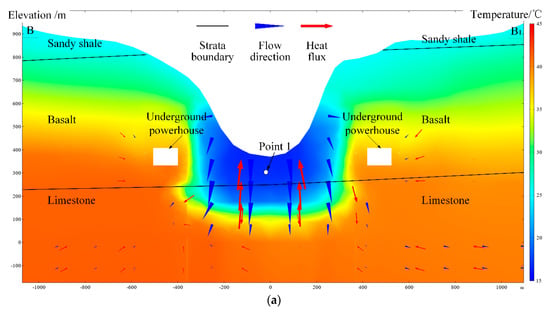
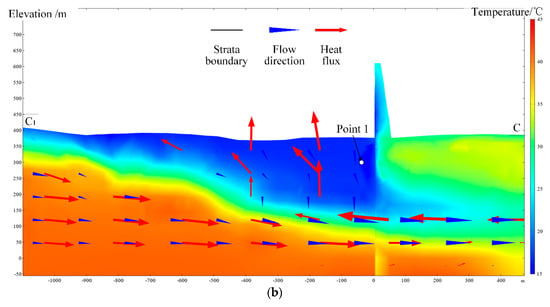
Comparisons between simulated and measured data are as follow. The simulation result of thermal variation extracted from point 1 is consistent with the thermal field measurement represented in Figure 17. The numerical result shows that the temperature will drop by 1 °C in the next two years before it reaches an equilibrium state.
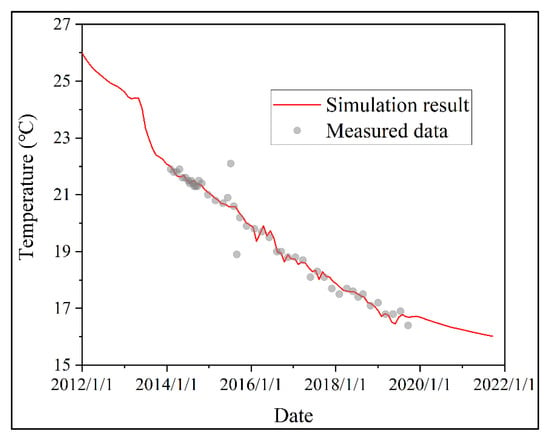
Figure 17.
Temperature progress at the dam foundation.
4.3.3. Valley Narrowing Process after Impoundment
As has been previously discussed in Figure 10, the infiltration of cold water will form a cooling zone underneath the riverbed. And the cooling zone will lead to a valley shrinkage which is consistent along both the vertical direction and the river flow direction. Figure 18 shows the distribution of temperature decrease and the displacement vector of the rock mass near the river valley. The maximum temperature decrease was approximately 16 °C at 80–160 m below the river bed. The rock mass cooled and contracted, induced a decrease in valley width. The induced displacement pattern is consistent with the monitored horizontal deformation of the abutment which has been discussed in Figure 9.
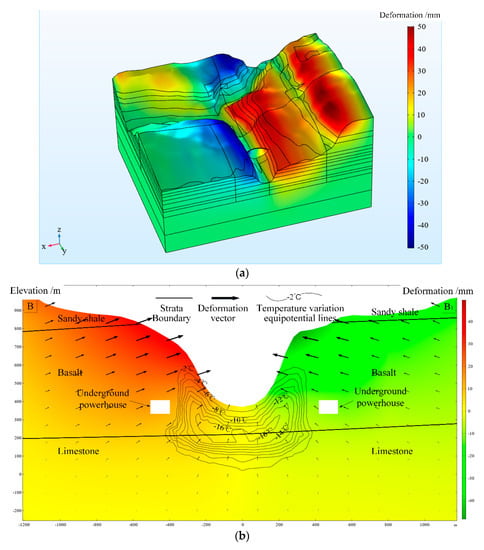
Figure 18.
Deformation patterns: (a) 3D overview; (b) B–B1 section in Figure 13.
Comparison between observed data and simulated data is shown in Figure 19. The simulated results are consistent with the observed data from survey lines which has been shown in Figure 5. According to the simulated results, an average deformation of 15 mm will take place in the next 5 years. The predicted convergence values of survey lines are between 79 mm and 98 mm, which is relatively large but still within the design criteria. After 5 years, the annual mean deformation rate will be less than 0.005 mm/day and meet the national standard of deformation convergence.
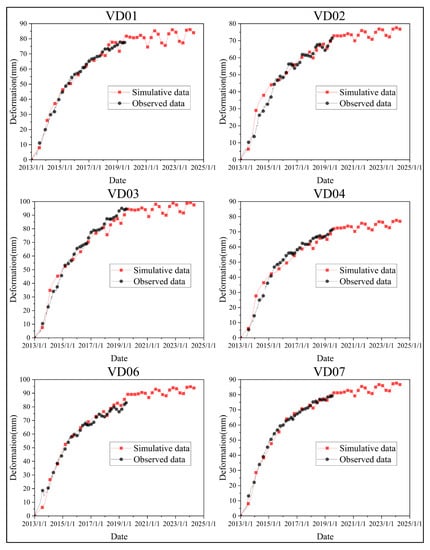
Figure 19.
Comparison between simulation data and observed data.
4.4. Discussion
4.4.1. Factor Analysis
Comparative studies are also implemented in parallel which considers the hydro-mechanical (HM) interaction process and neglects the influence of thermal field variation. The deformation processes at VD4 and VD7 are displayed in Figure 20.
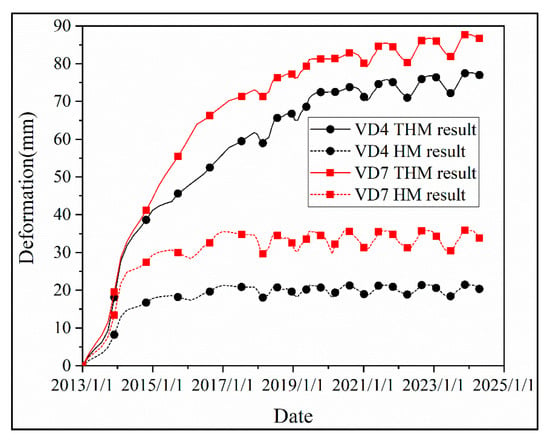
Figure 20.
Comparison between thermal-hydro-mechanical (THM) simulated results and hydro-mechanical (HM) simulated results.
A comparison between THM and HM results represents the influence of the thermal field. According to the results, thermal field variation shall be responsible for more than 60 percent of the total deformation; it is the main factor that causes the deformation after the initial impoundment. While long term deformation is mainly caused by the temperature changes, the deformation in the first two years is mainly affected by seepage variation.
4.4.2. Sensitivity Analysis of Hydraulic Conductivity
The hydraulic conductivity of the rock mass is often difficult to determine because of the complexity of its intrinsic fractured network. Practically, an estimated range of conductivity is often provided for a specific rock stratum instead of an exact value, as shown in Table 4. A sensitivity analysis of the valley deformation is performed considering the hydraulic conductivities of the weathered basalt and limestone strata near the valley.
The adopted conductivity values are the upper limit, lower limit, half of the lower limits of the suggested ranges in Table 4. Thus, 9 scenarios with different conductivity combinations were implemented. According to the result in Figure 21, a nearly 60% reduction for valley deformation was observed when the conductivities of the weathered rock strata changed from their upper limits to lower limits.
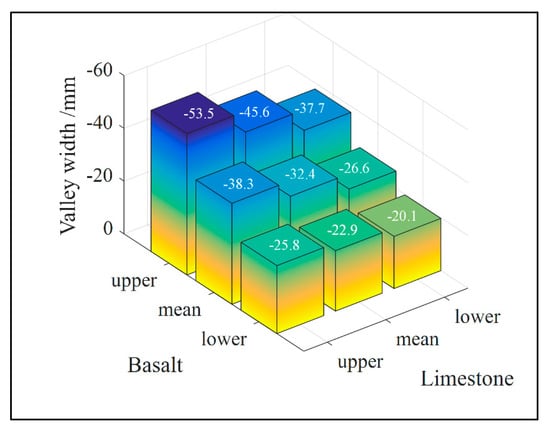
Figure 21.
The sensitivity of valley deformation considering different conductivities of the weathered rock strata. (1 January 2013–1 January 2015).
5. Conclusions
In this paper, a thermo-hydro-mechanical coupled approach is used to study the valley narrowing deformation in the Xiluodu project. Similar valley narrowing deformation caused by thermal contraction of bedrock has rarely been reported before. Yet the particular combination of similar hydrogeology conditions and the super-high arch dam project is not common. It should be noted that, because of the extreme complexity of fractured rock mass, the actual cause for the valley narrowing deformation of the Xiluodu arch dam remains an open question, and the research work in this paper is supposed to provide a new perspective. The main results are as follows:
- The proposed THM coupling model explains the valley narrowing deformation mechanism of the Xiluodu Project. According to the analysis of in situ measurement and numerical results, high ground temperature in the river valley before the impoundment is mainly induced by the deep groundwater circulation, which continuously brings heat to the bedrock at the bottom of the valley. After impoundment, the previous seepage direction at the bottom of the valley is reversed. The reservoir water with lower temperature cools the rock mass at the bottom of the valley and thermal contraction occurs. As a result, the “U” shaped valley narrows.
- Seepage field variation is the main factor of the deformation in the first two years, while thermal field variation causes long-term deformation after the initial impoundment. It shall be responsible for more than 60 percent of the total deformation. The numerical results also predict that 15 mm deformation will occur in the next five years. By 2024, the annual deformation rate will be less than 0.005 mm/day.
- Based on the result of sensitivity analysis on hydraulic conductivity, the conductivity of the bedrock is one of the key factors that influence the magnitude of valley narrowing deformation. Hence, anti-seepage methods such as high-pressure grouting are recommended to decrease the heat exchange underneath the riverbed and reduce further development of valley deformation in the feature.
Though the converged value of deformation is relatively large, it is still controlled within the design criteria. Dam safety is guaranteed. As there are many high dam projects still under construction or in planning in China, the analysis method proposed in this article provides reference meaning for future studies on the multi-field evolution process of dam-reservoir-foundation systems, particularly thermal field variation. For future studies on the Xiluodu project and similar cases, hydro-chemical experiments and THMC coupling simulation can be very helpful to gain a more comprehensive understanding of the mechanisms. A recent study [44] on the model has taken fracture into account due to its influence on the multi-field coupling. Fracture scanning through boreholes and THM experiment on rock samples are in progress to reveal the impact of THM process on the propagation of natural fractures. The application of a new model will be made possible by obtaining these experimental data. Further research is also necessary, as a full understanding of the valley narrowing mechanism will be an important reference for dam construction and safety assessment.
Author Contributions
Conceptualization, Q.L. and Y.H.; data curation, T.Y.; formal analysis, T.Y. and G.L.; investigation, T.Y.; methodology, Y.H.; project administration, Q.L. and S.Y.; resources, S.Y.; software, G.L.; validation, Y.H.; writing—original draft, T.Y.; writing—review and editing, Y.H. All authors have read and agree to the published version of the manuscript.
Funding
This research was funded by the National Natural Science Foundation of China, grant number 51979145 and 51839007.
Conflicts of Interest
The authors declare no conflict of interest.
References
- Frigerio, A.; Mazza, G. The rehabilitation of Beauregard Dam: The contribution of the numerical modeling. In Proceedings of the ICOLD—12th International Benchmark Workshop on Numerical Analysis of Dams, Graz, Austria, 2–4 October 2013; pp. 343–352. [Google Scholar]
- Lombardi, G. The FES rock mass model, Part I. Dam Eng. 1992, 3, 49–72. [Google Scholar]
- Yang, J.; Hu, D.X.; Guan, W.H. Analysis of high slope rock deformation and safety performance for left bank of Lijiaxia arch dam. Chin. J. Rock Mech. Eng. 2005, 24, 3551–3560. [Google Scholar]
- Cheng, L.; Liu, Y.R.; Yang, Q.; Pan, Y.W.; Lv, Z. Mechanism and numerical simulation of reservoir slope deformation during impounding of high arch dams based on nonlinear FEM. Comput. Geotech. 2017, 81, 143–154. [Google Scholar] [CrossRef]
- Luo, D.; Lin, P.; Li, Q.; Zheng, D.; Liu, H. Effect of the impounding process on the overall stability of a high arch dam: A case study of the Xiluodu dam, China. Arab. J. Geosci. 2015, 8, 9023–9041. [Google Scholar] [CrossRef]
- Wang, R. Key technologies in the design and construction of 300 m ultra-high arch dams. Engineering 2016, 2, 350–359. [Google Scholar] [CrossRef]
- Londe, P. The Malpasset dam failure. Eng. Geol. 1987, 24, 295–329. [Google Scholar] [CrossRef]
- Müller-Salzburg, L. The Vajont slide. Eng. Geol. 1987, 24, 513–523. [Google Scholar] [CrossRef]
- Schuster, R.L. Dams built on pre-existing landslides. In Proceedings of the ISRM International Symposium, Melbourne, Australia, 19–24 November 2000; p. 53. [Google Scholar]
- Barla, G.; Antolini, F.; Barla, M.; Mensi, E.; Piovano, G. Monitoring of the Beauregard landslide (Aosta Valley, Italy) using advanced and conventional techniques. Eng. Geol. 2010, 116, 218–235. [Google Scholar] [CrossRef]
- Barla, G.; Ballatore, S.; Chiappone, A.; Frigerio, A.; Mazza, G. The Beauregard dam (Italy) and the deep-seated gravitational deformation on the left slope. In Proceedings of the Hydropower 2006–International Conference, Kunming, China, 23–25 October 2006; pp. 23–25. [Google Scholar]
- Lombardi, E.G. Ground-water induced settlements in rock masses and consequences for dams. In Proceedings of the IALAD-Integrity Assessment of Large Concrete Dams Conference, Zurich, Switzerland, 24 September 2004; p. 24. [Google Scholar]
- Zangerl, C.; Evans, K.F.; Eberhardt, E.; Loew, S. Consolidation settlements above deep tunnels in fractured crystalline rock: Part 1—Investigations above the Gotthard highway tunnel. Int. J. Rock Mech. Min. Sci. 2008, 45, 1195–1210. [Google Scholar] [CrossRef]
- Ehrbar, H.; Bremen, R.; Otto, B. Gotthard Base Tunnel—Tunnelling in the influence zone of two concrete arch dams. Geomech. Tunn. 2010, 3, 428–441. [Google Scholar] [CrossRef]
- El Tani, M.; Bremen, R. Val Termine cyclic deformation due to seasonal variation of water table. In Golden Rocks 2006, Proceedings of the 41st US Symposium on Rock Mechanics (USRMS), Golden, CO, USA, 17–21 June 2006; American Rock Mechanics Association: Alexandria, VA, USA, 2006. [Google Scholar]
- Löw, S.; Hansmann, J.; Ebneter, F. Annual opening and closure of Alpine valleys. In Proceedings of the 6th Swiss Geoscience Meeting, Lugano, Switzerland, 21–23 November 2008; Volume 6. [Google Scholar]
- Hansmann, J.; Loew, S.; Evans, K.F. Reversible rock-slope deformations caused by cyclic water-table fluctuations in mountain slopes of the Central Alps, Switzerland. Hydrogeol. J. 2012, 20, 73–91. [Google Scholar] [CrossRef][Green Version]
- Qiao, R.; Shao, Z.; Wei, W.; Zhang, Y. Theoretical investigation into the thermo-mechanical behaviours of tunnel lining during RABT fire development. Arab. J. Sci. Eng. 2019, 44, 4807–4818. [Google Scholar] [CrossRef]
- Moore, J.R.; Gischig, V.; Katterbach, M.; Loew, S. Air circulation in deep fractures and the temperature field of an alpine rock slope. Earth Surf. Process. Landf. 2011, 36, 1985–1996. [Google Scholar] [CrossRef]
- Maheshwar, S.; Verma, A.K.; Singh, T.N. Study of thermo-hydro-mechanical processes at a potential site of an Indian nuclear waste repository. J. Earth Syst. Sci. 2015, 124, 1693–1708. [Google Scholar] [CrossRef][Green Version]
- Gunzburger, Y.; Merrien-Soukatchoff, V.; Guglielmi, Y. Influence of daily surface temperature fluctuations on rock slope stability: Case study of the Rochers de Valabres slope (France). Int. J. Rock Mech. Min. Sci. 2005, 42, 331–349. [Google Scholar] [CrossRef]
- Gischig, V.S.; Moore, J.R.; Evans, K.F.; Amann, F.; Loew, S. Thermomechanical forcing of deep rock slope deformation: 1. Conceptual study of a simplified slope. J. Geophys. Res. Earth Surf. 2011, 116. [Google Scholar] [CrossRef]
- Gruber, S.; Haeberli, W. Permafrost in steep bedrock slopes and its temperature-related destabilization following climate change. J. Geophys. Res. Earth Surf. 2007, 112. [Google Scholar] [CrossRef]
- Zhou, Z.F.; Wang, J.G. Comprehensive assessment of environmental hydrogeology in Xiluodu hydropower station. Geol. J. China Univ. 2002, 8, 227–235. [Google Scholar]
- Han, Q.Z.; Hu, Y.F. Geothermal field effect of rock fermeability in the dam site of xiluodu hydroelectric station. Geol. Sci. Technol. Inf. 2002, 21, 19–21. [Google Scholar]
- Wang, J.G.; Zhou, Z.F.; Tang, R.L. Research of Linear Programming Model for Water-Rock Reactions and Its Application: Hydroelectric Project of Xiluodu as an Example. Adv. Water Sci. 1999, 2, 118–122. [Google Scholar]
- Li, Q.; Liang, G.; Hu, Y.; Zuo, Z. Numerical analysis on temperature rise of a concrete arch dam after sealing based on measured data. Math. Probl. Eng. 2014, 2014. [Google Scholar] [CrossRef]
- Xie, Q.; Liu, Z.; Fang, X.; Chen, Y.; Li, C.; MacIntyre, S. Understanding the temperature variations and thermal structure of a subtropical deep river-run reservoir before and after impoundment. Water 2017, 9, 603. [Google Scholar] [CrossRef]
- Long, L.H.; Xu, H.; Bao, Z.F.; Ji, D.; Liu, D.F. Temporal and spatial characteristics of water temperature in Xiluodu Reservoir. J. Hydroelectr. Eng. 2018, 37, 79–89. [Google Scholar]
- Li, Q.; Zuo, Z.; Hu, Y.; Liang, G. Smart monitoring of a super high arch dam during the first reservoir-filling phase. J. Aerosp. Eng. 2016, 30, B4016001. [Google Scholar] [CrossRef]
- Wu, M.X.; Jiang, H.; Zhang, C.H. General rules of dam-valley deformation due to reservoir impoundment. J. Hydroelectr. Eng. 2019, 38, 1–14. [Google Scholar]
- Zhuang, C.; Zhou, Z.F.; Li, M.W.; Wang, J.G. Prediction of valley shrinkage deformation in Xiluodu Hydropower Plant based on the hydraulic responses of a confined aquifer. Chin. J. Geotech. Eng. 2019, 41, 1472–1480. [Google Scholar]
- He, Z.; Liu, Y.R.; Yang, Q.; Cheng, L.; Xue, L.J. Mechanism of valley deformation of Xiluodu arch dam and back analysis and long-term stability analysis. Chin. J. Rock Mech. Eng. 2018, 37, 4198–4206. [Google Scholar]
- Liang, G.H.; Hu, Y.; Fan, Q.X.; Li, Q.B. Valley deformation characteristics and influencing factors analysis of xiluodu high arch dam during impoundment. J. Hydroelectr. Eng. 2016, 35, 101–110. [Google Scholar]
- Yang, Q.; Pan, Y.W.; Cheng, L.; Liu, Y.; Zhou, Z.; Xue, L. Mechanism of valley deformation of high arch dam and effective stress principle for unsaturated fractured rock mass. Chin. J. Rock Mech. Eng. 2015, 34, 2258–2269. [Google Scholar]
- Dunning, J.D.; Miller, M.E. Effects of pore fluid chemistry on stable sliding of Berea sandstone. Pure Appl. Geophys. 1984, 122, 447–462. [Google Scholar] [CrossRef]
- Zhou, C.Y.; Tan, X.S.; Deng, Y.M.; Zhang, L.M.; Wang, J.H. Research on softening micro-mechanism of special soft rocks. Chin. J. Rock Mech. Eng. 2005, 24, 394–400. [Google Scholar]
- Louis, C. Rock hydraulics. In Rock Mechanics; Springer: Berlin/Heidelberg, Germany, 1972; pp. 299–387. [Google Scholar]
- Hoek, E.; Bray, J.D. Rock Slope Engineering; CRC Press: Boca Raton, FL, USA, 1981. [Google Scholar]
- Biot, M.A. Mechanics of deformation and acoustic propagation in porous media. J. Appl. Phys. 1962, 33, 1482–1498. [Google Scholar] [CrossRef]
- McDermott, C.I.; Randriamanjatosoa, A.R.L.; Tenzer, H. Simulation of heat extraction from crystalline rocks: The influence of coupled processes on differential reservoir cooling. Geothermics 2006, 35, 321–344. [Google Scholar] [CrossRef]
- Jiang, Z.; Hoxha, D.; Homand, F.; Chen, Y. Simulation of coupled THM process in surrounding rock mass of nuclear waste repository in argillaceous formation. J. Cent. South Univ. 2015, 22, 631–637. [Google Scholar] [CrossRef]
- Zhang, Y.; Zhang, W. 2D FEM analysis for coupled thermo-hydro-mechanical-migratory processes in near field of hypothetical nuclear waste repository. J. Cent. South Univ. Technol. 2010, 17, 612–620. [Google Scholar] [CrossRef]
- Salimzadeh, S.; Nick, H.M. A coupled model for reactive flow through deformable fractures in Enhanced Geothermal Systems. Geothermics 2019, 81, 88–100. [Google Scholar] [CrossRef]
© 2020 by the authors. Licensee MDPI, Basel, Switzerland. This article is an open access article distributed under the terms and conditions of the Creative Commons Attribution (CC BY) license (http://creativecommons.org/licenses/by/4.0/).
