Article

Effects of Biochar and Clinoptilolite on Composition and Gaseous Emissions during the Storage of Separated Liquid Fraction of Pig Slurry

by
José L. S. Pereira
1,2,*,
Vitor Figueiredo
1,
António F. M. A. Pinto
1,2,
Maria E. F. Silva
2,3,
Isabel Brás
2,3,
Adelaide Perdigão
1,2 and
Dulcineia F. Wessel
1,2,4
1
Agrarian School of Viseu, Polytechnic Institute of Viseu, Quinta da Alagoa, 3500-606 Viseu, Portugal
2
Centre for the Research and Technology of Agro-Environmental and Biological Sciences (CITAB), University of Trás-os-Montes and Alto Douro, Quinta de Prados, 5000-801 Vila Real, Portugal
3
School of Technology and Management of Viseu, Polytechnic Institute of Viseu, Campus Politécnico de Repeses, 3504-510 Viseu, Portugal
4
QOPNA & LAQV-REQUIMTE, Department of Chemistry, University of Aveiro, 3810-193 Aveiro, Portugal
*
Author to whom correspondence should be addressed.
Appl. Sci. 2020, 10(16), 5652; https://doi.org/10.3390/app10165652
Submission received: 10 July 2020 / Revised: 11 August 2020 / Accepted: 12 August 2020 / Published: 14 August 2020

Abstract

:
The storage of animal manure is a major source of gaseous emissions. The aim of this study was to evaluate the effects of biochar and clinoptilolite on the composition and gaseous emissions during the storage of separated liquid fraction of pig slurry. The experiment was carried out using containers with 6 L of pig slurry each. The additives biochar and clinoptilolite were added alone and mixed to the pig slurry at a rate of 2.5% each, in a total of four treatments with three replicates including the control. Gaseous emissions were monitored by a photoacoustic multigas monitor, and slurry samples were collected at 0 and 85 days and their composition assessed. Results showed that the addition of biochar could modify the physicochemical properties of the slurry. The addition of biochar did not reduce the E. coli during the experiment while clinoptilolite decreased its prevalence. The addition of biochar or clinoptilolite reduced significantly the NH3 emission during the storage of slurry, but no advantages were gained with their combination. The addition of biochar significantly reduced the CO2 and CH4 emissions relative to clinoptilolite, however N2O emissions and global warming potential did not differ among the additives. We conclude that the biochar and clinoptilolite are recommended as a mitigation measure to reduce gaseous emissions and preserve the fertiliser value at slurry storage.

1. Introduction

The strong increase in intensive livestock production has led to severe environmental problems due, essentially, to the management of the large amounts of slurry (liquid manure) resulting from this activity. The storage of animal manure is a major source of ammonia (NH3), nitrous oxide (N2O), carbon dioxide (CO2) and methane (CH4) emissions, all with important impacts on climate change, acid rain and ozone formation in the troposphere [1,2,3]. Regarding the Directive 2016/2284 of the European Union, from 2030, the national NH3 emission ceilings should be reduced at all stages of animal manure management, namely: 10% for feeding, 20% for housing, 40% for storage and 30% for soil application.
At storage stage, the NH3 and CO2 are originated by decomposition of urea present in slurry and the main characteristics that control NH3 volatilisation are temperature, concentration of total ammoniacal N, pH and air velocity on slurry surface [4,5]. The majority of inorganic N present in slurry is in the form of ammonium (NH4+). Nitrification can be performed by autotrophic and heterotrophic organisms under aerobic conditions whereas denitrification is the stepwise reduction of nitrate (NO3) to N2 under anaerobic conditions [6]. Since the bulk of stored slurry is predominantly anaerobic with little chance for NH4+ to be nitrified, N2O and N2 through nitrification and denitrification are considered insignificant [3]. The availability of NH4+ and NO3 are primary requirements for nitrification and denitrification processes, respectively but also the availability of easily degradable carbon influences these processes [6]. The anaerobic decomposition of the organic matter by methanogenic bacteria leads to CH4 and CO2 emissions. Organic matter is considered a major limiting factor for CH4 production, once anaerobiosis is established, and CH4 emissions are closely related to manure temperature [7]. Relative to stored slurry, management practices such as storage duration, agitation or mixing and emptying of storage tanks plays an important role in CH4 emissions during storage [8].
Several practices aimed at reducing the environmental impact of slurry storage, and the techniques used, have been pointed out as an efficient solution to decrease gaseous emissions, namely: diet manipulation, design of the storage tank, fitting a covering material on the slurry store, application of additives to the slurries, for biodegradation of organic materials, lowering pH, bind/convert NH4+/NH3, down urea hydrolysis and inhibition of nitrification [3,7,8,9,10,11]. Additionally, the solid-liquid separation of pig slurry has been reported as a good technique for manure management at farm scale, modifying the main characteristics of derived fractions, reducing the costs of storage and the environmental impacts [12,13,14,15]. The derived liquid fraction could be stored prior to soil application whereas the solid fraction could be composted and exported out of the farm [12]. Our hypothesis was that the application of adsorbing additives, like biochar and/or clinoptilolite, will modify initial slurry characteristics and consequently influence gaseous emission patterns during storage and after field application. Therefore, the treatment of slurry-derived liquid fraction either by biochar and/or clinoptilolite will minimise N (NH3 + N2O) emissions, preserve fertiliser value and consequently increase the availability of N for crop utilisation after soil application.
The aim of this study was to evaluate the effects of biochar and clinoptilolite on composition and emission of NH3, N2O, CO2 and CH4 during the storage of mechanical separated liquid fraction of pig slurry.

2. Materials and Methods

2.1. Experimental Design and Treatments

In order to follow the changes in slurry composition and gaseous emissions after application of additives at the storage of pig slurry, a laboratory experiment was conducted in which the slurry was amended with biochar and/or clinoptilolite. The following four treatments with three replications were considered:
  • Non-amended slurry as control (Control treatment);
  • Slurry amended with biochar at a rate of 2.5% (w/w; 2.5 g of additive present in 100 g of slurry) (Biochar treatment);
  • Slurry amended with clinoptilolite at a rate of 2.5% (w/w) (Clinoptilolite treatment);
  • Slurry amended with biochar and clinoptilolite and each one at a rate of 2.5% (w/w) (Biochar + Clinoptilolite treatment).
A single bulk sample of slurry was collected from fattening pigs in a commercial farm (Viseu, Portugal), after being subjected to mechanical separation by a screw press separator (particle size <1.0 mm, FAN model S655, BAUER, Wiener Neudorf, Austria). The total separated liquid fraction of the pig slurry was homogenized, and subsamples were retained for analysis. Slurry samples from each treatment were collected at 0 and 85 days, after being mixed thoroughly first, and then analyzed (Table 1 and Table 2) by standard laboratory methods [16,17,18] to the dry matter content by the gravimetric method (24 h at 105 °C), pH value by EN 13037, total carbon by Dumas method, total nitrogen by Kjeldahl method by EN 13654-1, NH4+ and NO3 by absorption spectrophotometry, biochemical oxygen demand by incubation (5 days at 20 °C) and Escherichia coli by International Organization for Standardization (ISO) 16649-2.
The commercial biochar (Piroeco Bioenergy, S.L., Malaga, Spain) was obtained from wood shavings (Ø = 2 mm) pyrolyzed in a muffle furnace at 900 °C. The main physico-chemical properties of the biochar were: granulometry (by sieving method): 552 g kg−1 with Ø > 0.30 mm, 364 g kg−1 with Ø = 0.20–0.30 mm, 41 g kg−1 with Ø = 0.15–0.20 mm and 43 g kg−1 with Ø < 0.15 mm, bulk density (by core method): 0.1219 g cm−3, pH (H2O): 10.2, humidity (by gravimetric method): 102.4 g kg−1, C: 806.0 g kg−1, and N: 1.9 g kg−1.
The commercial clinoptilolite (Zeolita Natural NUTRI-Clinoptilolita 1g568, ZeoCat Soluciones Ecológicas S.L.U., Barcelona, Spain) was of sedimentary origin, from a mine located in Turkey, with a particle size of 0–0.425 mm and with the following characteristics: mineralogical (by XRD analysis): 880–950 g kg−1 clinoptilolite, 20–50 g kg−1 montmorillonite, 30–50 g kg−1, feldspars, 0–30 g kg−1 muscovite, 0–20 g kg−1 cristobalite, chemical composition: 650–720 g kg−1 SiO2, 100–120 g kg−1 Al2O3, 23–35 g kg−1 K2O, 25–37 g kg−1 CaO, 9–12 g kg−1 MgO, 3.0–6.5 g kg−1 Na2O, 0–1.0 g kg−1 TiO2, cation exchange capacity (by cation exchange capacity (CEC) method): 1.5–1.9 meq g−1, apparent porosity: 450–500 g kg−1, specific surface area: (by Brunauer, Emmett and Teller (BET) method) 70–80 m2 g−1, pH (H2O): 7.8, bulk density of powder: 650–850 kg m−3, and humidity (by gravimetric method): 65.7 g kg−1. The rates of additives were selected based on a literature survey, considering a potential decrease of environmental and microbial issues. Thus, for practical and economic reasons, the rate of additive was lower than 5% (w/w).

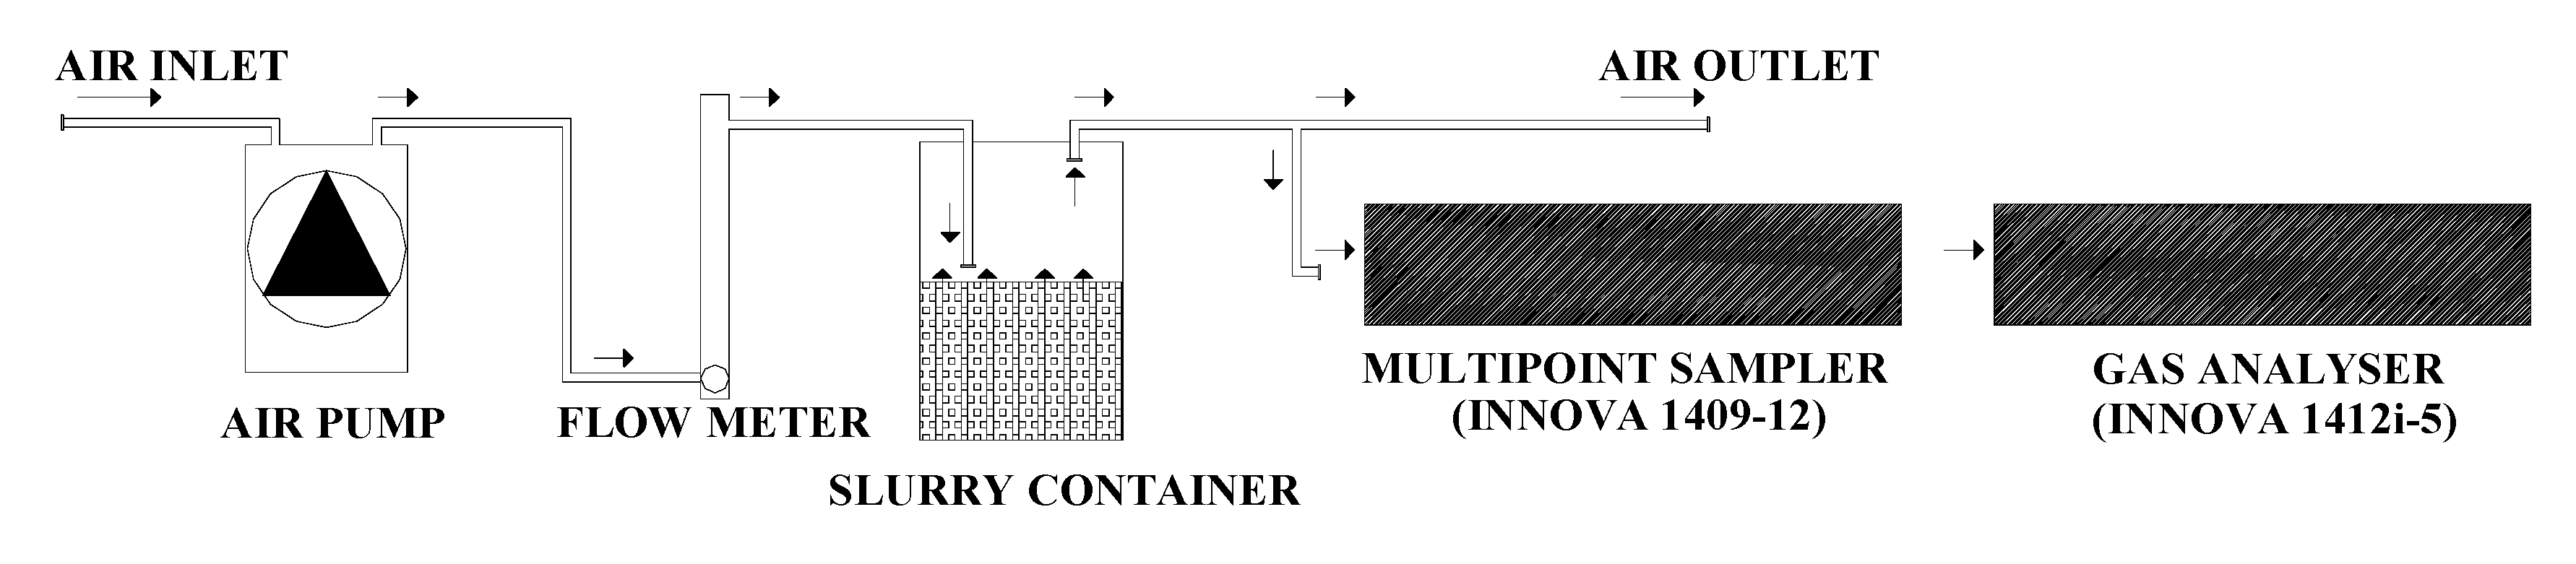
2.2. Measurement Procedure and Sampling

The experiment was carried out using a system of twelve plastic containers (Ø = 290 mm, H = 240 mm, volume = 12 L) (Normax, Marinha Grande, Portugal) filled with 6 L of pig slurry each (H = 120 mm), under constant temperature (20 ± 0.5 °C), airflow rate (2.5 L min−1) and during 85 days. The temperature was measured continuously using temperature sensors (CS107, Campbell Scientific, Loughborough, UK) connected to a micrologger (CR3000, Campbell Scientific, Loughborough, UK).
Each container was closed at 0 days, leaving an open headspace (volume = 6 L) between the surface of the slurry and the container lid. One air inlet and one air outlet were positioned symmetrically in the container lid, being inserted a Teflon tube (3 mm internal diameter) that was fitted through one of the septa and its end kept 20 mm above the slurry surface. Airflow through the headspace of each container was achieved using one individual pump (Marina 100, Hagen, Leeds, UK), with a 2.5 L min−1 flowrate regulated by a needle valve coupled to a flow meter (AalborgTM FT10201SAVN, Aalborg, Denmark), located before each slurry container (Figure 1). The outlet air from the 12 plastic containers was exhausted out of the climatic room by a fume hood.
The concentrations of NH3, N2O, CO2 and CH4 were measured in the exhaust air with a photoacoustic multigas monitor (INNOVA 1412i-5, Lumasense Technologies, Ballerup, Denmark) and air samples collected, in sequence (120 s intervals), through one sampling point (Teflon tube with 3 mm internal diameter) per container, by a multipoint sampler (INNOVA 1409-12, Lumasense Technologies, Ballerup, Denmark) provided with PTFE-filters (0.001 mm pore size, Whatman, Ome, Japan) (Figure 1). The photoacoustic multigas monitor was equipped with an optical filter for water vapour (filter type SB0527) and the detection limits for NH3 (filter type UA0973), N2O (filter type UA0985), CO2 (filter type UA0982) and CH4 (filter type UA0969) were, respectively, 0.1521, 0.0589, 2.9471 and 0.2864 mg m−3. The photoacoustic multigas monitor was calibrated by the manufacturer before the beginning of the experiment, being operated in a mode for compensation of water interference and cross-interference.

2.3. Data Analysis

The gas concentrations of NH3, N2O, CO2 and CH4 from the outlet sampling points were used to calculate means per hour and day. The gas (NH3, N2O, CO2 or CH4) emissions from each outlet sampling point were determined (per hour) by a mass balance, using Equation (1).
EMISSION = (GOUTLET − GINLET) × FLOW
where, EMISSION was the gas emission (mg h−1), GOUTLET was the outlet gas concentration (mg m−3), GINLET was the inlet gas concentration (mg m−3) using the following background coefficients: 0.00266 mg m−3 for NH3, 0.58942 mg m−3 for N2O, 628.71429 mg m−3 for CO2 and 1.07411 mg m−3 for CH4, and FLOW was the air flowrate in the plastic container (m3 h−1).
The cumulative values of NH3, N2O, CO2 and CH4 were determined by averaging the flux between two sampling occasions and multiplying by the time interval between the measurements [19]. The global warming potential (GWP) for each plastic container was determined using the global warming potential coefficients for direct greenhouse gas emissions (265 for N2O, 1 for CO2 and 28 for CH4) and indirect N2O emissions (1% of NH3-N volatilised for N2O-N) [2].
All data obtained were analysed by two-way analysis of variance (ANOVA) to test the effects of each treatment and time on slurry composition and gaseous emissions, followed by Tukey’s honestly significant difference test comparisons of means tests (p < 0.05), using the statistical software package STATISTIX 10 (Analytical Software, Tallahassee, FL, USA).

3. Results and Discussion

3.1. Composition of the Slurries

The initial (0 days) and final (85 days) composition of the Control and amended treatments (Biochar, Clinoptilolite and Biochar + Clinoptilolite) are presented in Table 1 and Table 2. The initial pH values did not differ significantly (p > 0.05) among treatments Control and Clinoptilolite (pH = 8.5), being significantly higher (p < 0.05) in treatments Biochar and Biochar + Clinoptilolite (pH = 9.0) (Table 1). Compared to the beginning of the experiment, the pH values of treatments Biochar and Biochar + Clinoptilolite increased significantly (p < 0.05) in the end of experiment (Table 1). The initial dry matter content increased significantly (p < 0.05) in amended treatments (Biochar, Clinoptilolite and Biochar + Clinoptilolite) when compared with treatment Control, with higher values for treatments Biochar and Biochar + Clinoptilolite (2.1% for Biochar against 2.7% for Clinoptilolite). However, the dry matter content did not differ significantly (p > 0.05) between the beginning and the end of the experiment, although being observed a difference of about 30% (2.7 vs. 1.9) for treatment Biochar + Clinoptilolite (Table 1).
At the beginning of the experiment, the treatments Biochar and Biochar + Clinoptilolite increased significantly (p < 0.05) by about 100% the total C, as well as the C/N ratio when compared with the treatments Control and Clinoptilolite (C/N = 22 for Biochar treatments against C/N = 11 for non-Biochar treatments). In all treatments, the initial values of total C were reduced significantly (p < 0.05) at the end of the experiment (Table 1). The initial values of total N, NH4+-N, NO3-N, NH4+/total N ratio, biological oxygen demand (BOD) and volume of slurry were not significantly different (p > 0.05) among treatments (Table 1 and Table 2). These same parameters decreased in the end of the experiment. However, the final values of total N were significantly higher (p < 0.05) in treatments Clinoptilolite and Biochar + Clinoptilolite (1.5 g total N kg−1 for Clinoptilolite-alone against <0.5 g total N kg−1 for Biochar treatments) (Table 1). In addition, the final BOD values of amended treatments decreased significantly (p < 0.05) by the following order: Biochar + Clinoptilolite < Biochar < Clinoptilolite (Table 2).
At the beginning of the experiment, the number of colonies of E. coli were significantly higher (p < 0.05) in treatment Biochar, but significantly lower (p < 0.05) in treatment Clinoptilolite, when compared with treatment Control or Biochar + Clinoptilolite (Table 2). At the end of the experiment, the values the number of colonies of E. coli were not significantly different (p > 0.05) among all treatments and there was no evidence of the presence of E. coli (1.0 colony-forming units (CFU) mL−1) (Table 2).
Results of this study (Table 1 and Table 2) are in line with previous studies [3,15,16,17,18,19,20,21,22,23] who reported that pre-treating animal slurries with biochar could modify the physicochemical properties, like as increasing pH, C/N ratio and cation-exchange capacity, and microbial activities. The explanation is that biochar was a porous carbonaceous material largely containing C jointly with the inorganic components of the biomass utilized, such as alkali and alkaline earth metals [21]. On other hand, the addition of biochar at a rate of 2.5% appear not reduce E. coli during the 85 days of experiment (Table 2), agreeing with Soares et al. [18] who reported a marked decrease in CFU mL−1 for survival of E. coli by the storage period (90 days) and not by the addition of biochar at a rate of 4.5% to cattle slurry. However, recent studies [24,25] suggest that the presence of biochar influences the removal of E. coli and minimizes the impact on bacterial viability, which requires further research.
The addition of clinoptilolite reduced NH3 losses from slurry due the great affinity for NH4+ and consequently preserved N in amended treatments (Table 1). Such an effect was because clinoptilolite are crystalline, hydrated aluminosilicates of alkali and alkaline earth cations with high porosity, ion exchange and adsorption capacity for NH4+ retention [19,26]. At the beginning of the experiment, clinoptilolite decreased the prevalence of E. coli in amended treatments (Table 2) which might be explained by the antibacterial properties, already documented in a previous study [27].

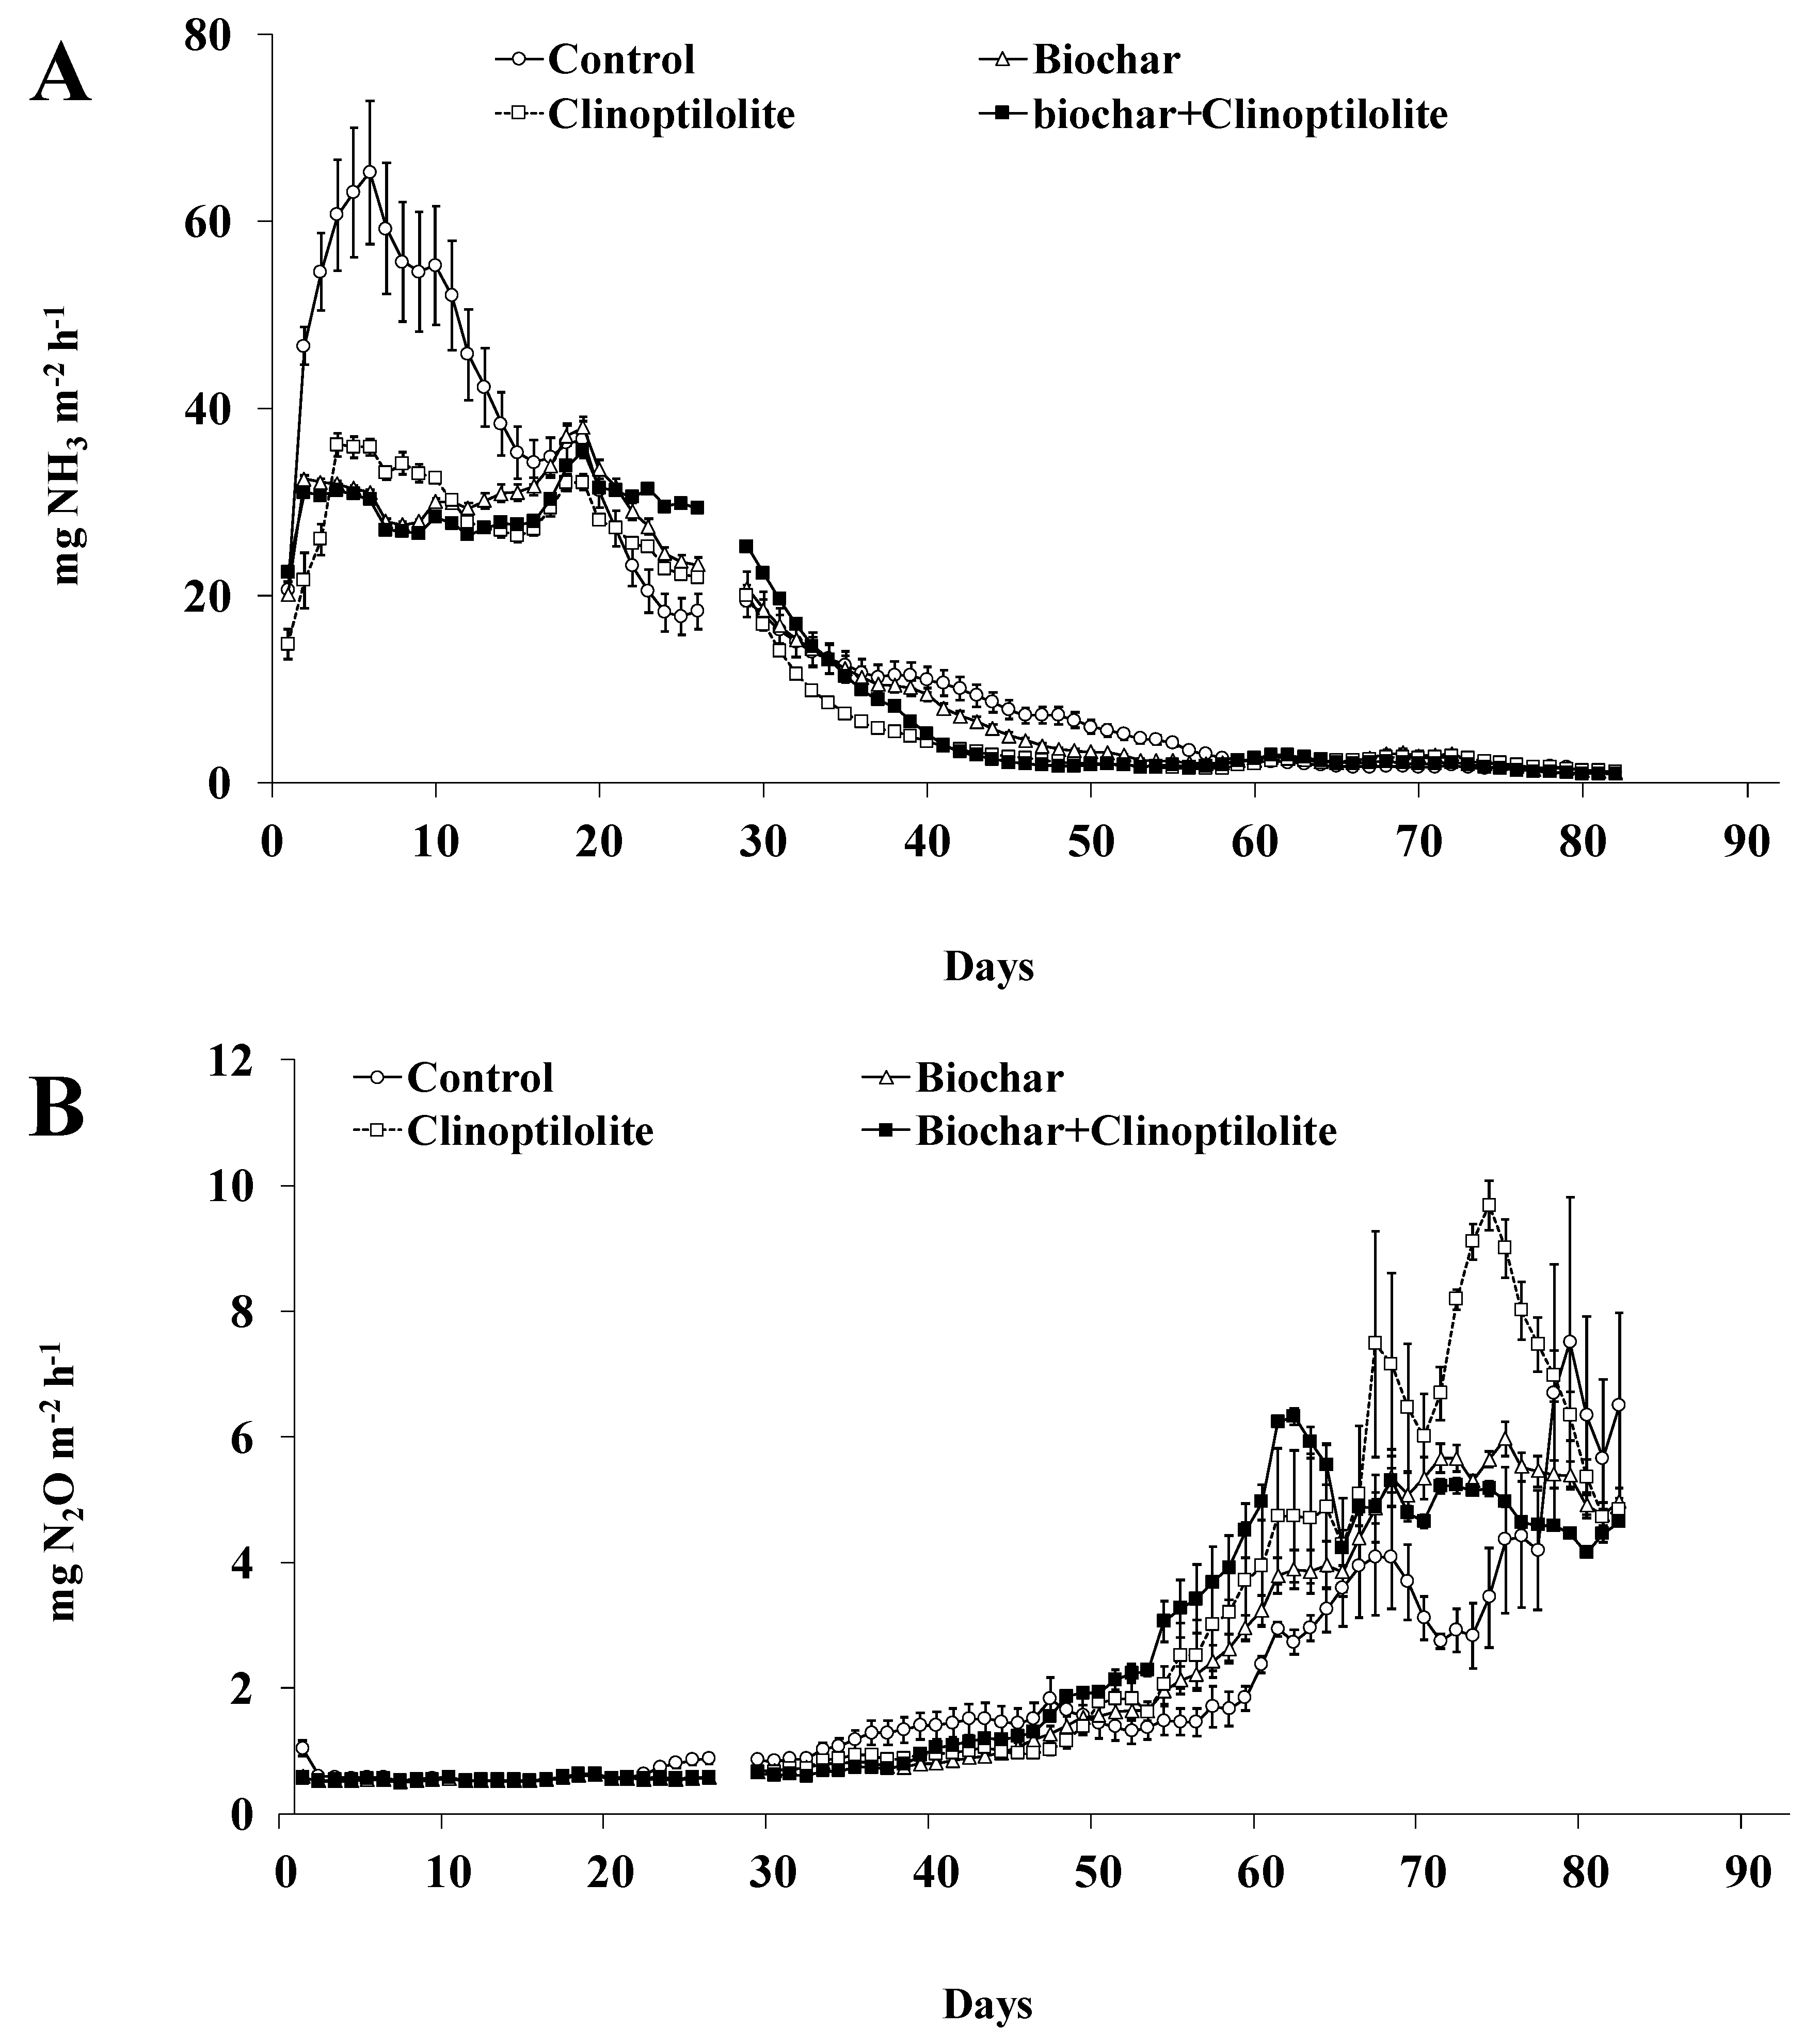
3.2. Nitrogen Emissions

The daily fluxes of NH3 and N2O from treatments during the experiment are shown in Figure 2A,B. Comparatively to amended treatments, the daily NH3 fluxes of treatment Control were significantly higher (p < 0.05) in the first 19 days, with a great peak in the first 6 days (20 to 65 mg NH3 m−2 h−1) followed by a progressive decrease (65 to 35 mg NH3 m−2 h−1) until day 19 of experiment. The daily NH3 fluxes of amended treatments increased (15 to 35 mg NH3 m−2 h−1) in the first 19 days, followed by a progressive decrease (35 to 2 mg NH3 m−2 h−1) until the end of the experiment including in the treatment Control (Figure 2A). Compared to the treatment Control, the amended treatments reduced significantly (p < 0.05) the daily NH3 fluxes in the first 19 days (30–35% lower), followed by an significant increase (p < 0.05) (10–38% higher) until day 30 and a significant decrease (p < 0.05) until day 60 (34–52% higher), and finally reduction for the Control level until the end of the experiment (Figure 2A). It is noteworthy that the daily NH3 fluxes from treatments Clinoptilolite and Biochar + Clinoptilolite were lower in about 15% when compared with treatment Biochar whereas, in most measurement days, were observed quite similar NH3 fluxes between treatments Biochar and Biochar + Clinoptilolite (Figure 2A). The cumulative NH3 emissions (expressed in g m−2 or as % of applied N) did not differed significantly (p > 0.05) among amended treatments, being significantly lower (p < 0.05) by about 26% than in treatment Control (Table 3). The cumulative NH3 losses in treatments Clinoptilolite and Biochar + Clinoptilolite were lower in about 10% when compared with treatment Biochar, despite these differences were not statistically significant (p > 0.05) (Table 3).
As can be seen in Table 3, the addition of biochar and clinoptilolite alone or in combination decreased NH3 emissions due the high specific surface area and the high cation exchange capacity of these additives, that enhance the NH4+ and NH3 binding [20]. Kalus et al. [23] reported that the addition of biochar (1–12% w/w) to animal manure could reduce NH3 emissions from 12 to 77%, being comparable with the value observed in the present study (26% of reduction). Maurer et al. [22] reported up to 23% of NH3 reduction for pig slurry amended with pinewood biochar (1.14–4.56 kg m−2) and Brennan et al. [28] found 77% NH3 reduction for dairy cattle slurry treated with wood shavings biochar (12% v/v). In this study, the reduction of NH3 emissions (26% reduction) by the addition of clinoptilolite, was lower than emissions reported in other studies [29,30] for cattle and pig slurries (50–70% reduction), which could be related with the higher rate of clinoptilolite used in referred studies (0.40–6.25 w/w). In addition, no advantages were gained from the combination of biochar with clinoptilolite.
As can be seen in Table 3, the addition of biochar and clinoptilolite alone or in combination decreased NH3 emissions due the high specific surface area and the high cation exchange capacity of these additives, that enhance the NH4+ and NH3 binding [20]. Kalus et al. [23] reported that the addition of biochar (1–12% w/w) to animal manure could reduce NH3 emissions by from 12% to 77%, being comparable with the value observed in the present study (26% of reduction). Maurer et al. [22] reported up to 23% of NH3 reduction for pig slurry amended with pinewood biochar (1.14–4.56 kg m−2) and Brennan et al. [28] found 77% NH3 reduction for dairy cattle slurry treated with wood shavings biochar (12% v/v). At this study, the reduction of NH3 emissions (26% reduction) by the addition of clinoptilolite, was lower than emissions reported in other studies [29,30] for cattle and pig slurries (50–70% reduction), which could be related with the higher rate of clinoptilolite used in referred studies (0.40–6.25 w/w). In addition, no advantages were gained from the combination of biochar with clinoptilolite.
The daily N2O fluxes follow the same trend, independently of the treatment, with a progressive increase (0.5 to 2 mg N2O m−2 h−1) in the first 50 days followed by a strong increase (2 to 10 mg N2O m−2 h−1) until the end of the experiment (Figure 2B). Compared to the treatment Control, the amended treatments reduced significantly (p < 0.05) the daily N2O fluxes in the first 50 days (14–18% lower) followed by a significant increase (p < 0.05) until the end of the experiment (32–67% higher) (Figure 2B). On most measurement days, significantly higher (p < 0.05) N2O fluxes from day 50 until the end of the experiment were observed according to the following order: Clinoptilolite > Biochar + Clinoptilolite > Biochar > Control (Figure 2B). In the 85 days of experiment, the daily N2O fluxes of treatments Clinoptilolite and Biochar + Clinoptilolite were higher in about 11% relative to treatment Biochar (Figure 2B). The cumulative N2O emissions (expressed in g m−2 or as % of applied N) were not significantly different (p > 0.05) between amended treatments; and only treatment Clinoptilolite was significantly higher (p < 0.05), by about 30%, than treatment Control (Table 2). The cumulative N2O loss in treatment Clinoptilolite was higher in about 21% relative to treatment Biochar, but not statistically different (p > 0.05) (Table 3).
The N2O losses originated in the nitrification and denitrification processes, which occurs when both aerobic and anaerobic conditions coexist in the slurries [31]. The N2O emissions observed in the present study appears to be mainly emitted by the nitrification process, because the aerobic condition created by the continuous air exchange and low depth of the slurry containers. The addition of biochar and clinoptilolite alone or combined led to NH4+ retention, decreasing the N2O losses until day 50 of experiment. From this day until the end of the experiment an increase of N2O emissions was observed, which may be related with the saturation of the capacity of NH4+ adsorption of the additives [19,20]. In addition, no further reduction in N2O emissions was observed by combining the two additives. Excluding differences on rates and composition of additives, the results of this study are lower than previous studies, where Brennan et al. [28] reported that cattle slurry amended with pinewood biochar (12% v/v) reduced N2O loss by 63% and Pereira et al. [19] referred that poultry manure amended with clinoptilolite (2.344 kg m−2) reduced N2O loss by 34% and Wang et al. [32] found that pig manure amended with biochar (10% w/w) mixed with clinoptilolite reduced N2O loss in about 80%.
The N (NH3 + N2O) emissions, expressed as g m−2 or as % of applied N, were not significantly different (p > 0.05) among amended treatments, being significantly lower (p < 0.05) in about 21% than in treatment Control (Table 3). The cumulative N losses in treatments Clinoptilolite and Biochar + Clinoptilolite were reduced in about 8% relative to treatment Biochar but not statistically significant (p > 0.05) (Table 3).

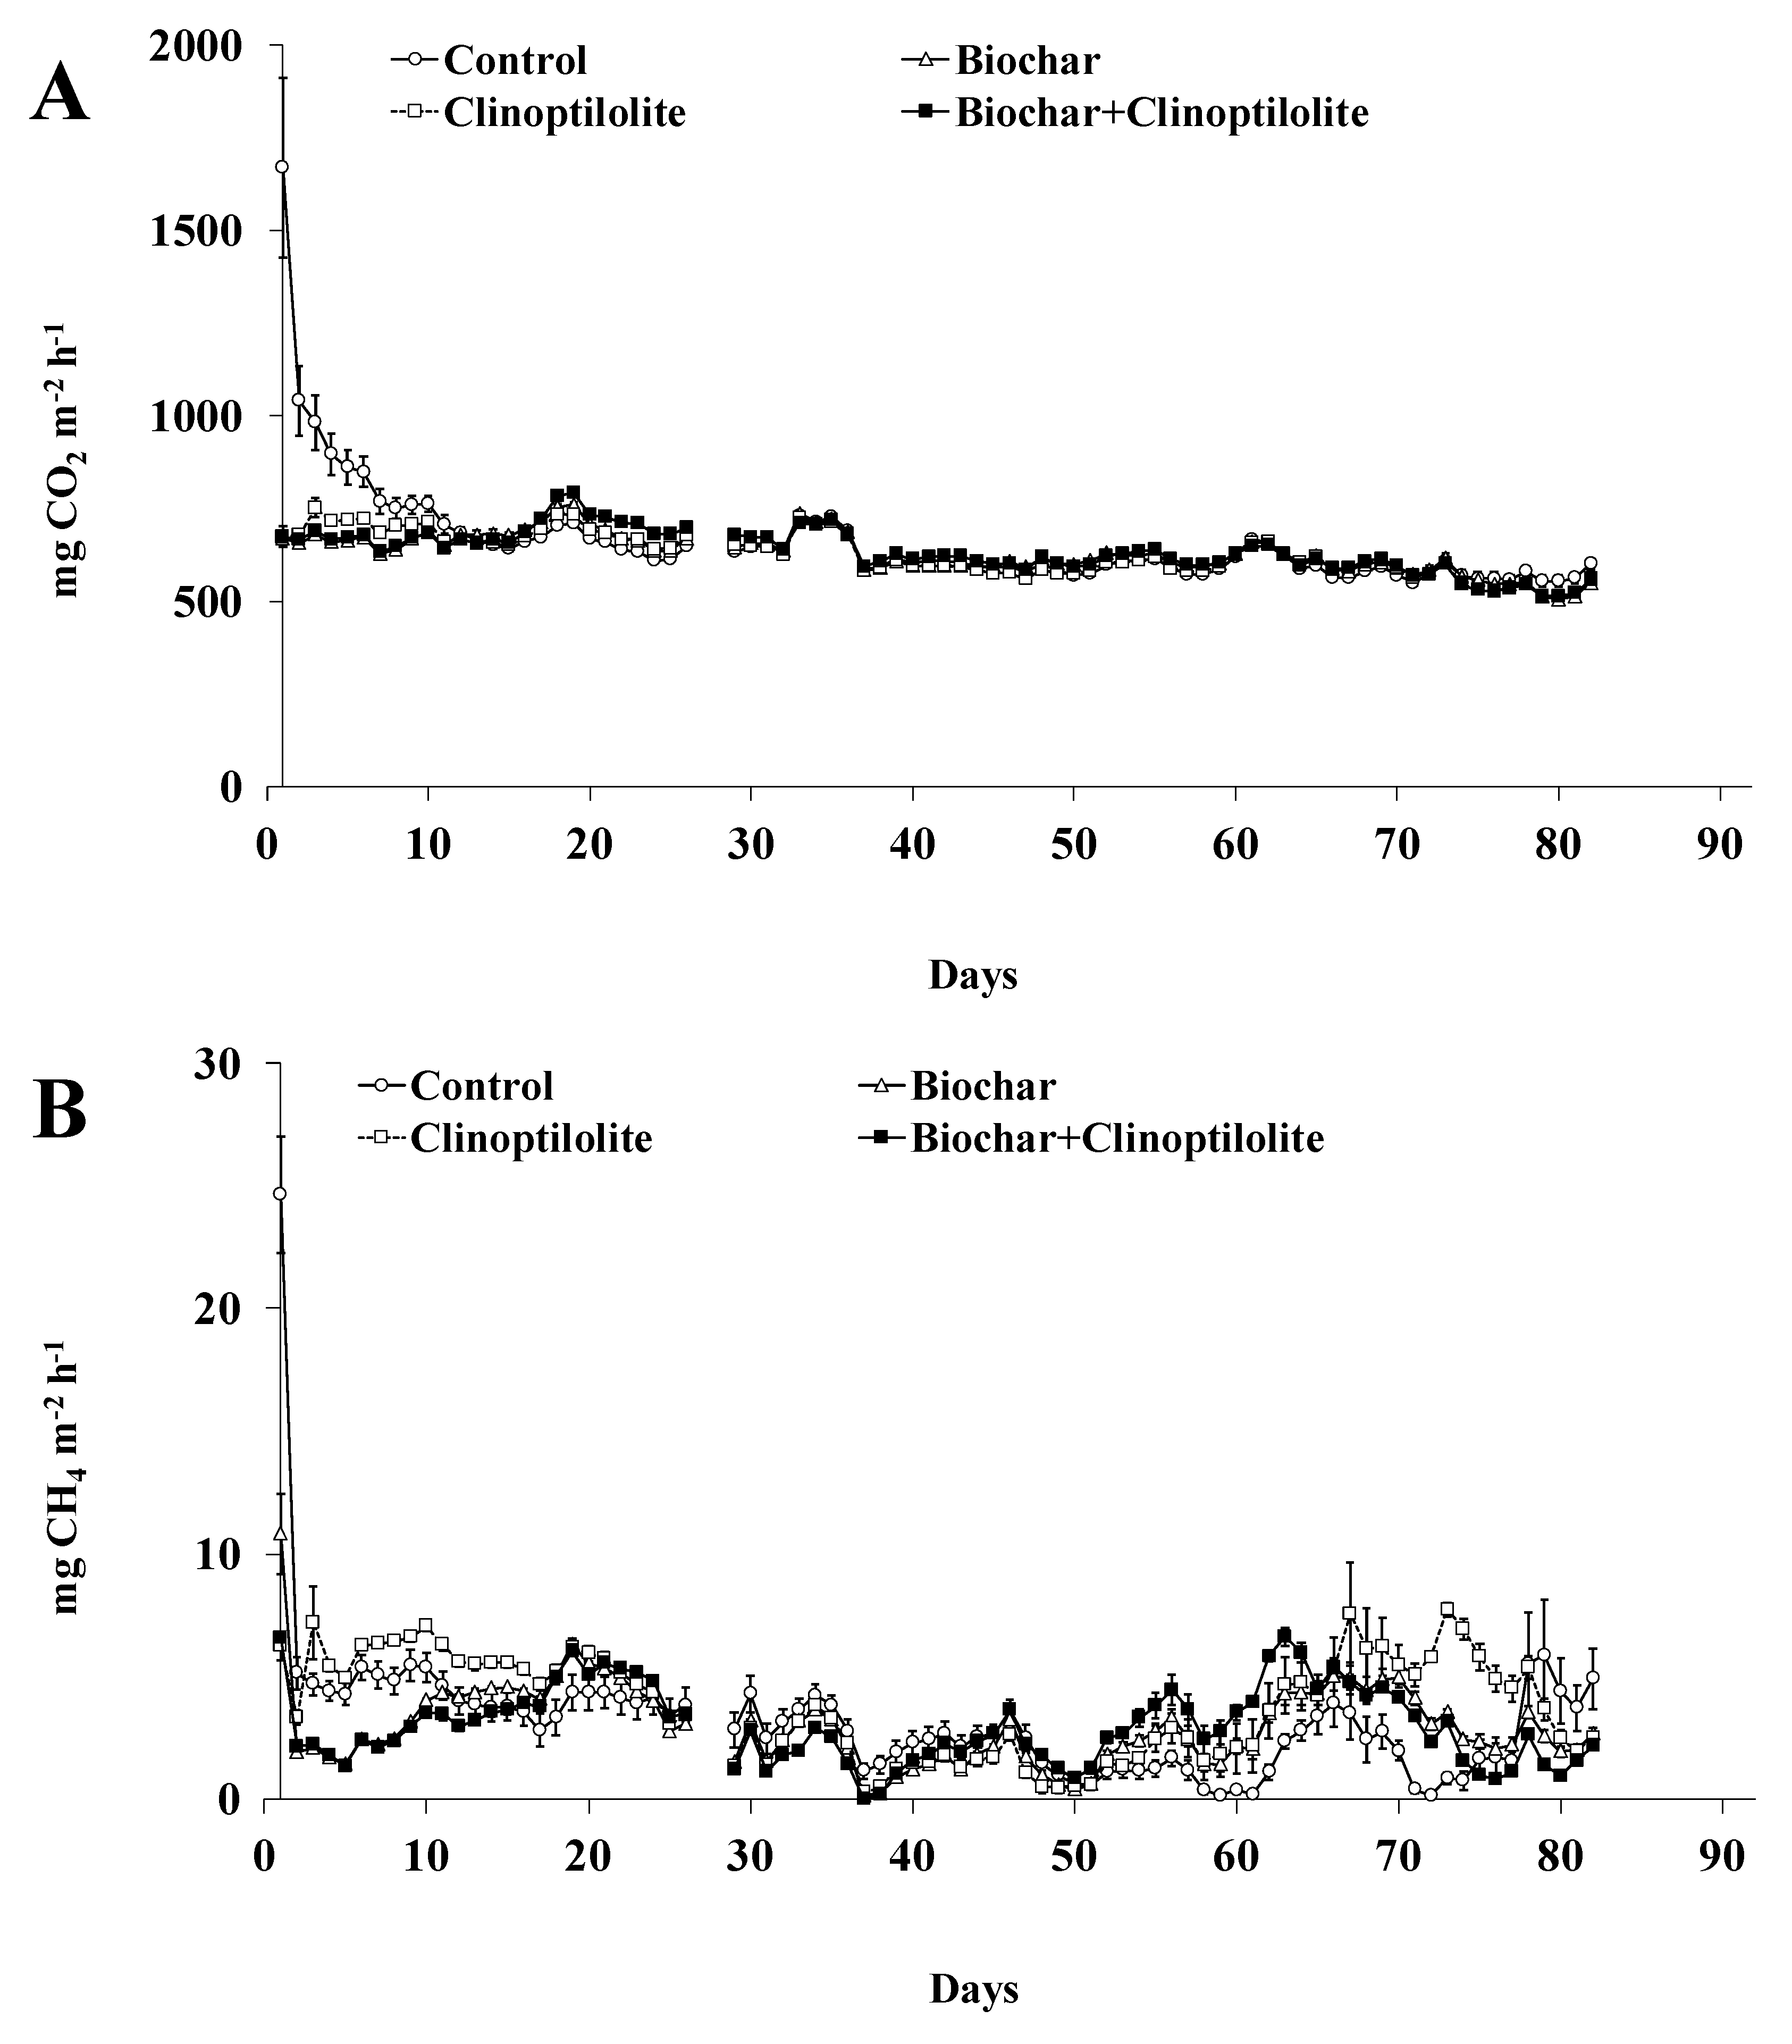
3.3. Carbon Emissions

The CO2 and CH4 daily fluxes from treatments along the experiment are shown in Figure 3A,B. Higher CO2 fluxes were observed over the first 20 days of the experiment (630 to 1670 mg CO2 m−2 h−1), followed by a small reduction (640 to 510 mg CO2 m−2 h−1) until the end of the experiment (Figure 3A). Compared to treatment Control, the amended treatments reduced significantly (p < 0.05) the daily CO2 fluxes, in about 19%, during the first 13 days of experiment. After this day until the end of the experiment, no significant differences (p > 0.05) were observed between all treatments including Control (Figure 3A). The cumulative CO2 emissions, expressed in g m−2, from amended treatments were significantly lower (p < 0.05) in about 5% when compared with treatment Control. When expressed as % of applied C, the CO2 emissions from treatments Biochar and Biochar + Clinoptilolite were significantly lower (p < 0.05) in about 50% than from treatments Control or Clinoptilolite (Table 3).
The CO2 losses coming from the microbial degradation of the organic matter and the hydrolysis of the urea [19]. Biochar decreased the CO2 emissions in 50% (expressed in % of applied C) whereas clinoptilolite appears had no effect on these losses (Table 3). In agreement with our results, previous studies reported that CO2 emission from animal manure was reduced by 34–63% by adding biochar (10% w/w) [28,32] whereas the application of clinoptilolite (2.344 kg m−2) appears have no effect on CO2 emission [19]. Excluding differences among biochar’s like feedstock, method and temperature pyrolysis, the reduction of CO2 emissions by adding biochar could be related with either sorption of onto the biochar or a reduction in the labile C availability [23,28].
In all amended treatments, the CH4 daily fluxes peaked (7 to 25 mg CH4 m−2 h−1) on the first day of the experiment, followed by a progressive decrease (7 to 0 mg CH4 m−2 h−1) between day 2 and 50 and then increased (0.5 to 8 mg CH4 m−2 h−1) from day 51 until the end of the experiment (Figure 3B). Compared to treatment Control, in the first 17 days of the experiment the daily CH4 fluxes were significantly lower (p < 0.05), by about 30%, in treatments Biochar and Biochar + Clinoptilolite but significantly higher (p < 0.05), by about 26%, in treatment Clinoptilolite (Figure 3B). Then, on most measurement dates, the daily CH4 fluxes from amended treatments were significantly reduced (p < 0.05) by 9–20% between days 2 and 50 of the experiment (Figure 3B). Up to day 51 until the end of the experiment, the daily CH4 fluxes in amended treatments were significantly higher (p < 0.05) than in the treatment Control with increases between 240 and 380% (Figure 3B). The cumulative CH4 emissions, expressed in g m−2, were not significantly different (p > 0.05) among treatments (Table 3). When expressed as a % of applied C, the CH4 cumulative emissions from treatments Biochar and Biochar + Clinoptilolite were significantly lower (p < 0.05) in about 55% relative to treatments Control or Clinoptilolite (Table 3).
Methane is produced mainly by microbial decomposition of organic matter under anaerobic conditions [33,34]. Biochar reduced the CH4 emission by 55% while clinoptilolite seems had no effect on such loss (Table 3). Previous studies [32,35,36] reported that the emission of CH4 from animal manures could be reduced by 50–95% by adding biochar and clinoptilolite alone or in combination (5–10% w/w of each additive), this being explained by the adsorption ability of the additives. However, in this study, the addition of clinoptilolite to pig slurry did not cause an increase or a reduction in CH4 emissions because the experiment has been done on the liquid fraction of the slurry.
The C (CO2 + CH4) emissions (in g m−2) were not significantly different (p > 0.05) among amended treatments (Table 3). However, the cumulative C losses, as % of applied C, from the treatments Biochar and Biochar + Clinoptilolite were significantly lower (p < 0.05) in about 50% relative to treatments Control or Clinoptilolite (Table 3). The cumulative emissions expressed as GWP did not differed significantly (p > 0.05) between treatments (Table 3). Thus, the addition of biochar or clinoptilolite to pig slurry did not cause an increase or a reduction in GWP in this study.

3.4. Benefits of Storage Additives

The results of this laboratory study showed the potential of adding biochar and clinoptilolite in order to reduce NH3 emissions in the storage of pig slurry, without increasing the GWP, and avoiding “pollution swapping” between NH3 and N2O emissions. However, no advantages were gained from the combination of these two additives on gaseous emissions. In addition to the gains on the reduction of environmental impacts to the atmosphere during the storage stage, the treatment of slurry either by biochar or clinoptilolite will increase the N availability for crops or consequently increase yields. Moreover, biochar will improve the soil biological activities, nutrient retention, water-retention capacity, increase of pH value and amount of soil organic matter [21], whereas clinoptilolite will increase moisture retention in the soil due to increased soil surface area and cation exchange capacity [37].
Although caution must be exercised when extrapolating laboratory studies to farm-scale conditions, the inclusion of the additives with the slurry at the storage stage and prior to soil application represent an efficient method because of reduced environmental impacts from these two stages of manure management (storage and soil application). Therefore, integrated studies are necessary to evaluate the impact of biochar and clinoptilolite on all stages of animal manure management, namely feeding, housing, storage and soil application.

4. Conclusions

The results indicated that the addition of biochar could modify the physicochemical properties of the liquid fraction. The addition of biochar did not reduce the E. coli during the experiment while clinoptilolite decreased its prevalence. The addition of biochar or clinoptilolite reduced significantly the NH3 emission during the storage of pig slurry, but no advantages were gained with their combination. The addition of biochar significantly reduced the CO2 and CH4 emission relative to clinoptilolite, when expressed as % of total C applied, however N2O emission and global warming potential did not differ among the additives. Hence, biochar and clinoptilolite are recommended as a mitigation measure to reduce gaseous emissions and preserve the fertiliser value of slurry, and do not require modification of the storage structure.

Author Contributions

Conceptualization, J.L.S.P.; methodology, J.L.S.P., V.F. and A.P.; software, J.L.S.P., V.F. and A.P.; validation, J.L.S.P., V.F., A.F.M.A.P., M.E.F.S., I.B., A.P. and D.F.W.; formal analysis, J.L.S.P., V.F. and A.P.; investigation, J.L.S.P., V.F., A.F.M.A.P., M.E.F.S., I.B. and A.P.; resources, J.L.S.P., V.F., A.F.M.A.P., M.E.F.S., I.B., A.P. and D.F.W.; data curation, V.F., A.F.M.A.P., M.E.F.S., I.B. and A.P.; writing—original draft preparation, J.L.S.P., V.F. and A.P.; writing—review and editing, J.L.S.P., V.F. and A.P.; visualization, J.L.S.P., V.F. and A.P.; supervision, J.L.S.P.; project administration, J.L.S.P. and D.F.W.; funding acquisition, J.L.S.P. and D.F.W. All authors have read and agreed to the published version of the manuscript.

Funding

This research was funded by National Funds by FCT—Portuguese Foundation for Science and Technology, under the project UIDB/04033/2020, and projects WASTE2VALUE PDR2020-1.0.1-FEADER-032314 and WASTECLEAN PROJ/IPV/ID&I/019.

Conflicts of Interest

The authors declare no conflict of interest.

Nomenclature

Symbols
ØDiameter, mm
Al2O3Aluminium oxide, g kg−1
BODBiological oxygen demand, mg O2 L−1
CCarbon, g kg−1
CaOCalcium oxide, g kg−1
CFU Colony forming unit, mL−1
CH4Methane, mg m−2 h−1
CO2Carbon dioxide, mg m−2 h−1
DMDry matter, g kg−1
EMISSIONGas emission, mg h−1
FLOWAir flowrate, m3 h−1
GINLETInlet gas concentration, mg m−3
GOUTLETOutlet gas concentration, mg m−3
HHeight, mm
K2OPotassium oxide, g kg−1
MgOMagnesium oxide, g kg−1
NNitrogen, g kg−1
Na2OSodium oxide, g kg−1
NH3Ammonia, mg m−2 h−1
NH4+Ammonium, g kg−1
N2ONitrous oxide, mg m−2 h−1
NO3Nitrate, mg kg−1
SiO2Silicon dioxide, g kg−1
TiO2Titanium oxide, g kg−1
VOLVolume of slurry, %
Abbreviations
ANOVAAnalysis of variance
BETBrunauer, Emmett and Teller
Bio.Biochar
C emissionsCumulative C (CO2 + CH4) emissions
CEC Cation exchange capacity
Clino.Clinoptilolite
C/NCarbon/nitrogen ratio
E. coliEscherichia coli
ENEuropean normalization
GWPGlobal warming potential
ISOInternational Organization for Standardization
nNumber of replications
N emissionsCumulative N (NH3 + N2O) emissions
pProbability level
PTFEPolytetrafluoroethylene
TCTotal C
TNTotal N
XRDX-ray diffraction analysis

References

  1. Sommer, S.G.; Christensen, M.L.; Schmidt, T.; Jensen, L.S. Animal Manure Recycling: Treatment and Management; Wiley: Winchester, UK, 2013; p. 384. [Google Scholar]
  2. IPCC. 2019 Refinement to the 2006 IPCC Guidelines for National Greenhouse Gas Inventories; Calvo Buendia, E., Tanabe, K., Kranjc, A., Baasansuren, J., Fukuda, M., Ngarize, S., Osako, A., Pyrozhenko, Y., Shermanau, P., Federici, S., Eds.; IPCC: Geneva, Switzerland, 2019; Available online: http://www.ipcc-nggip.iges.or.jp (accessed on 10 July 2020).
  3. Ba, S.; Qu, Q.; Zhang, K.; Groot, J.C.J. Meta-analysis of greenhouse gas and ammonia emissions from dairy manure composting. Biosyst. Eng. 2020, 193, 126–137. [Google Scholar] [CrossRef]
  4. Hristov, A.N.; Hanigan, M.; Cole, A.; Todd, R.; McAllister, T.A.; Ndegwa, P.M.; Rotz, A. Review: Ammonia emissions from dairy farms and beef feedlots. Can. J. Anim. Sci. 2011, 91, 1–35. [Google Scholar] [CrossRef] [Green Version]
  5. Ye, Z.; Zhu, S.; Kai, P.; Li, B.; Blanes-Vidal, V.; Pan, J.; Zhang, G. Key factors driving ammonia emissions from a pig house slurry pit. Biosyst. Eng. 2011, 108, 195–203. [Google Scholar] [CrossRef]
  6. Medinets, S.; Skiba, U.; Rennenberg, H.; Butterbach-Bahl, K. A review of soil NO transformation: Associated processes and possible physiological significance on organisms. Soil Biol. Biochem. 2015, 80, 92–117. [Google Scholar] [CrossRef] [Green Version]
  7. Misselbrook, T.; Hunt, J.; Perazzolo, F.; Provolo, G. Greenhouse gas and ammonia emissions from slurry storage: Impacts of temperature and potential mitigation through covering (pig slurry) or acidification (cattle slurry). J. Environ. Qual. 2016, 45, 1520–1530. [Google Scholar] [CrossRef] [PubMed]
  8. Montes, F.; Meinen, R.; Dell, C.; Rotz, A.; Hristov, A.N.; Oh, J.; Waghorn, G.; Gerber, P.J.; Henderson, B.; Makkar, H.P.S. Mitigation of methane and nitrous oxide emissions from animal operations: II. A review of manure management options. J. Anim. Sci. 2013, 91, 5070–5094. [Google Scholar] [CrossRef] [PubMed] [Green Version]
  9. McCrory, D.F.; Hobbs, P.J. Additives to reduce ammonia and odor emissions from livestock wastes: A review. J. Environ. Qual. 2001, 30, 345–355. [Google Scholar] [CrossRef] [Green Version]
  10. Sajeev, E.P.M.; Winiwarter, W.; Amon, B. Greenhouse gas and ammonia emissions from different stages of liquid manure management chains: Abatement options and emission interactions. J. Environ. Qual. 2018, 47, 30–41. [Google Scholar] [CrossRef] [Green Version]
  11. Mcllroy, J.P.; McGeough, K.L.; Laughlin, R.J.; Carolan, R. Abatement of ammonia emissions from dairy cow house concrete floor surfaces through additive application. Biosyst. Eng. 2019, 188, 320–330. [Google Scholar] [CrossRef]
  12. Fangueiro, D.; Pereira, J.; Chadwick, D.; Coutinho, J.; Moreira, N.; Trindade, H. Laboratory assessment of the effect of cattle slurry pre-treatment on organic N degradation after soil application and N2O and N2 emissions. Nutr. Cycl. Agroecosyst. 2008, 80, 107–120. [Google Scholar] [CrossRef]
  13. Fangueiro, D.; Gusmão, M.; Grilo, J.; Porfírio, G.; Vasconcelos, E.; Cabral, F. Proportion, composition and potential N mineralisation of particle size fractions obtained by mechanical separation of animal slurry. Biosyst. Eng. 2010, 106, 333–337. [Google Scholar] [CrossRef]
  14. Fangueiro, D.; Lopes, C.; Surgy, S.; Vasconcelos, E. Effect of the pig slurry separation techniques on the characteristics and potential availability of N to plants in the resulting liquid and solid fractions. Biosyst. Eng. 2012, 113, 187–194. [Google Scholar] [CrossRef] [Green Version]
  15. Moset, V.; Cambra-López, M.; Estellés, F.; Torres, A.G.; Cerisuelo, A. Evolution of chemical composition and gas emissions from aged pig slurry during outdoor storage with and without prior solid separation. Biosyst. Eng. 2012, 111, 2–10. [Google Scholar] [CrossRef] [Green Version]
  16. Pereira, J.; Fangueiro, D.; Misselbrook, T.H.; Chadwick, D.R.; Coutinho, J.; Trindade, H. Ammonia and greenhouse gas emissions from slatted and solid floors in dairy cattle houses: A scale model study. Biosyst. Eng. 2011, 109, 148–157. [Google Scholar] [CrossRef]
  17. Pereira, J.; Misselbrook, T.H.; Chadwick, D.R.; Coutinho, J.; Trindade, H. Effects of temperature and dairy cattle excreta characteristics on potential ammonia and greenhouse gas emissions from housing: A laboratory study. Biosyst. Eng. 2012, 112, 138–150. [Google Scholar] [CrossRef]
  18. Soares, A.S.; Miranda, C.; Teixeira, C.A.; Coutinho, J.; Trindade, H.; Coelho, A.C. Impact of different treatments on Escherichia coli during storage of cattle slurry. J. Environ. Manag. 2019, 236, 323–327. [Google Scholar] [CrossRef] [PubMed]
  19. Pereira, J.L.S.; Ferreira, S.; Pinheiro, V.; Trindade, H. Ammonia and greenhouse gas emissions following the application of clinoptilolite on the litter of a breeding hen house. Environ. Sci. Pollut. Res. 2019, 26, 8352–8357. [Google Scholar] [CrossRef]
  20. Clough, T.J.; Condron, L.M.; Kammann, C.; Müller, C. A review of biochar and soil nitrogen dynamics. Agronomy 2013, 3, 275–293. [Google Scholar] [CrossRef] [Green Version]
  21. Nanda, S.; Dalai, A.K.; Berruti, F.; Kozinski, J.A. Biochar as an exceptional bioresource for energy, agronomy, carbon sequestration, activated carbon and specialty materials. Waste Biomass Valorization 2016, 7, 201–235. [Google Scholar] [CrossRef]
  22. Maurer, D.L.; Koziel, J.A.; Kalus, K.; Anderson, D.S.; Opalinski, S. Pilot-scale testing of non-activated biochar for swine manure treatment and mitigation of ammonia, hydrogen sulfide, odorous volatile organic compounds (VOCs) and greenhouse gas emissions. Sustainability 2017, 9, 929. [Google Scholar] [CrossRef] [Green Version]
  23. Kalus, K.; Koziel, J.A.; Opaliński, S. A review of biochar properties and their utilization in crop agriculture and livestock production. Appl. Sci. 2019, 9, 3494. [Google Scholar] [CrossRef] [Green Version]
  24. Afrooz, A.R.M.N.; Boehm, A.B. Escherichia coli removal in biochar-modified biofilters: Effects of biofilm. PLoS ONE 2016, 11, e0167489. [Google Scholar] [CrossRef] [PubMed]
  25. Hill, R.A.; Hunt, J.; Sanders, E.; Tran, M.; Burk, G.A.; Mlsna, T.E.; Fitzkee, N.C. Effect of biochar on microbial growth: A metabolomics and bacteriological investigation in E. coli. Environ. Sci. Technol. 2019, 53, 2635–2646. [Google Scholar] [CrossRef] [PubMed]
  26. Ming, D.W.; Mumpton, F.A. Zeolite in soils. In Minerals in Soil Environments, 2nd ed.; Dixon, J.B., Weed, S.B., Eds.; SSSA Publisher Inc.: Madison, WI, USA, 1989; pp. 874–911. [Google Scholar]
  27. Jahanbakhsh, S.; Kabore, K.P.; Fravalo, P.; Letellier, A.; Fairbrother, J.M. Impact of medicated feed along with clay mineral supplementation on Escherichia coli resistance to antimicrobial agents in pigs after weaning in field conditions. Res. Vet. Sci. 2015, 102, 72–79. [Google Scholar] [CrossRef]
  28. Brennan, R.B.; Healy, M.G.; Fenton, O.; Lanigan, G.J. The effect of chemical amendments used for phosphorus abatement on greenhouse gas and ammonia emissions from dairy cattle slurry: Synergies and pollution swapping. PLoS ONE 2015, 10, e0111965. [Google Scholar] [CrossRef] [Green Version]
  29. Lefcourt, A.M.; Meisinger, J.J. Effect of adding alum or zeolite to dairy slurry on ammonia volatilization and chemical composition. J. Dairy Sci. 2001, 84, 1814–1821. [Google Scholar] [CrossRef]
  30. Portejoie, S.; Martinez, J.; Guiziou, F.; Coste, C.M. Effect of covering pig slurry stores on the ammonia emission processes. Bioresour. Technol. 2003, 87, 199–207. [Google Scholar] [CrossRef]
  31. Loyon, L.; Guiziou, F.V.; Beline, F.; Peu, P. Gaseous emissions (NH3, N2O, CH4 and CO2) from the aerobic treatment of piggery slurry—Comparison with a conventional storage system. Biosyst. Eng. 2007, 97, 472–480. [Google Scholar] [CrossRef]
  32. Wang, Q.; Awasthi, M.K.; Ren, X.N.; Zhao, J.C.; Li, R.H.; Wang, Z.; Wang, M.J.; Chen, H.Y.; Zhang, Z.Q. Combining biochar, zeolite and wood vinegar for composting of pig manure: The effect on greenhouse gas emission and nitrogen conservation. Waste Manag. 2018, 74, 221–230. [Google Scholar] [CrossRef]
  33. Sommer, S.G.; Petersen, S.O.; Sorensen, P.; Poulsen, H.D.; Moller, H.B. Methane and carbon dioxide emissions and nitrogen turnover during liquid manure storage. Nutr. Cycl. Agroecosyst. 2007, 78, 27–36. [Google Scholar] [CrossRef]
  34. Regueiro, I.; Coutinho, J.; Gioelli, F.; Balsari, P.; Dinuccio, E.; Fangueiro, D. Acidification of raw and co-digested pig slurries with alum before mechanical separation reduces gaseous emission during storage of solid and liquid fractions. Agric. Ecosyst. Environ. 2016, 227, 42–51. [Google Scholar] [CrossRef]
  35. Awasthi, M.K.; Wang, Q.; Ren, X.; Zhao, J.; Huang, H.; Awasthi, S.K.; Lahori, A.H.; Li, R.; Zhou, L.; Zhang, Z. Role of biochar amendment in mitigation of nitrogen loss and greenhouse gas emission during sewage sludge composting. Bioresour. Technol. 2016, 219, 270–280. [Google Scholar] [CrossRef]
  36. Mao, H.; Zhang, H.Y.; Fu, Q.; Zhong, M.Z.; Li, R.H.; Zhai, B.N.; Wang, Z.H.; Zhou, L.N. Effects of four additives in pig manure composting on greenhouse gas emission reduction and bacterial community change. Bioresour. Technol. 2019, 292, 121896. [Google Scholar] [CrossRef] [PubMed]
  37. Huang, Z.T.; Petrovic, A.M. Clinoptilolite zeolite influence on nitrate leaching and nitrogen use efficiency in simulated sand based golf greens. J. Environ. Qual. 1994, 23, 1190–1194. [Google Scholar] [CrossRef]
Figure 1. Schematic plan of the laboratory system used for measuring gaseous losses during the storage of pig slurry.
Applsci 10 05652 g001
Figure 2. Ammonia (A) and nitrous oxide (B) fluxes from each treatment. Vertical bars represent the standard error of the mean (n = 3).
Applsci 10 05652 g002
Figure 3. Carbon dioxide (A) and methane (B) fluxes from each treatment. Vertical bars represent the standard error of the mean (n = 3).
Applsci 10 05652 g003
Table 1. Physicochemical characteristics of the treatments at the beginning and end of the experiment (mean ± standard deviation) (n = 3).
TreatmentspHDry MatterTotal CTotal NNH4+NO3NH4+/TNC/N
0 days of experiment
Control8.5 ± 0.1 d0.7 ± 0.1 c20.9 ± 0.6 c1.9 ± 0.1 a1.5 ± 0.1 a,b87 ± 1 a0.8 ± 0.1 b11 ± 1 d
Biochar9.0 ± 0.1 b,c2.1 ± 0.2 a,b39.9 ± 0.3 a1.8 ± 0.1 a1.6 ± 0.1 a65 ± 4 a0.9 ± 0.1 a22 ± 1 c
Clino.8.5 ± 0.1 d1.6 ± 0.2 a,b,c20.4 ± 0.1 c1.9 ± 0.1 a1.3 ± 0.1 b80 ± 1 a0.7 ± 0.1 b11 ± 1 d
Bio. + Clino.8.9 ± 0.1 c2.7 ± 0.8 a39.9 ± 0.2 a1.9 ± 0.1 a1.4 ± 0.1 b59 ± 4 a0.7 ± 0.1 b21 ± 1 c
85 days of experiment
Control8.3 ± 0.1 d0.6 ± 0.1 c3.8 ± 0.6 d0.9 ± 0.2 c0.1 ± 0.1 c74 ± 25 a0.1 ± 0.1 c4 ± 1 e
Biochar9.4 ± 0.1 a1.5 ± 0.2 a,b,c20.4 ± 0.1 c0.2 ± 0.1 d0.1 ± 0.1 c87 ± 7 a0.1 ± 0.1 c93 ± 1 a
Clino.8.3 ± 0.1 d1.2 ± 0.2 b,c3.9 ± 0.1 d1.5 ± 0.1 b0.1 ± 0.1 c89 ± 9 a0.1 ± 0.1 c3 ± 1 e
Bio. + Clino.9.2 ± 0.1 b1.9 ± 0.4 a,b23.0 ± 0.1 b0.5 ± 0.1 d0.1 ± 0.1 c91 ± 7 a0.1 ± 0.1 c48 ± 1 b
p treat. (A)***********nsnsns***
p date (B)nsns*********ns******
A × B**ns*****nsnsns***
Note: pH: pH (H2O), Dry matter: DM (g kg−1), Total C: TC (g kg−1), Total N: TN (g kg−1), NH4+: NH4+-N (g N kg−1), NO3: NO3-N (mg N kg−1), NH4+/TN: NH4+:total N ratio, C/N: C:N ratio. Data expressed on a fresh-weight basis. Values from the interaction treatment × date are presented with different superscripts within columns, are significantly different (p < 0.05) by Tukey test. ns, *, ** and *** mean that the factor or interaction effects were, respectively, not significant or significant at the 0.05, 0.01 and 0.001 probability level.
Table 2. Biological characteristics of the treatments at the beginning and end of the experiment (mean ± standard deviation) (n = 3).
TreatmentsVolume of SlurryEscherichia coliBiological Oxygen Demand
0 days of experiment
Control100 a484 ± 21 b664 ± 45 a
Biochar100 a634 ± 71 a687 ± 16 a
Clinoptilolite100 a281 ± 40 c677 ± 33 a
Biochar + Clinoptilolite100 a455 ± 95 b705 ± 14 a
85 days of experiment
Control67 b1 ± 1 d328 ± 34 b
Biochar67 b1 ± 1 d140 ± 3 d
Clinoptilolite67 b1 ± 1 d215 ± 35 c
Biochar + Clinoptilolite67 b1 ± 1 d1 ± 1 e
p treatment (A)*********
p date (B)*********
A × Bns******
Note: Volume of slurry: VOL (% of the total volume of the container), Escherichia coli: E. coli (colony-forming units (CFU) mL−1), Biological oxygen demand: BOD (mg O2 L−1). Data expressed on a fresh-weight basis. Values from the interaction treatment × date are presented with different superscripts within columns, are significantly different (p < 0.05) by Tukey test. ns, *, ** and *** mean that the factor or interaction effects were, respectively, not significant or significant at the 0.05, 0.01 and 0.001 probability level.
Table 3. Cumulative gaseous emissions from each treatment (mean ± standard deviation) (n = 3).
ParametersTreatments
ControlBiocharClinoptiloliteBiochar + Clino.
NH3 (g m−2)34.1 ± 3.1 a26.9 ± 0.8 b23.9 ± 0.2 b25.9 ± 0.1 b
NH3 (% total N applied)63.7 ± 8.8 a52.5 ± 1.9 a,b46.9 ± 1.7 b47.3 ± 1.2 b
N2O (g m−2)4.1 ± 0.4 b4.3 ± 0.2 a,b5.2 ± 0.4 a4.7 ± 0.1 a,b
N2O (% total N applied)5.9 ± 1.2 b6.5 ± 0.6 a,b7.9 ± 1.4 a6.6 ± 0.2 a,b
N (g m−2)30.7 ± 2.8 a24.9 ± 0.8 b23.0 ± 0.4 b24.3 ± 0.1 b
N (% total N applied)69.6 ± 7.8 a59.1 ± 1.3 a,b54.8 ± 2.9 b53.9 ± 1.4 b
CO2 (g m−2)1345.3 ± 14.5 a1279.2 ± 2.5 b1276.1 ± 10.5 b1291.4 ± 5.3 b
CO2 (% total C applied)77.4 ± 3.3 a37.6 ± 0.3 b75.2 ± 0.9 a37.9 ± 0.4 b
CH4 (g m−2)6.8 ± 0.8 a6.1 ± 0.3 a7.6 ± 0.5 a6.0 ± 0.1 a
CH4 (% total C applied)1.0 ± 0.2 a0.4 ± 0.1 b1.1 ± 0.1 a0.4 ± 0.1 b
C (g m−2)371.4 ± 4.5 a352.9 ± 0.9 b353.1 ± 3.2 b356.2 ± 1.5 b
C (% total C applied)78.4 ± 3.1 a38.0 ± 0.2 b76.3 ± 1.0 a38.3 ± 0.4 b
GWP (g CO2-eq. m−2)2626.5 ± 148.2 a2597.9 ± 69.8 a2872.5 ± 135.6 a2694.9 ± 20.9 a
Note: Values presented with different superscripts within rows, are significantly different (p < 0.05) by Tukey test. N: NH3 + N2O. C: CO2 + CH4. GWP: global warming potential (CO2 = 1, CH4 = 28, direct N2O = 265, indirect N2O = 1% of NH3-N volatilised).

