Dependence of the Dust Emission on the Aggregate Sizes in Loess Soils

Abstract
1. Introduction
2. Materials and Methods
2.1. Soil Sample Setup
2.2. Dust Emission Experiment
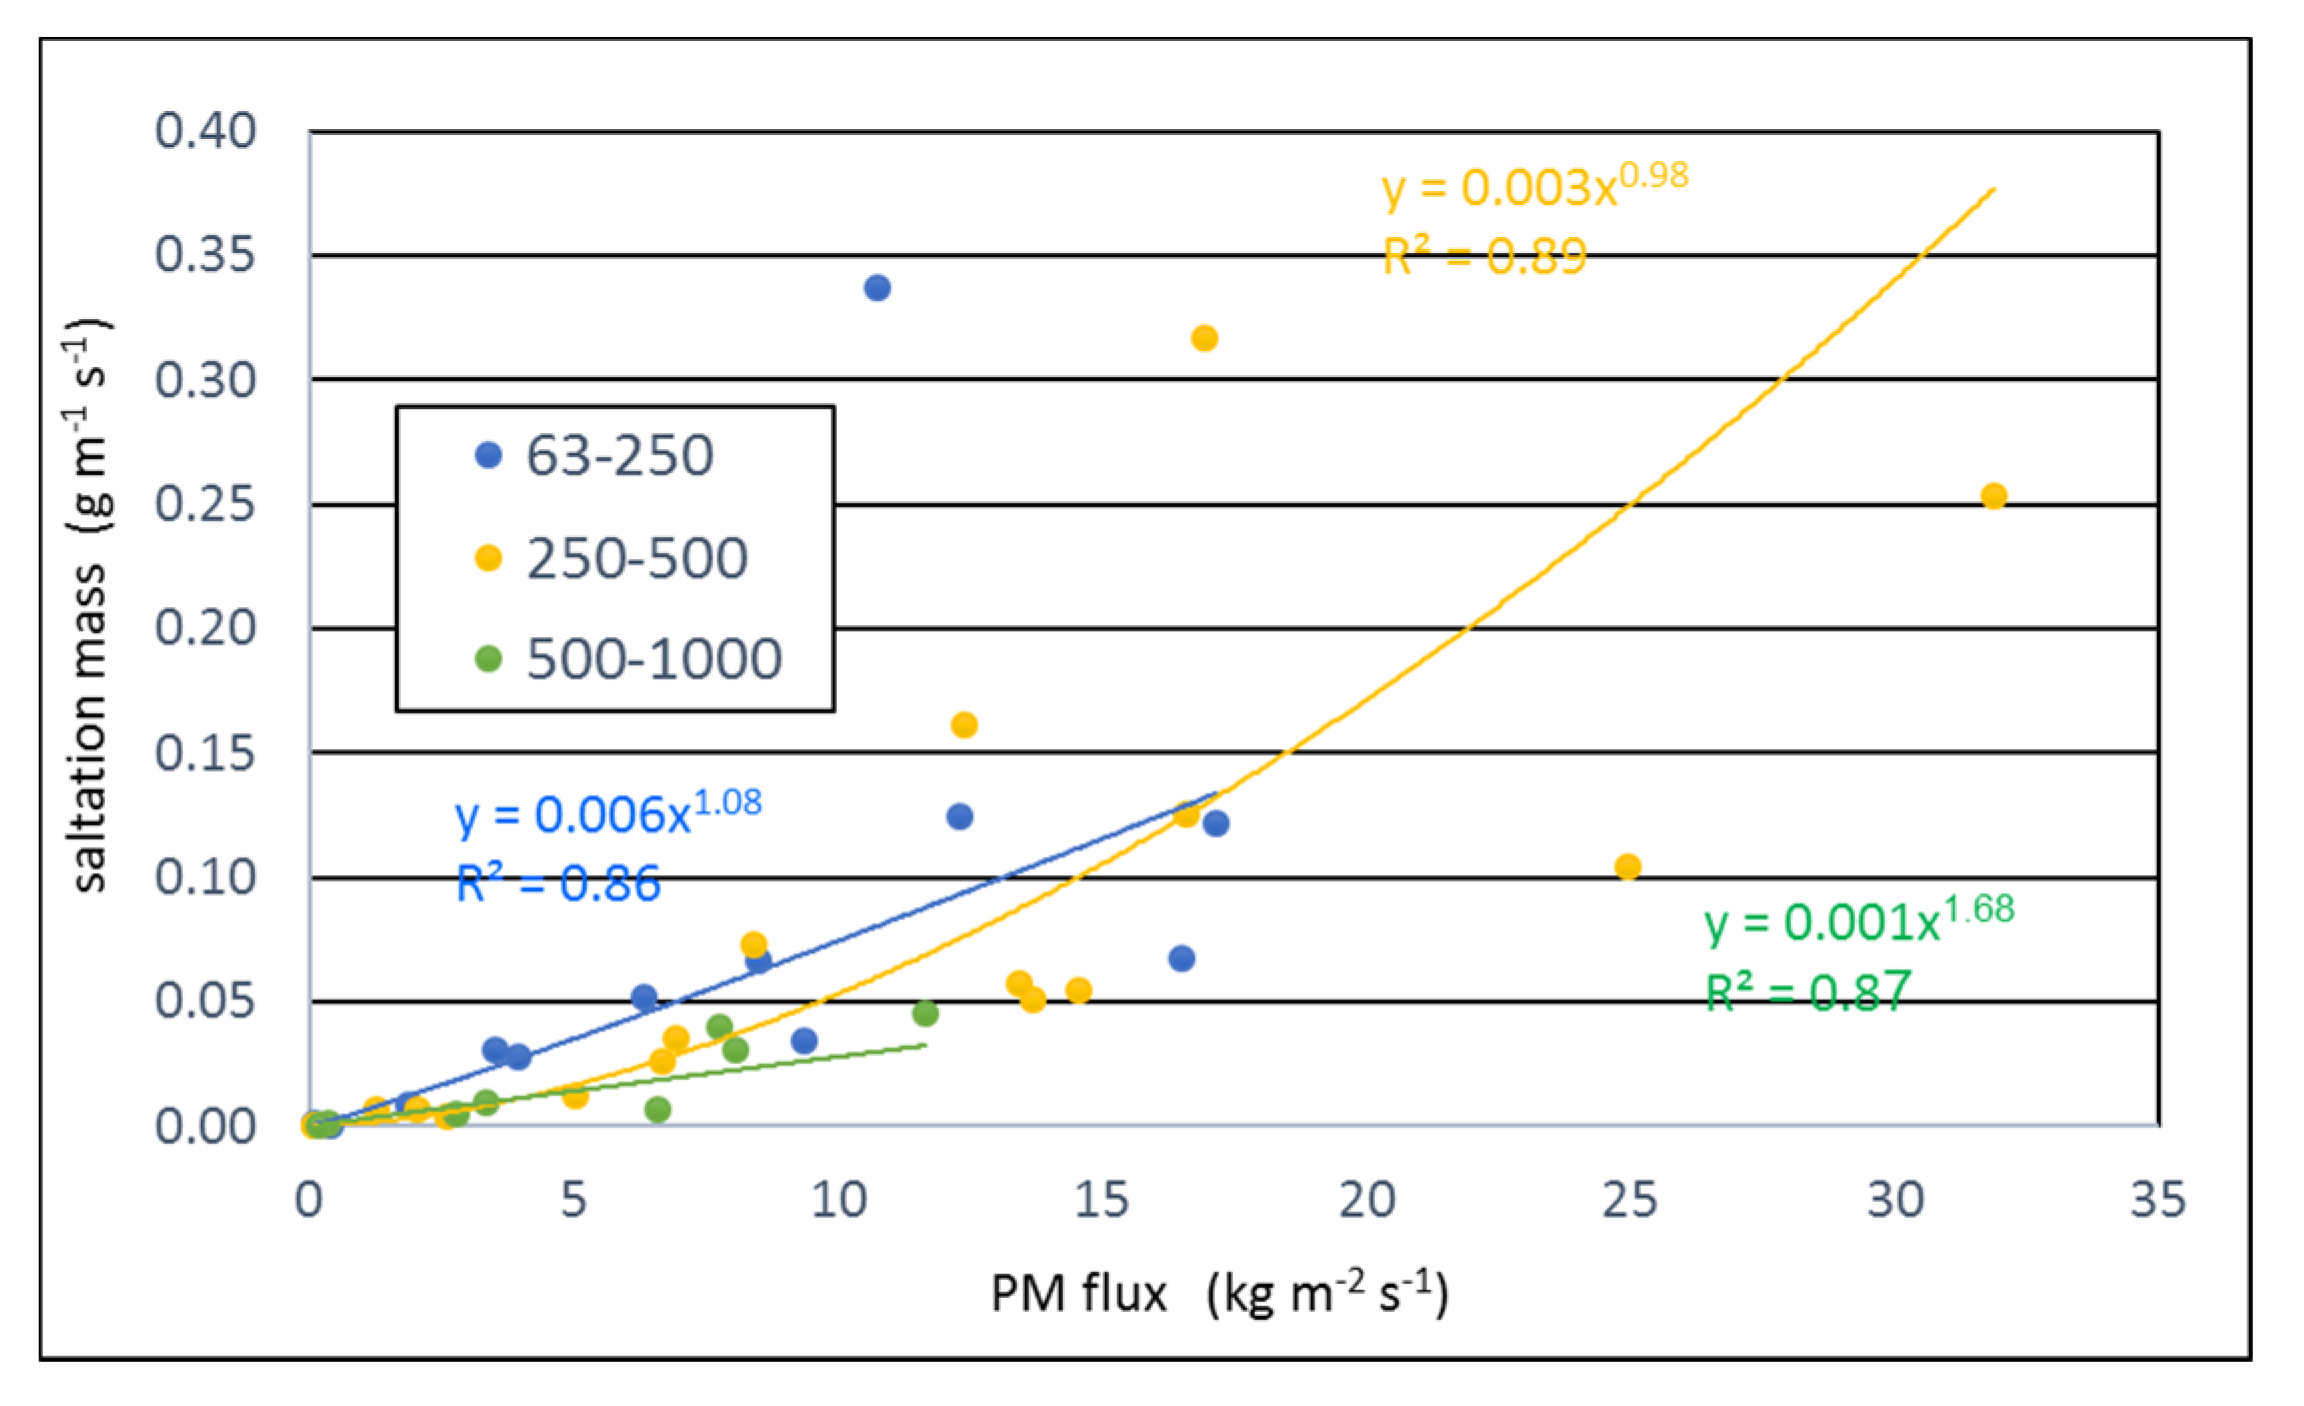
3. Results
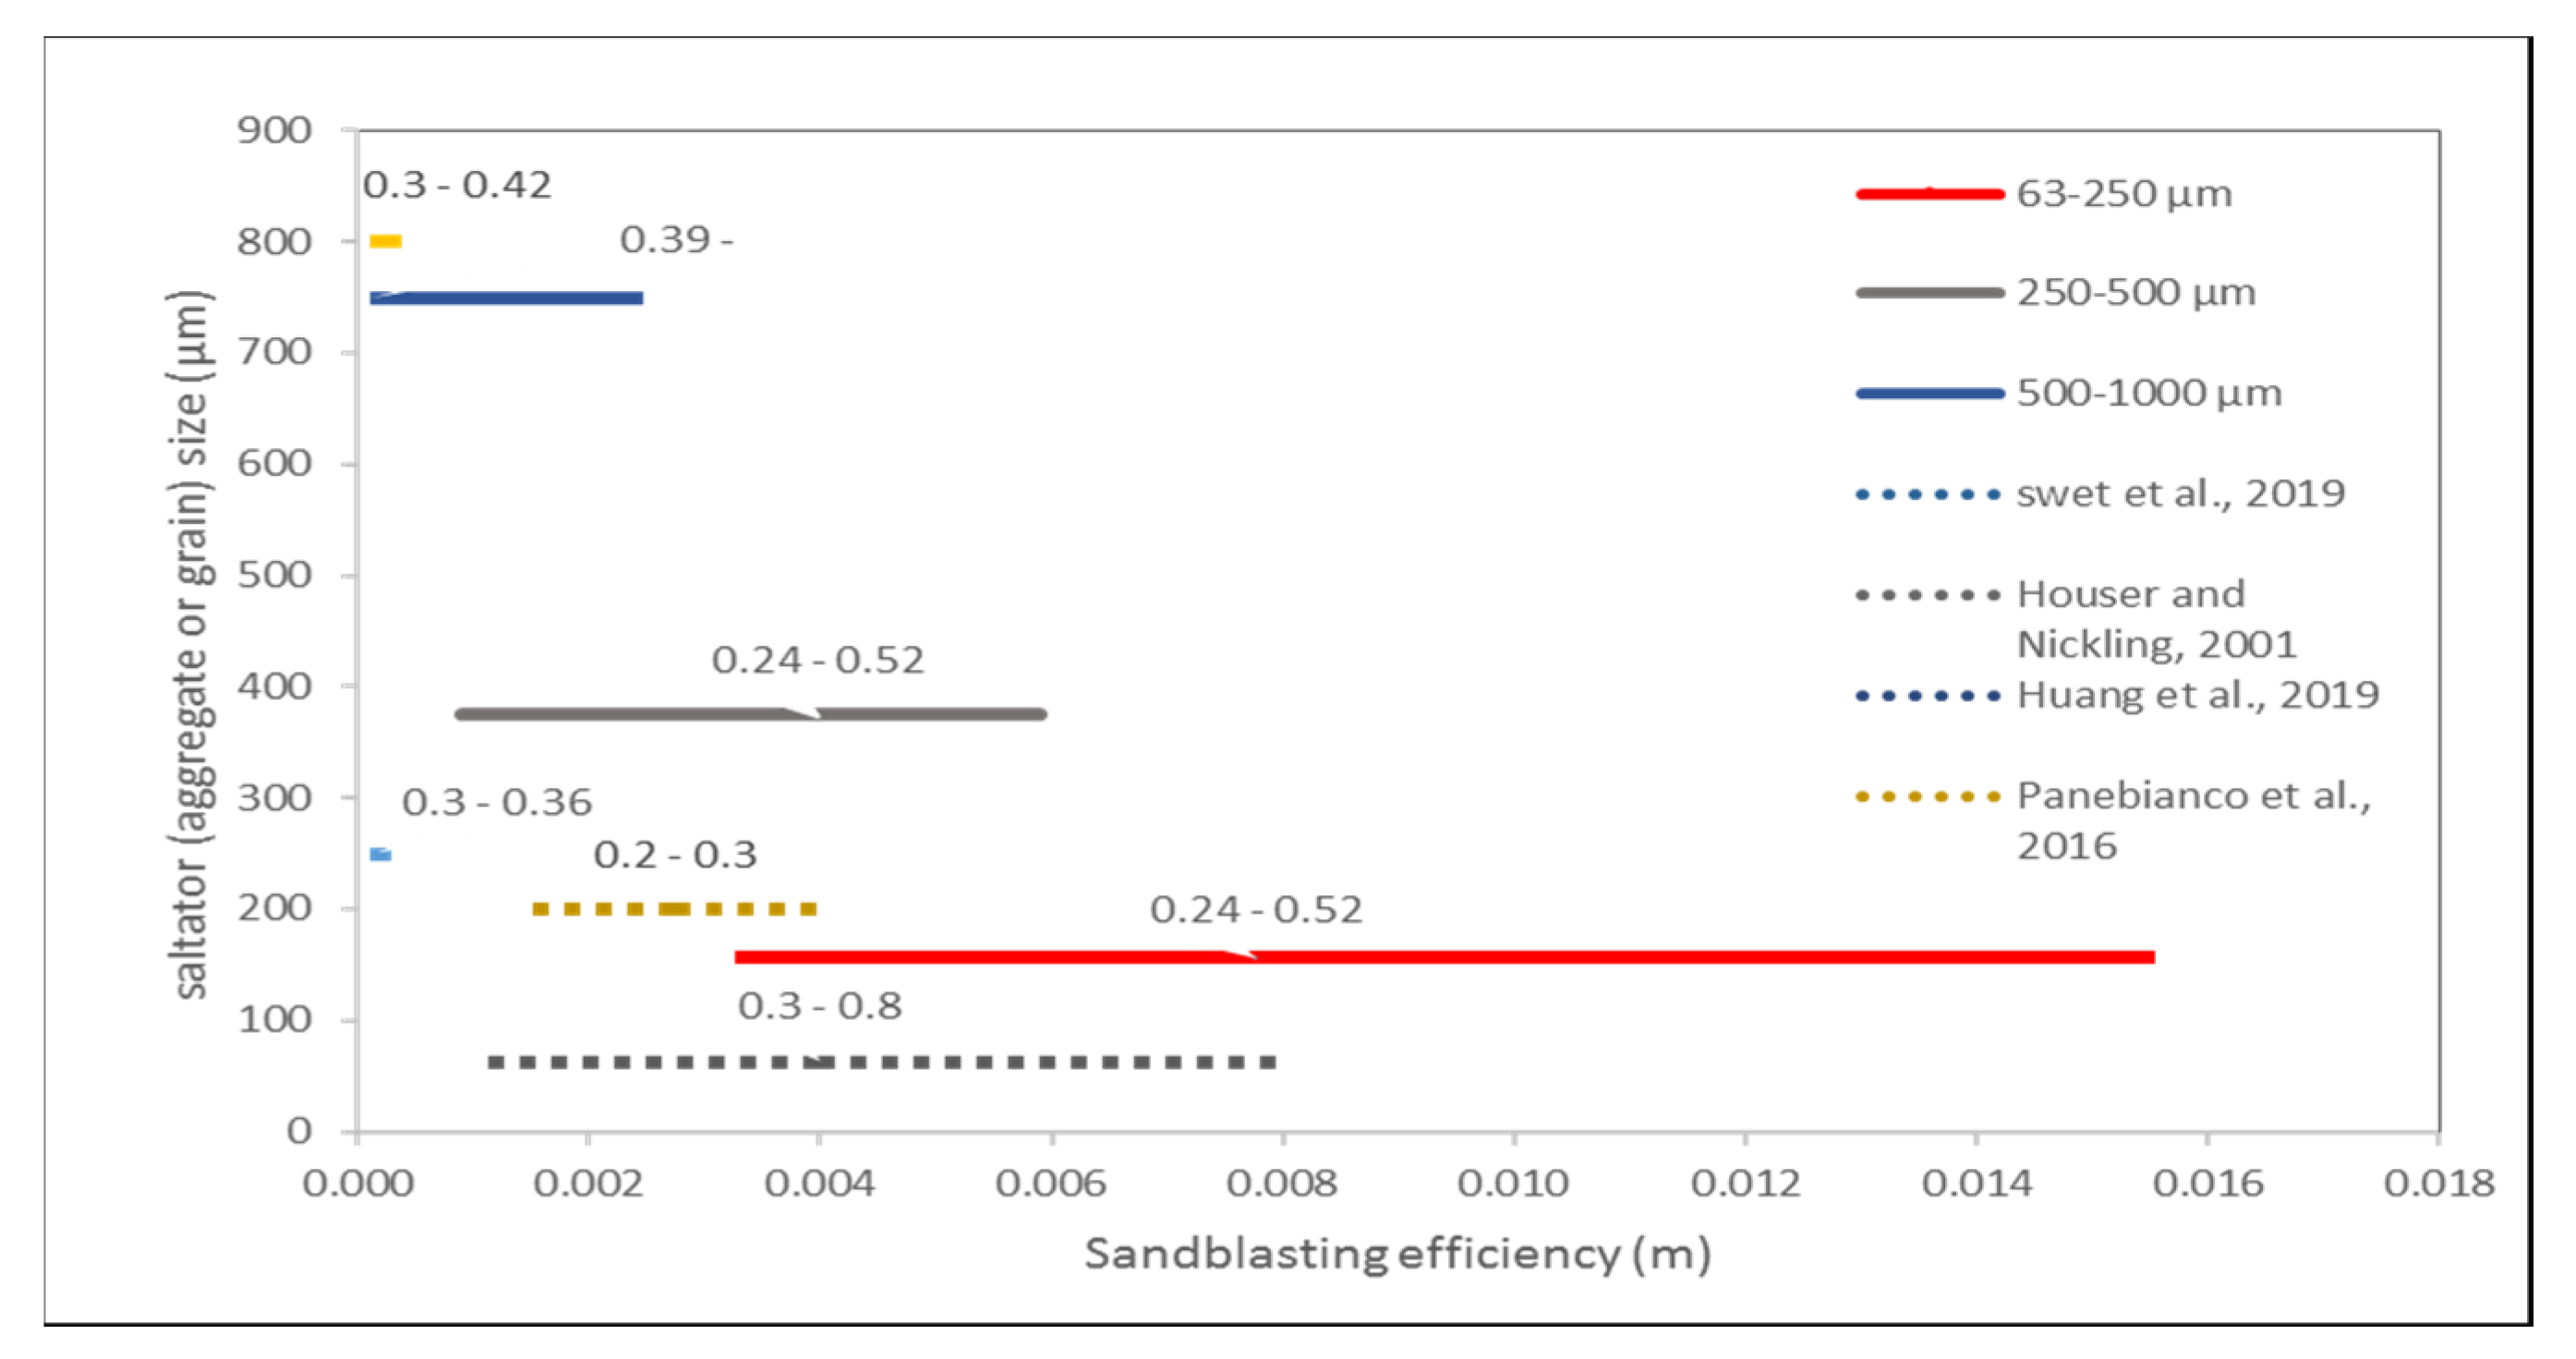
4. Discussion
5. Conclusions
Author Contributions
Funding
Conflicts of Interest
References
- Amézketa, E. Soil aggregate stability: A review. J. Sustain. Agric. 1999, 14, 83–151. [Google Scholar] [CrossRef]
- Le Bissonnais, Y.L. Aggregate stability and assessment of soil crustability and erodibility: I. Theory and methodology. Eur. J. Soil Sci. 1996, 47, 425–437. [Google Scholar] [CrossRef]
- Boix-Fayos, C.; Calvo-Cases, A.; Imeson, A.C.; Soriano-Soto, M.D. Influence of soil properties on the aggregation of some Mediterranean soils and the use of aggregate size and stability as land degradation indicators. Catena 2001, 44, 47–67. [Google Scholar] [CrossRef]
- Hevia, G.G.; Mendez, M.; Buschiazzo, D.E. Tillage affects soil aggregation parameters linked with wind erosion. Geoderma 2007, 140, 90–96. [Google Scholar] [CrossRef]
- Allison, F.E. Soil aggregation—Some facts and fallacies as seen by a microbiologist. Soil Sci. 1968, 106, 136–143. [Google Scholar] [CrossRef]
- Horn, R.; Taubner, H.; Wuttke, M.; Baumgartl, T. Soil physical properties related to soil structure. Soil Tillage Res. 1994, 30, 187–216. [Google Scholar] [CrossRef]
- Rhoades, J.D. Cation exchange capacity. In Methods of Soil Analysis, Part 2, Chemical and Microbiological Properties; Page, A.L., Miller, R.H., Keeney, D.R., Eds.; American Society of Agronomy, and Soil Science Society of America: Madison, WI, USA, 1982; Volume 9, pp. 1489–1589. [Google Scholar]
- Ben-Hur, M.; Yolcu, G.; Uysal, H.; Lado, M.; Paz, A. Soil structure changes: Aggregate size and soil texture effects on hydraulic conductivity under different saline and sodic conditions. Aust. J. Soil Res. 2009, 47, 688–696. [Google Scholar] [CrossRef]
- Norton, L.D.; Mamedov, A.I.; Huang, C.; Levy, G.J. Soil aggregate stability as affected by long-term tillage and clay type. Adv. GeoEcol. 2006, 38, 422–429. [Google Scholar]
- Haynes, R.J.; Swift, R.S. Stability of soil aggregates in relation to organic constituents and soil water content. J. Soil Sci. 1990, 41, 73–83. [Google Scholar] [CrossRef]
- Reichert, J.M.; Norton, L.D.; Favaretto, N.; Huang, C.H.; Blume, E. Settling velocity, aggregate stability, and interrill erodibility of soils varying in clay mineralogy. Soil Sci. Soc. Am. J. 2009, 73, 1369–1377. [Google Scholar] [CrossRef]
- Tisdall, J.M.; Oades, J. Organic matter and water-stable aggregates in soils. J. Soil Sci. 1982, 33, 141–163. [Google Scholar] [CrossRef]
- Kemper, W.D.; Rosenau, R.C. Aggregate stability and size distribution. In Methods of Soil Analysis: Part 1 Physical and Mineralogical Methods; Soil Science Society of America: Madison, WI, USA, 1986; Volume 5, pp. 425–442. [Google Scholar]
- Puget, P.; Chenu, C.; Balesdent, J. Dynamics of soil organic matter associated with particle-size fractions of water-stable aggregates. Eur. J. Soil Sci. 2000, 51, 595–605. [Google Scholar] [CrossRef]
- Chepil, W.S. Measurement of wind erosiveness of soils by dry sieving procedure. Sci. Agric. 1942, 23, 154–160. [Google Scholar]
- Colazo, J.C.; Buschiazzo, D.E. Soil dry aggregate stability and wind erodible fraction in a semiarid environment of Argentina. Geoderma 2010, 159, 228–236. [Google Scholar] [CrossRef]
- van Bavel, C.H.M. Mean weight-diameter of soil aggregates as a statistical. Soil Sci. Soc. Am. J. 1949, 14, 20–23. [Google Scholar] [CrossRef]
- Tanner, S.; Katra, I.; Haim, A.; Zaady, E. Short-Term soil loss by eolian erosion in response to different rain-fed agricultural practices. Soil Tillage Res. 2016, 155, 149–156. [Google Scholar] [CrossRef]
- Sharratt, B.; Wendling, L.; Feng, G. Windblown dust affected by tillage intensity during summer fallow. Aeolian Res. 2010, 2, 129–134. [Google Scholar] [CrossRef]
- Zobeck, T.; Popham, T.; Skidmore, E.; Lamb, J.; Merrill, S.; Lindstrom, M. Aggregate-Mean diameter and wind-erodible soil predictions using dry aggregate-size distributions. Soil Sci. Soc. Am. J. 2013, 67, 425–436. [Google Scholar] [CrossRef]
- Bagnold, R. The Physics of Blown Sand and Desert Dunes; Methuen: London, UK, 1941; Volume 10, p. 265. [Google Scholar]
- O’Brien, P.; Neuman, C.M. PTV measurement of the spanwise component of aeolian transport in steady state. Aeolian Res. 2016, 20, 126–138. [Google Scholar] [CrossRef]
- Anderson, R.S. Eolian sediment transport as a stochastic process: The effects of a fluctuating wind on particle trajectories. J. Geol. 1987, 95, 497–512. [Google Scholar] [CrossRef]
- Shao, Y. Physics and Modelling of Wind Erosion; Springer Science & Business Media: Berlin, Germany, 2008. [Google Scholar]
- Kok, J.; Parteli, E.; Michaels, T.; Karam, D. The physics of wind-blown sand and dust. Rep. Prog. Phys. 2012, 75, 106901. [Google Scholar] [CrossRef] [PubMed]
- Swet, N.; Katra, I. Reduction in soil aggregation in response to dust emission processes. Geomorphology 2016, 268, 177–183. [Google Scholar] [CrossRef]
- Kok, J.F.; Mahowald, N.M.; Fratini, G.; Gillies, J.A.; Ishizuka, M.; Leys, J.F.; Mikami, M.; Park, M.-S.; Park, S.-U.; van Pelt, R.S.; et al. An improved dust emission model—Part 1: Model description and comparison against measurements. Atmos. Chem. Phys. 2014, 14, 13023. [Google Scholar] [CrossRef]
- Yue, Y.; Song, Y.; Kaskaoutis, D.G.; Chen, X.; Mamadjanov, Y.; Tan, L. Atmospheric dust dynamics in southern central Asia: Implications for buildup of Tajikistan loess sediments. Atmos. Res. 2019, 229, 74–85. [Google Scholar]
- Katra, I.; Yizhaq, H. Intensity and degree of segregation in bimodal and multimodal grain size distributions. Aeolian Res. 2017, 27, 23–34. [Google Scholar] [CrossRef]
- Yulevitch, G.; Danon, M.; Krasovitov, B.; Fominykh, A.; Swet, N.; Tsesarsky, M.; Katra, I. Evaluation of wind-induced dust-PM emission from unpaved roads varying in silt content by experimental results. Atmos. Pollut. Res. 2020, 11, 261–268. [Google Scholar] [CrossRef]
- Katra, I. Soil erosion by wind and dust emission in semi-arid soils due to agricultural activities. Agronomy 2020, 10, 89. [Google Scholar] [CrossRef]
- Sirjani, E.; Sameni, A.; Moosavi, A.A.; Mahmoodabadi, M.; Laurent, B. Portable wind tunnel experiments to study soil erosion by wind and its link to soil properties in the Fars province, Iran. Geoderma 2019, 333, 69–80. [Google Scholar] [CrossRef]
- Swet, N.; Elperin, T.; Kok, J.F.; Martin, R.L.; Katra, H.Y.I. Can active sands generate dust particles by wind-induced processes? Earth Planet. Sci. Lett. 2019, 506, 371–380. [Google Scholar] [CrossRef]
- Katra, I.; Elperin, T.; Fominykh, A.; Krasovitov, B.; Yizhaq, H. Modeling of particulate matter transport in atmospheric boundary layerfollowing dust emission from source areas. Aeolian Res. 2016, 20, 147–156. [Google Scholar] [CrossRef]
- Six, J.; Degryze, S.; Bossuyt, H.; Denef, K. A history of research on the link between (micro)aggregates, soil biota, and soil organic matter dynamics. Soil Tillage Res. 2004, 79, 7–31. [Google Scholar] [CrossRef]
- Denef, K.; Six, J. Clay mineralogy determines the importance of biological versus abiotic processes for macroaggregate formation and stabilization. Eur. J. Soil Sci. 2005, 56, 469–479. [Google Scholar] [CrossRef]
- Vaezi, A.; Sadeghi, S.; Bahrami, H.; Mahdian, M.H. Modeling the USLE K-factor for calcareous soils in northwestern Iran. Geomorphology 2008, 97, 414–423. [Google Scholar] [CrossRef]
- Roth, B.; Eggert, T. Mechanisms of aggregate breakdown involved in surface sealing, runoff generation and sediment concentration on loess soils. Soil Tillage Res. 1994, 32, 253–268. [Google Scholar] [CrossRef]
- Chen, H.; Hou, R.; Gong, Y.; Li, H.; Fan, M.; Kuzyakov, Y. Effects of 11 years of conservation tillage on soil organic matter fractions in wheat monoculture in Loess Plateau of China. Soil Tillage Res. 2009, 106, 85–94. [Google Scholar] [CrossRef]
- Wang, R.; Li, Q.; Zhou, N.; Chang, C.; Guo, Z.; Li, J. Effect of wind speed on aggregate size distribution of windblown sediment. Aeolian Res. 2019, 36, 1–8. [Google Scholar] [CrossRef]
- Raupach, M.; Leys, J. Erodynamics of a portable wind erosion tunnel for measuring soil erodibility by wind. Soil Res. 1990, 28, 177–191. [Google Scholar] [CrossRef]
- van Pelt, R.; Baddock, M.; Zobeck, T.; Schlegel, A.; Vigil, M.; Martinez, V.A. Field wind tunnel testing of two silt loam soils on the North America Central high plains. Aeolian Res. 2013, 10, 53–59. [Google Scholar] [CrossRef]
- Shao, Y.; Raupach, M.; Findlater, P. Effect of saltation bombardment on the entrainment of dust by wind. J. Geophys. Res. Atmos. 1993, 98, 12719–12726. [Google Scholar] [CrossRef]
- Houser, C.A.; Nickling, W.G. The emission and vertical flux of particulate matter <10 μm from a disturbed clay-crusted surface. Sedimentology 2001, 48, 255–267. [Google Scholar]
- Panebianco, J.E.; Mendez, M.J.; Buschiazzo, D.E. PM10 emission, sandblasting efficiency and vertical entrainment during successive wind-erosion events: A wind-tunnel approach. Bound. Layer Meteorol. 2016, 161, 335–353. [Google Scholar] [CrossRef]
- Huang, Y.; Kok, J.F.; Martin, R.L.; Swet, N.; Katra, I.; Gill, T.E.; Reynolds, R.L.; Freire, L.S. Fine dust emissions from active sands at coastal Oceano Dunes, California. Atmos. Chem. Phys. 2019, 19, 2947–2964. [Google Scholar] [CrossRef]
- Feddema, J.J.; Freire, S. Soil degradation, global warming and climate impacts. Clim. Res. 2001, 17, 209–216. [Google Scholar] [CrossRef]
- Amundson, R.; Berhe, A.; Hopmans, J.; Olson, C.; Sztein, A.; Sparks, D. Soil and human security in the 21st century. Soil Sci. 2015, 348, 1261071. [Google Scholar] [CrossRef]
- Lavee, H.; Imeson, A.; Sarah, P. The impact of climate change on geomorphology and desertification along a Mediterranean-arid transect. Land Degrad. 1998, 9, 407–422. [Google Scholar] [CrossRef]


| Clay (%) | Silt (%) | Sand (%) | CaCO3 (%) | SOM (%) | |
|---|---|---|---|---|---|
| 63–250 µm | 16.1 (6.0) | 60.5 (12.3) | 23.3 (18.4) | 14.4 (1.6) | 2.2 (0.1) |
| 250–500 µm | 12.8 (1.5) | 53.1 (4.2) | 34.0 (5.7) | 12.9 (0.8) | 2.1 (0.2) |
| 500–1000 µm | 11.7 (0.8) | 55.6 (1.2) | 32.6 (0.3) | 8.5 (1.5) | 2.1 (0.3) |
| Bulk sample | 13.7 (N/A) | 60.4 (N/A) | 25.8 (N/A) | 10.6 (0.7) | 2.9 (0.0) |
| u* (m/s) | Sample 63–250 µm | Sample 250–500 µm | Sample 500–1000 µm |
|---|---|---|---|
| <63 µ (%) | <63 µ (%) | <63 µ (%) | |
| 0.24 | 30.5 | N/A | N/A |
| 0.31 | 30.3 | 12.3 | N/A |
| 0.36 | 24.5 | 24.9 | N/A |
| 0.39 | 16.5 | 13.7 | N/A |
| 0.43 | 20.5 | 18.1 | 6.6 |
| 0.52 | 11.8 | 17.5 | 8.4 |
© 2020 by the authors. Licensee MDPI, Basel, Switzerland. This article is an open access article distributed under the terms and conditions of the Creative Commons Attribution (CC BY) license (http://creativecommons.org/licenses/by/4.0/).
Share and Cite
Gelbart, G.; Katra, I. Dependence of the Dust Emission on the Aggregate Sizes in Loess Soils. Appl. Sci. 2020, 10, 5410. https://doi.org/10.3390/app10165410
Gelbart G, Katra I. Dependence of the Dust Emission on the Aggregate Sizes in Loess Soils. Applied Sciences. 2020; 10(16):5410. https://doi.org/10.3390/app10165410
Chicago/Turabian StyleGelbart, Gilad, and Itzhak Katra. 2020. "Dependence of the Dust Emission on the Aggregate Sizes in Loess Soils" Applied Sciences 10, no. 16: 5410. https://doi.org/10.3390/app10165410
APA StyleGelbart, G., & Katra, I. (2020). Dependence of the Dust Emission on the Aggregate Sizes in Loess Soils. Applied Sciences, 10(16), 5410. https://doi.org/10.3390/app10165410