Article

Reverse Coarsening and the Control of Particle Size Distribution through Surfactant

by
Victor M. Burlakov
1,2,* and
Alain Goriely
2
1
Linacre College, University of Oxford, Oxford OX1 3JA, UK
2
Mathematical Institute, University of Oxford, Oxford OX2 6GG, UK
*
Author to whom correspondence should be addressed.
Appl. Sci. 2020, 10(15), 5359; https://doi.org/10.3390/app10155359
Submission received: 3 July 2020 / Revised: 27 July 2020 / Accepted: 29 July 2020 / Published: 3 August 2020
(This article belongs to the Special Issue Towards Ideal Nanomaterials)

Abstract

:

Featured Application

Generation of mono-disperse ensembles of nanoparticles.

Abstract

The minimization of surface area, as a result of the minimization of (positive) surface energy, is a well-known driving force behind the spontaneous broadening of (nano) particle size distribution. We show that surfactant molecules binding to particle surfaces effectively decrease the surface energy and may change its sign. In this case, contrary to the expected broadening behavior, a minimum of free energy is achieved at the maximum surface area for all particles, i.e., when the particles are identical. Numerical simulations based on the classical Lifshitz–Slyozov–Wagner theory with surfactant-induced surface energy renormalization confirm the collapse of the particle size distribution. As the particle size evolution is much slower than particle nucleation and growth, the manipulation of surface energy with in-situ replacement of surfactant molecules provides a method for controlling particle size distribution with great potential for creating mono-disperse nanoparticles, a key goal of nanotechnology.

1. Introduction

The generation of identical nanoparticles [1,2,3,4,5,6,7] and fine nanostructures [8,9,10] is a key requirement for self-assembly processes in bottom-up nanotechnology. However, structure coarsening, or Ostwald ripening [11], is a universal phenomenon that stands in the way of forming identical nano-building blocks through quasi-equilibrium methods. Coarsening represents the spontaneous evolution of precipitated particles, during which smaller particles transfer mass to bigger ones, thus broadening the particle size distribution (PSD) [12,13,14,15]. This is a common phenomenon taking place at the final stages of many first-order phase transformations following nucleation and growth, for example, in two-phase mixtures [11], binary alloys [16], clusters on surfaces [17], oil–water emulsions [18], and during epitaxial growth [19,20] and synthesis of nanoparticles [21]. The main driving force behind coarsening is the minimization of the interfacial area between the two phases, and as such, it depends intimately both on the interface energetics and the system temperature. Much effort has been devoted to finding ways to inhibit or even reverse coarsening in order to achieve a narrower PSD. Known examples of PSD narrowing discussed in the literature include the so-called digestive ripening [1,2,3,22,23], inverse ripening [24,25,26,27], and size focusing during production-controlled growth [28,29]. Some of these processes take place in the presence of surfactants, which are widely used in nanoparticle production, mainly to stabilize particles [30,31,32] and to tune the growth regimes towards the production of particles with required shapes and sizes [33,34,35]. There are also mechanisms of inhibition, or of arresting Ostwald ripening [36,37,38], which do not permit real narrowing of the PSD but rather preserve it from broadening. Digestive ripening can be explained by taking into account electric charges on the particle and by including the electrostatic energy in the free energy analysis [22,23], while inverse ripening has been observed for gold inclusions in an amorphous SiO2 matrix irradiated with MeV gold ions [25,27]. The PSD narrowing in the latter case is of transient character. It is affected by mechanical stresses and requires fine-tuning of radiation-annealing cycles. On the other hand, size focusing during production-controlled growth is predicted for effectively open systems where the material deposited on particles is continuously reproduced in the bulk of solution [28,29]. In summary, there is currently no effective theory describing the phenomenon of PSD narrowing in conservative and charge-neutral systems.
Besides the quasi-equilibrium fabrication methods when the system is thermodynamically driven, narrow PSDs are also successfully generated using discrete size selection by undercooling [39,40,41] and dewetting [42,43] in a non-equilibrium regime. Here, we study the role of surfactants, or surface binding molecular ligands [44,45,46,47,48,49,50], in controlling PSDs. We present a thermodynamic mechanism for particle size stabilization and narrowing of a PSD by surfactant molecules binding to particle surfaces. This process is illustrated by considering a simple dilute solution of two species (referred to here as molecules) in a neutral solvent in the presence of precipitated aggregates (called particles) of one of the components. Based on a free energy analysis, we demonstrate that there exists a range of parameters at which reverse coarsening (RC) occurs and, consequently, smaller precipitated particles grow at the expense of bigger ones. This regime is spontaneous: i.e., it is thermodynamically driven and converts any initial distribution of particles into an array of almost identical particles [51]. Notably, the transition into this regime can be obtained by varying the surfactant concentration and/or the system’s temperature.

2. Results and Discussion

Thermodynamic Theory of Reverse Coarsening. Following the classical approach [13,14,15], we used a mean-field approximation in our analysis. This approximation assumed that the particles are sufficiently far from each other so that they only interact through the averaged characteristics of the solution, and that their occupied volume is negligible compared to the entire volume of the system. First, we analyzed the thermodynamic stability of a single particle in the solution with a given concentration of identical molecules (A-molecules) in the presence of surfactant molecules (B-molecules). Then, by writing the molecular chemical potential as a function of particle size, we obtained the conditions for RC by considering the mass exchange between particles in an ensemble. Second, we confirmed our prediction of RC by direct numerical simulations of the particle ensemble evolution using the Kinetic Monte Carlo technique.

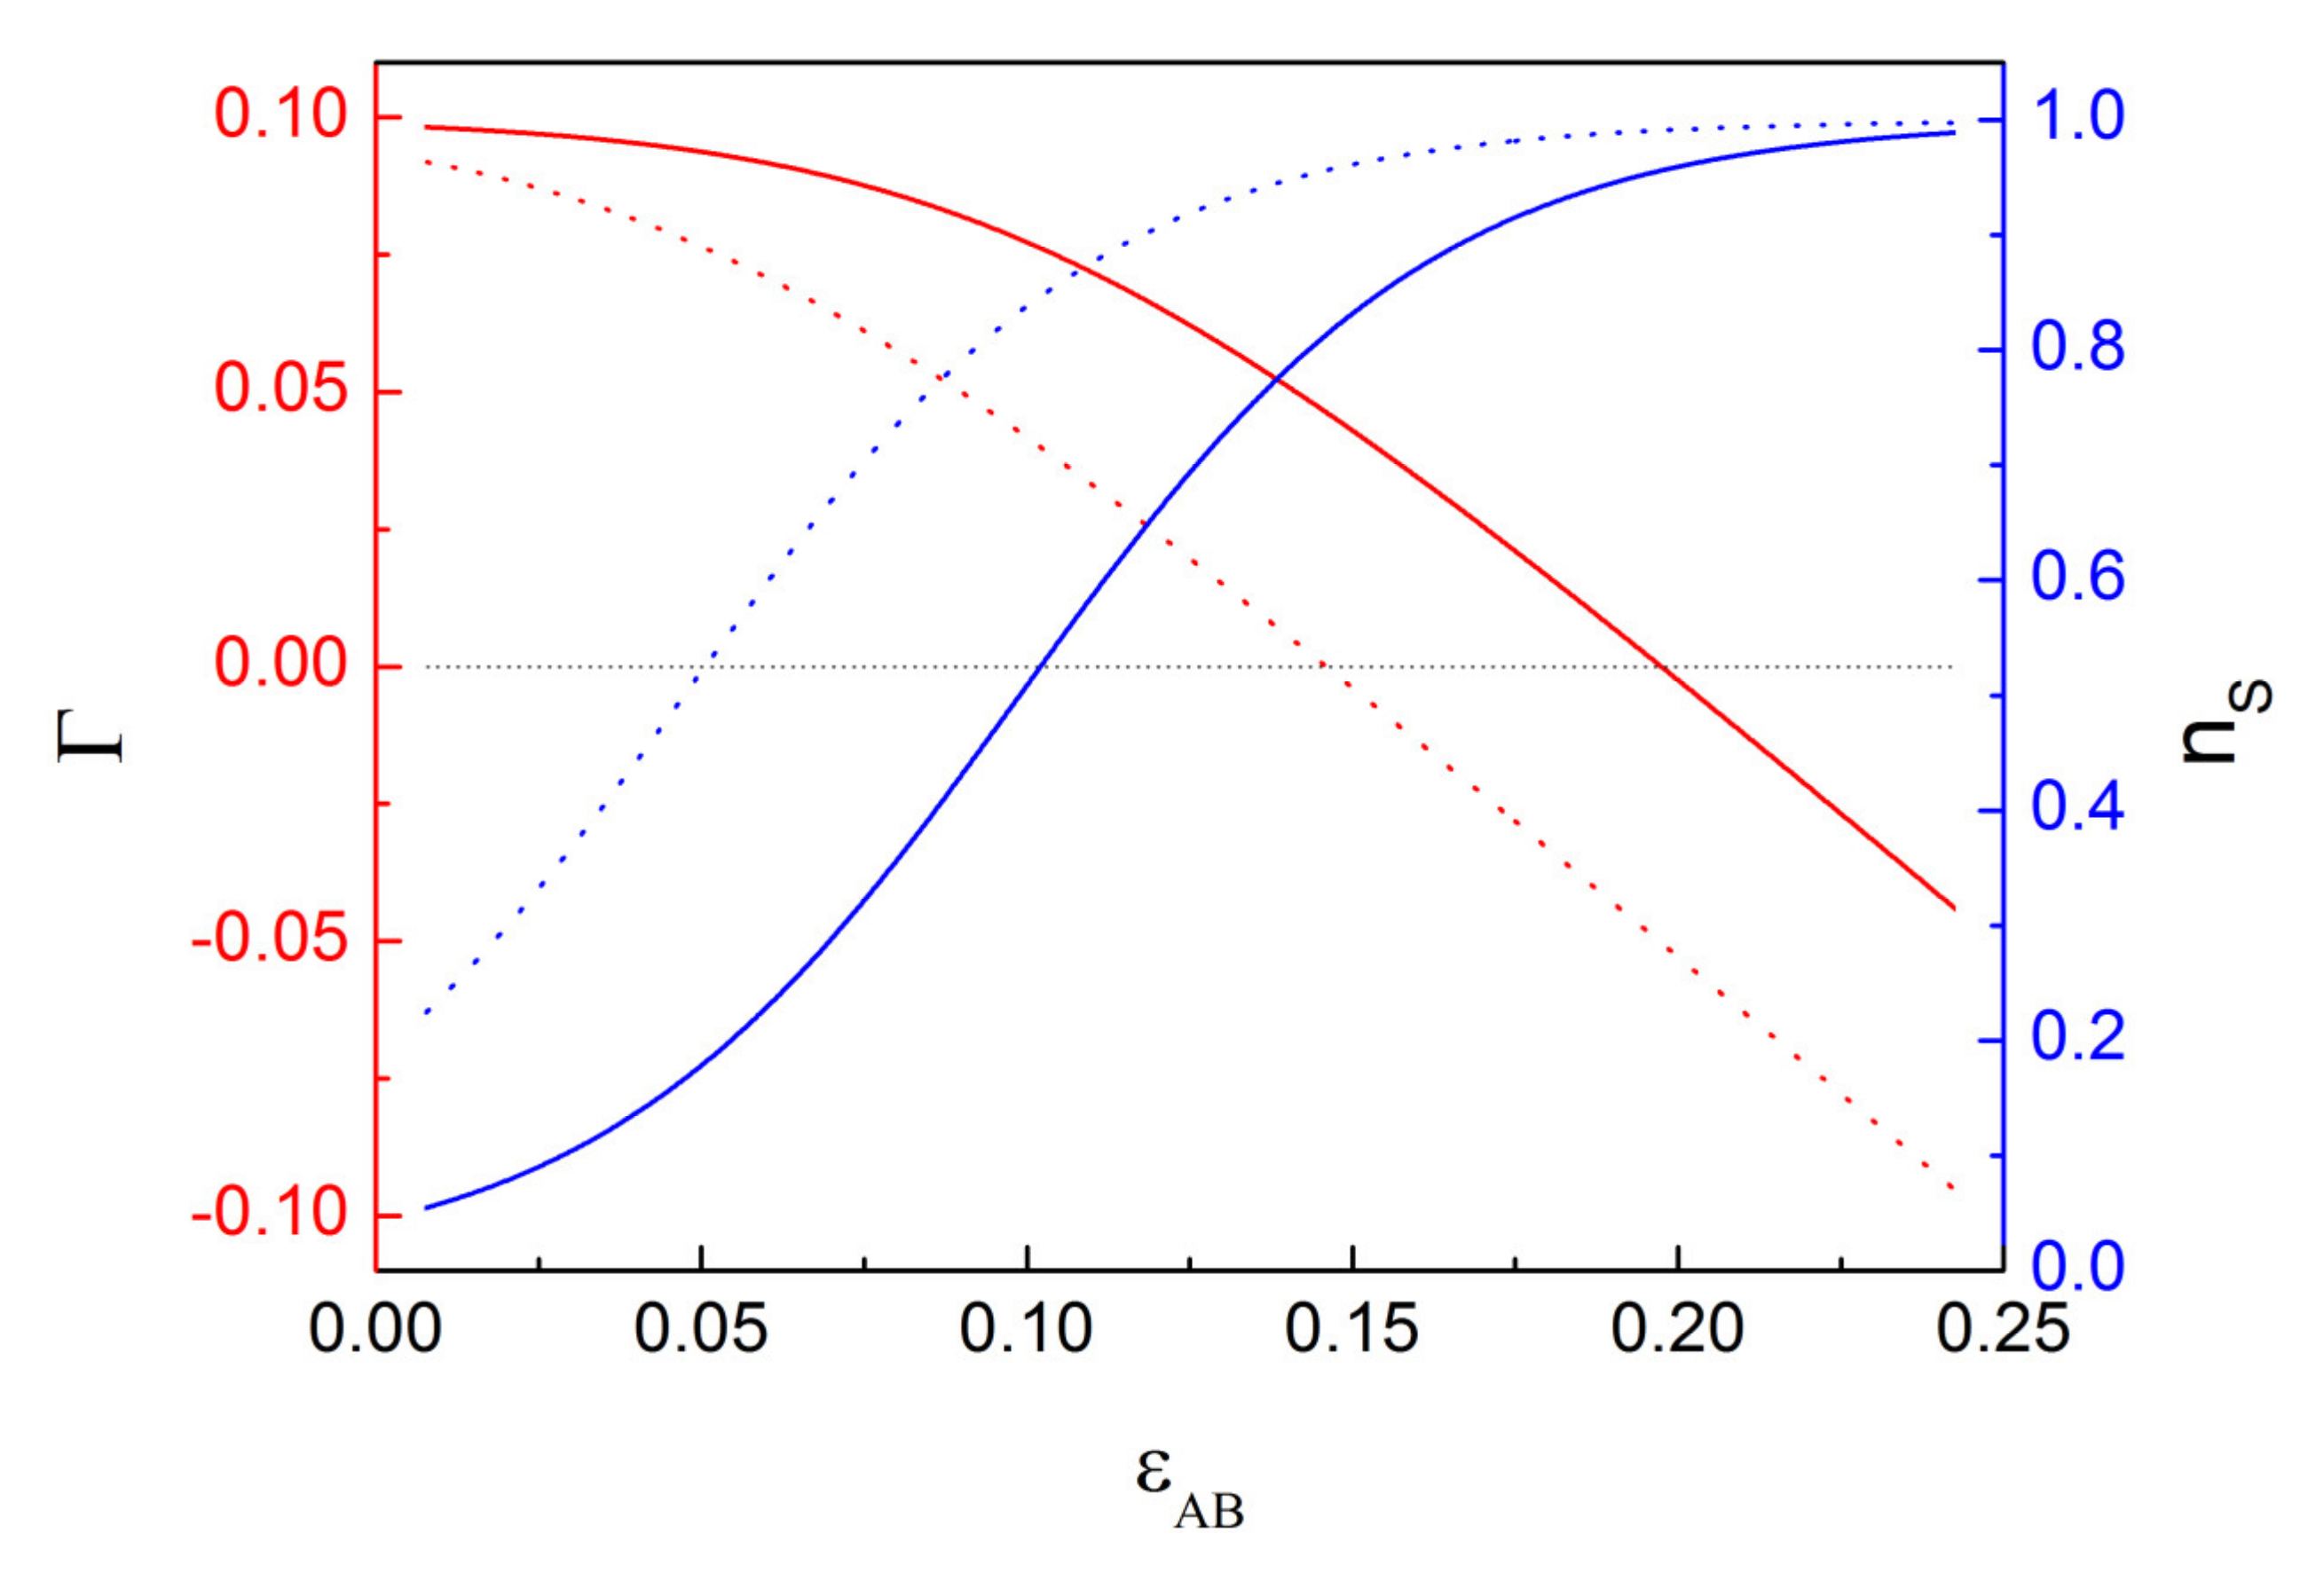
2.1. Isolated Particle in a Binary Solution

In our thermodynamic analysis, we considered a conservative system consisting of a dilute binary A–B solution and a precipitated spherical A-particle of radius R measured in the units of typical intermolecular distance and containing N P = 4 π R 3 / 3 molecules. The system contained MA molecules of material A, MB molecules of material B and ML molecules of a solvent. For simplicity, we assumed that a molecule A can bind only one molecule B and vice versa with characteristic energy ε A B . This binding resulted in the formation of NC number of A–B complexes (dimers) in the solution, and in concentration nS of B-molecules on particle surfaces. The free energy of the system is
G = ε N P + γ S P 1 n S ε A B n S S P + T S P n S ln n S + 1 n S ln 1 n S ε A B N C + T N C ln N C + N A ln N A + N B ln N B + N L ln N L M Σ ln M Σ ,
where ε   >   0   and   γ   >   0 are the cohesive and surface energies per A-molecule in the particle, respectively, T is the temperature in energy units (eV), S P = 4 π R 2 is the number of molecules on the particle surface, N A = M A N P N C , N B = M B S P n S N C , R 1 and M Σ = N A + N B + N C + M L . In Equation (1), we neglected possible interactions between B-molecules (see Appendix A for details) and assumed a simple form for the entropy, which provides a lower limit estimate [52].
The minimization of the free energy G with respect to the independent variables N P ,   N C   and   n S in the limit of a dilute solution with M L > > N A + N B + N C yields (see Appendix B)
T ln n A = ε + 2 R Γ , n C = E 0 n A n B , n S = E 1 n B 1 + E 1 n B 1
where E 0   =   exp ε A B / T ,   E 1 = exp γ + ε A B / T and Γ = γ T ln 1 + n B E 1 is the renormalized surface energy of the A-particle, and n A B = N A B / M Σ and n C = N C / M Σ are the number concentrations of corresponding species in the solution. The first equation in Equation (2) is a statement of the equality of chemical potentials for A-molecules in the solution μ A s o l = T ln n A and in the particle μ A R = ε + 2 Γ / R of radius R. The second and third equations of Equation (2) give the equilibrium concentrations of A–B complexes in the solution and of B-molecules on the particle surfaces, respectively. Note that the surfactant B-molecules always reduce the surface energy, as Γ < γ due to ln 1 + n B E > 0 . For high enough values of ε A B , the effective surface energy Γ can become negative (see Figure 1) resulting in a narrowing of the size distribution for an ensemble of particles in solution. The same figure also shows the surface concentration of surfactant n S as a function of ε A B illustrating an increase in surface concentration n S and a decrease in Γ with increasing bulk concentration n B of the surfactant molecules.
The effect of surface energy renormalization by A–B bonding can be obtained by considering the molecular chemical potential μ A R = ε + 2 Γ / R for a particle of radius R in solution containing other A-particles. The case of positive Γ corresponds to ordinary coarsening when A-molecules are transferred from smaller particles to bigger ones until a single big particle remains. If Γ = 0 the molecular chemical potential according to the first line in Equation (2) becomes independent of R hence the PSD should also be time-independent. More interestingly, if Γ < 0 the molecular chemical potential is lower for smaller particles, and energy minimization requires the A-molecules to be transferred from bigger to smaller particles. This process of reverse coarsening (“size focusing”) results in a mono-disperse (for thermodynamic limit, see [51]) particle ensemble with the equilibrium particle radius R e q determined by the initial PSD function f(R), and the particles’ total volume as
R e q = 0 R 3 f R d R / 0 f R d R 1 / 3
For instance, if the initial PSD is a Gaussian f R = 1 2 π σ exp 1 2 σ R R 2 with a mean radius R significantly higher than the variance σ , then the value of R e q is very close (within a few percents) to R and does not depend on ε A B .

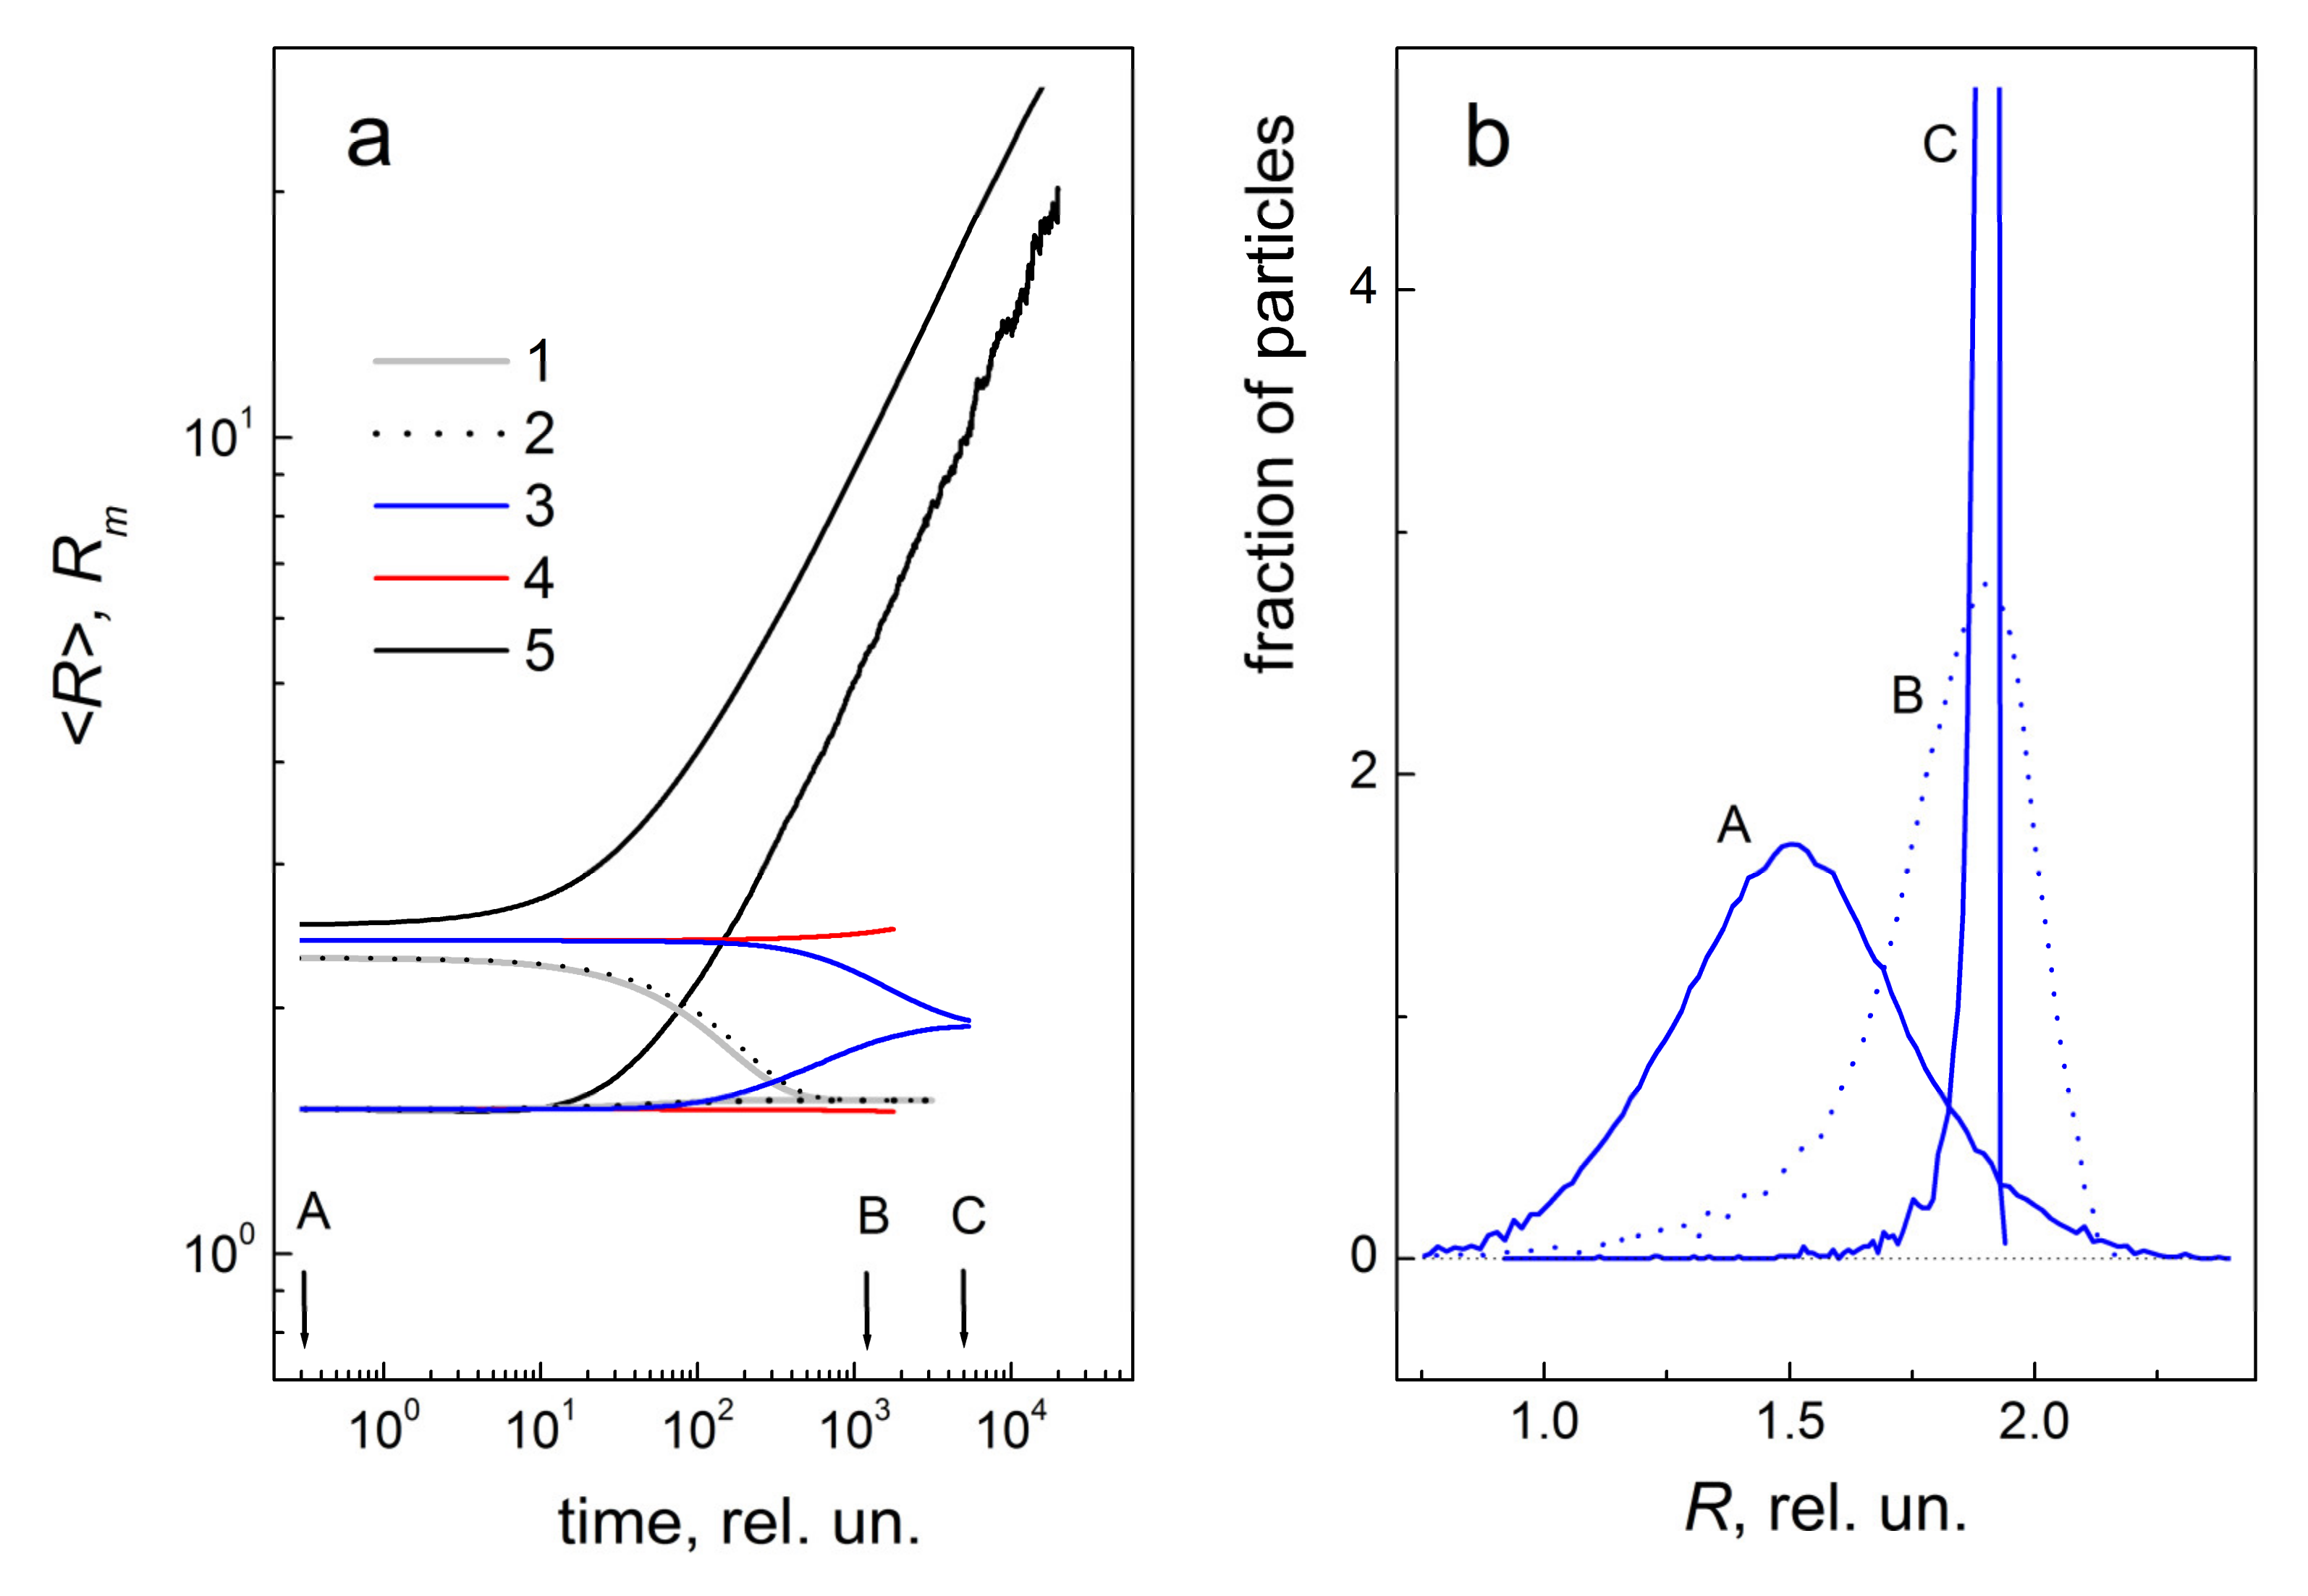
2.2. Simulation of Reverse Coarsening in the Particle Ensemble

The value of R e q given by Equation (3) is a good estimate if the PSD before its collapse is close to the initial PSD. This estimate implicitly assumes that the surface energy γ does not depend on the particle radii or shape. In reality, the shape of small particles may deviate from spherical, which, in the context of our theory, means that γ would increase with R. In turn, this dependence on the radius implies that Γ > 0 for small enough particles (depending on ε A B and T), which will dissolve and transfer their mass to bigger particles with Γ < 0 . Such mass transfer modifies the initial PSD and shifts the mean radius, hence R e q , towards higher values.
To confirm this effect, we conducted numerical simulations using the Kinetic Monte Carlo technique [53]. We started with a distribution of spherical particles nucleated and grown so that their evolution is only possible by an exchange of molecules between particles. This initial configuration is chosen so that the vast majority of A-molecules are bound in particles. The particle surfaces are covered with B-molecules, which significantly slows down an exchange of A-molecules between particles and solution. Therefore, it is reasonable to assume that the molecular diffusion in solution is the fastest process and that the coarsening process is limited by the attachment-detachment events with effective reaction rate constant K. Then, the evolution of the i-th particle’s radius Ri (measured in the units of inter-atomic distance) within this Wagner approximation [15] can be described by
d R i d t = K n n G T R i
where n G T R i is the Gibbs–Thomson concentration (equilibrium concentration) for the i-th particle, and n is the mean field concentration of free A-molecules in solution. The latter is determined using mass conservation for all particles (valid because of our earlier assumption about the dominant fraction of A-molecules contained in particles),
d d t i = 1 N 4 3 π R i 3 = i = 1 N 4 π R i 2 d R i d t = i = 1 N 4 π K R i 2 n n G T R i = 0 n = i = 1 N R i 2 n G T R i i = 1 N R i 2
The Gibbs–Thomson concentration is given by the equality of molecular chemical potentials in the particle and solution T ln n G T = ε + 2 Γ / R (see Equation (2)) taking a more realistic expression for surface energy γ . This expression is obtained considering the generic expression for particle energy ε N as a function of the number N of atoms/molecules it contains [54,55,56,57].
ε N = ε + ε S N 1 / 3 + ε C N 2 / 3 + ε E N 1
where ε > 0 is the bulk contribution to energy (cohesive energy), ε S > 0 is the contribution of facets’ surfaces, ε C > 0 is the contribution of edges, and ε E defines the energy origin (reference point). Adopting this expression for the generic case of spherical particles with radius R and neglecting the small energy origin ε E , we use N R 3 in Equation (6) so that the energy per molecule in a particle (or molecular chemical potential) takes the form ε R = ε + 2 γ R / R with γ R = γ 0 + γ 1 R . Both parameters γ 0 and γ 1 are positive, as the former corresponds to true surface energy for R 1 , while the latter takes into account non-sphericity effects according to Equation (6). With such a generic form, this equation can also effectively account for the contributions to the surface energy coming from the possible roughness of particle surfaces. Therefore, the surface energy γ R decreases with increasing particle radius, making larger particles relatively more stable. With this surface energy, the Gibbs–Thomson concentration is now
n G T R = exp ε T + 2 γ 0 T R + 2 γ 1 T R 2 2 R ln 1 + n B E 1
Using Equations (4)–(7), we introduced molecular absorption and emission probabilities by the particle (Equations (16)–(17) in [51]) and implemented them in the original Fortran code to simulate the evolution of a 104 particle ensemble. For illustration purposes, we considered two values of γ 1 : 0 and 0.01 eV. The results shown in Figure 2 correspond to some realistic values of known model parameters, chosen for illustrative purposes. We see that both the mean R and maximum Rm radii continuously grow with time for ε A B = 0.18 eV, which is characteristic of ordinary coarsening. In contrast, for ε A B > 0.197 eV, the evolution displays reverse coarsening, as the radii R and R m both converge to the same value R e q predicted by Equation (3), which, for γ 1 = 0 , gives a value of R e q that is very close to R of the initial PSD. For γ 1 = 0.01 eV, the value of R e q is larger than the average radius R of the initial PSD. As discussed, this effective increase in R in the early stages is due to the mass transfer from the smaller particles with Γ > 0 to the bigger particles with Γ < 0 . Clearly, there is a threshold value for ε A B above which the system displays reverse coarsening. This threshold is determined by the requirement Γ = 0 and depends on the surfactant concentration n B , the molecular-surfactant interaction energy ε A B , the temperature T and the size dependence of the surface energy determined by γ 1 . In the case of γ 1 0 , the threshold value ε A B * is estimated for the values in Figure 1 as
Γ = γ 0 T ln 1 + n B E 1     0     ε A B *     0.197   eV
Choosing a surfactant with ε A B ε A B * preserves the initial PSD (see curves 4 in Figure 2). The evolution of the PSD is relatively slow (note the log scale for the x-axis in Figure 2); therefore, replacing the surfactant molecules with those having ε A B ε A B * or ε A B > ε A B * allows it to be stopped or reversed, respectively, providing a great opportunity for thermodynamic control of the PSD for generated nanoparticles. It is worth noting that the values of ε A B generating reverse coarsening must also have an upper limit, as at values ε A B > ε , the A-molecules would rather form molecular–surfactant complexes in the solution than stay bound together as a particle. Therefore, in our case, the inequality ε A B < ε must hold. The value of ε A B * in our simulations is chosen for illustration purposes without reference to any particular material’s surface or binding molecule. Determining ε A B * in practice is difficult, as it requires measuring the particle’s surface energy γ in solution. In our case, it is reasonable to demand that ε A B * is low enough for the surfactant molecules not to affect the particle shape during its growth or dissolution [58]. Note that the fine tuning of the coarsening process, which is determined by the value of the effective surface energy Γ , can be more easily achieved by varying the bulk concentration of surfactant molecules n B and the system temperature T rather than ε A B using different surfactant molecules.
From our simulations, we conclude that the main signature of reverse coarsening is the dissolution of the largest particles in the ensemble. While both the mean and the maximum particle radii increase in ordinary coarsening, the maximum radius in reverse coarsening will, at some point in time, decrease, indicating partial dissolution of the biggest particles. This feature is crucial for experimental identification of the reverse coarsening process.

3. Conclusions

We have presented a free-energy analysis and simulation studies of a dilute binary molecular solution with precipitated particles of one component and with the other component acting as a surface passivating surfactant. Our analysis predicts that for certain component concentrations and strengths of molecular–surfactant interaction, the system of precipitated particles evolves towards equilibrium in such a way that the PSD spontaneously narrows, leading eventually to a mono-sized array of particles. The narrowing of the size distribution is mainly due to a strong enough surface passivation of particle surfaces by surfactant molecules, which renders the effective surface energy of particles negative. The effect is confirmed by direct simulations of the PSD evolution in a large ensemble of poly-dispersed particles. This reverse coarsening effect is a new paradigm for the thermodynamically controlled solution-processed generation of mono-sized nano-particulate arrays of various materials.

Author Contributions

Conceptualization, V.M.B. and A.G.; Methodology, V.M.B. and A.G.; Software, V.M.B.; Validation, A.G.; Formal Analysis, V.M.B. and A.G.; Writing—Original Draft Preparation, V.M.B.; Writing—Review and Editing, A.G. All authors have read and agreed to the published version of the manuscript.

Funding

This research received no external funding.

Conflicts of Interest

The authors declare no conflict of interest.

Appendix A. The Role of Interaction between B-Molecules

The above analysis is based on an assumption that the interaction between B-molecules can be neglected. This interaction, if high enough, may significantly affect the coverage of particle surfaces by B-molecules. In particular, a significant B–B interaction ε B B could promote the formation of large B-clusters on the particle surface and even cause complete coverage if the B-cluster grows over its critical size. To illustrate the effect, consider the simplified situation of the critical 2D cluster formation of B-molecules on a flat surface of an A-crystal. The condition for the critical cluster formation is given by the equivalence of chemical potentials of B-molecules in the surface gas phase of concentration n S and in the critical cluster of radius r C , namely, T ln n S = ε B B + γ B / r C , where γ B is the energy per B-molecule on the cluster perimeter. For the critical radius, we then obtain r C = γ B / ε B B + T ln n S . Using this one can easily obtain the critical cluster nucleation barrier Δ C
Δ C = ε B B T ln n S π r C 2 + γ B 2 π r C = π γ B 2 ε B B + T ln n S
Equation (A1) shows that for the ε B B values that are so low that ε B B + T ln n S 0 , no critical cluster can be formed; therefore, the interaction between B-molecules can be disregarded.

Appendix B. Derivation of Main Equations

To provide details on the derivation of Equation (2), consider the free energy of the system:
G = ε N P + γ S P 1 n S ε A B n S S P + T S P n S ln n S + 1 n S ln 1 n S ε A B N C + T N C ln N C + N A ln N A + N B ln N B + N L ln N L M Σ ln M Σ
where ε > 0   and   γ > 0 are the cohesive and surface energies per A-molecule, respectively, T is the temperature in energy units (eV), N P = 4 π R 3 / 3   and   S P = 4 π R 2 (particle radius R is measured in the units of typical intermolecular distance) is the total number of molecules in the A-particle and the number of molecules on the particle surface, respectively, NC, NB and NL are the numbers of A–B complexes, B-molecules and solvent molecules, respectively, in the solution, and n S is the concentration of B-molecules on the surfaces of A-particles, which are assumed to be in a gas-type phase. The total numbers of molecules Mi are introduced such that
N A = M A N P N C ,   N B = M B S P n S N C , M Σ = N A + N B + N C + M L = M A N P N C + M B S P n S + M L ,   M L = N L
Taking into account Equation (A3), we can choose three independent variables: N P ,   N C   and   n S . The free energy given by Equation (A2) is expressed in these variables as
G = ε N P + γ S P 1 n S ε A B n S S P + T S P n S ln n S + 1 n S ln 1 n S ε A B N C + T N C ln N C + T M A N P N C ln M A N P N C + T M B S P n S N C ln M B S P n S N C + T M L ln M L T M A N P N C + M B S P n S + M L ln M A N P N C + M B S P n S + M L
Minimization of G means that d G = G N P δ N P + G n S δ n S + G N C δ N C = 0 G N P = G n S = G N C = 0 . Applying this minimization to Equation (A4) gives
G N P = ε + 2 R γ 1 n S ε A B n S + T n S ln n S + 1 n S ln 1 n S + + T ln M A N P N C + M B S P n S + M L M A N P N C T n S 2 R ln M B S P n S N C M A N P N C + M B S P n S + M L = 0 G n S = γ + ε A B S P + T S P ln n S 1 n S S P T ln M B S P n S N C M A N P N C + M B S P n S + M L = 0 G N C = ε A B + T ln N C · M A N P N C + M B S P n S + M L M A N P N C · M B S P n S N C = 0 .
Suppose that M L > > N A + N B + N C , M A > > N P + N C . Then, after simplification, we have
ε + 2 R γ 1 n S ε A B n S + T n S ln n S n B + 1 n S ln 1 n S T ln n A = 0 γ + ε A B + T ln n S 1 n S n B = 0 ε A B + T ln n C n A n B = 0
These equations represent the equality of chemical potentials of A-molecules in solution and in the particle (first line), of B-molecules in solution and on the particle surfaces (second line), and of the dimers and unbound A- and B-molecules in the solution (third line). The solution to the second and third equations is given by
n C = n A n B E 0 ,   E 0 = exp ε A B T ,   n S = n B E 1 1 + n B E 1 ,   E 1 = exp γ + ε A B T
Substituting n S into the first of Equation (A6), we obtain
T ln n A = ε + 2 R Γ ,   Γ = γ T ln 1 + n B E 1
Combining Equations (A7) and (A8) gives Equation (2).

References

  1. Chakraverty, B.K. Grain size distribution—1. Conservative systems. J. Phys. Chem. Solids 1967, 28, 2401–2412. [Google Scholar] [CrossRef]
  2. Prasad, B.L.V.; Stoeva, S.I.; Sorensen, C.M.; Klabunde, K.J. Digestive ripening agents for gold nanoparticles: Alternatives to thiols. Chem. Mater. 2003, 15, 935–942. [Google Scholar] [CrossRef]
  3. Prasad, B.L.V.; Stoeva, S.I.; Sorensen, C.M.; Klabunde, K.J. Digestive ripening of thiolated gold nanoparticles: The effect of alkyl chain length. Langmuir 2002, 18, 7515–7520. [Google Scholar] [CrossRef]
  4. Smetana, A.B.; Klabunde, K.J.; Sorensen, C.M. Synthesis of spherical silver nanoparticles by digestive ripening, stabilization with various agents, and their 3-D and 2-D superlattice formation. J. Colloid Interface Sci. 2005, 284, 521–526. [Google Scholar] [CrossRef] [PubMed]
  5. Pan, J.; El-Ballouli, A.O.; Rollny, L.; Voznyy, O.; Burlakov, V.M.; Goriely, A.; Sargent, E.H.; Bakr, O.M. Automated Synthesis of Photovoltaic-Quality Colloidal Quantum Dots Using Separate Nucleation and Growth Stages. ACS Nano 2013, 7, 10158–10166. [Google Scholar] [CrossRef] [PubMed]
  6. Dransfield, G.P.; Fothergill, K.A.; Egerton, T.A. The use of plasma synthesis and pigment coating technology to produce an yttria stabilised zirconia having superior properties. In Euro Ceramics; Terpstra, R.A., Metsalaar, R.M., Eds.; Elsevier Applied Science Publishers: London, UK, 1989; Volume 1, pp. 275–279. [Google Scholar]
  7. Blackburn, S.R.; Egerton, T.A.; Jones, A.G. Vapour phase synthesis of nitride ceramic powders using a DC plasma. Br. Ceram. Proc. 1991, 47, 87–94. [Google Scholar]
  8. Fauchais, P.; Bourdin, E.; Coudert, J.F.; McPherson, R. High-pressure plasmas and their application to ceramic technology. In Topics in Current Chemistry; Boschke, F.L., Ed.; Springer: Berlin, Germany, 1983; Volume 107, pp. 59–184. [Google Scholar]
  9. Ross, F.M.; Tersoff, J.; Tromp, R.M. Coarsening of Self-Assembled Ge Quantum Dots on Si(001). Phys. Rev. Lett. 1998, 80, 984–987. [Google Scholar] [CrossRef]
  10. Ross, F.M.; Tromp, R.M.; Reuter, M.C. Transition States between Pyramids and Domes During Ge/Si Island Growth. Science 1999, 286, 1931–1934. [Google Scholar] [CrossRef]
  11. Ostwald, W.Z. Studien über die Bildung und Umwandlung fester Körper. Phys. Chem. 1897, 22, 289–330. [Google Scholar] [CrossRef]
  12. Mantzaris, N.V. Liquid-phase synthesis of nanoparticles: Particle size distribution dynamics and control. Chem. Eng. Sci. 2005, 60, 4749–4770. [Google Scholar] [CrossRef]
  13. Lifshitz, M.; Slezov, V.V. Kinetics of Diffusive Decomposition of Supersaturated Solid Solutions. Zh. Eksp. Sov. Phys. JETP 1959, 8, 331–339. [Google Scholar]
  14. Lifshitz, M.; Slezov, V.V. The Kinetics of Precipitation from Supersaturated Solid Solutions. J. Phys. Chem. Solids 1961, 19, 35–50. [Google Scholar] [CrossRef]
  15. Wagner, C.Z. Theorie der Alterung von Niederschlägen durch Umlösen (Ostwald-Reifung). Z. Elektrochem. 1961, 65, 581–591. [Google Scholar]
  16. Voorhees, P.W. Ostwald ripening of two-phase mixtures. Ann. Rev. Mater. Sci. 1992, 22, 197–215. [Google Scholar] [CrossRef]
  17. Porter, D.A.; Easterling, K.E. Phase Transformations in Metals and Alloys; Chapman and Hall: New York, NY, USA, 1992. [Google Scholar]
  18. Zinke-Allmang, M.; Feldman, L.C.; Grabow, M.H. Clustering on surfaces. Surf. Sci. Rep. 1992, 16, 377–463. [Google Scholar] [CrossRef]
  19. Taylor, P. Ostwald ripening in emulsions: Estimation of solution thermodynamics of the disperse phase. Adv. Colloid Interface Sci. 2003, 106, 261–285. [Google Scholar] [CrossRef]
  20. Bartelt, N.C.; Theis, W.; Tromp, R.M. Ostwald ripening of two-dimensional islands on Si(001). Phys. Rev. B 1996, 54, 11741–11751. [Google Scholar] [CrossRef]
  21. Goldfarb, I.; Briggs, G.A.D. Advances in germanium-silicon heteroepitaxy. Recent Res. Dev. Mater. Sci. 1998, 1, 189–213. [Google Scholar]
  22. Tromp, R.M.; Ross, F.M.; Reuter, M.C. Instability-driven SiGe island growth. Phys. Rev. Lett. 2000, 84, 4641–4644. [Google Scholar] [CrossRef]
  23. Lee, D.-K.; Park, S.-I.; Lee, J.K.; Hwang, N.-M. A theoretical model for digestive ripening. Acta Mater. 2007, 55, 5281–5288. [Google Scholar] [CrossRef]
  24. Lee, D.-K.; Hwang, N.-M. Thermodynamics and kinetics of monodisperse alloy nanoparticles synthesized through digestive ripening. Scr. Mater. 2009, 61, 304–307. [Google Scholar] [CrossRef]
  25. Rizza, C.C.; Strobel, M.; Heinig, K.H.; Bernas, H. Ion irradiation of gold inclusions in SiO2: Experimental evidence for inverse Ostwald ripening. Nucl. Instrum. Methods Phys. Res. B 2001, 178, 78–83. [Google Scholar] [CrossRef]
  26. Ramaswamy, V.; Haynes, T.E.; Woody White, C.; MoberlyChan, W.J.; Roorda, S.; Aziz, M.J. Synthesis of nearly monodisperse embedded nanoparticles by separating nucleation and growth in ion implantation. Nano Lett. 2005, 5, 373–378. [Google Scholar] [CrossRef] [PubMed]
  27. Rizza, G.; Cheverry, H.; Gacoin, T.; Lamasson, A.; Henry, S. Ion beam irradiation of embedded nanoparticles: Toward an in situ control of size and spatial distribution. J. Appl. Phys. 2007, 101, 014321. [Google Scholar] [CrossRef]
  28. Clark, M.D.; Kumar, S.K.; Owen, J.S.; Chan, E.M. Focusing Nanocrystal Size Distributions via Production Control. Nano Lett. 2011, 11, 1976–1980. [Google Scholar] [CrossRef]
  29. Clark, M.D. Growth laws for surfactant-coated nanocrystals: Ostwald ripening and size focusing. J. Nanopart. Res. 2014, 16, 2264. [Google Scholar] [CrossRef]
  30. Lu, A.H.; Salabas, E.L.; Schueth, F. Magnetic Nanoparticles: Synthesis, Protection, Functionalization, and Application. Angew. Chem. Int. Ed. 2007, 46, 1222–1244. [Google Scholar] [CrossRef]
  31. Kumar, S.; Gradzielski, M.; Mehta, S.K. The critical role of surfactants towards CdS nanoparticles: Synthesis, stability, optical and PL emission properties. RSC Adv. 2013, 3, 2662–2676. [Google Scholar] [CrossRef] [Green Version]
  32. Cookson, J. The preparation of palladium nanoparticles. Platin. Met. Rev. 2012, 56, 83–98. [Google Scholar] [CrossRef]
  33. Jana, N.R.; Gearheart, L.; Murph, C.J. Seed-mediated growth approach for shape-controlled synthesis of spheroidal and rod-like gold nanoparticles using a surfactant template. Adv. Mater. 2001, 13, 1389–1393. [Google Scholar] [CrossRef]
  34. John, V.T.; Simmons, B.; McPherson, G.L.; Bose, A. Application and Characterization of Surfactants. Curr. Opin. Colloid Interface Sci. 2002, 7, 288–295. [Google Scholar] [CrossRef]
  35. Bao, Y.; An, W.; Turner, C.H.; Krishnan, K.M. The Critical Role of Surfactants in the Growth of Cobalt Nanoparticles. Langmuir 2009, 26, 478–483. [Google Scholar] [CrossRef] [PubMed]
  36. Chebil, A.; Desbrieres, J.; Nouvel, C.; Six, J.-L.; Durand, A. Ostwald ripening of nanoemulsions stopped by combined interfacial adsorptions of molecular and macromolecular nonionic stabilizers. Colloid Surf. A Physicochem. Eng. Asp. 2013, 425, 24–30. [Google Scholar] [CrossRef]
  37. Lindfors, L.; Skantze, P.; Skantze, U.; Rasmusson, M.; Zackrisson, A.; Olsson, U. Amorphous Drug Nanosuspensions. 1. Inhibition of Ostwald Ripening. Langmuir 2006, 22, 906–910. [Google Scholar] [CrossRef]
  38. Pham, B.T.T.; Zondanos, H.; Such, C.H.; Warr, G.G.; Hawkett, B.S. Miniemulsion Polymerization with Arrested Ostwald Ripening Stabilized by Amphiphilic RAFT Copolymers. Macromolecules 2010, 43, 7950–7957. [Google Scholar] [CrossRef]
  39. Gupta, S.; Narayan, J. Selective Liquid-Phase Regrowth of Reduced Graphene Oxide, Nanodiamond, and Nanoscale Q-Carbon by Pulsed Laser Annealing for Radiofrequency Devices. ACS Appl. Nano Mater. 2020, 3, 5178–5188. [Google Scholar] [CrossRef]
  40. Parravicini, G.B.; Stella, A.; Ghigna, P.; Spinolo, G.; Migliori, A.; d’Acapito, F.; Kofman, R. Extreme undercooling (down to 90K) of liquid metal nanoparticles. Appl. Phys. Lett. 2006, 89, 033123. [Google Scholar] [CrossRef]
  41. Gupta, S.; Sachan, R.; Bhaumik, A.; Pant, P.; Narayan, J. Undercooling driven growth of Q-carbon, diamond, and graphite. MRS Commun. 2018, 8, 533–540. [Google Scholar] [CrossRef]
  42. Krishna, H.; Sachan, R.; Strader, J.; Favazza, C.; Khenner, M.; Kalyanaraman, R. Thickness-dependent spontaneous dewetting morphology of ultrathin Ag films. Nanotechnology 2010, 21, 155601. [Google Scholar] [CrossRef]
  43. Yang, S.; Xu, F.; Ostendorp, S.; Wilde, G.; Zhao, H.; Lei, Y. Template-Confined Dewetting Process to Surface Nanopatterns: Fabrication, Structural Tunability, and Structure-Related Properties. Adv. Funct. Mater. 2011, 21, 2446–2455. [Google Scholar] [CrossRef]
  44. Watt, J.; Cheong, S.; Tilley, R.D. How to control the shape of metal nanostructures in organic solution phase synthesis for plasmonics and catalysis. Nano Today 2013, 8, 198–215. [Google Scholar] [CrossRef]
  45. Zhang, J.; Hou, C.; Huang, H.; Zhang, L.; Jiang, Z.; Chen, G.; Jia, Y.; Kuang, Q.; Xie, Z.; Zheng, L. Surfactant-Concentration-Dependent Shape Evolution of Au–Pd Alloy Nanocrystals from Rhombic Dodecahedron to Trisoctahedron and Hexoctahedron. Small 2013, 9, 538–544. [Google Scholar] [CrossRef] [PubMed]
  46. Dong, H.; Wang, Y.; Tao, F.; Wang, L. Electrochemical Fabrication of Shape-Controlled Copper Hierarchical Structures Assisted by Surfactants. J. Nanomater. 2012, 2012, 6. [Google Scholar] [CrossRef]
  47. Xing, R.; Lehmler, H.-J.; Knutson, B.L.; Rankin, S. Demixed Micelle Morphology Control in Hydrocarbon/Huorocarbon Cationic Surfactant Templating of Mesoporous Silica. J. Phys. Chem. C 2010, 114, 17390–17400. [Google Scholar] [CrossRef]
  48. Xiao, J.; Qi, L. Surfactant-assisted, shape-controlled synthesis of gold nanocrystals. Nanoscale 2011, 3, 1383–1396. [Google Scholar] [CrossRef] [PubMed]
  49. Zhao, N.; Qi, L. Low-Temperature Synthesis of Star-Shaped PbS Nanocrystals in Aqueous Solutions of Mixed Cationic/Anionic Surfactants. Adv. Mater. 2006, 18, 359–362. [Google Scholar] [CrossRef]
  50. Burlakov, V.M.; Hassan, Y.; Danaie, M.; Snaith, H.J.; Goriely, A. Competitive Nucleation Mechanism for CsPbBr3 Perovskite Nanoplatelets Growth. J. Phys. Chem. Lett. 2020. [Google Scholar] [CrossRef]
  51. Burlakov, V.M.; Goriely, A. Thermodynamic limit for particle monodispersity: How narrow can a particle size distribution be? EPL 2017, 119, 50001. [Google Scholar] [CrossRef]
  52. Donohue, M.D.; Prausnitz, J.M. Combinatorial entropy of mixing molecules that differ in size and shape. A simple approximation for binary and multicomponent mixtures. Can. J. Chem. 1975, 53, 1586–1594. [Google Scholar] [CrossRef]
  53. Battaile, C.C. The Kinetic Monte Carlo method: Foundation, implementation, and application. Comput. Methods Appl. Mech. Eng. 2007, 197, 3386–3398. [Google Scholar] [CrossRef]
  54. Uppenbrink, J.; Wales, D.J. Structure and energetics of model metal clusters. J. Chem. Phys. 1992, 96, 8520–8534. [Google Scholar] [CrossRef]
  55. Jortner, J. Cluster size effects. Z. Phys. D 1992, 24, 247–275. [Google Scholar] [CrossRef]
  56. Lordeiro, R.A.; Guimaraes, F.F.; Belchior, J.C.; Johnston, R.L. Determination of main structural compositions of nanoalloy clusters of Cux Auy (x + y ≤ 30) using a genetic algorithm approach. Int. J. Quantum Chem. 2003, 95, 112–125. [Google Scholar] [CrossRef]
  57. Böyükata, M.J.; Belchior, C. Structural and energetic analysis of copper clusters: MD study of Cun (n = 2–45). J. Braz. Chem. Soc. 2008, 19, 884–893. [Google Scholar] [CrossRef] [Green Version]
  58. Heinz, H.; Pramanik, C.; Heinz, O.; Ding, Y.; Mishra, R.K.; Marchon, D.; Robert, J.; Flatt, R.J.; Estrela-Lopis, I.; Llop, J.; et al. Nanoparticle decoration with surfactants: Molecular interactions, assembly, and applications. Surf. Sci. Rep. 2017, 72, 1–58. [Google Scholar] [CrossRef]
Figure 1. Effective surface energy Γ (red) and concentration n S of surfactant molecules (B) on particle surface (blue) as functions of A–B bonding ε A B for two values of the bulk concentration of surfactant n S   =   0.002 (solid) and n S   =   0.01 (dotted) plotted according to Equation (2) for γ   =   0.01   eV and T   =   0.032   eV .
Applsci 10 05359 g001
Figure 2. (a) Time evolution of the mean R and maximum R m radii calculated for an ensemble of 104 particles with Gaussian initial distribution ( R = 1.5 and standard deviation σ = 0.25) obtained via numerical solution of Equations (4)–(7) for T = 0.032 eV (100 °C), γ 0   =   0.1   eV , ε   =   0.4   eV and n S     0.002 . The values of ε A B and γ 1 , respectively, are (eV units): (1) 0.24 and 0; (2) 0.21 and 0; (3) 0.21 and 0.01; (4) 0.196 and 0; (5) 0.18 and 0. (b) Particle size distribution (PSD) corresponding to the curves (3) at the time moments indicated by arrows in (a).
Applsci 10 05359 g002

