Article

Very-High-Cycle Fatigue and Charpy Impact Characteristics of Manganese Steel for Railway Axle at Low Temperatures

1
Advanced Railroad Vehicle Division, Korea Railroad Research Institute, Uiwang 16105, Korea
2
New Transportation Innovative Research Center, Korea Railroad Research Institute, Uiwang 16105, Korea
3
Department of Advanced Materials Engineering, Sun Moon University, Asan 31460, Korea
*
Author to whom correspondence should be addressed.
Appl. Sci. 2020, 10(15), 5042; https://doi.org/10.3390/app10155042
Submission received: 29 June 2020 / Revised: 14 July 2020 / Accepted: 21 July 2020 / Published: 22 July 2020
(This article belongs to the Special Issue Advances in Very-High-Cycle Fatigue)

Abstract

:

Featured Application

This work can be applied to the development of new axle materials and to the high-cycle fatigue testing of materials at low temperatures.

Abstract

Railway vehicles are being exposed with increasing frequency to conditions of severe heat and cold because of changes in the climate. Trains departing from Asia travel to Europe through the Eurasian continent and vice versa. Given these circumstances, the mechanical properties and performance of vehicle components must therefore be evaluated at lower and higher temperatures than those in current standards. In this study, specimens were produced from a commercial freight train axle made of manganese steel and subjected to high-cycle fatigue tests at −60, −30, and 20 °C. The tests were conducted using an ultrasonic fatigue tester developed to study fatigue at low temperatures. Charpy impact testing was performed over the temperature range of −60 to 60 °C to measure the impact absorption energy of the axle material. The material showed a fatigue limit above 2 million cycles at each temperature; the lower the test temperature, the greater the fatigue limit cycles. The impact absorption energy at −60 °C was 81% less compared to the value at 20 °C. The axle material became completely brittle in the temperature range of −30 to −40 °C.

1. Introduction

With recent changes in climate, railroad vehicles are now operating in a wider range of conditions than in the past, including deep cold and heatwaves. Under such circumstances, the dynamic characteristics of the vehicle may be changed, and unexpected failures may occur [1,2]. For these reasons, interest in the mechanical properties of components at low and high temperatures is increasing. The axle is one of the key components affecting the structural safety of rolling stock. The failure of an axle can lead to the derailment of a vehicle, fatal accidents, property loss, etc. When flying ice cubes by train gust or gravel on the track impact the axle, a defect may occur on the surface of the axle [3]. Cracks may grow from the defect and lead to the axle breaking. So, in addition to fatigue strength, resistance to shock is one of the required standards of axles [4,5]. The fatigue strength and the impact resistance of a material depend on temperature, but the Korean standard [5] does not specify the temperature during tests. In general, railway vehicles are designed to have long lifetimes, from 20 to more than 40 years. Their components need to have long durability. During the lifetime of a railway vehicle, which is typically 3 × 10⁶ km, an axle installed on the vehicle experiences very high cycles of fatigue loading (1.0~1.2 giga-cycles). However, the giga-cycle fatigue properties of axles have not been studied much because of the restrictions of testing time and costs. In the past, conducting fatigue tests in the giga-cycle range was not easy. Even when a fatigue test is performed at 100 Hz without rest, 115 days are needed to apply 109 loading cycles. Therefore, components under fatigue loading have been designed by using an S–N (stress–number of cycles to failure) curve, with an endurance limit of 2 × 10⁶ cycles. However, according to the results of very-high-cycle fatigue tests, the fatigue strength of some materials decreases as the loading cycles increase above 2 × 10⁶ cycles. In other words, fatigue limits were not observed for those materials. Under these circumstances, studies on fatigue characteristics at very high cycles are required.
High-cycle fatigue testing technologies were widespread in the early 2000s [6,7,8] with the advent of new technologies such as ultrasonic resonance fatigue testing. Ultrasonic fatigue specimens have a cylindrical or rectangular cross section. Specimen dimensions can be calculated by solving the elastic wave equations [6,7]. In general, a 20 kHz ultrasonic transducer is widely used. Most tests are performed under tension–compression loading. Stanzl-Tschegg et al. [9], Bathias [10], and Nikitin et al. [11] presented test machines for torsional ultrasonic fatigue tests. Recently, fatigue specimens have been designed and studied under simultaneous tensile and shear stress [12,13].
Wang et al. [14] compared the fatigue behavior of two spring wires for automobile use (CrV and CrSi) under a giga-cycle regime. The CrV steel showed constant fatigue strength over 106 cycles, which means that this material has a fatigue limit. However, the CrSi had decreasing fatigue strength with loading cycles. In the case of fatigue life beyond 107 cycles, fatigue cracks occurred from the defects in the interior of the specimens. According to their calculated results, the crack initiation life was more than 99% of the total fatigue life. In their other research [15] on ultra-high-strength steels, they found that high-cycle fatigue cracks initiated from subsurface inclusions of sulfides. Ochi et al. [16] presented similar results with high-strength steels SUJ2 (high-carbon-chromium bearing steel) and SNCM439 (nickel chromium molybdenum steel). The fatigue strengths decreased over 107 cycles. In the short life regime, fatigue cracks started from the surface. In the high-cycle regime, fatigue cracks occurred from internal defects or nonmetallic inclusions such as TiN, Al2O3, MnS, and Al2O3. The effect of nonmetallic inclusions on the fatigue strength of high-strength steels was studied by Murakami and Endo [17] and by Murakami et al. [18]. They expressed fatigue strength as a function of Vickers hardness, stress ratio, and the root of the projected area of inclusion. Most studies have focused on high-strength steels or alloys with hardening heat treatment. However, the railway axle material in this study is normalized and has a medium strength level (tensile strength 590 MPa), and it does not contain Cr, Mo, Ni, Cu, etc. It is composed of five elements (C, Mn, Si, S, P) and Fe. Whether this kind of manganese steel has a fatigue limit or not is interesting. Zettl et al. [19] investigated the giga-cycle fatigue behavior of normalized carbon steel (Ck15, tensile strength 418 MPa) using an ultrasonic fatigue tester. The chemical composition of the material is 0.15 wt % C, 0.45 Mn, 0.20 Si, P, S, Fe balance. All fatigue cracks initiated at surfaces. The fatigue strength decreased until 107 cycles; after that, it was nearly constant. The fatigue strength at 109 cycles was 2.5% lower than at 107 cycles. The highest number of cycles to failure was 1.3 × 10⁷ cycles. Zhao et al. [20] carried out fatigue tests in a giga-cycle regime using specimens produced from a real axle with chemical composition C, Si, Mn, Cr, Ni, Cu, Al, and Fe. A duplex S–N curve (inclined–horizontal–inclined–horizontal curve) was obtained. All cracks initiated at surfaces. Damaged spots around subsurface inclusions that occurred during production were observed, but did not propagate beyond a certain size.
Qian et al. [21] compared the fatigue strengths of structural steel 40Cr (0.4% C, 1% Cr) in air, fresh water, and 3.5% NaCl aqueous solution. Specimens were tested to 2 × 10⁹ cycles with a rotary bending machine. The S–N curves in air and in water showed inclined–horizontal–inclined shapes, but the S–N curve in NaCl presented a continuously decreasing shape. According to the experimental results for 25Cr2Ni2MoV welded specimens by Wu et al. [22], the S–N curve at room temperature presented duplex slopes. However, at 370 °C, the fatigue strength decreased continuously. The crack initiation mechanism was similar at both temperatures. Fatigue studies at high temperatures are numerous, but comparative studies on fatigue properties at room temperature and low temperatures for manganese steels are rarely found in the literature. The purpose of this study is to investigate the fatigue and impact characteristics at low and high temperatures in consideration of the actual operating environment of railway vehicles. Ultrasonic fatigue testing equipment capable of fatigue tests to −160 °C was developed, and the fatigue and Charpy impact characteristics of the axle material were examined over a temperature range of −60 to +60 °C. Crack initiation and fracture surfaces were investigated.

2. Materials and Methods

The main chemical composition of the axle material is C, Si, Mn, and Fe (Table 1). The specimens were obtained from a new railway vehicle commercial axle. The longitudinal direction of the specimen coincided with that of the axle. The surface was polished by lapping. Tensile tests were performed according to ASTM A370. The measured yield and tensile strengths of three cylindrical specimens of Φ8.75 were within the ranges of 392–440 and 656–698 MPa, respectively (Figure 1). Figure 2 presents a microstructural image. The material is composed of ferrite (black part) and pearlite (gray part). The pearlite has a variety of shapes. The distance between Fe3C layers in a pearlite grain is different for each grain. Figure 3a shows the fatigue test specimen and the sampling location of the specimen from the axle. The minimum and maximum diameters of the specimen were 4 and 16 mm, respectively. The specimen was designed according to reference [7]. The stress and strain in the specimen were obtained from the elastic wave theory [7]. Natural vibration frequencies were obtained using ABAQUS software. The convergence of the solution was checked as the number of elements increased. The material properties listed in Table 2 were used for the simulation. The Young’s modulus and Poisson’s ratio of the specimen were measured according to ASTM 1876-01. Properties of the horn were taken from the literature. Figure 3 shows the natural modes of the specimen, the horn, and the assembly. The lateral displacement of the specimen in the middle of the hourglass section was zero, and the natural frequency was 19,784 Hz. This frequency is close to the excitation frequency of the input generator, 20 kHz.
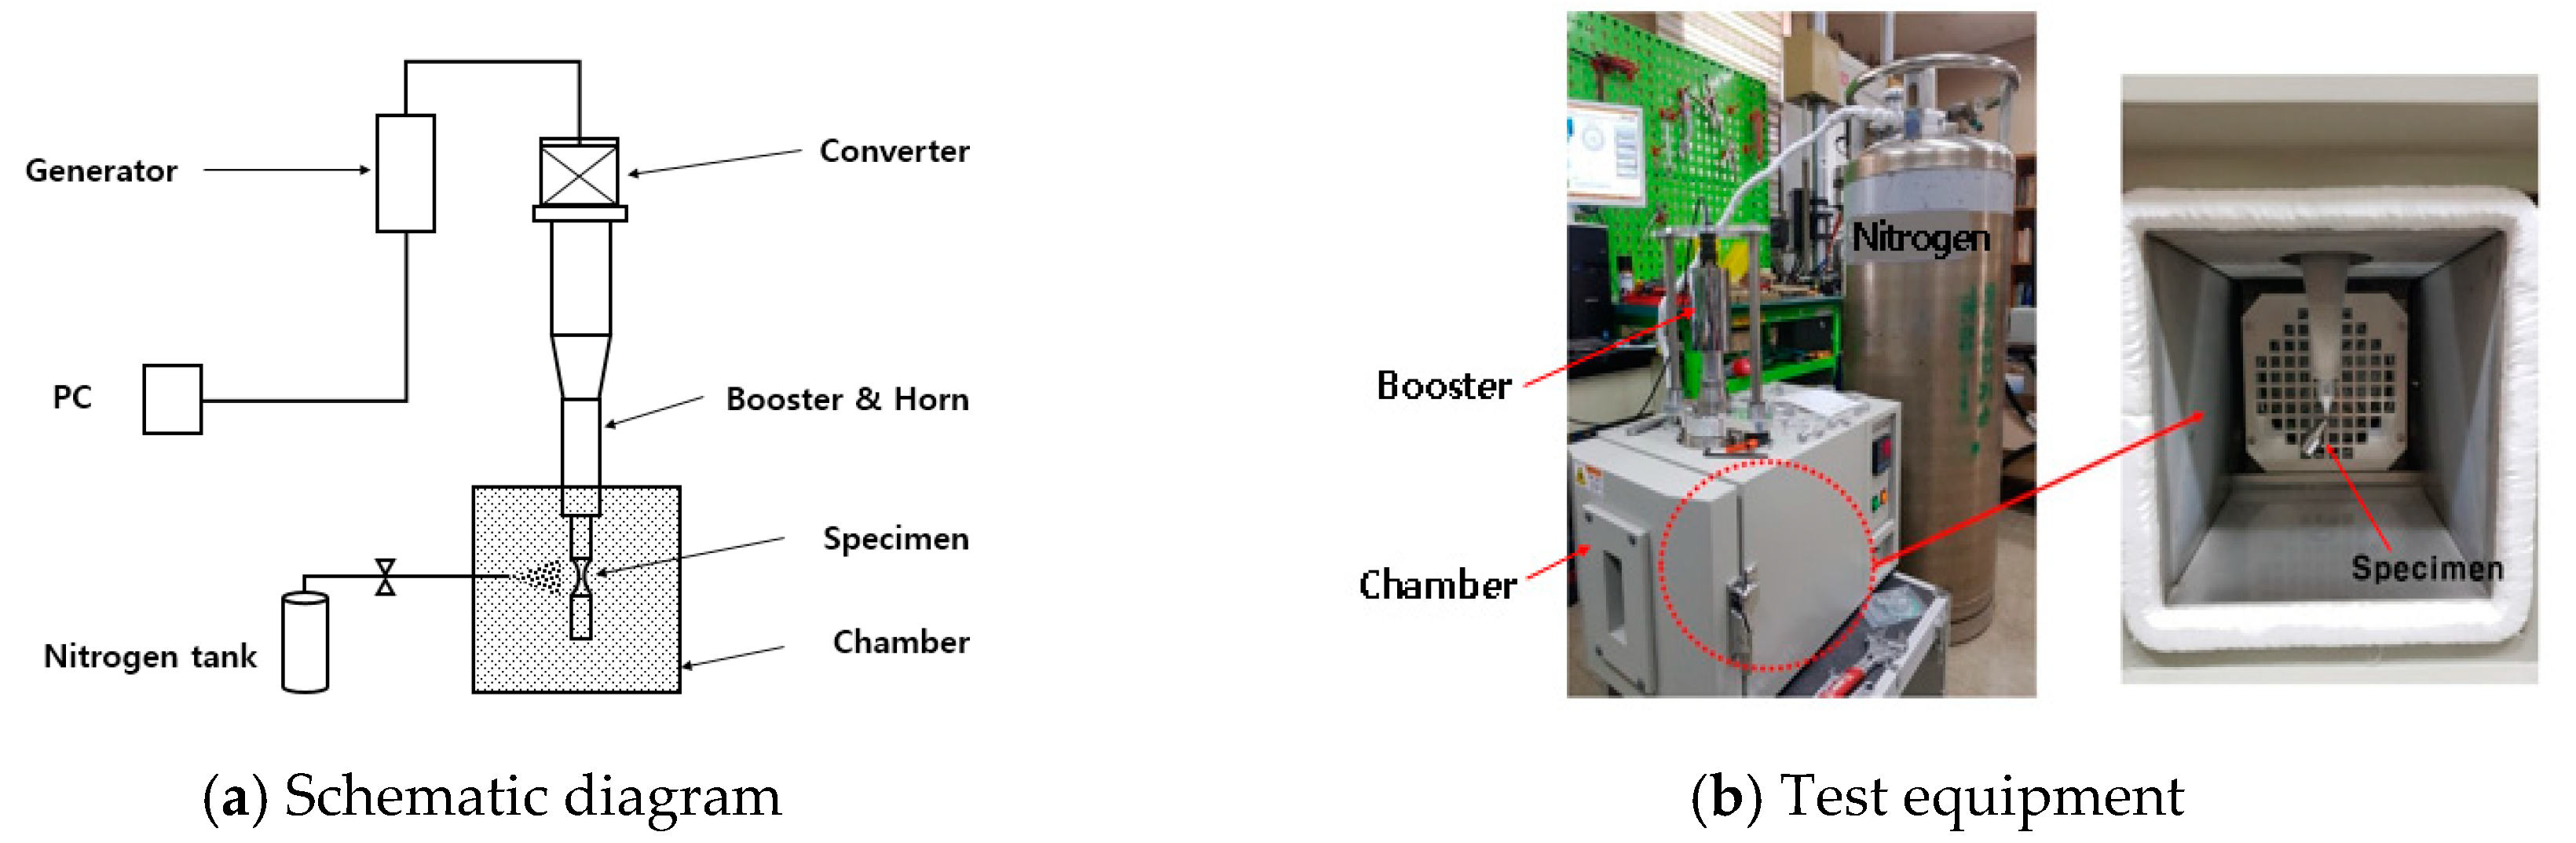
Figure 4 shows the newly developed piezoelectric UFT (ultrasonic fatigue test) equipment, which operates at a frequency of 20 kHz. The stress ratio (R = minimum load/maximum load) was R = −1. The UFT system consisted of a power generator, a converter (piezo actuator), and a horn attached mechanically to the converter by a screw. A personal computer controlled the generator and converter to impose a vibratory amplitude at the end of the horn. The power generator converts a 60 Hz voltage signal into a 20 kHz sinusoidal ultrasonic electrical signal. The converter converts the 20 kHz ultrasonic excitation signal into a mechanical signal. The boost and horn, with a natural frequency of 20 kHz, amplify the vibration. Displacement at the horn end was measured using a photonic sensor to calculate the stress value of the specimen. The stress value at the middle of the specimen was linearly proportional to the displacement of the specimen end and the dynamic modulus of elasticity of the specimen [6,7]. At 20 kHz, high-cycle fatigue testing generates excessive heat in the specimen, so countermeasures against heat generation are necessary. To ensure that the specimen was not heated, the test was performed by applying a load to the specimen for 0.3 s and stopping it for 3 s. As a result, the increase of specimen temperature due to the deformation caused by the load was negligible. Several specimens were subjected to preliminary tests to confirm the variation of specimen temperature using an infrared camera. The low-temperature test condition was achieved by injecting liquid nitrogen into the chamber through a nozzle. The temperature of the chamber was controlled by opening and closing the nozzle. The resolution of temperature control was about ±2 °C. As shown in Figure 4, the horn and the specimen were located in the chamber, in which a low temperature below −160 °C could be realized. The developed equipment is expected to be useful for low-temperature fatigue testing.
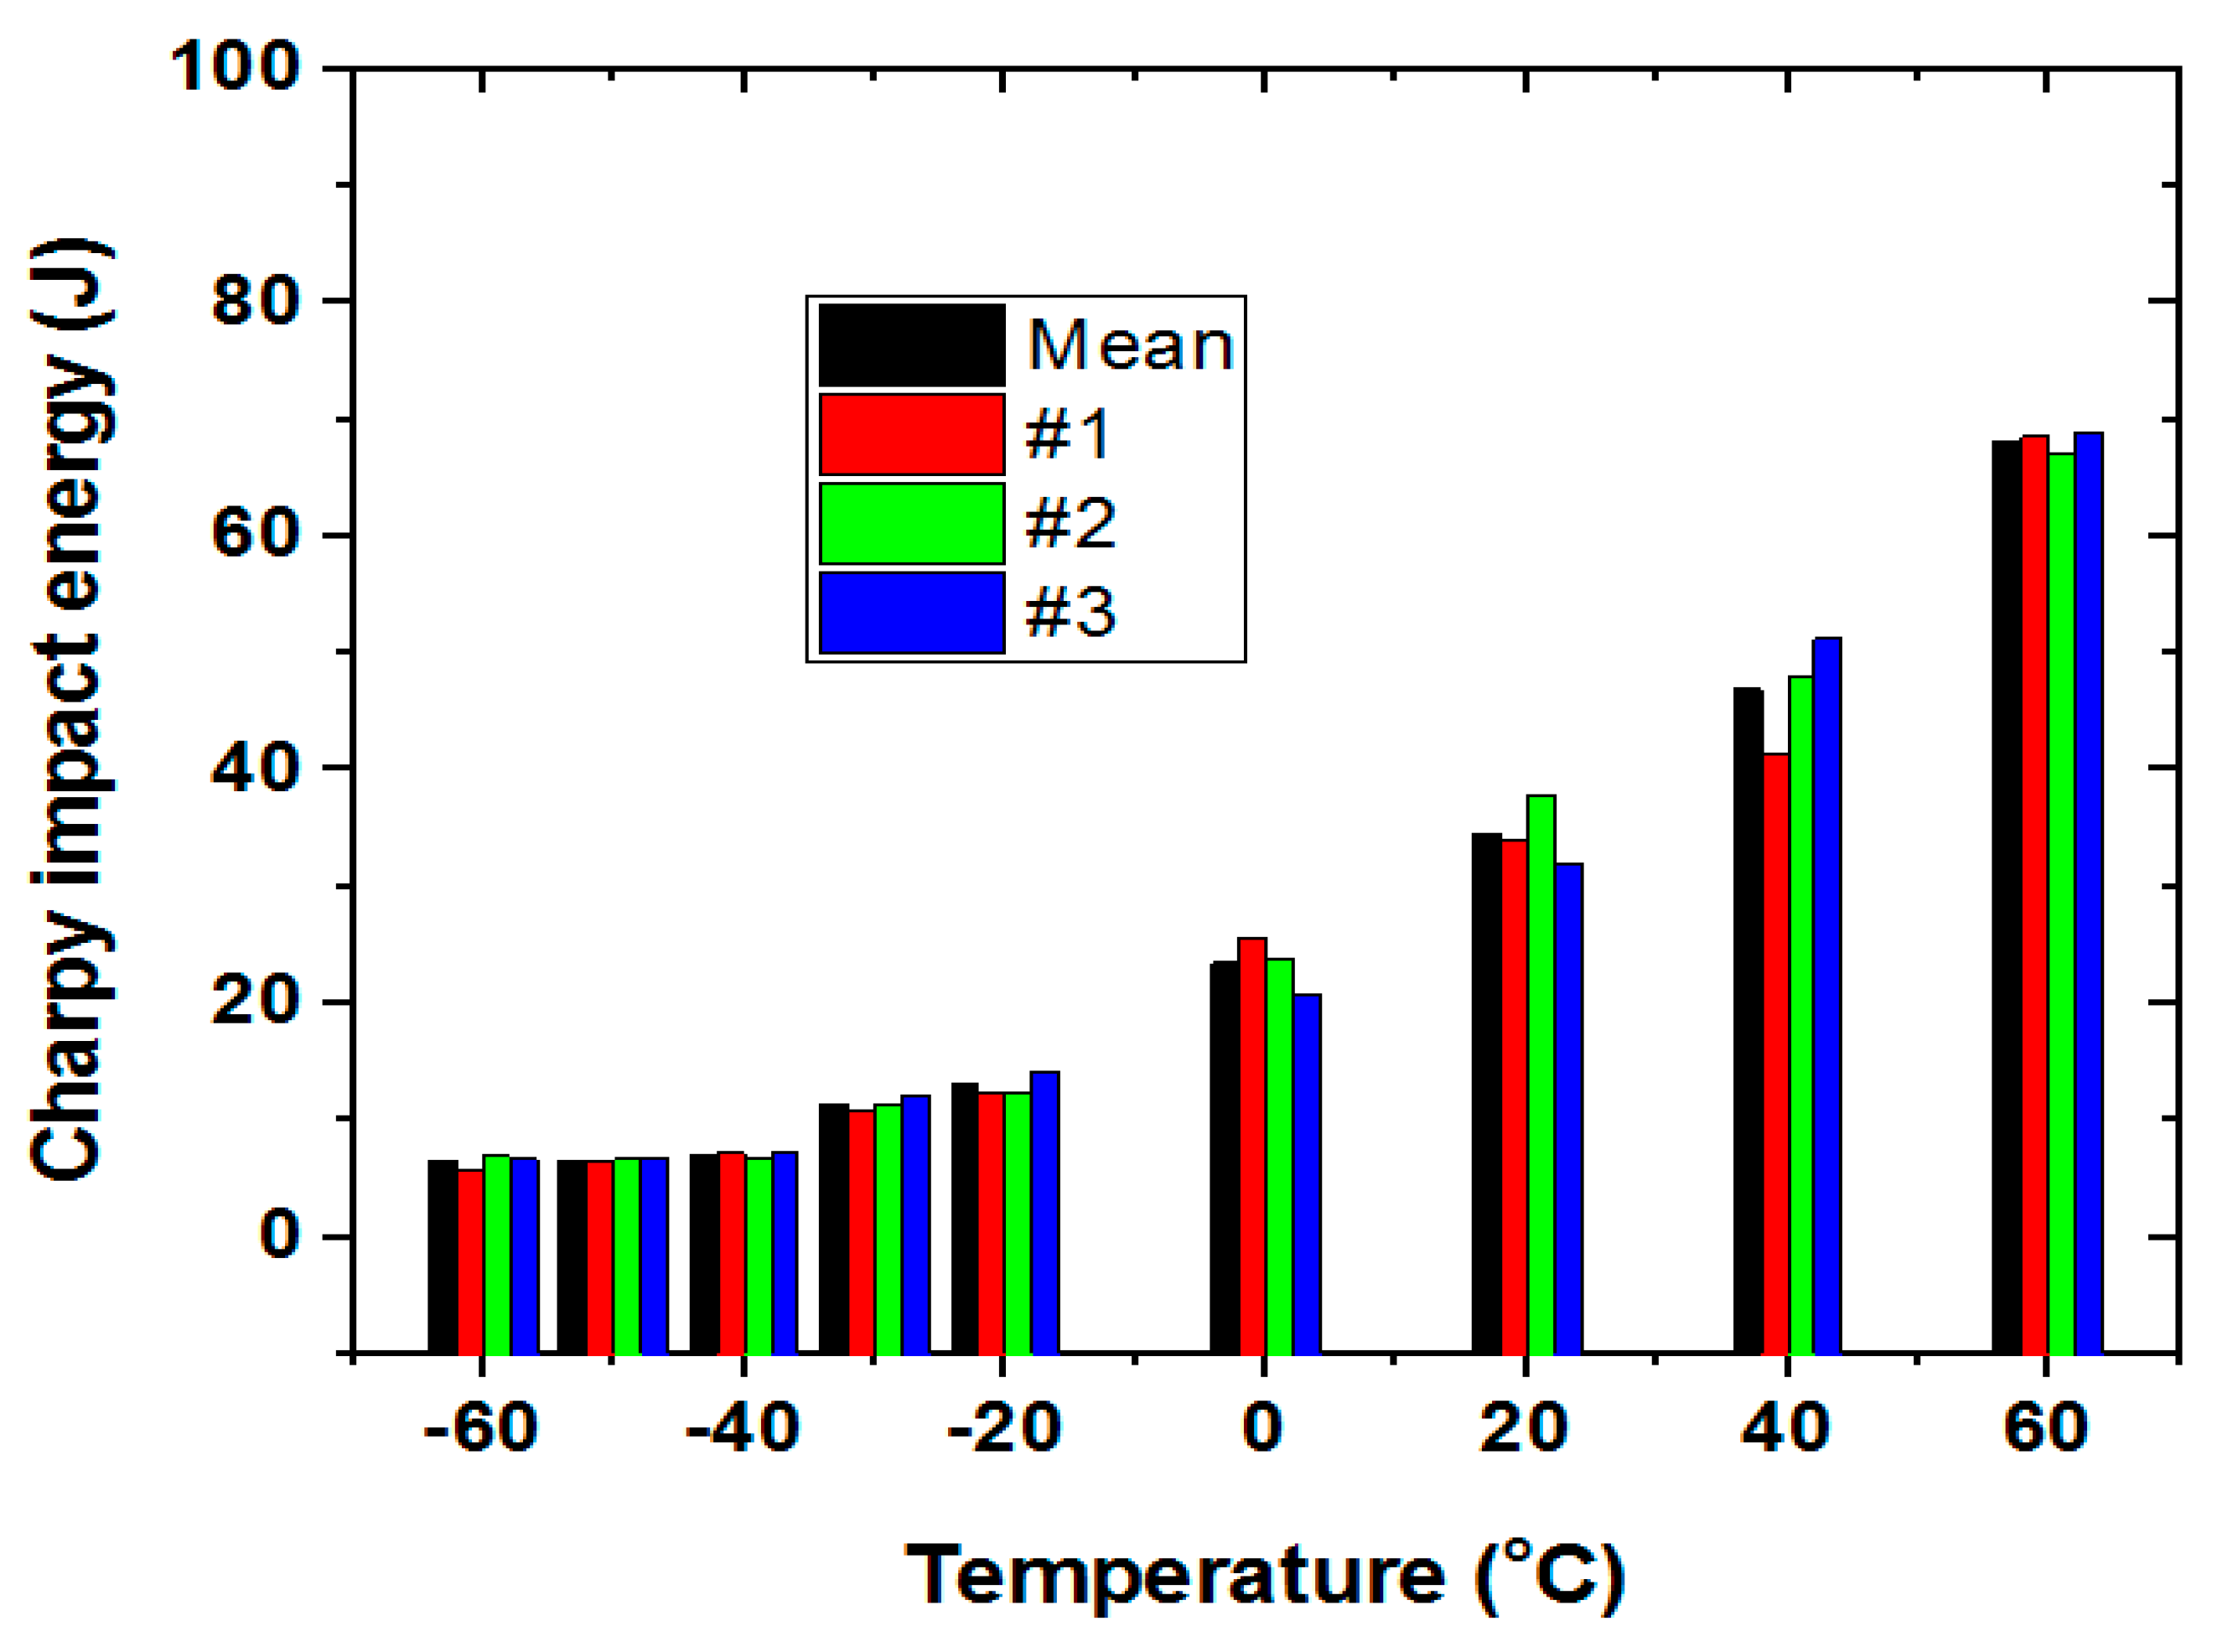
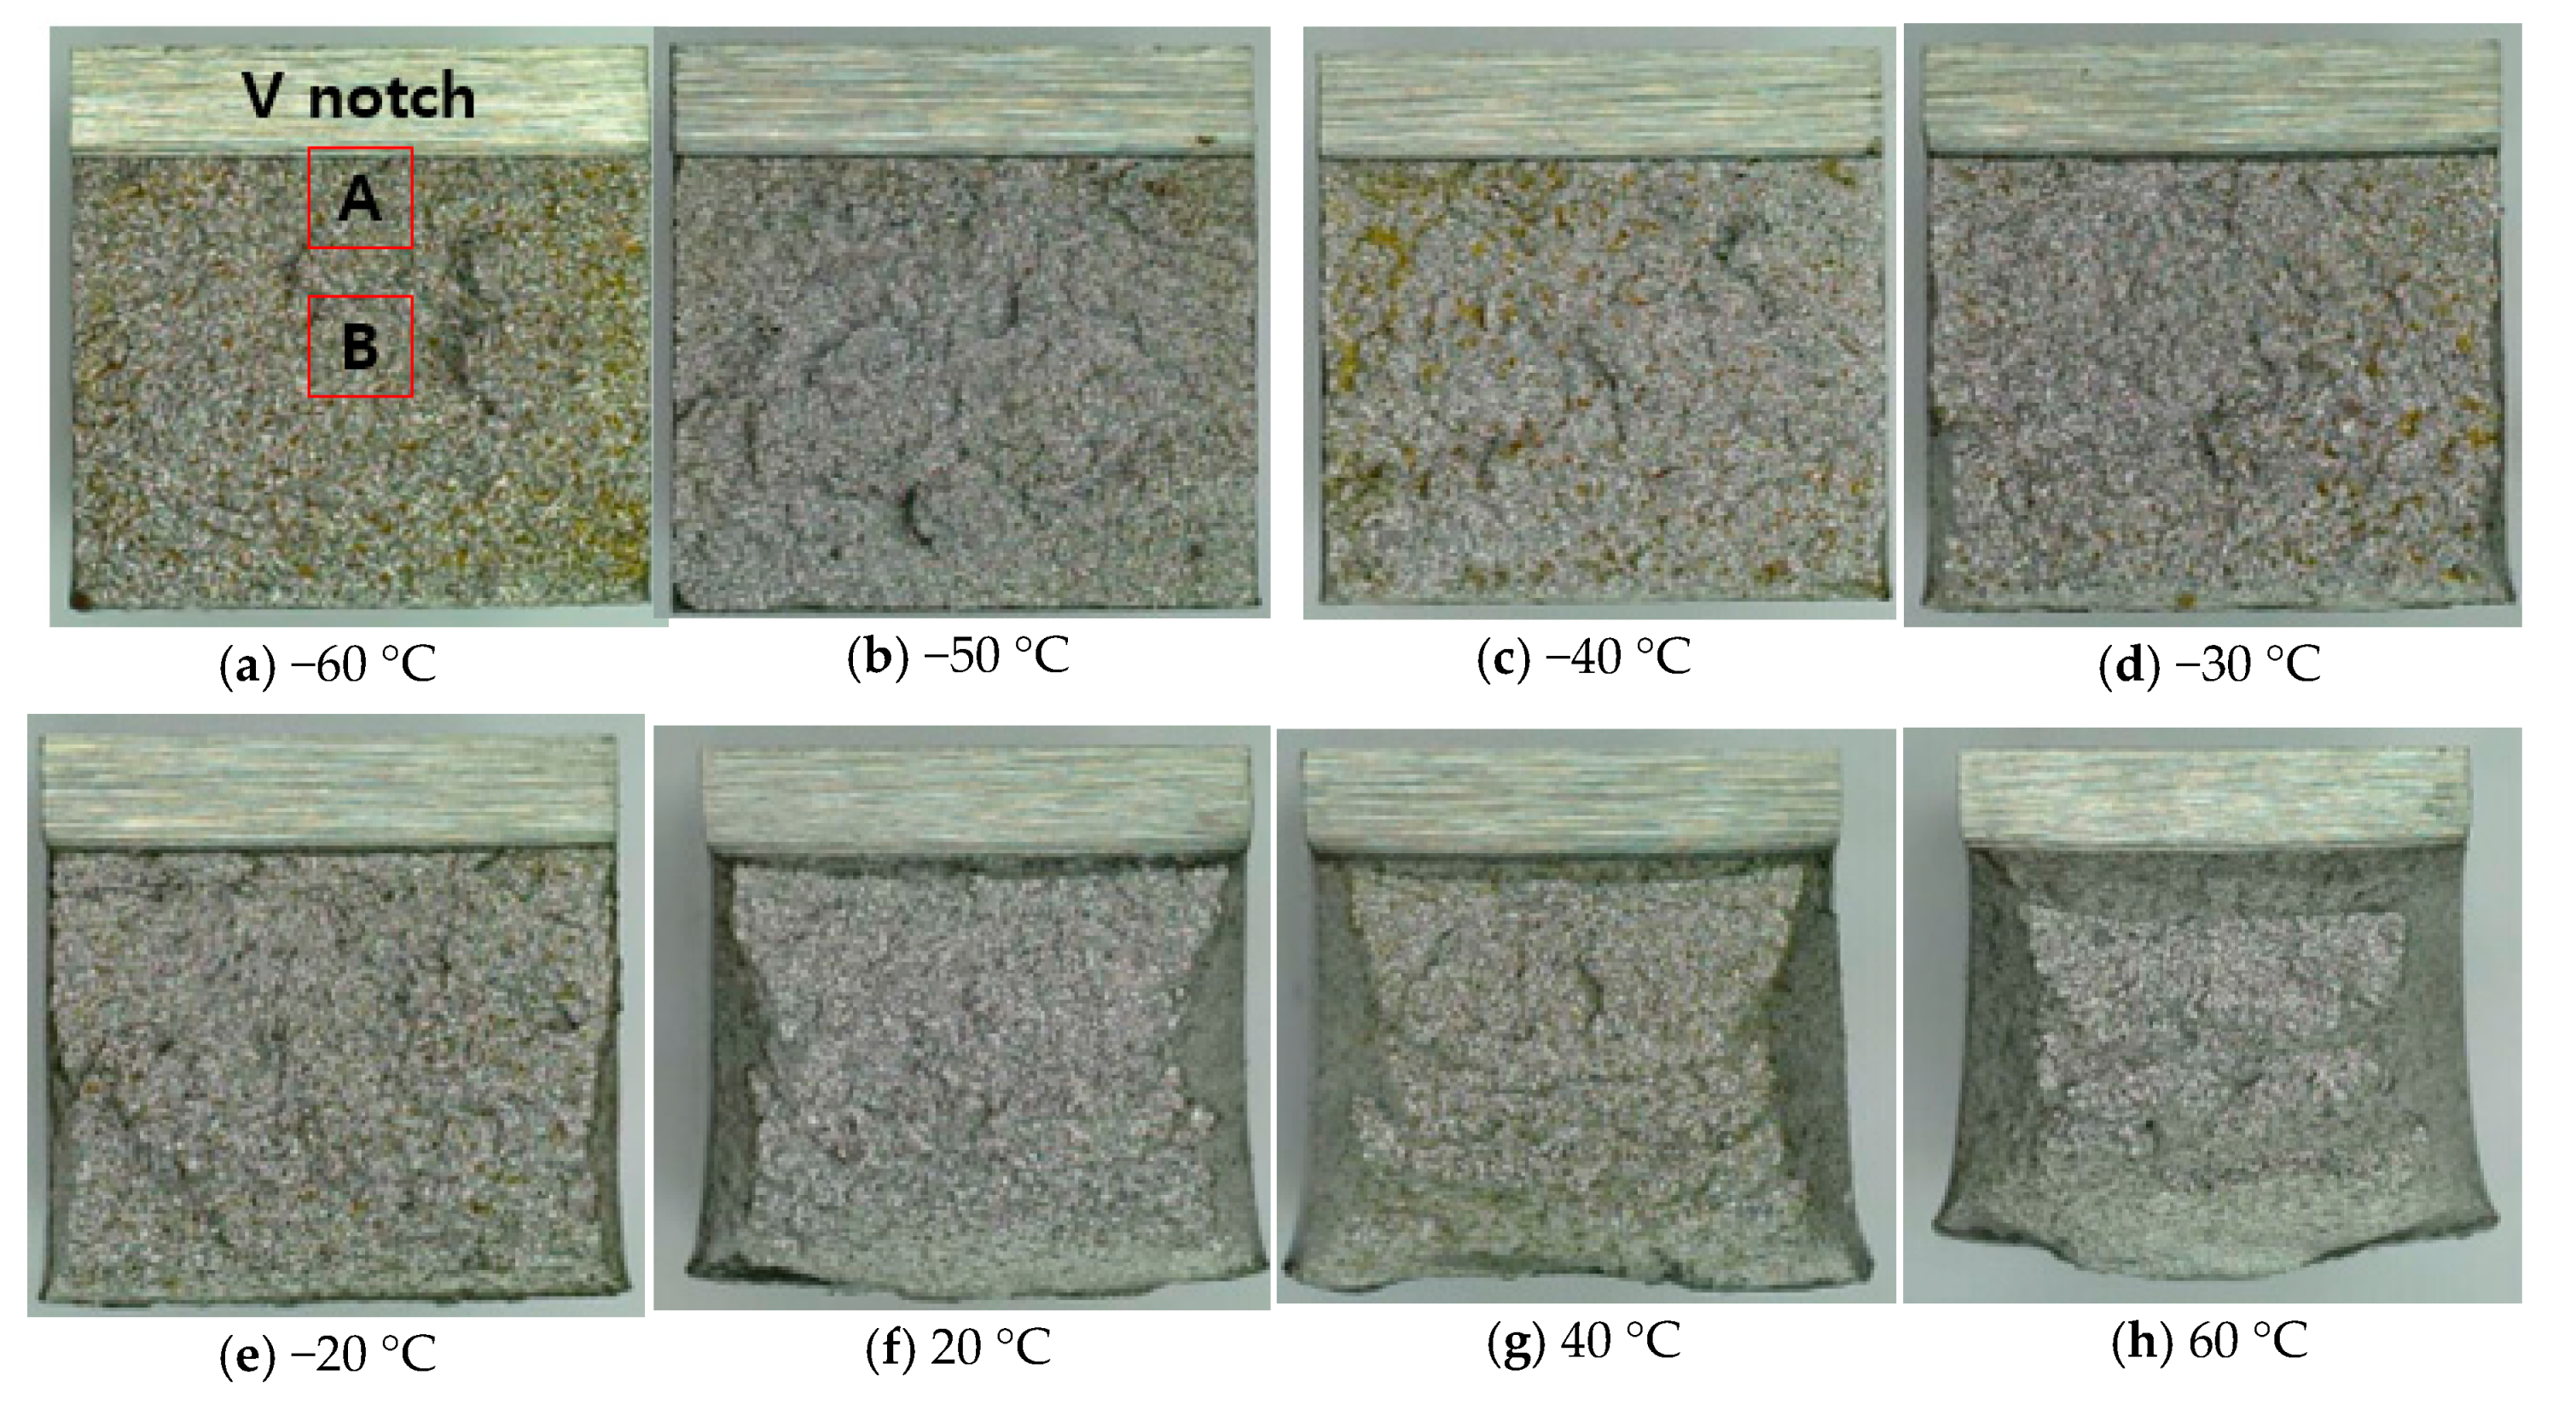
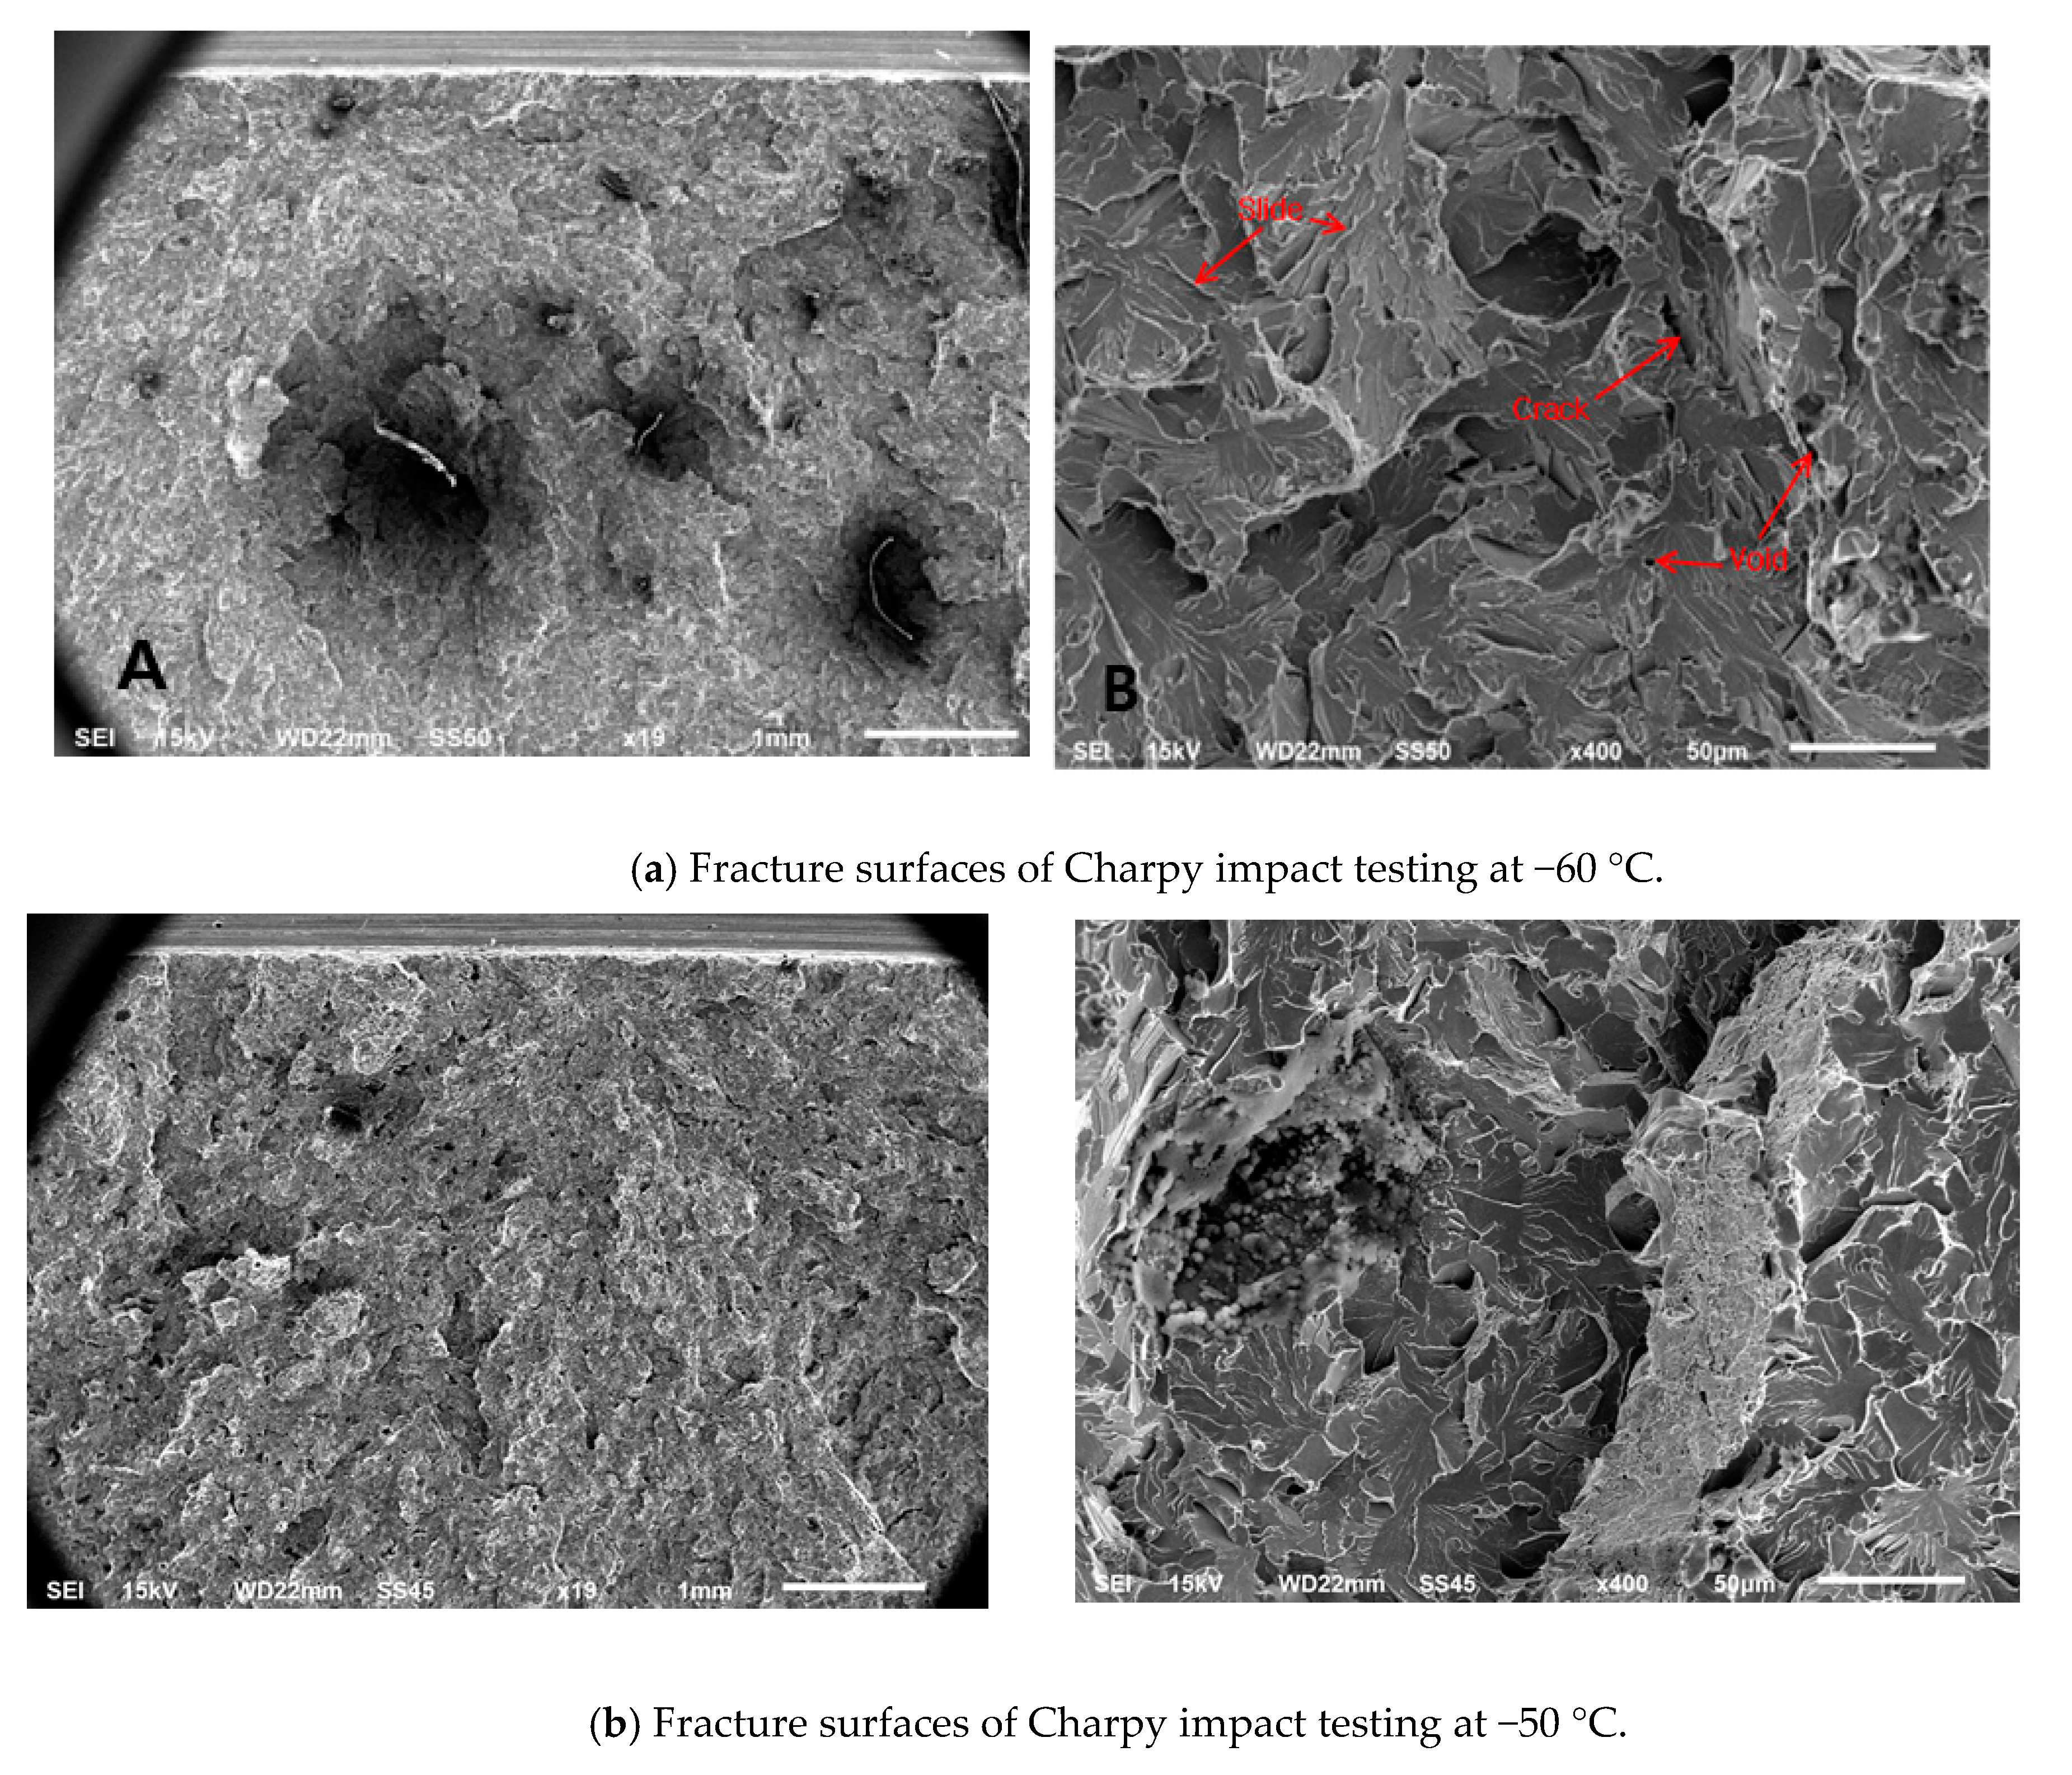
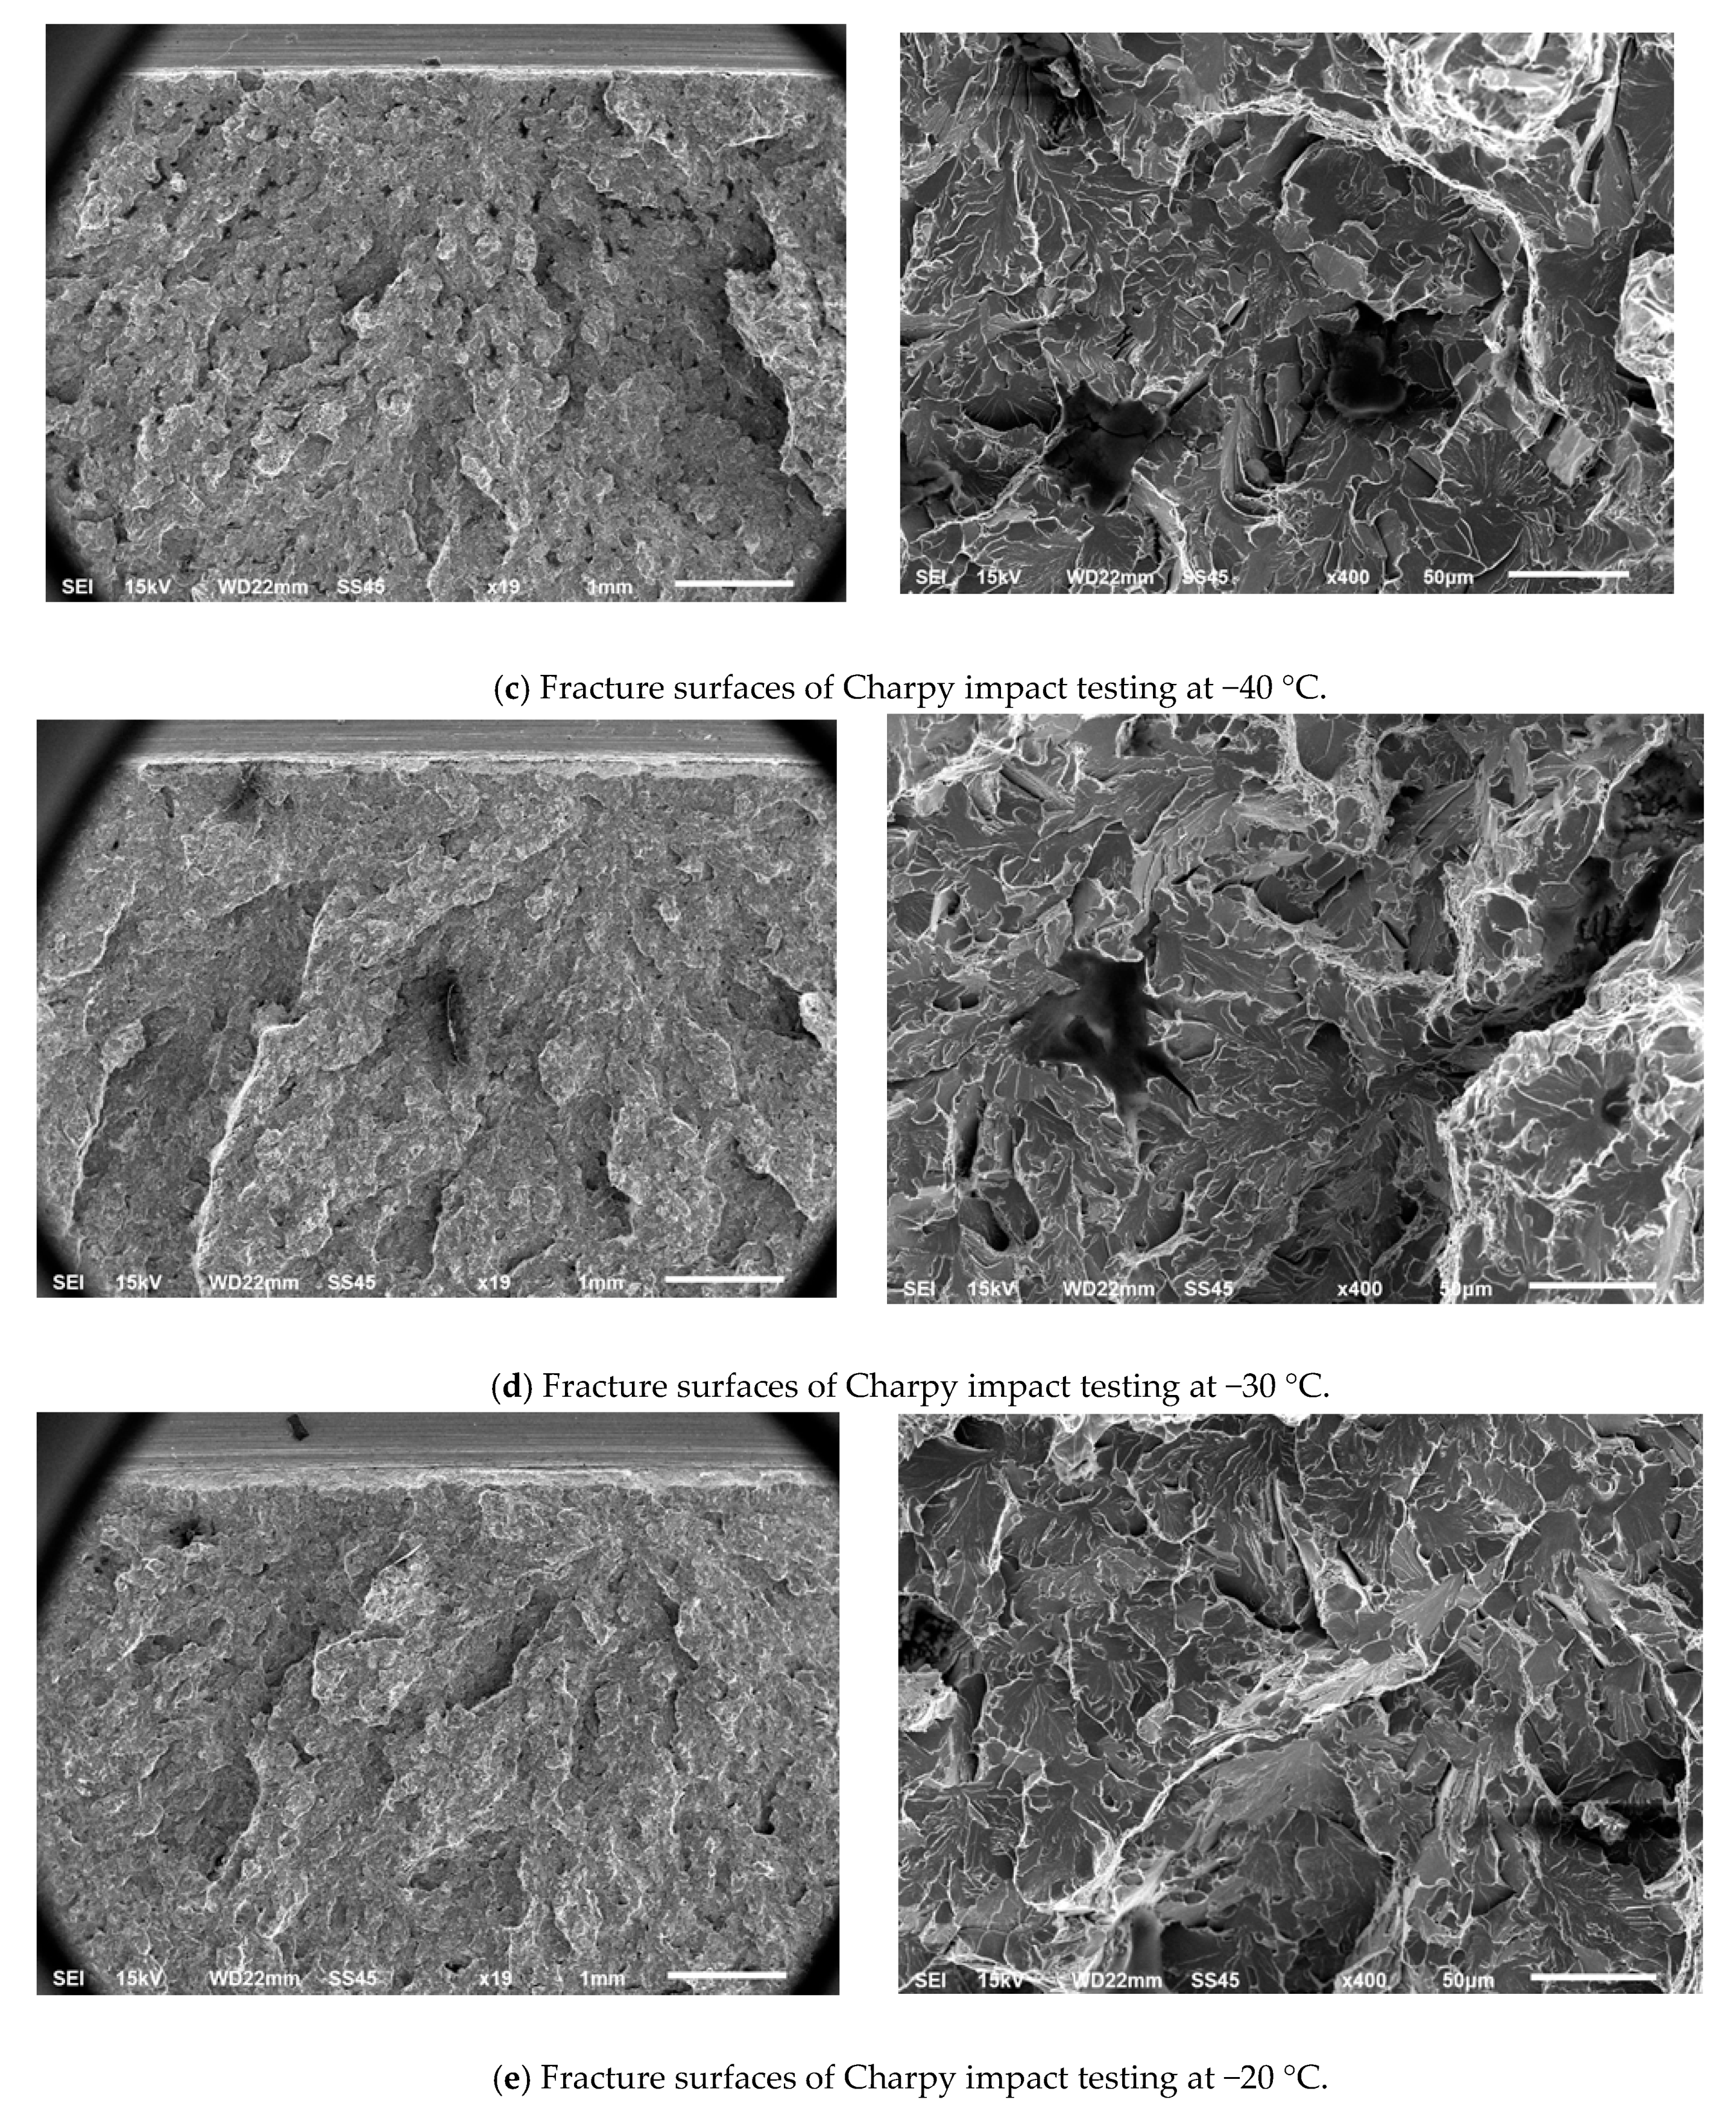
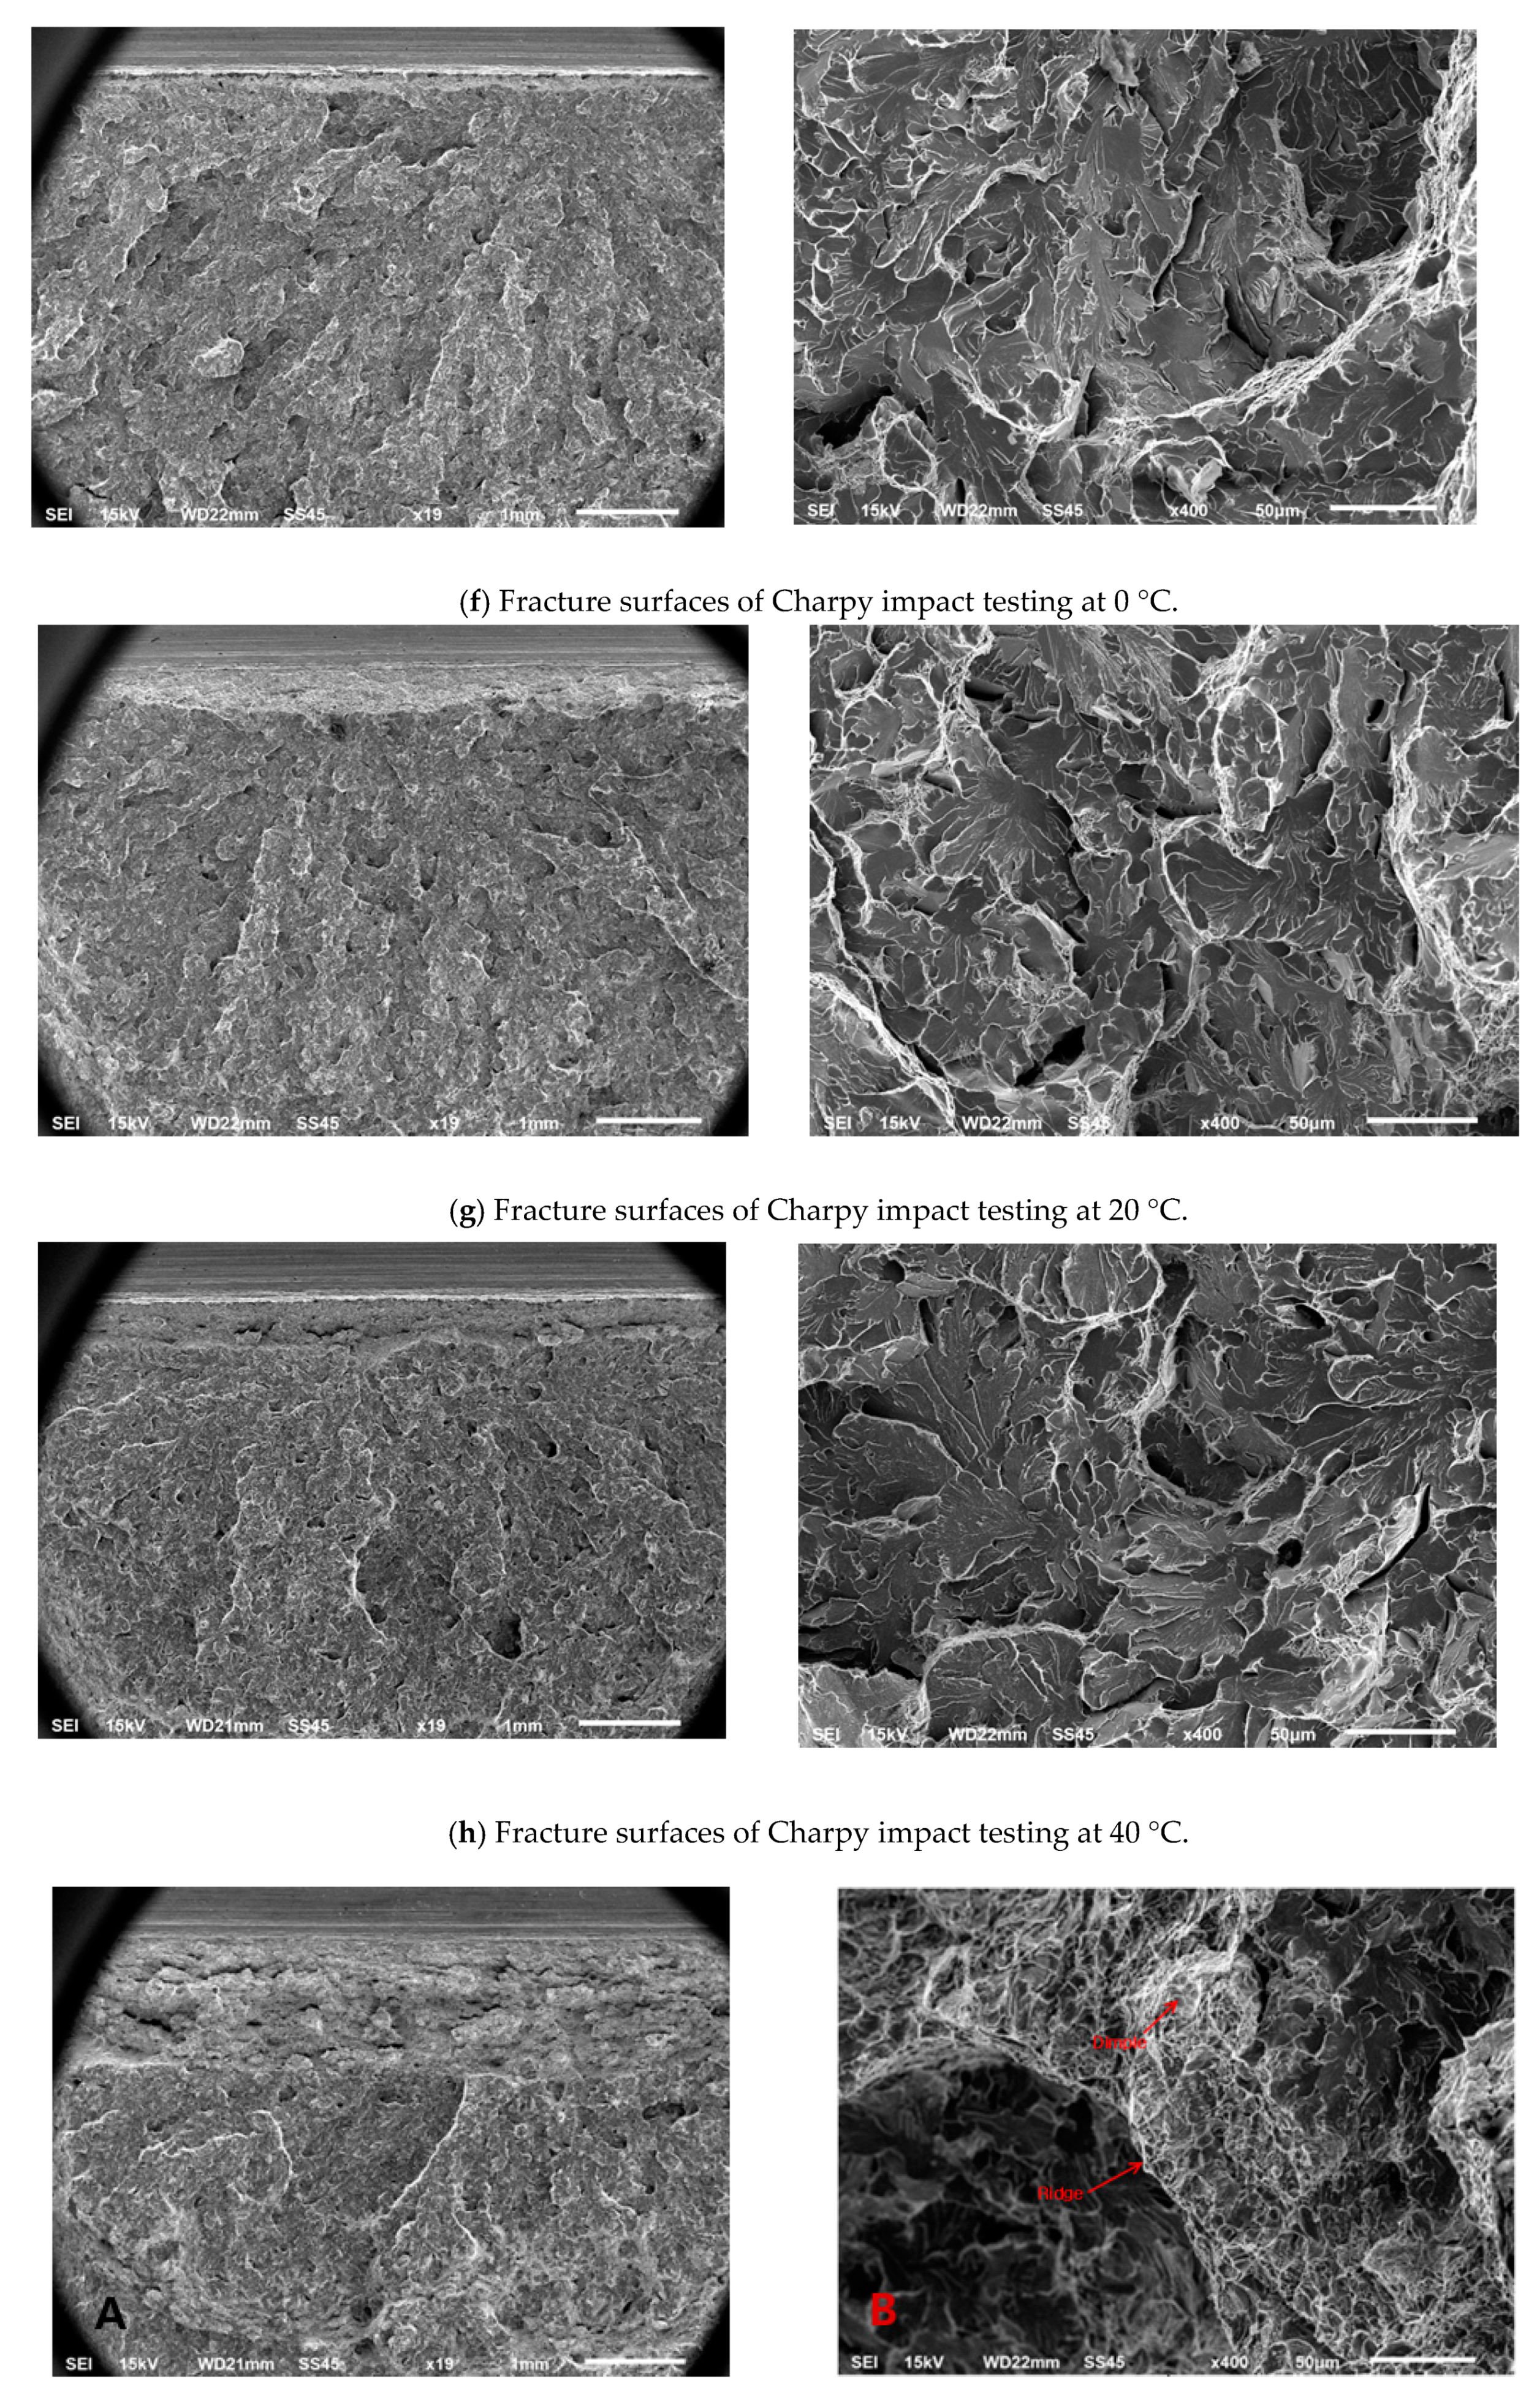
Figure 5 shows a drawing and photograph of the Charpy impact test specimen. The specimens were produced according to ASTM A370 from a commercial railway vehicle axle. The surface was polished by lapping. The longitudinal direction of the specimen coincided with that of the axle. The specimen size was 10 × 10 × 55 and a V-shaped notch was machined in its center. The Charpy impact test is performed by hitting the opposite side of the impact specimen fixed at both ends with a free-falling hammer. The test evaluates the impact resistance of a specimen by measuring the energy consumed when the impact specimen breaks. Under actual conditions, gravel or ice rubble on the tracks may be lifted by the wind generated by the vehicle and hit the axle, impacting the surface of the axle and creating surface defects. Impact resistance is proportional to the ability to resist crack propagation. Therefore, impact resistance is one of the key material specifications that ensure axle durability.

3. Results and Discussion

3.1. Fatigue Test

Figure 6a presents an S–N diagram showing the fatigue test data at a room temperature of about 20 °C. The logarithm of the number of cycles to failure is on the X-axis, and stress amplitude is on the Y-axis. When 200 MPa stress amplitude was applied to the center of the specimen, fatigue failure did not occur until 109 cycles, which means that the axle material had typical carbon steel properties with a fatigue limit. However, the fatigue limit was not 2 × 10⁶ cycles. Some specimens fractured in the 2 × 10⁶ to 1 × 10⁷ cycle range. The fracture surfaces in Figure 6b,c show the fracture surfaces at 213,000 and 1.02 × 10⁶ cycles, respectively. A crack occurred on the surface, gradually grew elliptically, and then reached an unstable state at a certain crack size. The specimen was finally broken. Some inclusions were found on the fracture surface. According to [1], inclusions found in axles are typically aluminates, sulfides, silicates, oxides, etc. The specification [4] specifies the acceptable size and quantity of inclusions.
Figure 7a presents an S–N diagram at −30 °C. Fatigue failure in four specimens occurred in the 2 × 10⁶ to 1 × 10⁷ cycle range, beyond the 2 million cycles traditionally regarded as the infinite life of steel. Figure 7b–e shows the fracture surfaces; cracks formed on the surface as in the room temperature case and gradually progressed. Once they reached a certain size, they entered an unstable growth mode. Some black voids or inclusions were observed on the fracture surface. Figure 8a presents an S–N diagram at −60 °C. Similar to at −30 °C, fatigue failure in five specimens occurred in the 2 × 10⁶ to 1 × 10⁷ cycle range, beyond the 2 million cycles. Figure 8b,c shows the fracture surfaces; cracks formed on the surface as in the room temperature case and gradually progressed. Once they reached a certain size, they entered an unstable growth mode. Some black voids or inclusions were observed on the fracture surface. Further, it was observed that long, white ridges were decreased in the stable crack propagation region. Figure 9 compares fatigue test data for 20, −30, and −60 °C. It can be seen that the fatigue strength increases with decreasing temperature.
In general, for metals, the lower the temperature, the higher the hardness, the tensile, and yield strengths. Fatigue strength is proportional to hardness and tensile strength. When the amplitude of the acting stress is Sa and the number of cycles to failure under a given stress amplitude ∆S is N, the straight section of the Sa–N diagrams at each temperature can be expressed as Equations (1)–(3). R is the coefficient of determination. The fatigue strengths at 2 million cycles for +20, −30, and −60 °C were 210.1, 225.2, and 251.9 MPa, respectively. Fatigue strength at −30 and −60 °C increased by 7.1 and 19.9%, respectively, compared to the fatigue strength at room temperature. Statistical analysis of the S–N curves was performed using the Excel program. The results are summarized in Table 3.
+20 °C: Sa = −25.786 log(N) + 372.57, R2 = 0.895
−30 °C: Sa = −28.946 log(N) + 407.61, R2 = 0.931
−60 °C: Sa = −34.207 log(N) + 467.43, R2 = 0.888

3.2. Charpy Impact Test

Charpy impact testing was carried out in the temperature range of −60 to +60 °C, and the average value for the three specimens was taken at each temperature. Table 4 shows the brittle fracture appearance, lateral expansion, and impact absorption energy. The brittle fracture appearance is the ratio of the ductile area to the full fracture surface, which is inversely proportional to the impact absorption energy. Figure 10 shows the change in the shock absorption energy with temperature. At temperatures below −30 °C, full brittle fracture occurred. The three specimens exhibited nearly constant shock absorption energy. However, at temperatures above −20 °C, along the edge of the fracture surface, ductile failure was observed. The shock absorption energies of the three specimens had slightly different values. Lateral expansion refers to the increase in the width of the specimen cross section measured in the groove direction after the test, which tends to be proportional to the impact absorption energy. According to the test results, the axle material became completely brittle in the range of −30 to −40 °C, and the shock-absorbing energy became very small, converging to a constant value. The minimum absorbed energy required by the KS standard [5] is 31 J. The European EN standard [4] requires 30 J at 20 °C. The test results satisfied the two standards. Figure 11 shows fracture surfaces after the impact test. At cross sections below −40 °C, there were no ductile deformations (the slightly black areas near the edges). As the temperatures rose from -30 °C, the areas of ductile deformation near the edges of the specimens increased. Further, the deformation of the opposite edge of the groove increased. It was inferred from the low-temperature impact test data that the current axle material is vulnerable to external impacts at temperatures below −30 °C, which means that a defect can be easily caused by an external impact. Notably, the carbon steel axle used in this study did not contain alloying elements, such as Cr, Cu, Mo, Ni, and V, included in the axle component of the EN standard [4]. It would be effective to add alloying elements to improve resistance to impact at low temperature. Figure 12 shows close-up images of the marked sites A and B in Figure 11a. Slides, cracks, and voids were observed, as shown in Figure 12a. When the temperature was increased to 60 °C, ridges and dimples were observed, as shown in Figure 12i.

4. Conclusions

In this study, specimens were produced from a commercial train axle made of manganese steel and subjected to high-cycle fatigue tests and Charpy impact tests over the temperature range of −60 to 60 °C to obtain fatigue strength and impact absorption energy data about the axle material. Some important results were as follows.
A 20 kHz ultrasonic actuator fatigue tester was successfully developed. It is capable of fatigue tests down to −160 °C by spraying liquid nitrogen into the chamber.
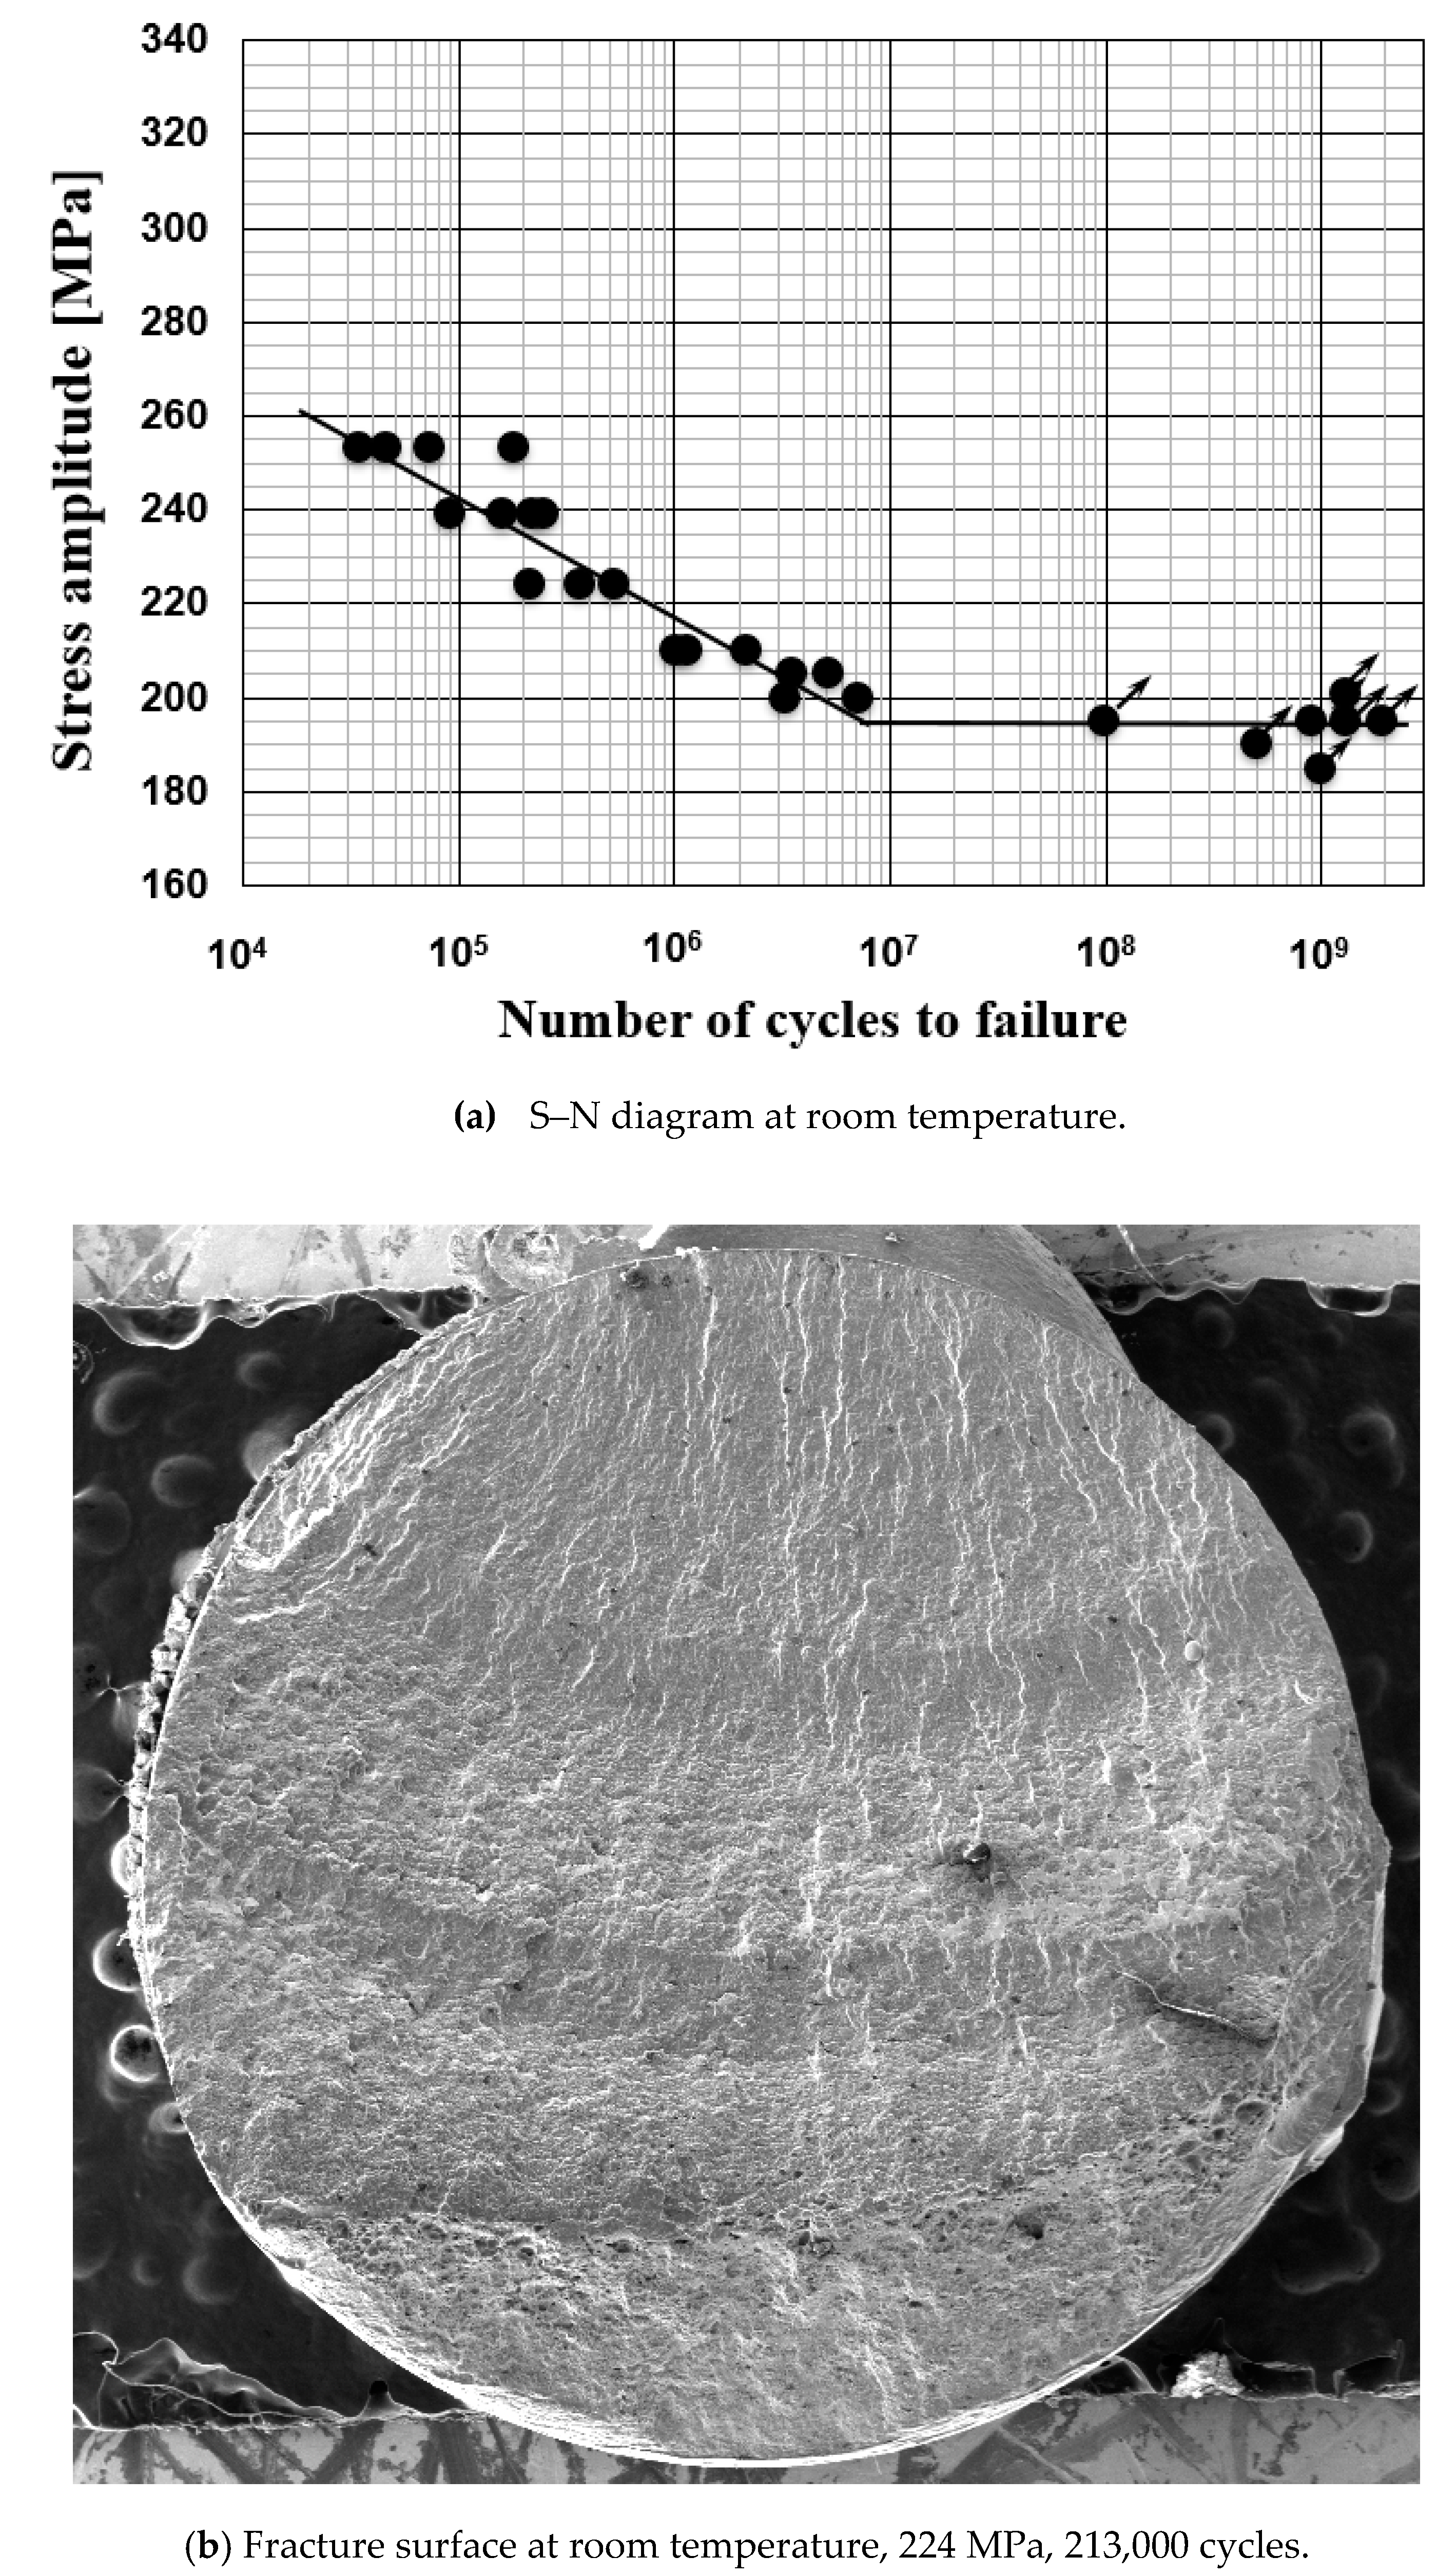
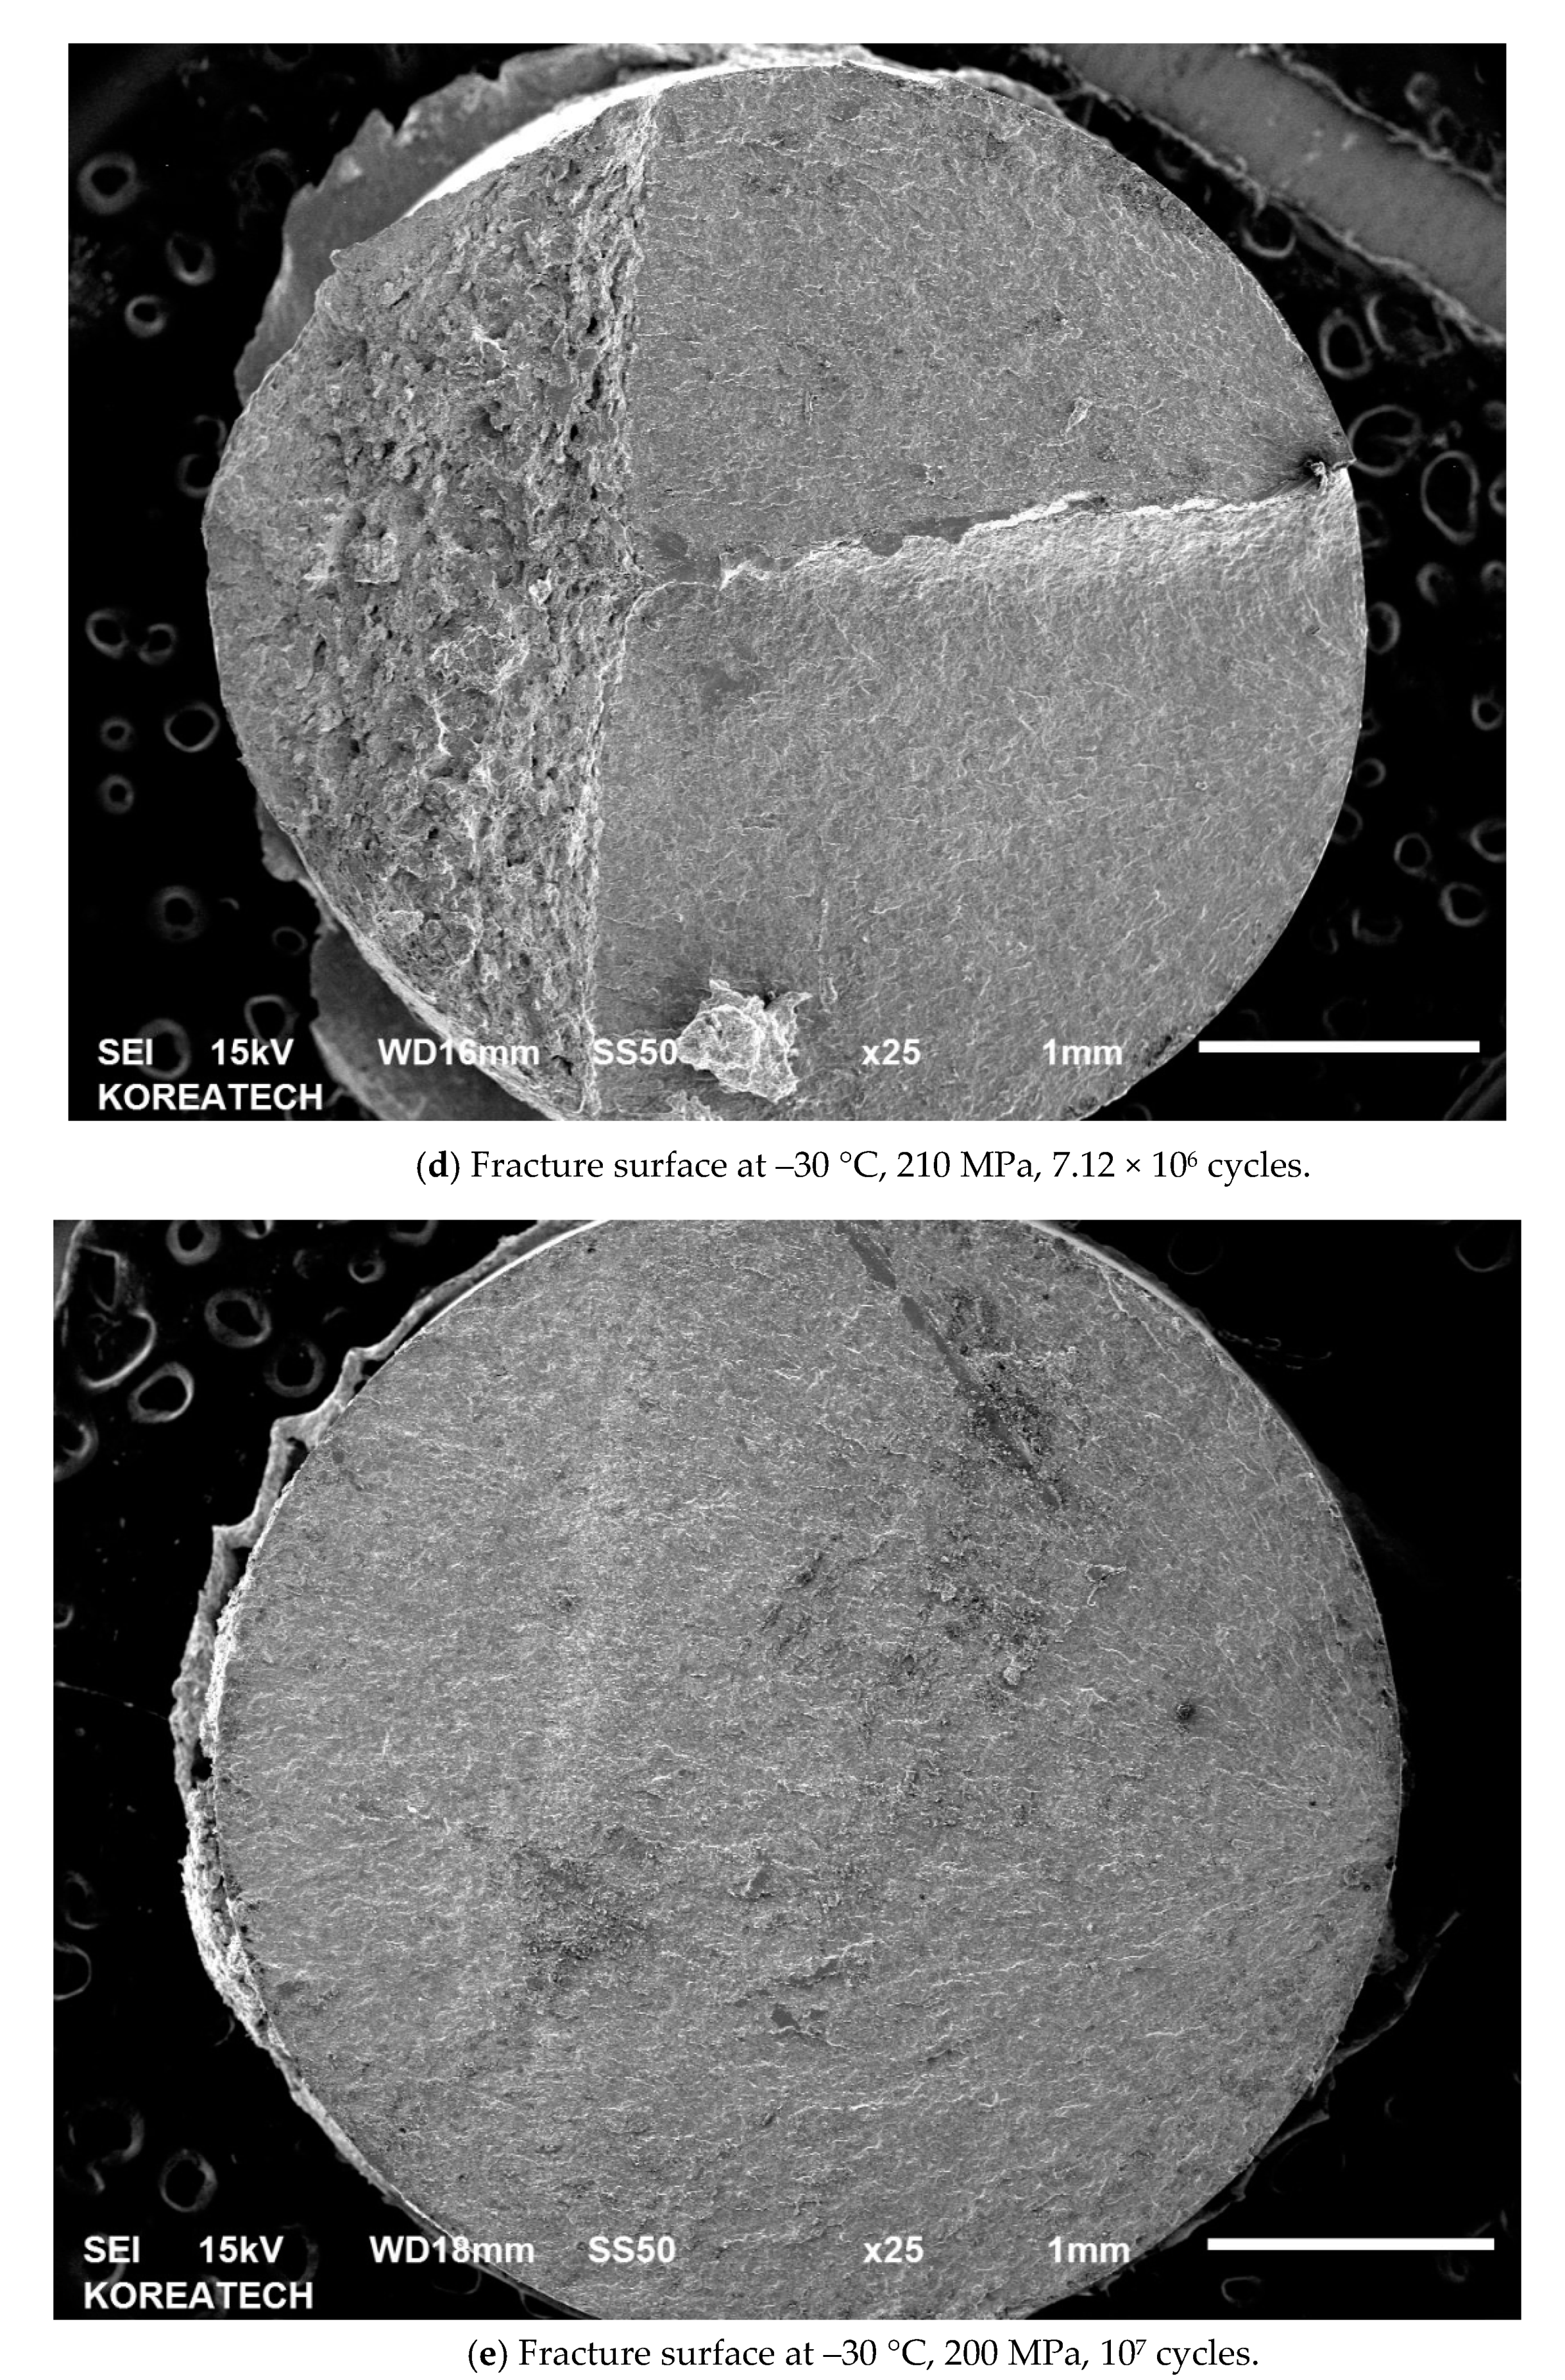
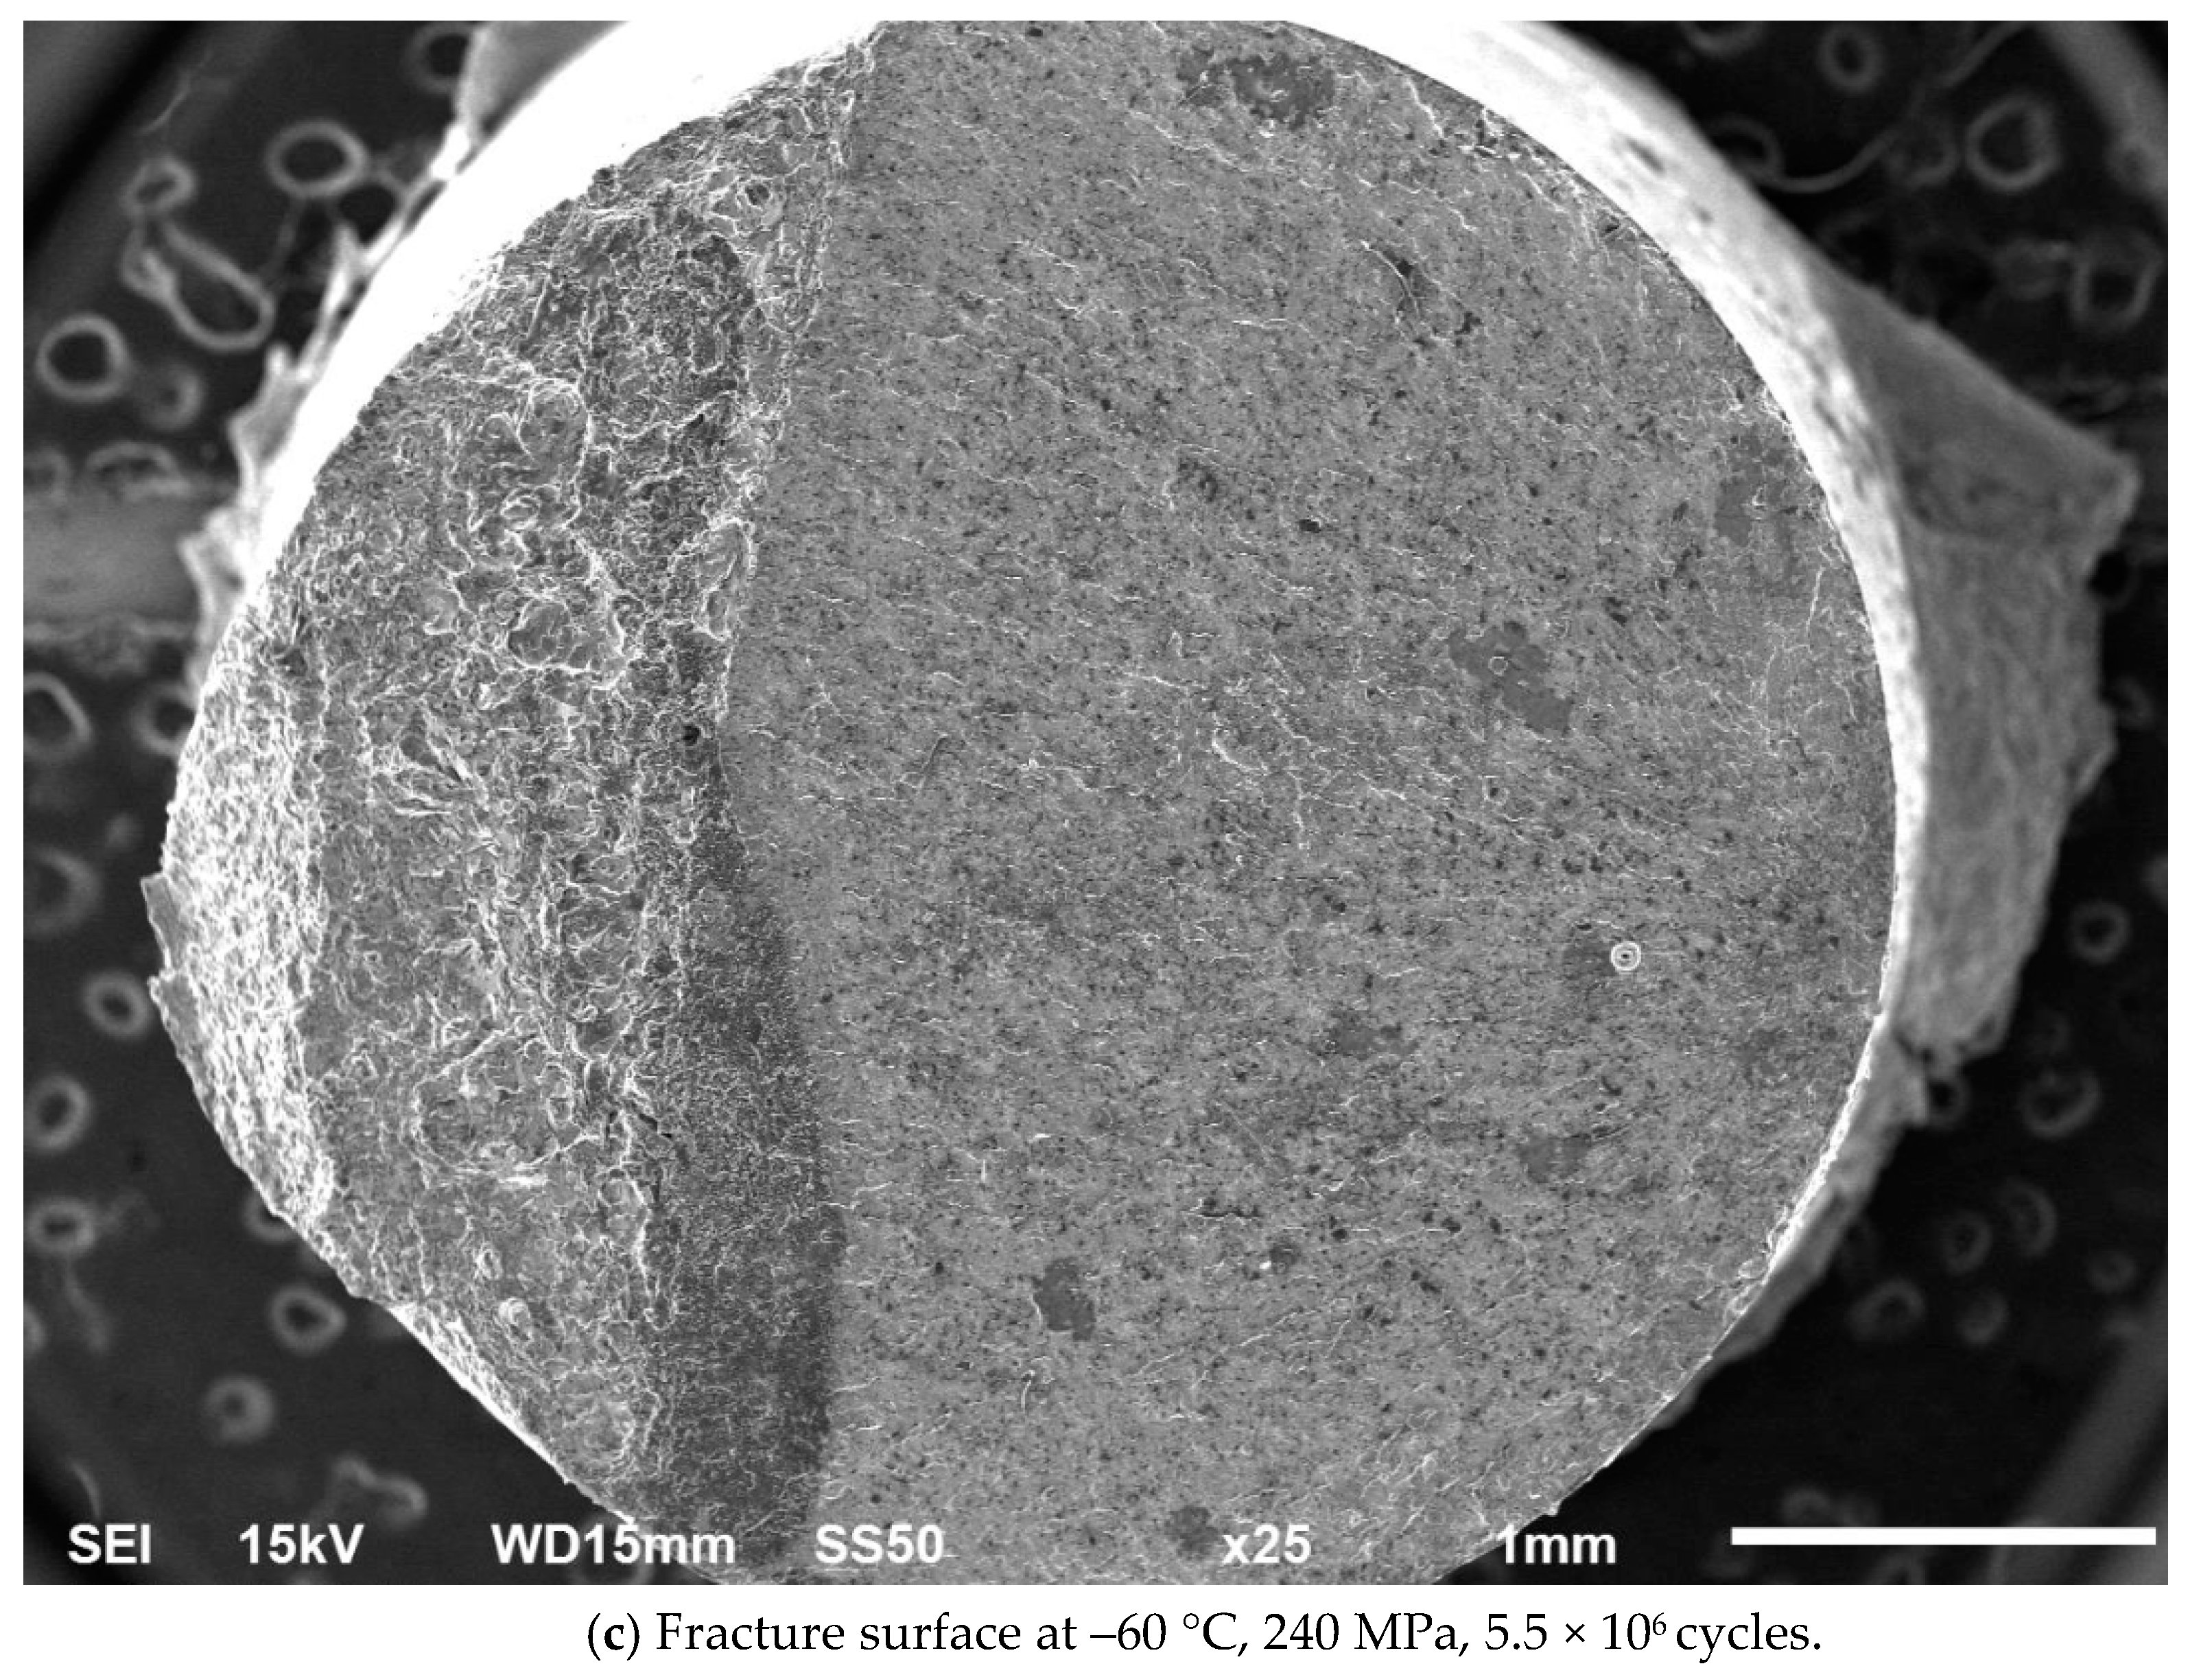
The fatigue strength values of the axle material at 2 million cycles at +20, −30, and, −60 °C were 210.1, 225.2, and 251.9 MPa, respectively.
The fatigue strength of the axle material at −30 and −60 °C increased by 7.1 and 19.9%, respectively, compared to the fatigue strength at room temperature.
Fatigue failure occurred in the 2 × 10⁶ to 1 × 10⁷ cycle range, above the 2 million cycles traditionally considered to be the carbon steel fatigue limit.
The shock-absorbing energy of the axle material decreased gradually with decreasing temperature, and the axle material became fully brittle in the range of −30 to −40 °C. The shock absorption energy at −60 °C was 81% lower than that at 20 °C. We inferred from the impact test results that the current axle material is vulnerable to external shocks at temperatures below −30 °C. These results suggest that it will be necessary to improve the low-temperature properties of the axle material used in this study for use in cold climates.

Author Contributions

Conceptualization and Methodology; Funding Acquisition, H.-S.M.; Analysis, Investigation, Data Curation, Writing—Original Draft and Editing, B.-C.G.; Ultrasonic Fatigue Testing, I.-S.C. All authors have read and agreed to the published version of the manuscript.

Funding

This study was supported by an R&D program of Korea Railroad Research Institute.

Conflicts of Interest

The authors declare no conflict of interest.

References

  1. Luo, R.; Teng, W.; Wu, X.; Shi, H.; Zeng, J. Dynamics simulation of a high-speed railway car operating in low-temperature environments with stochastic parameters. Veh. Syst. Dyn. 2019. [Google Scholar] [CrossRef]
  2. Luo, R.; Shi, H.; Guo, J.; Huang, L.; Wang, J. A nonlinear rubber spring model for the dynamics simulation of a high-speed train. Veh. Syst. Dyn. 2019. [Google Scholar] [CrossRef]
  3. Zerbst, U.; Beretta, S.; Köhler, G.; Lawton, A.; Vormwald, M.; Beier, H.T.; Klinger, C.; Černy, I.; Rudlin, J.; Heckel, T.; et al. Safe life and damage tolerance aspects of railway axles—A review. Eng. Fract. Mech. 2013, 98, 214–271. [Google Scholar] [CrossRef]
  4. BS EN 13261:2009+A1:2010. Railway Applications-Wheelsets and Bogies-Axles-Product Requirements. BSI: London, UK.
  5. Korean Industrial Standards. Wheels for Railway Rolling Stock, KS R 9221; Korean Agency for Technology and Standards: Eumseonggun, Korea, 2008. [Google Scholar]
  6. Ultrasonic Fatigue Testing. Mechanical Testing and Evaluation, ASM Handbook; ASM International: Novelty, OH, USA, 2000; Volume 8, pp. 717–728. [Google Scholar]
  7. Bathias, C.; Paris, P.C. Gigacycle Fatigue in Mechanical Practice; Marcel Dekker: New York, NY, USA, 2005; pp. 9–29. [Google Scholar]
  8. Stanzl-Tschegg, S. Very high cycle fatigue measuring techniques. Int. J. Fatigue 2014, 60, 2–17. [Google Scholar] [CrossRef]
  9. Stanzl-Tschegg, S.E.; Mayer, H.R.; Tschegg, E.K. High frequency method for torsion fatigue testing. Ultrasonics 1993, 31, 275–280. [Google Scholar] [CrossRef]
  10. Bathias, C. Piezoelectric fatigue testing machines and devices. Int. J. Fatigue 2006, 28, 1438–1445. [Google Scholar] [CrossRef]
  11. Nikitin, A.; Bathias, C.; Palin-Luc, T. A new piezoelectric fatigue testing machine in pure torsion for ultrasonic gigacycle fatigue tests: Application to forged and extruded titanium alloys, Fatigue and Fracture of Engineering Materials & Structures. Fatigue Fract. Eng. Mater. Struct. 2015, 38, 1294–1304. [Google Scholar]
  12. Vieira, M.; Reis, L.; Freitas, M.; Ribeiro, A. Strain measurements on specimens subjected to biaxial ultrasonic fatigue testing. Theor. Appl. Fract. Mech. 2016, 85, 2–8. [Google Scholar] [CrossRef]
  13. Costa, P.; Vieira, M.; Reis, L.; Ribeiro, A.; Freitas, M. New specimen and horn design for combined tension and torsion ultrasonic fatigue testing in the very high cycle fatigue regime. Int. J. Fatigue 2017, 103, 248–257. [Google Scholar] [CrossRef]
  14. Wang, Q.Y.; Berard, J.Y.; Rathery, S.; Bathias, C. High-cycle fatigue crack initiation and propagation behaviour of high-strength spring steel wires. Fatigue Fract. Eng. Mater. Struct. 1999, 22, 673–677. [Google Scholar] [CrossRef]
  15. Wang, Q.Y.; Bathias, C.; Kawagoishi, N.; Chen, Q. Effect of inclusion on subsurface crack initiation and gigacycle fatigue strength. Int. J. Fatigue 2002, 24, 1269–1274. [Google Scholar] [CrossRef]
  16. Ochi, Y.; Matsumura, T.; Masaki, K.; Yoshida, S. High-cycle rotating bending fatigue property in very long-life regime of high-strength steels. Fatigue Fract. Eng. Mater. Struct. 2002, 25, 823–830. [Google Scholar] [CrossRef]
  17. Murakami, Y.; Endo, M. Effects of defects, inclusions and inhomogeneities on fatigue strength. Int. J. Fatigue 1994, 16, 163–182. [Google Scholar] [CrossRef]
  18. Murakami, Y.; Takada, M.; Toriyama, T. Super-long life tension-compression fatigue properties of quenched and tempered 0.46% carbon steel. Int. J. Fatigue 1998, 16, 661–667. [Google Scholar] [CrossRef]
  19. Zettl, B.; Mayer, H.; Ede, C.; Stanzl-Tschegg, S. Very high cycle fatigue of normalized carbon steels. Int. J. Fatigue 2006, 28, 1583–1589. [Google Scholar] [CrossRef]
  20. Zhao, Y.X.; Yang, B.; Feng, M.F.; Wang, H. Probabilistic fatigue S–N curves including the super-long life regime of a railway axle steel. Int. J. Fatigue 2009, 31, 1550–1558. [Google Scholar] [CrossRef]
  21. Qian, G.; Zhou, C.; Hong, Y. Crack propagation mechanism and life prediction for very-high cycle fatigue of a structural steel in different environmental medias. Frat. Integrità Strutt. 2013, 25, 7–14. [Google Scholar] [CrossRef] [Green Version]
  22. Wu, W.; Zhu, M.L.; Liu, X.; Xuan, F.G. Effect of temperature on high-cycle fatigue and very high cycle fatigue behaviour of a low-strength Cr–Ni–Mo–V steel welded joint. Fatigue Fract. Eng. Mater. Struct. 2017, 40, 45–54. [Google Scholar] [CrossRef] [Green Version]
Figure 1. Tensile stress–strain curves.
Applsci 10 05042 g001
Figure 2. Microstructures of the axle material.
Applsci 10 05042 g002
Figure 3. Modal analysis of the specimen and horn using the finite element method.
Applsci 10 05042 g003
Figure 4. Ultrasonic resonant fatigue test equipment.
Applsci 10 05042 g004
Figure 5. Geometry and photograph of the Charpy impact specimen.
Applsci 10 05042 g005
Figure 6. S–N diagram and fracture surface at room temperature.
Applsci 10 05042 g006aApplsci 10 05042 g006b
Figure 7. S–N diagram and fracture surface at −30 °C.
Applsci 10 05042 g007aApplsci 10 05042 g007bApplsci 10 05042 g007c
Figure 8. S–N diagram and fracture surface at −60 °C, 240 MPa, Nf = 5.5 × 10⁶ cycles.
Applsci 10 05042 g008aApplsci 10 05042 g008b
Figure 9. S–N diagram at room temperature (RT, 20°C), −30 °C, and −60 °C.
Applsci 10 05042 g009
Figure 10. Charpy impact absorption energy.
Applsci 10 05042 g010
Figure 11. Images of the fracture surfaces taken with an optical microscope.
Applsci 10 05042 g011
Figure 12. Images of fracture surfaces taken with a scanning electronic microscope.
Applsci 10 05042 g012aApplsci 10 05042 g012bApplsci 10 05042 g012cApplsci 10 05042 g012d
Table 1. Composition of the axle material (wt %) [5].
CSiMnPSOHFe
0.35–0.480.15–0.400.40–0.85<0.035<0.040<40 ppm2.5 ppmBalance
Table 2. Material properties used for the finite element simulation.
PartMaterial Density (kg/m3)Young’s Modulus (GPa)Poisson’s Ratio
SpecimenTrain axle7833211.510.283
HornTitanium alloy43001100.36
Table 3. Statistical analysis of the S–N curves.
Coefficient of DeterminationStandard DeviationStandard Error of the Mean
+20 °C0.89527.956.58
−30 °C0.93120.035.78
−60 °C0.88836.1910.44
Table 4. Charpy impact test results.
Temperature (°C)−60−50−40−30−200204060
Brittle fracture appearance (%)100100100909080704050
Lateral expansion (mm)0.050.030.060.170.220.340.670.871.24
Impact absorption energy (J)6.426.587.0011.3212.9823.4034.5946.8768.19

