Article

Analytical Non-Stationary Satellite to Aircraft Channel Modeling over Open Area Based on Regular Shaped Geometry-Based Stochastic Model

1
School of Information and Communication Engineering, Beijing University of Posts and Telecommunications, Beijing 100876, China
2
Beijing Institute of Space Long March Vehicle, Beijing 100076, China
*
Author to whom correspondence should be addressed.
Appl. Sci. 2020, 10(15), 5041; https://doi.org/10.3390/app10155041
Submission received: 12 June 2020 / Revised: 15 July 2020 / Accepted: 19 July 2020 / Published: 22 July 2020
(This article belongs to the Section Electrical, Electronics and Communications Engineering)

Abstract

:
Channel modeling is crucial to the development and evaluation of modern wireless communication systems including satellite communication system, since there might be critical safty-of-life applications. Also, the channel model is of great importance to the performance evaluation of mobile communication systems. In recent years, encouraged by the widely application of unmanned aerial vehicles, the research on channel modeling for aerial and aeronautical communications attract lots of interests. In the published articles, stationary and non-stationary channel models have been developed for air-to-ground communications based on regular shaped geometry-based stochastic model (RS-GBSM). The modeling of air-to-air or satellite-to-aircraft (S2A) communication is still quite simple or completely lacking. For obtaining more precise model of S2A channel, this paper presents an analytical non-stationary S2A channel mode based on RS-GBSM with considerations on line-of-sight path, specular reflection path, and ground scattering path. Analytical expressions of the channel impulse responses, the transfer functions, the auto-correlation functions, and the Doppler power spectrum density based on 3-path model are derived and simulated. Also, the distributions of the path antennation, the path delay, and the normalized Doppler shift based on uniform distribution of the scatterers are derived, simulated and fitted.

1. Introduction

The accuracy of performance evaluation on satellite-to-aircraft (S2A) communication is important since there might be critical safety-of-life applications. Moreover, the accuracy of system performance evaluation is to some extend determined by precise modeling of the channel. Existing techniques for modeling of the S2A channel are not sufficiently precise [1], although some literatures such as [1,2,3,4] have proposed methodologies on S2A channel modeling or have presented measurements to improve the channel models. Fortunately, there are some preliminary studies on the channel modeling of air-to-ground (A2G) communications, air-to-air (A2A) communications, and vehicle-to-vehicle (V2V) communications that are worth learning. For example, the methods of developing regular shaped geometry-based stochastic models (RS-GBSMs) were presented in [5,6,7], and non-stationary characteristics of mobile channels were discussed in [8]. With the methods of developing non-stationary RS-GBSM and introducing the ground scattering that must be considered in S2A channel modeling, we are able to develop and present an analytical non-stationary RS-GBSM based S2A model in this paper.

1.1. Related Work

In 1973, methodologies for modeling the S2A channel for stationary and quasi-stationary scenarios were presented in [2]. As of the writing of this paper, non-stationary characteristics of S2A channel have not been discussed although the channel can be described more precisely with the considerations on non-stationary features. As surveyed in [9,10], A2G channel models have been presented especially for low-altitude platform. Time-variant measurements of A2G channel were reported in [11]. A non-stationary A2G GBSM for airplane to ground station at regional airport was presented in [6]. A non-stationary GBSM for unmanned aerial vehicle (UAV) to ground vehicle communication was developed in [12]. Non-stationary characteristics have also been widely discussed in V2V channel modeling [13,14] as well as for A2A communications [15,16,17]. On the modeling of the geometrical structure of the scatterers and the deriving of distributions of the channel coefficients, in [7], as a kind of RS-GBSM, three-dimensional (3D) ellipsoidal model was proposed for A2G communication, and the distributions of the received power and Doppler shift were derived. The 3D ellipsoidal model for A2A communication was expanded in [15], and the distributions of the azimuth and elevation angels of arrival (AOAs) based on based on uniform distribution (UD) of the scatterers was simulated. The ground scattering and the Doppler effect were modeled and simulated in details by [6,16,18]. And a simpler closed form expression of Doppler shift was obtained in [6] through utilizing the prolate spheroidal coordinate system. Further developments can be found in [19,20,21]. The distributions of path attenuation and path delay based on the distribution of the scatterers have not been analyzed, although the distribution of path power have been mentioned [15]. In [1], a multi-path channel model including the line-of-sight (LOS) and two reflected paths based on the measurements with the satellite as the emitter and the aircraft as the receiver was presented. This work enhanced the S2A channel model with considerations on the effects of the body of the aircrafts. These above-mentioned articles provided worthy ideals for us on developing non-stationary RS-GBSM based S2A channel model.

1.2. Motivation and Contributions of This Paper

The motivation of this paper is to develop an analytical non-stationary RS-GBSM based channel model for S2A communication over an open area, with considerations of both large scale attenuation and small scale fading. The contributions are as follows.
  • The time variant geometrical structure of the S2A system including a ellipsoidal ground scattering region is presented with regional UD of the ground scatterers.
  • An analytical non-stationary channel model is developed, including three paths, i.e., the LOS path, the ground specular reflection path, and the ground scattering path. Non-stationary and stationary analytical expressions of channel impulse responses (CIRs), transfer functions (TFs), auto-correlation functions (ACFs), and power spectrum density (PSD) are derived.
  • The non-stationary characteristics of the channel is observed through the simulation of CIRs, TFs, ACFs, PSD, and etc.
  • Based on the UD assumption of the scatterers, distributions of the path attenuation, the time delay, and the Doppler shift of the scattering path are derived, simulated, and fitted.
The rest of this paper is organized as follows. In Section 2, we present the geometrical structure and the assumptions. In Section 3, we develop the non-stationary S2A channel model, formulate the analytical expressions of the CIRs, the TFs, and the ACFs. In Section 4, we deduce the cumulative distribution functions (CDFs) and probability density function (PDFs) of the path delay, the path attenuation, and the Doppler shift based on UD of the scatterers. In Section 5, we present the simulation results, analyze them, and present the fitting functions of the CDFs of the path attenuation and Doppler shift. Finally, in Section 6, we provide the conclusions.
Notation: boldface uppercase letters stand for matrices while boldface lowercase letters represent vectors. The superscript · T denotes the transpose operator. The superscript · * denotes the conjugate operator. x is the norm of a vector x . E { · } denotes expectation operation. exp · denotes the natural exponential function. δ · is the unit impulse function. P ( X ) is the probability of event X happening. F ( · ) is the CDF. f ( · ) is the PDF. h · is the CIR. H · is the TF. R · is the ACF.

2. The Geometrical Structure

The presented structure is as shown in Figure 1, with Figure 1a presenting the system structure with spherical earth surface, and Figure 1b illustrating the paths and scattering area. Major parameters used in Figure 1 and further formulations are also listed in Table 1.
In Figure 1, T is the satellite transmitter, R is the aircraft receiver. The altitudes of R and T are h R ’ and h T ’ respectively. O’ is the center of the earth, and O is the ground specular reflection point. In this paper, O is determined with C.Wagner algorithm [22], and is set as the origin of the Cartesian coordinates. θ = 1 2 R O T is the reflection angle.
The YOZ plane is determined with R , O , and T , and the Z axis is set alone O O . Y axis is set to be perpendicular to Z axis and directing to T . h T and h R are the heights and also the Z axis coordinates of T and R . Φ = γ 1 + γ 2 = R O T . According to the concerned literatures, such as [2,23], the earth surface should be modeled as the spherical surface. Since the atmospheric refraction should be considered, effective earth radius r e is adopted, as shown in Figure 1. In this paper, the longitudes, latitudes, and altitudes of the satellite and the aircraft are assumed to be known. And the satellite is assumed to be a Geosynchronous Earth Orbit (GSO) satellite. Similar to [2], the effects of tropospheric are not considered in this paper since ground scattering is what we focus on and the effects of tropospheric is quite stable in the scenario we discuss according to [24].
In Figure 1, since the transmitter and the receiver might moving during communication, the distances and the AOAs are time variant. Thus, in most of the situations the channel is non-stationary. According to the common method of developing aeronautical channel models, such as presented in [2], three paths, including the LOS path, the reflection path, and the diffuse scattering path, are considered in this paper. Based on Figure 1, the lengths of the LOS path and the specular reflection path can be calculated by Equations (1) and (2).
d LOS t = h R t + r e 2 + h T t + r e 2 2 h R t + r e h T t + r e cos ϕ t
d SPE t = d TO t + d OR t = h R t + r e 2 + r e 2 2 h R t + r e r e cos γ 1 t + h T t + r e 2 + r e 2 2 h T t + r e r e cos γ 2 t
As shown in Figure 1, in this paper, for simplifying the modeling, we assume that the scattering happens on a horizontal surface intersects with the earth surface at the specular reflection point O, thus the coordinates of the transmitter, the receiver, the scatterer are known as T x T t , y T t , z T t , R x R t , y R t , z R t , and D x D , y D , 0 , respectively, where x T t = x R t = 0 , z T t = h T t , and z R t = h R t . Since the scattering path contains sub-paths, when we discuss the sub-paths, the coordinate of the lth scatterer is denoted as x D , l t , y D , l t , 0 , thus the length of the scattering sub-path can be calculated as Equation (3).
d DIF , l t = d DR , l t + d TD , l t = x T t x D , l t 2 + y T t y D , l t 2 + z T 2 t + x R t x D , l t 2 + y R t y D , l t 2 + z R 2 t = x D , l 2 t + y T t y D , l t 2 + z T 2 t + x D , l 2 t + y R t y D , l t 2 + z R 2 t
In this paper, the scatterers are assumed to be distributed in an elliptical region determined by the maximum delay ellipsoid with T and R as its foci, and truncated by the XOY plane with the specular reflection point as the center, as shown in Figure 1. At the moment t, the range of the scattering area is constrained by Equation (4),where τ max is the maximum path delay compared to the LOS path, and c is the speed of light.
c τ max = d DIF t d LOS t = x D t x R t 2 + y D t y R t 2 + z R 2 t + x D t x T t 2 + y D t y T t 2 + z T 2 t d LOS t = x D 2 t + y D t y R t 2 + z R 2 t + x D 2 t + y D t y T t 2 + z T 2 t d LOS t
For simplification, we take this scattering region constrained by Equation (4) as an ellipse with half major axis length l l and half minor axis length l s , where l l and l s are calculated through resolving Equation (4) with conditions x D t = 0 and y D t = 0 , respectively, and as shown in Equations (6) and (7), where
ξ t = d LOS t + c τ max
l l t = ξ t ξ 2 t 2 y R 2 t + 4 y R t y T t 2 y T 2 t 1 · ξ 2 t + y R 2 t 2 y R t y T t + y T 2 t + z R 2 t 2 z R t z T t + z T 2 t 1 2 · ξ 2 t + y R 2 t 2 y R t y T t + y T 2 t + z R 2 t + 2 z R t z T t + z T 2 t 1 2
l s t = 1 ξ t ξ t + z R t z T t ξ t z R t + z T t · z R t ξ t + z T t ξ t + z R t + z T t 1 2
Thus the area of the scattering region is calculated as in Equation (8).
S t = π l s t l l t
It’s to be mentioned that, the error of calculating the region area through this approximation, i.e., taking the scattering region as an ellipse, is under 0.1% in the presented scenarios. Calculation examples can be seen in Appendix A.
We assume that the scatterers are obey regional UD, thus we have the joint PDF of the time variant X coordinate x D t , and the time variant Y coordinate y D t of the scatterer at the moment t, as in Equation (9).
f X D Y D x D , y D , t | z D = 0 = 1 S t

3. Analytical Non-Stationary S2A Channel Model

3.1. Channel Impulse Response

As mentioned above, three paths model is adopted in this paper, thus the CIR of the presented channel model can be given by Equation (10).
h t , τ = h LOS t , τ + h SPE t , τ + h DIF t , τ
where h LOS t , τ is the impulse response of the LOS path with t as the observed moment, and τ as the corresponding time delay, h SPE t , τ is the impulse response of the specular reflection path, and h DIF t , τ is the impulse response of the diffuse scattering path. Considering the large scale propagation attenuation, propagation delay and Doppler shift, the impulse response of the LOS path is denoted as Equation (11), where α LOS t = λ G T LOS t G R LOS t 4 π d LOS t is the path attenuation of the LOS path, with the assumption that the propagation loss attenuation factor equals to 2. λ is the wave length, and G T LOS t and G R LOS t are the antenna gains of the transmitter and the receiver at the moment t corresponding to concerned directions, τ LOS t = d LOS t c where d LOS t is the length of the LOS path as Equation (1) at the moment t.
h LOS t , τ = α LOS t g LOS t δ τ τ LOS t
g LOS t in Equation (11), is the term for phase shifts introduced by LOS transmitting and Doppler shift, and is calculated as in Equation (12), where k 0 = 2 π λ , v RT t = v R t v T t , where v T t = v T _ x t , v T _ y t , v T _ z t T is the velocity of the transmitter, and v R t = v R _ x t , v R _ y t , v R _ z t T is the velocity of the receiver. The unity directional vector of the LOS path from the transmitter towards the receiver is n RT t = n RT _ x t , n RT _ y t , n RT _ z t T .
g LOS t = exp j k 0 d LOS t + j 2 π λ 0 t n RT T t · v RT t d t
The impulse response of the specular reflection path is given by Equation (13), where τ SPE = d SPE t c . α SPE t and g SPE t can be calculated by Equations (14) and (15).
h SPE t , τ = Γ t · α SPE t · g SPE t · δ τ τ SPE t
α SPE t = λ G T SPE t G R SPE t 4 π d SPE t
g SPE t = exp j k 0 d SPE t + j 2 π λ 0 t n TO T t · v T t + n RO T t · v R t d t
In Equations (14) and (15), n TO and n RO are the unit directional vector towards O observed from T and R, respectively. And Γ t can be calculated as Fresnel Equations (16) and (17), with vertical and horizontal polarization, respectively, where ε r e t is the relative dielectric permittivity of the reflection surface, which is a random process since the reflector and the scatterers may be changed with the movements of the transmitter and the receiver, the reflecting and scattering areas are for example, the sea, earth surface, etc. [25,26,27].
Γ t = cos θ t ε r e t sin 2 θ t cos θ t + ε r e t sin 2 θ t
Γ t = ε r e t cos θ t ε r e t sin 2 θ t ε r e t cos θ t + ε r e t sin 2 θ t
In the simulation of this paper, ε r e t is calculated as in [27] with the assumption that the scattering surface is sea surface.
Suppose that the number of the scatterers is L, then the impulse response of the scattering path is as Equation (18).
h DIF t , τ = l = 1 L α DIF , l t g DIF , l t δ τ τ DIF , l t
When the radar cross section (RCS) σ is constant for each scatterer, the amplitude attenuation of the l th subpath α l t is calculated by Equation (19) in accord with [2,28]. In Equation (19), d TD , l t and d DR , l t are the distance between the transmitter and the scatterer, and the distance between the scatterer and the receiver, respectively.
α DIF , l t = λ G T , l DIF t G R , l DIF t 4 π d TD , l t d DR , l t σ
According to the radar equation and the theory presented in [2], when RCS is not constant in the diffuse scattering area, we can denote it as σ x , y . Thus α DIF , l t is calculated as in (20) with the assumption that the shape of each scatterer is a circle C l with radius R l .
α DIF , l t = λ 2 4 π d LOS t 2 · x , y C l σ x , y d TR 2 t 4 π d TD , l 2 t d DR , l 2 t G T x , y G R x , y d x d y = λ 8 π d TD , l t d DR , l t π x , y C l σ x , y G T x , y G R x , y d x d y
σ x , y can be calculated as Equations (21) and (22) if the diffuse surface is sea surface [29,30].
σ x , y = π k 2 Γ 2 d RD , l 2 h R 4 P x , y
P x , y = 1 2 π σ x σ y 1 b x y 2 · exp 1 2 1 b x y 2
where σ x and σ y are the root mean square of the slop of x and y, respectively, b x y is the correlation coefficient of x and y, and k is calculated as in Equation (23).
k = x 2 + y 2
Thus the term g DIF , l t in Equation (18), containing the phase and frequency shifts in the impulse response of the scattering components, can be denoted as Equation (24),
g DIF , l t = exp j φ l + j k 0 d DIF , l t + j 2 π λ 0 t n TD , l T t · v T t + n RD , l T t · v R t d t
where n TD , l = n TD , l _ x , n TD , l _ y , n TD , l _ z T and n RD , l = n RD , l _ x , n RD , l _ y , n RD , l _ z T are the unit directional vectors towards the lth diffuse scatterer D observed from T and R, separately. φ l U π , π is an additional random phase for the lth scattering subpath.

3.2. Time Variant Transfer Function

The time variant transfer function H t , f can be obtained by Fourier transform of impulse response h t , τ with respect to the variable τ , as shown in Equation (25). With H t , f , time variant random spectrum of the channel can be observed.
H t , f = H LOS t , f + H SPE t , f + H DIF t , f
The terms H LOS t , f , H SPE t , f , and H DIF t , f denote the time-variant transfer functions of the LOS component, specular reflection component, and scattering components, respectively. Thus Equations (26)–(28) can be obtained.
H LOS t , f = a LOS t · exp j 2 π f τ LOS t · exp j k 0 d LOS t · exp j 2 π λ 0 t n RT T t · v RT t d t
H SPE t , f = Γ t a SPE t · exp j 2 π f τ SPE t · exp j k 0 d SPE t · exp j 2 π λ 0 t n TO T t · v T t + n RO T t · v R t d t
H DIF t , f = l = 1 L α DIF , l t exp j 2 π f τ DIF , l t · exp j φ l t · exp j k 0 d DIF , l t · exp j 2 π λ 0 t n TD , l T t · v T t + n RD , l T t · v R t d t
Equations (26)–(28) can be used to derive time-frequency auto-correlation functions as in Section 3.3.

3.3. Time-Frequency ACFs

With the assumption that the LOS path, the specular reflection path, and the diffuse scattering paths are uncorrelated with each other, the ACFs can be derived through the time variant transfer functions. With time difference denoted as Δ t and frequency difference denoted as Δ f , the time-frequency correlation function can be expressed as Equation (29), where R LOS t , Δ t ; f , Δ f , R SPE t , Δ t ; f , Δ f and R DIF t , Δ t ; f , Δ f are the time-frequency ACFs of the LOS component, the specular reflection component, and the diffuse scattering components, respectively, as shown in Equations (30)–(32).
R t , Δ t ; f , Δ f = R LOS t , Δ t ; f , Δ f + R SPE t , Δ t ; f , Δ f + R DIF t , Δ t ; f , Δ f
R LOS t , Δ t ; f , Δ f = E H LOS * t , f · H LOS t + Δ t , f + Δ f = E α LOS t · exp j 2 π f τ LOS t exp j k 0 d LOS t · exp j 2 π λ 0 t n RT T t · v RT t d t · α LOS t + Δ t · exp j 2 π f + Δ f τ LOS t + Δ t · exp j k 0 d L O S t + Δ t · exp j 2 π λ 0 t + Δ t n RT T t · v RT t d t = E λ G T t G R t 4 π d LOS t · exp j 2 π f τ LOS t · exp j k 0 d LOS t · exp j 2 π λ 0 t n RT T t · v RT t d t · λ G T t + Δ t G R t + Δ t 4 π d LOS t + Δ t · exp j 2 π f + Δ f τ LOS t + Δ t · exp j k 0 d LOS t + Δ t · exp j 2 π λ 0 t + Δ t n RT T t · v RT t d t = λ 2 16 π 2 E { G T t G R t · G T t + Δ t G R t + Δ t d LOS t · d LOS t + Δ t · exp j 2 π f τ LOS t f + Δ f τ LOS t + Δ t · exp j k 0 d LOS t d LOS t + Δ t · exp j 2 π λ 0 t n RT T t · v RT t d t 0 t + Δ t n RT T t · v RT t d t }
R SPE t , Δ t ; f , Δ f = E H SPE * t , f · H SPE t + Δ t , f + Δ f = E Γ t α SPE t · exp j 2 π f τ SPE t · exp j k 0 d SPE t · exp j 2 π λ 0 t n TO T t · v T t + n RO T t · v R t d t * Γ t + Δ t α SPE t + Δ t · exp j 2 π f + Δ f τ SPE t + Δ t · exp j k 0 d SPE t + Δ t · exp j 2 π λ 0 t + Δ t n TO T t · v T t + n RO T t · v R t d t = E Γ * t · Γ t + Δ t λ 2 G T t G R t G T t + Δ t G R t + Δ t 16 π 2 d SPE t d SPE t + Δ t · exp j 2 π f τ SPE t j 2 π f + Δ f τ SPE t + Δ t · exp j k 0 d SPE t + d SPE t + Δ t · exp j 2 π λ 0 t n TO T t · v T t + n R O T t · v R t d t 0 t + Δ t n TO T t · v T t + n R O T t · v R t d t
R DIF t , Δ t ; f , Δ f = E H DIF * t , f · H DIF t + Δ t , f + Δ f = E l = 1 L λ G T , l t G R , l t 4 π d TD , l d RD , l · exp j 2 π f τ DIF , l t · exp j φ l t · exp j k 0 d DIF , l t · exp j 2 π λ 0 t n TD , l T t · v T t + n RD , l T t · v R t d t l = 1 L λ G T , l t + Δ t G R , l t + Δ t 4 π d TD , l d DR , l · exp j 2 π f + Δ f τ DIF , l · exp j φ l t · exp j φ l t + Δ t · exp j k 0 d DIF , l t + Δ t · exp j 2 π λ 0 t + Δ t n TD , l T t · v T t + n RD , l T t · v R t d t
With the assumption that the reflection coefficient Γ , delay τ , distance d, additional phase shift φ , antenna gain G, velocity v , and etc. are time independent, the scattering channel satisfies the feature of wide sense stationary uncorrelated scattering (WSSUS) and the auto-correlation functions of each paths can be simplified as Equations (33)–(35).
R LOS Δ t , Δ f = λ 2 G T , LOS G R , LOS 16 π 2 d LOS 2 · exp j 2 π Δ f τ LOS · exp j 2 π n RT T · v RT λ · Δ t
R SPE Δ t , Δ f = Γ 2 λ 2 G T , SPE G R , SPE 16 π 2 d SPE 2 · exp j 2 π Δ f τ SPE · exp j k 0 d SPE t · exp j 2 π n TO T · v T + n RO T · v R λ Δ t
R DIF Δ t , Δ f = E l = 1 L λ 2 G T , l G R , l 16 π 2 d DT , l d RD , l 2 · exp j 2 π τ DIF , l Δ f · exp j 2 π n TD , l T · v T + n RD , l T · v R λ Δ t
With time variant ACFs, different coherence time can be obtained, which is essential parameter for system design. Through Fourier transform [31] as in Equation (36) with Equations (33)–(35), for the WSSUS channel, the Doppler delay spectrum of each path can be obtained, where R u , Δ f is R LOS Δ t , Δ f , R SPE Δ t , Δ f , or R DIF Δ t , Δ f , u denotes Δ t . If more precise information of the channel is desired, the time variant features should not be ignored. Thus other method towards the frequency spectrum features such as Wigner Ville spectrum should be adopted, for example, as discussed in [13].
P DS f , Δ f = R u , Δ f · exp j 2 π f u d u

4. Distributions of Path Delay, Path Attenuation, Normalized Doppler Shift of the Scattering Path

In this section, we investigate the time varying distributions of path delay, path attenuation, and normalized Doppler shift of the diffuse scattering path, with the assumption that the scatterers obey UD and the PDF is as Equation (9). The structure of the scattering area is illustrated in Figure 2, where the specular reflection point is the center of the ellipse, l l is the semi-major axis, and l s is the semi-minor axis.

4.1. The Distribution of τ DIF t

The time variant CDF of the time delay of the scattering path relative to the LOS path can be calculated with Equations (37)–(41) [32], where P T DIF t τ DIF is the probability that the virtual random variable T DIF observed at the moment t is not larger that the random path delay τ DIF observed at the moment t, τ min τ DIF τ max , and S T τ DIF , t is the area of the elliptical area determined by Equation (38). τ min is the minimum path delay of the scattering path obtained through tangency point between the minimum delay-determined ellipsoid and the earth, τ min = τ SPE .
F T DIF τ DIF , t = P T DIF t τ DIF = T DIF t τ DIF f X D Y D x D , y D , t d x D d y D 1 S t T DIF t τ DIF d x D d y D S T τ DIF , t S t
c τ DIF = x D 2 t + y D t y R t 2 + z R 2 t + x D 2 t + y D t y T t 2 + z T 2 t d LOS t
Thus S T τ DIF , t can be calculated with Equation (39) similar to Equations (6)–(8), as follows,
S T τ DIF , t = π l l , T τ DIF , t l s , T τ DIF , t
where
l l , T τ DIF , t = c τ DIF + d LOS t · 2 c τ DIF + d LOS t 2 μ 1 t 1 · c τ DIF + d LOS t 2 + μ 2 t · c τ DIF + d LOS t 2 + μ 3 t
l s , T τ DIF , t = c τ DIF + d LOS t 1 c τ DIF + d LOS t μ 4 t c τ DIF + d LOS t + μ 4 t · c τ DIF + d LOS t μ 5 t c τ DIF + d LOS t + μ 5 t 1 2
where
μ 1 t = 2 y R 2 t + 4 y R t y T t 2 y T 2 t
μ 2 t = y R 2 t 2 y R t y T t + y T 2 t + z R 2 t 2 z R t z T t + z T 2 t
μ 3 t = y R 2 t 2 y R t y T t + y T 2 t + z R 2 t + 2 z R t z T t + z T 2 t
μ 4 t = z T t z R t
μ 5 t = z T t + z R t
The details of calculating l l , T τ DIF , t and l s , T τ DIF , t can be found in Appendix B.
Thus, the PDF f τ DIF , t can be obtained with Equation (47), where l l , T τ DIF , t τ DIF is calculated as in (48).
f T DIF τ DIF , t = F T DIF τ DIF , t τ DIF = S T τ DIF , t S t τ DIF = π S t l s , T τ DIF , t l l , T τ DIF , t τ DIF + l l , T τ DIF , t l s , T τ DIF , t τ DIF
l l , T τ DIF , t τ DIF = 1 ζ 1 t c ζ 5 t ζ 6 t + 2 c 2 τ DIF y R t + 2 c 2 τ DIF y T t d LOS t ζ 2 t ζ 3 t + 2 c d LOS t y R t + 2 c d LOS y T t c τ DIF ζ 2 t ζ 3 t 1 ζ 1 2 4 τ DIF c 2 + 4 d LOS t c · d LOS t ζ 5 t ζ 6 t + c τ DIF ζ 5 t ζ 6 t + c 2 τ DIF 2 y R t + c 2 τ DIF 2 y T t + 2 c d LOS t τ DIF y R t + 2 c d LOS t τ DIF y T t
where
ζ 1 τ DIF , t = 2 c 2 τ DIF 2 + 4 c d LOS t τ DIF + 2 d LOS 2 t 2 y R 2 t + 4 y R t y T t 2 y T 2 t
ζ 2 τ DIF , t = ζ 4 τ DIF , t ζ 5 τ DIF , t ζ 4 τ DIF , t ζ 6 τ DIF , t
ζ 3 τ DIF , t = 2 ζ 5 τ DIF , t ζ 6 τ DIF , t
ζ 4 τ DIF , t = 2 c 2 τ DIF + 2 c d LOS t
ζ 5 τ DIF , t = c 2 τ DIF 2 2 c d LOS t τ DIF d LOS 2 t + y R 2 t 2 y R t y T t + y T 2 t + z R 2 t + 2 z R t z T t + z T 2 t
ζ 6 τ DIF , t = c 2 τ DIF 2 + 2 c d LOS t τ DIF + d LOS 2 t y R 2 t + 2 y R t y T t y T 2 t z R 2 t + 2 z R t z T t z T 2 t
l s , T τ DIF , t τ DIF is calculated as in Equation (55), where
l s , T τ DIF , t τ DIF = c η 4 t η 3 t η 2 t + c η 4 t η 3 t η 5 t + c η 4 t η 2 t η 5 t + c η 3 t η 2 t η 5 t 2 d LOS t + c τ DIF t η 1 t c η 1 t d LOS t + c τ DIF 2
η 1 τ DIF , t = η 2 τ DIF , t η 3 τ DIF , t η 4 τ DIF , t η 5 τ DIF , t
η 2 τ DIF , t = d LOS t z R t z T t + c τ DIF
η 3 τ DIF , t = d LOS t z R t + z T t + c τ DIF
η 4 τ DIF , t = d LOS t + z R t z T t + c τ DIF
η 5 τ DIF , t = d LOS t + z R t + z T t + c τ DIF
The calculation of l l , T τ DIF , t and l s , T τ DIF , t can be refered to Appendix B.

4.2. The Distribution of α DIF t

The path attenuation of the scattering path can be calculated with Equation (61) according to Radar function [2,28], for any sub-path, it can be denoted as α DIF t = q x D t , y D t in Equation (61), where the scatter is assumed to be circle with R l as its radius. The PDF of the scattering path attenuation α DIF t can be obtained with Equation (62) according to the theory of random process [32], where S t is calculated with Equation (8), F A DIF α DIF , t is the CDF of α DIF t , and A DIF is the virtual random variable at the moment t calculated with Equation (61).
α DIF t = λ x , y C l σ x , y G T x , y G R x , y d x d y 8 π π x T t x D t 2 + y T t y D t 2 + h T 2 t x D 2 t + y D 2 t + h R 2 t
f A DIF α DIF , t = F A DIF α DIF , t α DIF = A DIF t α DIF f X D Y D x D , y D , t d x D d y D α DIF = A DIF t α DIF d x D d y D S t α DIF

4.3. The Distribution of γ DIF t

We define the normalized Doppler shift as follows.
γ DIF t = g x D t , y D t = n RD T t · v R t + n TD T t · v T t v R t + v T t = 1 v R + v T 1 d DR v R _ x x D + v R _ y y D v R _ z h R + 1 d TD v T _ x x D x T + v R _ y y D y T v T _ z h T = 1 v R + v T 1 x D 2 + y D 2 + h R 2 v R _ x x D + v R _ y y D v R _ z h R + 1 x D x T 2 + y D y T 2 + h T 2 v T _ x x D x T + v R _ y y D y T v T _ z h T
It can be observed from Equation (63) that γ DIF is a function of x D t and y D t , thus the PDF of γ DIF t can be calculated as Equation (64), where F γ DIF γ DIF , t is the time variant CDF of γ DIF t , and Γ DIF t is the virtual random variable calculated with Equation (63).
f Γ DIF γ DIF , t = F γ DIF γ DIF , t γ DIF = d Γ DIF t γ DIF f X D Y D x D , y D x D d y D γ DIF = Γ DIF t γ DIF d x D d y D S t γ DIF
Since it is very hard to be obtain closed form expressions from Equations (62) and (64), we perform simulation and distribution fitting to get them.

5. Simulation Results and Analysis

5.1. Simulation Assumptions

According to similar scenarios or assumptions used in [1,4,14,33,34,35], the simulation parameters are set and listed in Table 2. The trajectories of the receiver are shown in Figure 3 for the simulation of the CIRs. The simulation includes three scenarios(states), i.e., rising, cruising, and descending. in the simulation of CIR, TF, ACF, and PSD, we assume that the initial positions of these three scenarios are the same, i.e., the position of R in Figure 3 corresponds to the moment t = 0 s in each scenario, then the aircraft moves along the trajectories corresponding to each scenario along the directions of the arrows. The moments we simulate are collected at different moments during the moving of the aircraft. The dielectric coefficients are set in accord with [26,27].

5.2. Simulations of CIR, TF, ACF, and Normalized Doppler PSD

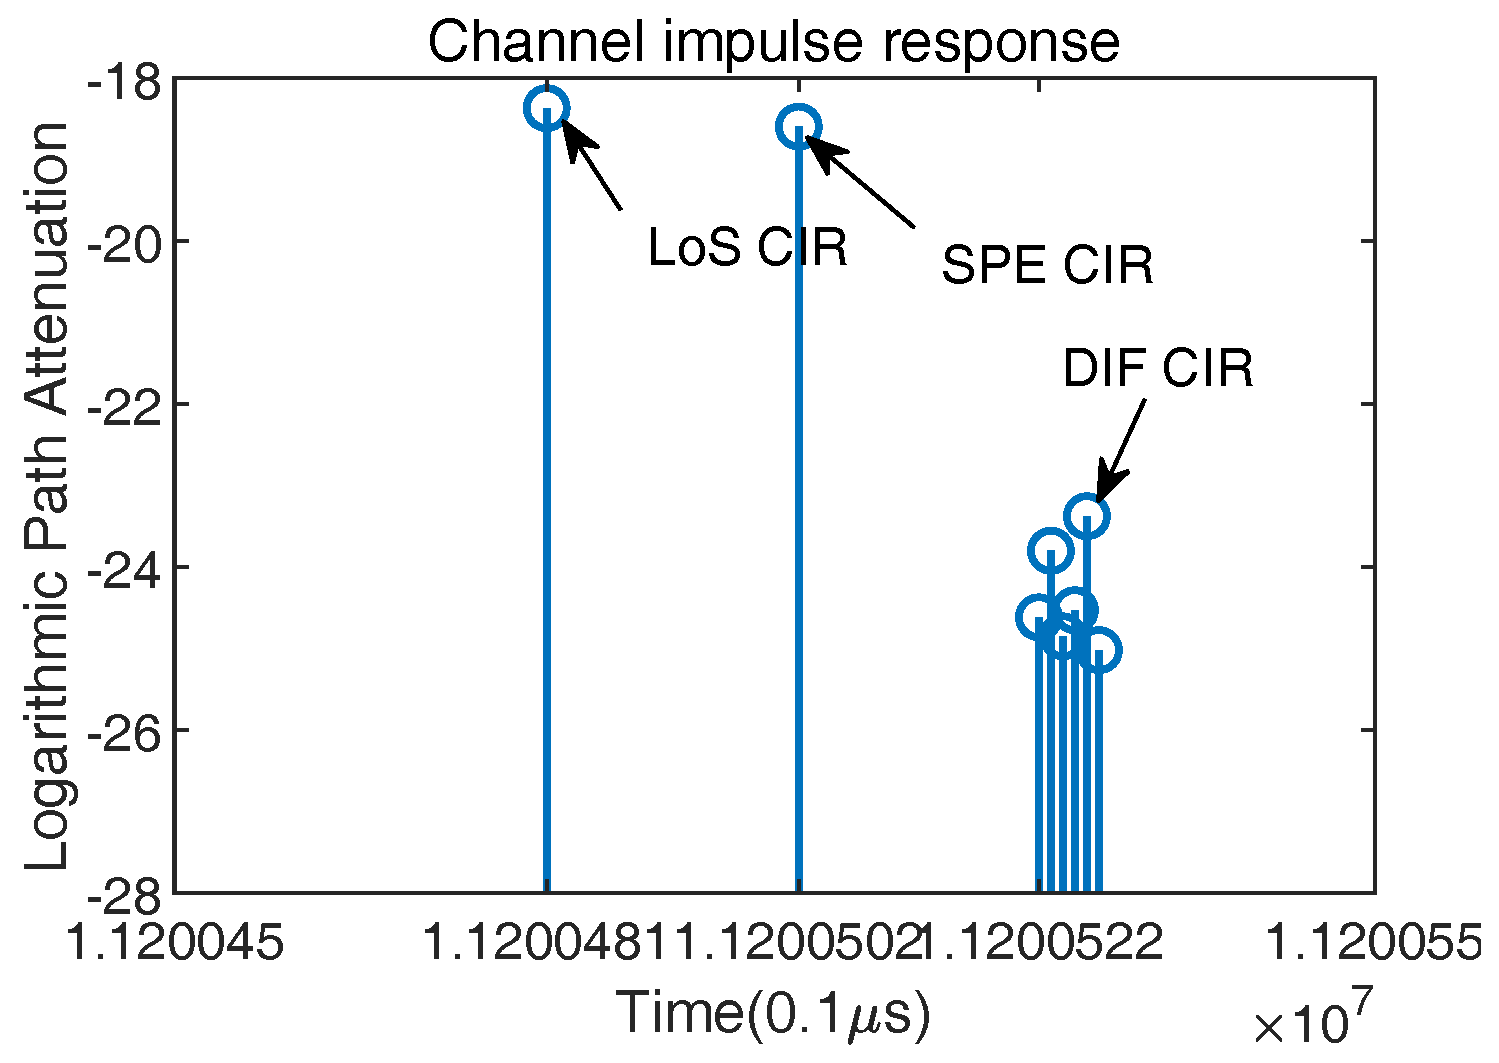
In our simulations of the CIRs, tapped delay lines model is adopted in this paper with Δ t = 0.1 μ s . Figure 4 shows a snapshot of the impulse responses of the presented model at the moment t = 1 s of the rising stage. Six scattering taps are illustrated in this figure.
As shown in Figure 4, the LOS path, which is also the path with the minimum delay, can be distinguished from other paths easily, the specular reflection path is adjacent to the scattering paths. Closer scattering components to the specular component would be observed if nearer scatterers to the specular reflection point were distributed.
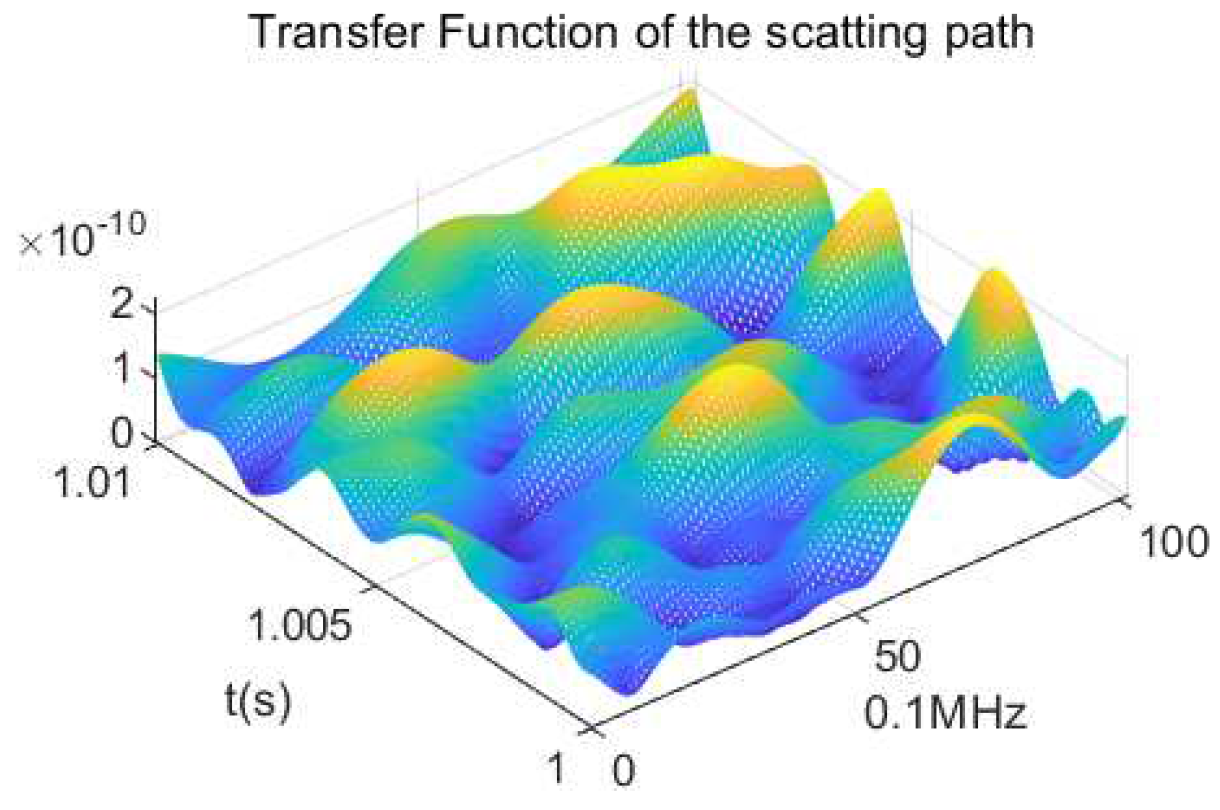
The time-frequency transfer function of the scattering path during t 1 , 1.01 s of the rising stage is shown in Figure 5 which depicts the time variant feature of the H DIF t , f . Although H DIF t , f is only a sample of the spectrum of the random process h DIF t , τ , we can observe its time variant and random feature.
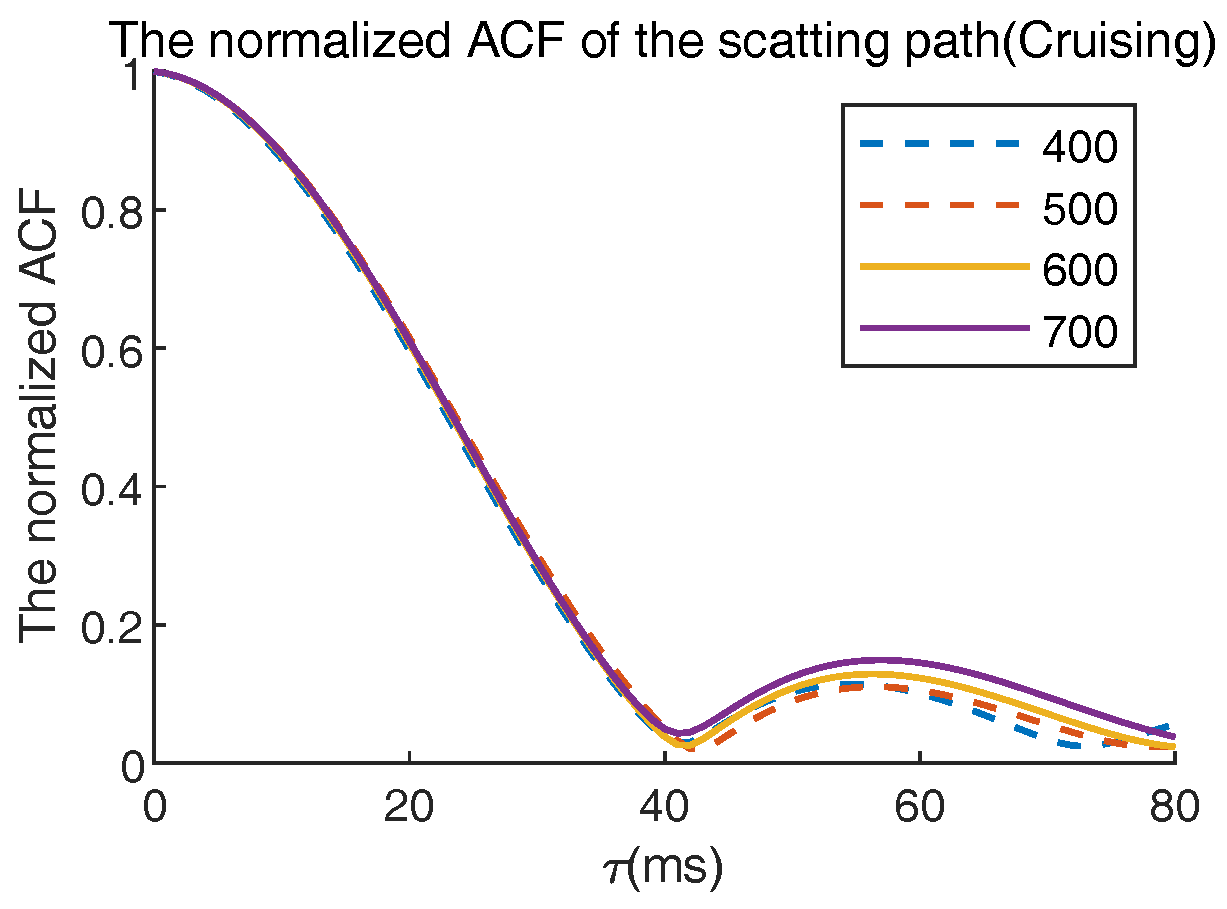
The normalized ACFs of the scattering path in different flight states and at different moments, i.e., t = 300 s, t = 450 s, t = 650 s, and t = 800 s of the rising state, t = 400 s, t = 500 s, t = 600 s, and t = 700 s of the cruising state, and t = 450 s, t = 600 s, t = 750 s, and t = 900 s of the descending state, are shown and compared in Figure 6, Figure 7 and Figure 8. From Figure 6, i.e., in the rising state, we can observed that the main lobe of the normalized ACF becomes wider with the increasing of the time, i.e., the distance between the transmitter and the receiver is decreasing. This depicts increasing correlation time periods. We can also observe that the fluctuations of the curves weaken with the increasing of time. These show the non-stationary feature of the channel. In Figure 8 an reverse trend was observed. Quasi-stationary feature can be observed in the cruising state, as shown in Figure 7.
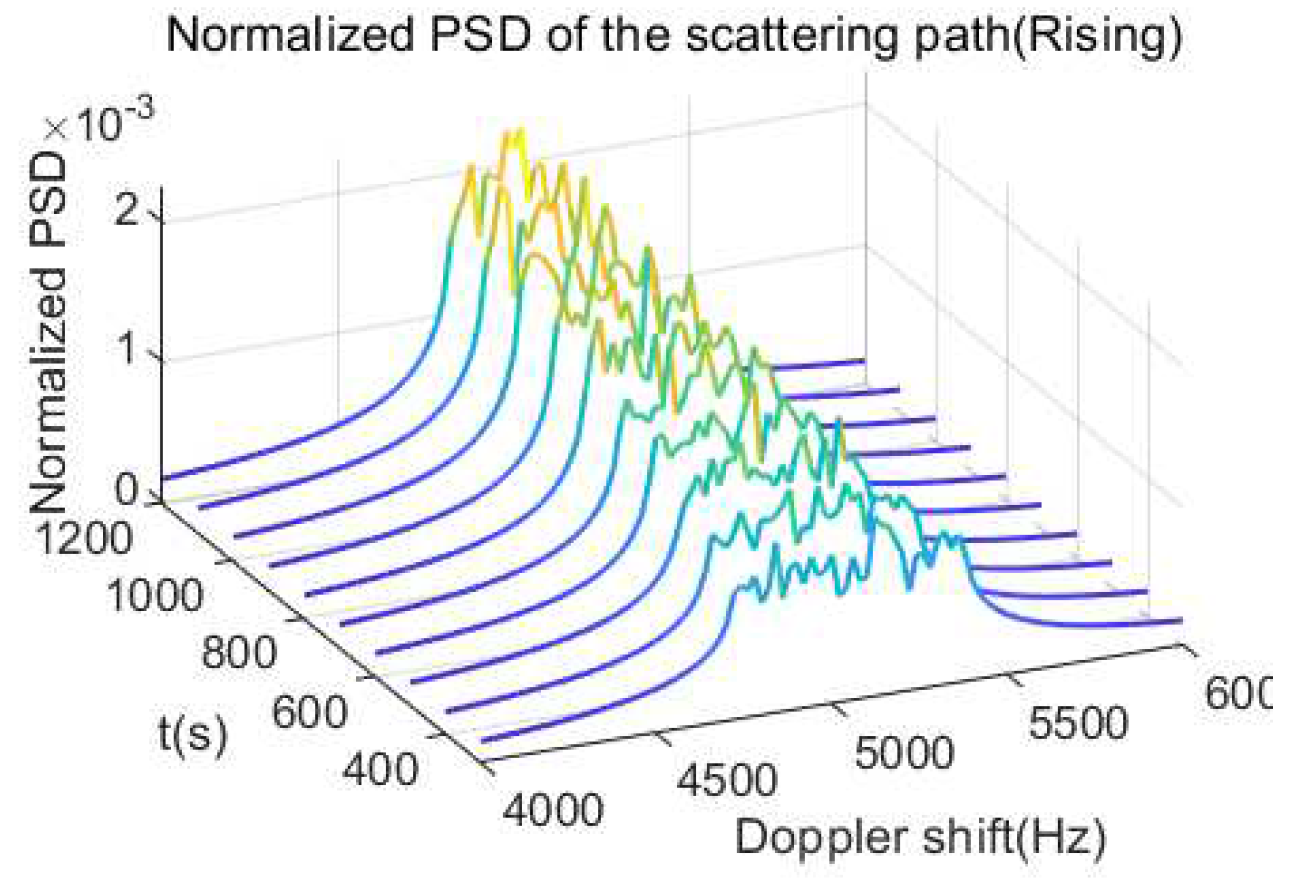
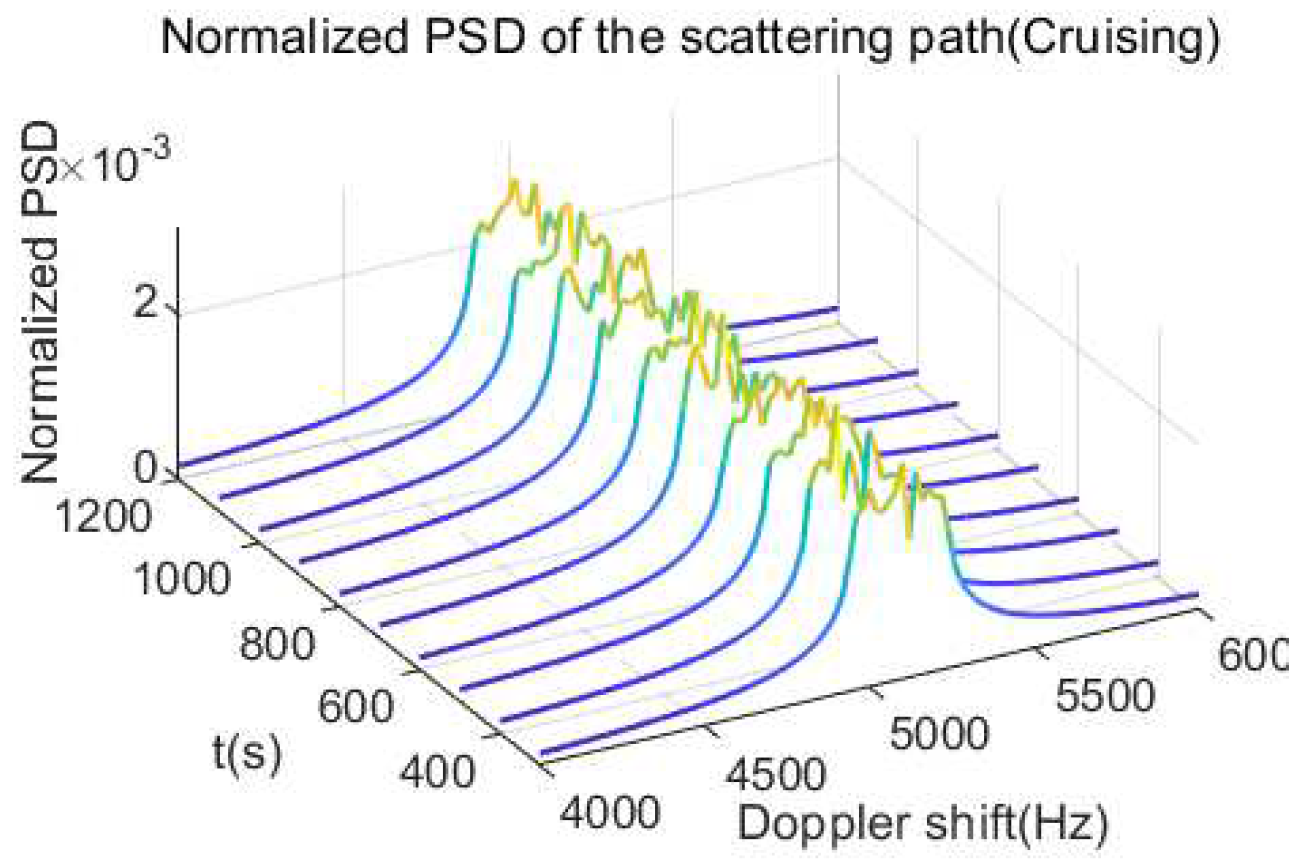
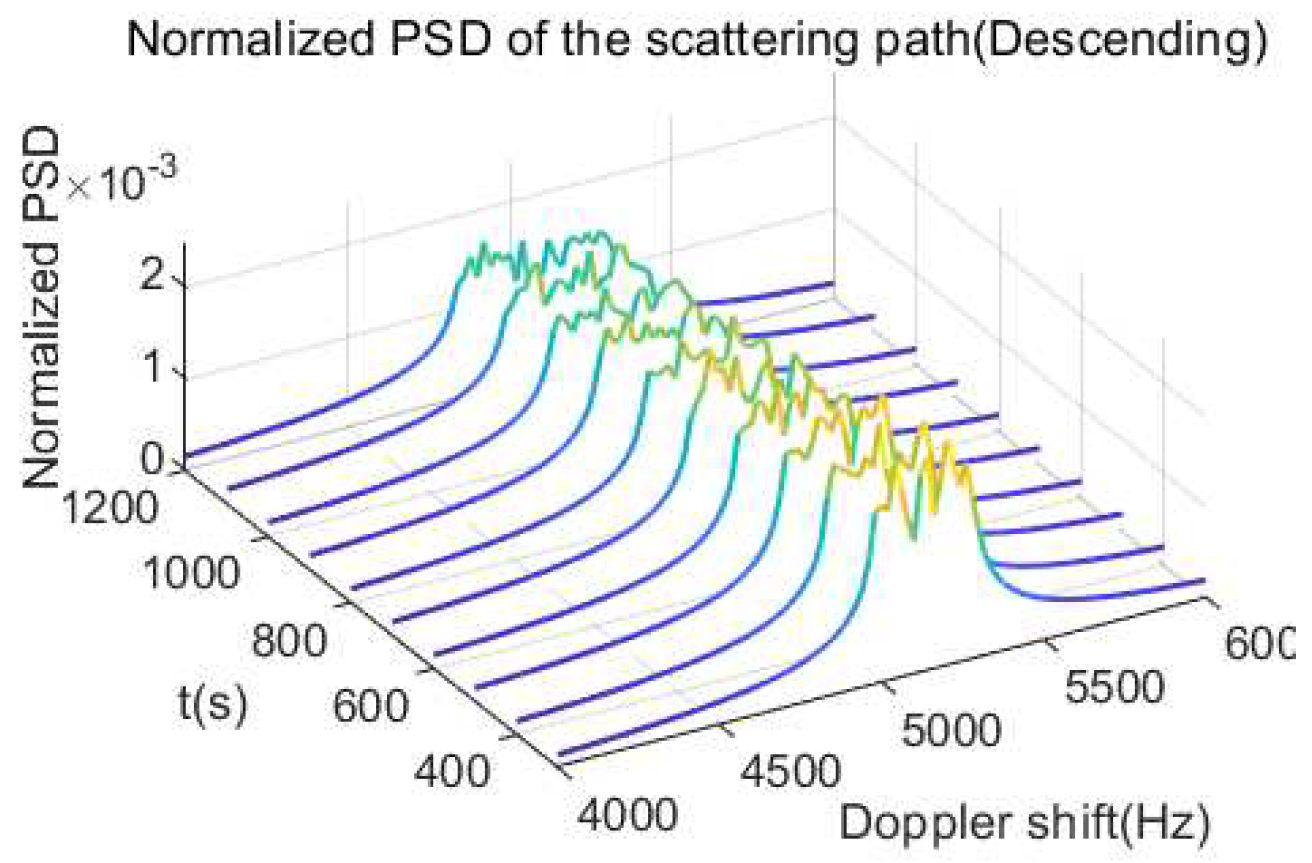
The normalized Doppler PSDs during the time period of t 0 , 1200 s for rising, cruising and descending states are shown in Figure 9, Figure 10, and Figure 11, respectively. These figures show the increases of the maximum normalized Doppler shifts in accord with the movements of the receiver towards the transmitter. As shown in Figure 9, in the rising state, the maximum normalized Doppler becomes larger with the increasing of the time. A reverse trend can be observed in the descending state with Figure 11. Quasi-stationary feature can be observed in the cruising state, as shown in Figure 10.

5.3. Simulations of the Distributions of Path Delay, Path Attenuation, and Normalized Doppler Shift of the Scattering Path

In this subsection, simulation results of the distributions of τ DIF are illustrated and compared with the derived CDFs. For the distributions of α DIF and γ DIF , since there are no available closed form expression for the presented scenario, for more convenient application, the fitting functions are presented. For better observation of the symmetries of the Doppler shift, the PDFs are observed instead of CDFs. It’s to be noted that, different from the trajectories in Section 5.2, the trajectory of the aircraft in descending state is the return route of the trajectory of the rising state, i.e., 1800 s were simulated for both states.

5.3.1. The Distribution of τ DIF

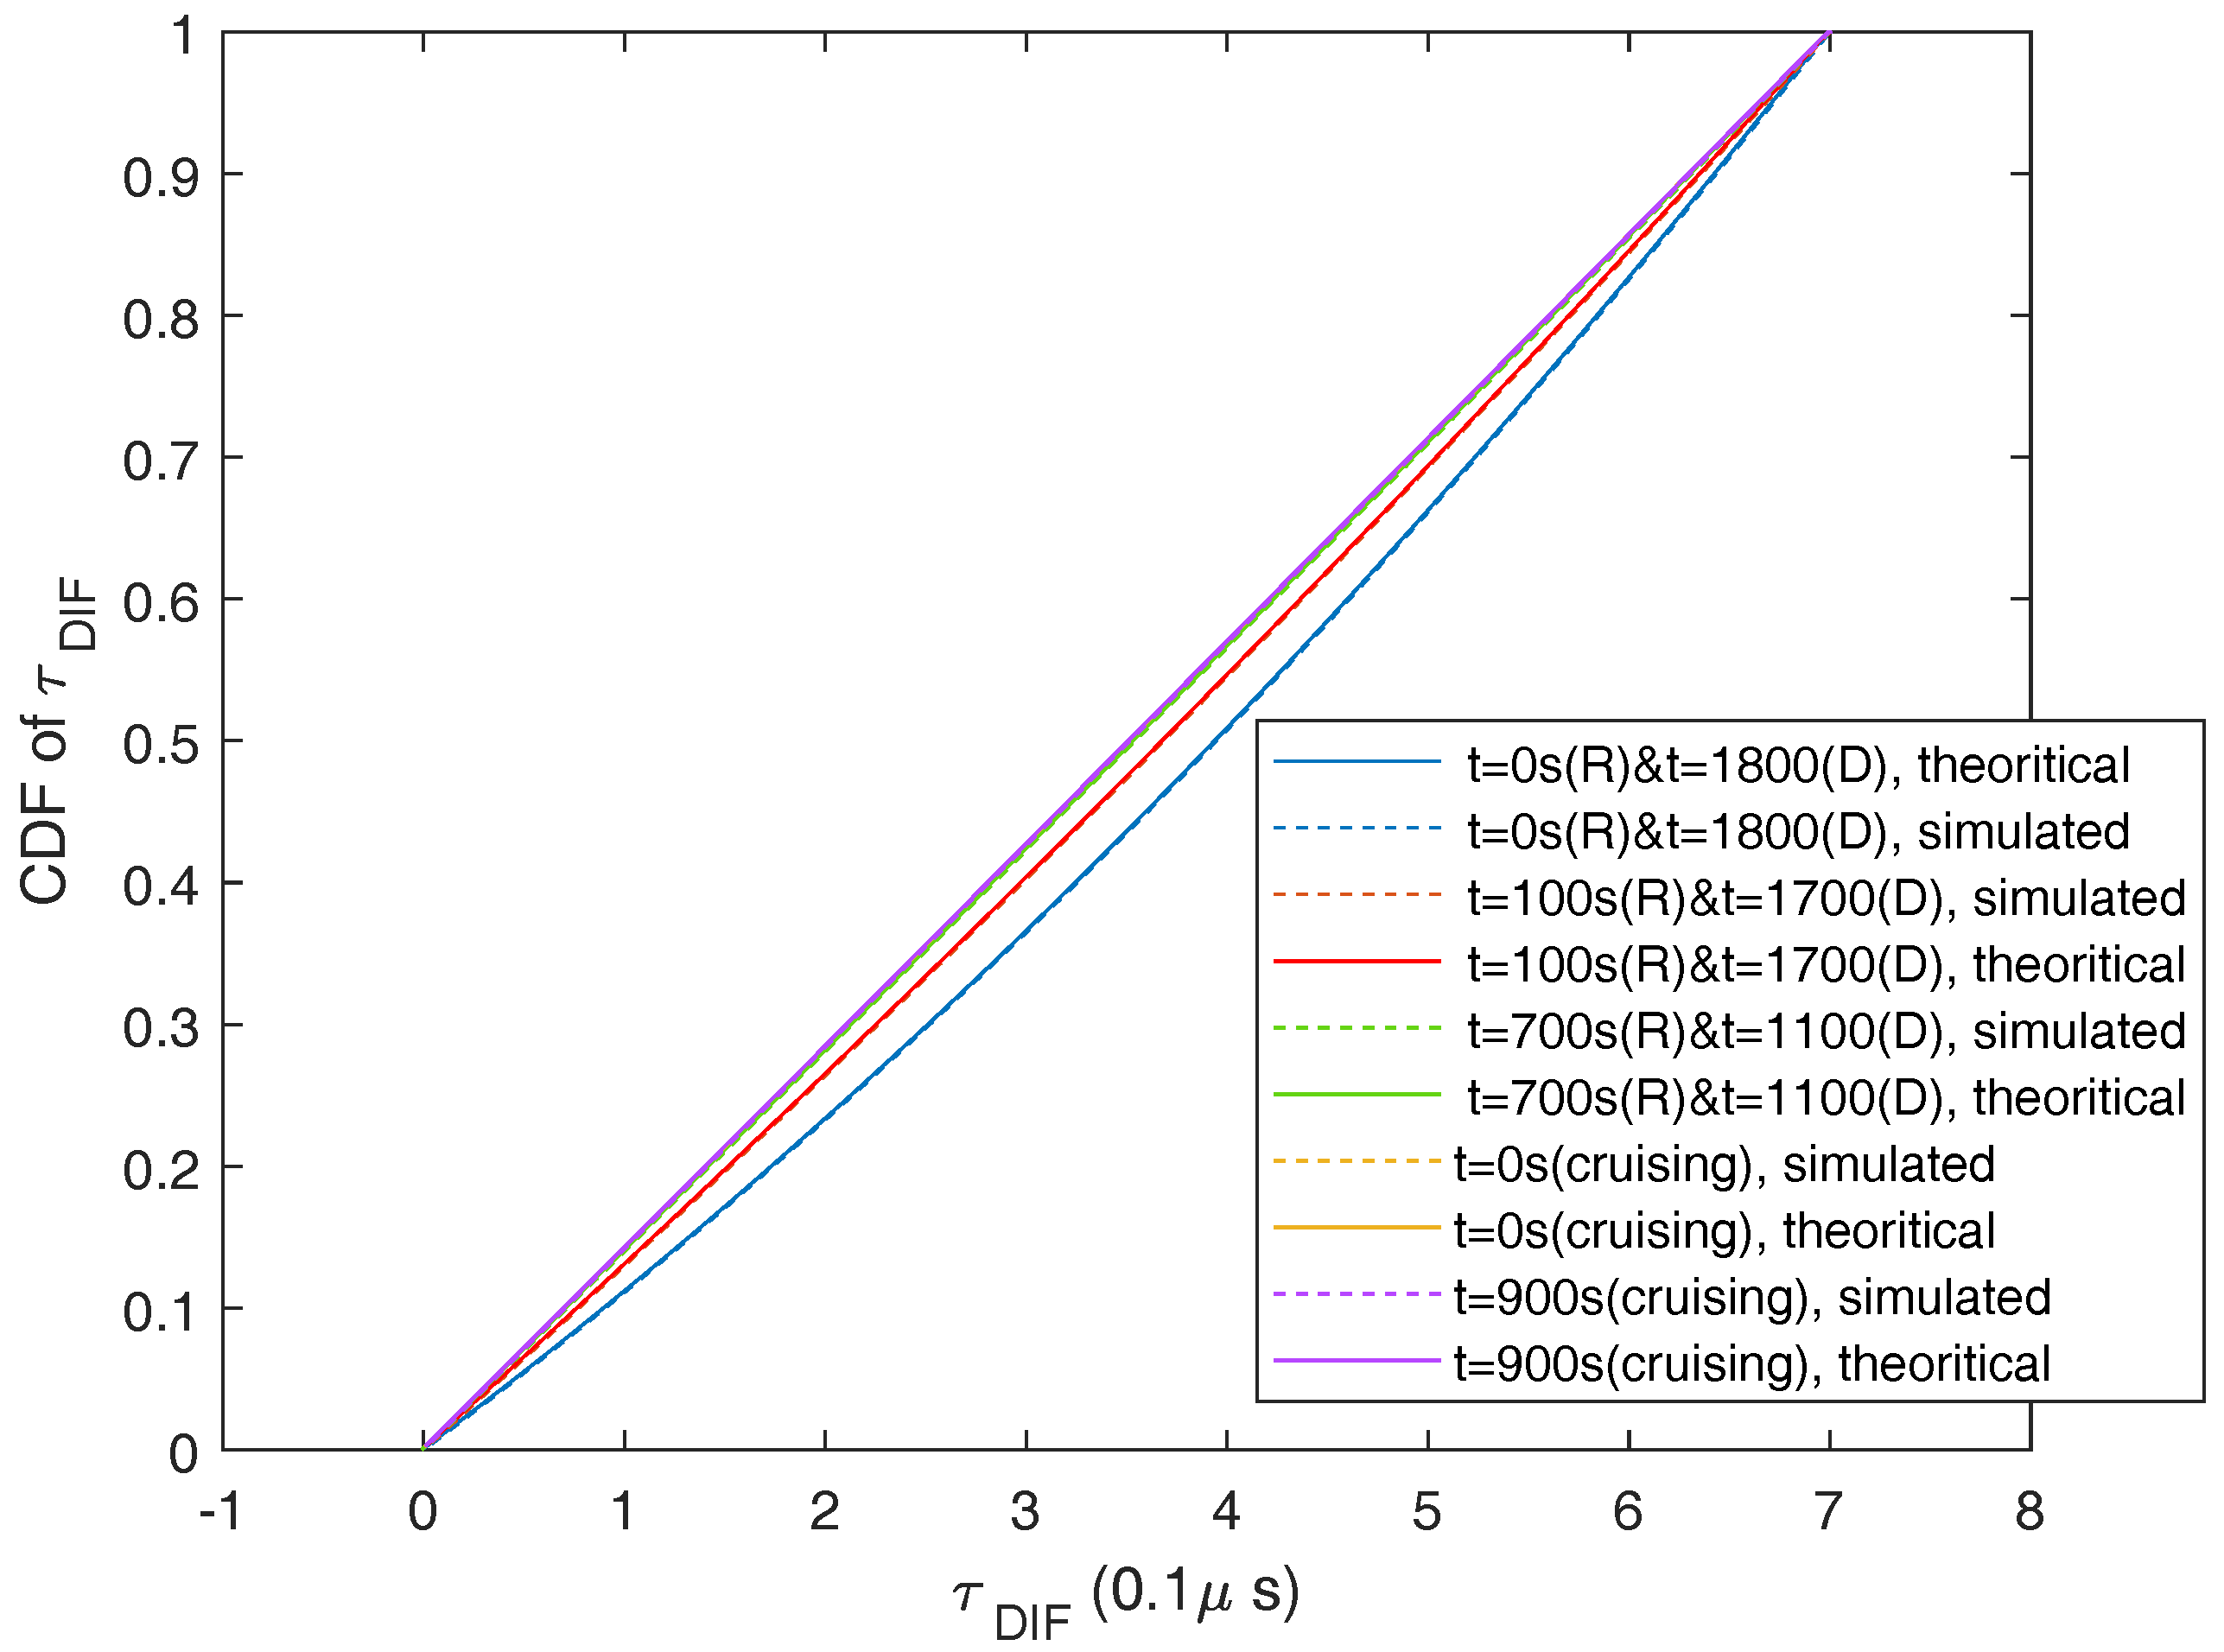
The CDFs of scattering path delay τ DIF in the rising state at the moments of t = 0 s, t = 100 s, and t = 700 s and correspondingly at the moments of t = 1800 s, t = 1700 s, and t = 1100 s, of the descending state are illustrated in Figure 12, as well as the CDFs of τ DIF in cruising state. The simulated CDFs coincide perfectly with the derived CDFs. It’s to be mentioned that, for clearer comparison, in Figure 12, τ DIF is illustrated relative to the SPE path, which is also the scattering path with minimum path delay.
It can be seen form Figure 12 that, in the rising and the descending states, the CDFs of τ DIF is obviously different at different moments, this depicts the non-stationary feature of the channel. In the rising state, as time increasing, decreasing altitude difference with decreasing distance between the aircraft and the satellite means larger and more circle-like scattering region with the same maximum time delay, i.e., (1.4 μ s in this subsection). Thus the CDF of τ DIF tends to be linear. Similar features can be observed with the simulation results at corresponding moments of descending state, since similar geometry structures can be obtained. And the CDFs of τ DIF in the cruising state are quasi-stationary due to almost time invariant geometry of the scatterers, and it is very close to the CDF at the moment of t = 700 s in the rising state.

5.3.2. The Distribution of α DIF

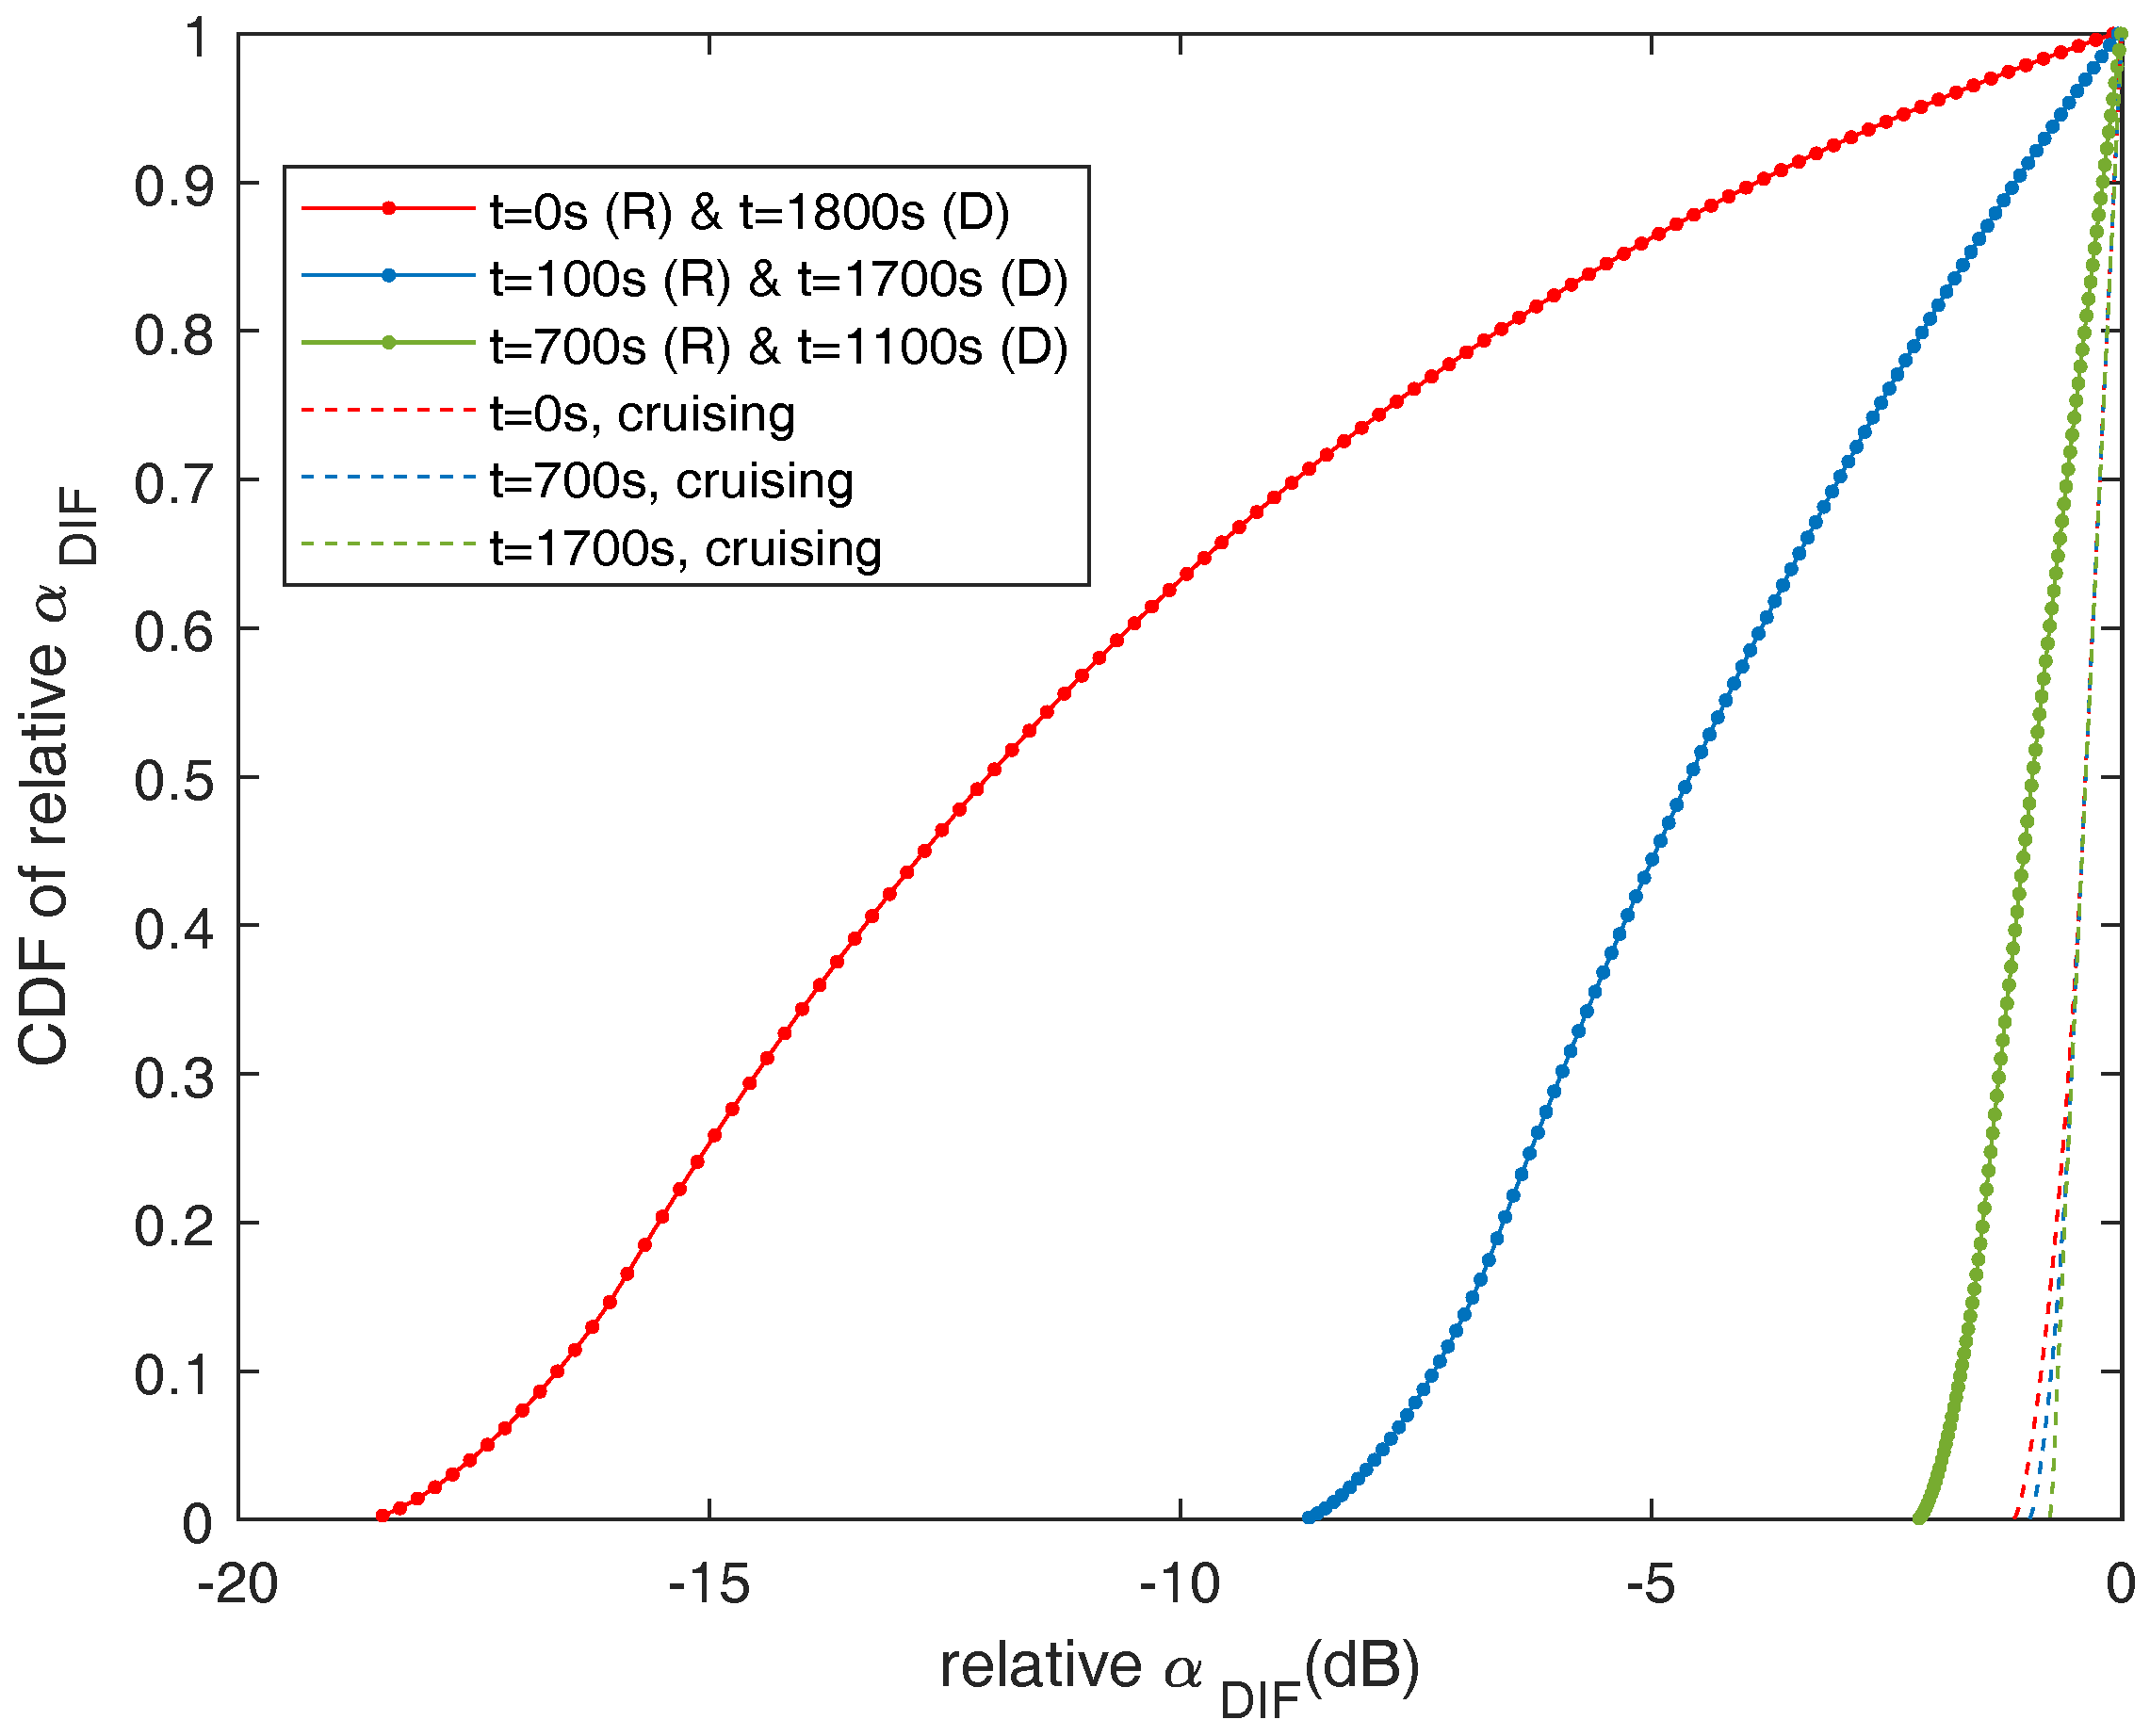
By assuming the distribution of the scatterers is UD, the CDFs of the path attenuation of the scattering path α DIF relative to the minimum scattering path attenuations at the moments t = 0 s , t = 100 s and t = 700 s respectively, of the rising state, which are corresponding to the moments of t = 1800 s , t = 1700 s and t = 1100 s on the descending state, are shown in Figure 13. The CDFs of the path attenuation of the scattering path α DIF relative to the minimum scattering path attenuation at the moments t = 0 s , t = 700 s and t = 1700 s of cruising state are also shown in Figure 13.
From Figure 13, we can observe that, in the rising state, as the distance between the aircraft and the satellite decreasing with t increasing, the path attenuation difference tends to diminish. In the cruising state, quasi-stationary feature can be observed through very close CDFs at different moments. Compared with the features obtained in the rising state, a reverse trend can be observed with the simulation resluts in the descending state.
The CDFs of α DIF in rising state can be fitted with two terms Fourier function as shown in (65), with the coefficients listed in Table 3.
F A DIF α DIF = a α , 0 + a α , 1 cos w α DIF + b α , 1 sin w α DIF + a α , 2 cos 2 w α DIF + b α , 2 sin 2 w α DIF
The CDFs of α DIF in cruising state can be fitted with one term Fourier function as shown in Equation (66), with the coefficients a α , 0 = 0.6214 , a α , 1 = 0.3768 , b α , 1 = 0.4866 , and w = 2.232 .
F A DIF α DIF = a α , 0 + a α , 1 cos w α DIF + b α , 1 sin w α DIF

5.3.3. The Distribution of γ DIF

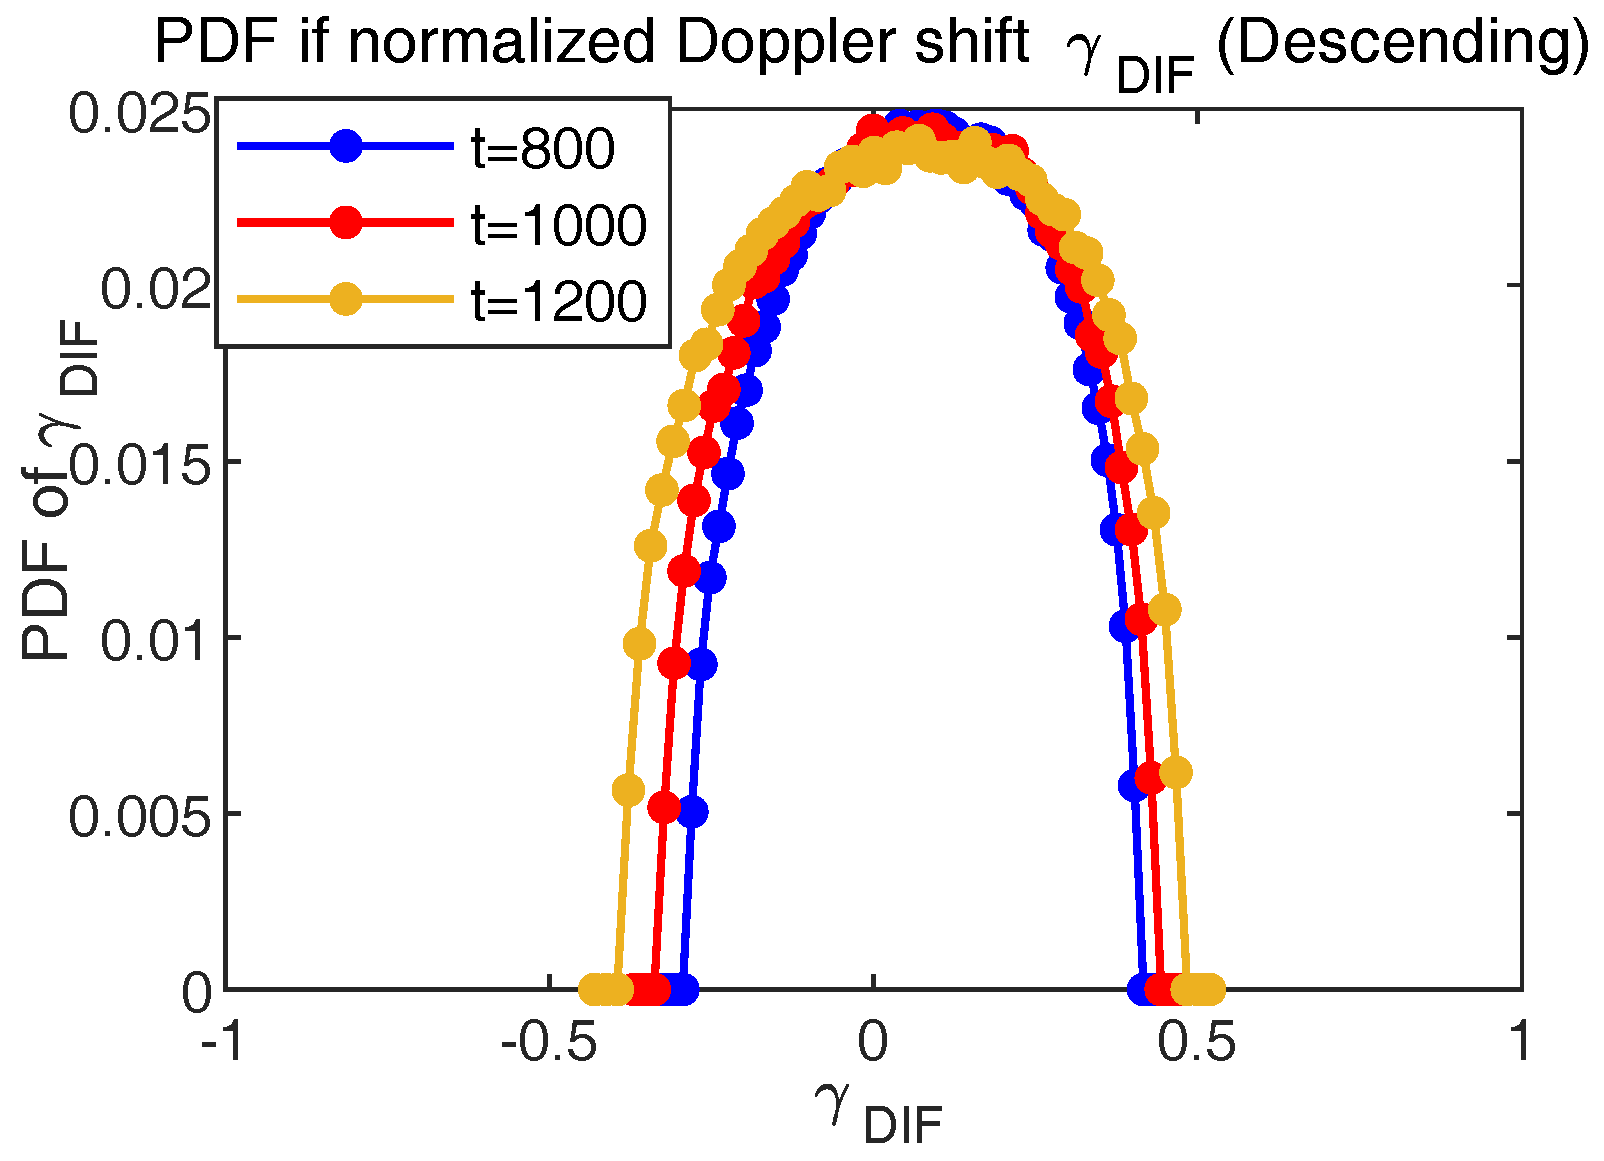
The PDFs of normalized Doppler shift γ DIF is illustrated in Figure 14, Figure 15 and Figure 16. In the Rising state, as shown in Figure 14 the PDF of γ DIF becomes narrower with the increasing of observed moments, depicting non-stationary feature of the channel. In Figure 16, a reverse trend can be observed compared with the PDF of γ DIF obtained in the rising state, which also depicts the non-stationary feature of the channel. While as shown in Figure 15 the PDFs of γ DIF in the cruising state are very similar, reflecting quasi-stationary feature of the channel.
The PDFs of γ DIF in the Rising state t = 400 s , t = 600 s and t = 800 s , are fitted with a polynomial as Equation (67). The coefficients are as shown in Table 4. The PDFs of γ in the cruising and descending states can be fitted with the same formula (67), with different coeffcients.
f γ DIF = c 1 γ DIF 4 + c 2 γ DIF 3 + c 3 γ DIF 2 + c 4 γ DIF + c 5

6. Conclusions

In this paper, an analytical RS-GBSM based S2A channel model for UD of scatterers over an open area is proposed. Based on the presented geometry, the CIRs of the LOS path, the specular reflection path, and the scattering path are formulated. The corresponding time-frequency TFs, ACFs and PSDs are derived and simulated. Simulation scenarios are designed as three states, e.g., the rising state, the cruising state, and the descending state. In each state, several moments are selected to illustrate the time variant features of the channel. Through the simulation results, the non-stationary features of the channel in rising and descending states are evidently observed, while in cruising state, the channel is quasi-stationary. Furthermore, based on an reasonable simplification that the scattering area can be approximated as an ellipse, the closed form expression of path delay distribution is derived, simulation results coincide with the theoretical results perfectly. The distributions of path attenuation, and Doppler shift of the scattering path are also simulated and fitted since no closed form expressions of their CDFs can be derived. Based on the theoretical and simulation results of the distributions of channel coefficients, the non-stationary features in the rising and descending states are observed and analyzed, as well as the quasi-stationary feature in the cruising state. These observations are in accord with the analysis with the channel formulations. Future work will focus on the derivation and analysis based on different distributions of scatterers, for example, von-Mises Fisher (VMF) distribution as adopted in [36]. Since the geometrical structures of channel modeling must base on the realistic environment, further investigation on concerned achievements in geography and physics would be performed. Analytical non-stationary channel models of extended scenarios, e.g., A2A scenario, will be developed as well.

Author Contributions

Conceptualization, Z.W. and J.G.; methodology, Z.W. and H.Y.; software, Q.T. and S.C.; validation, Z.W., Q.T., and S.C.; formal analysis, Z.W., S.C. and H.Y.; investigation, Z.W., Q.T. and S.C.; resources, L.S., and H.Y.; data curation, Z.W., Q.T. and S.C.; writing–original draft preparation, Z.W., Q.T.; writing–review and editing, Z.W., Q.T. and H.Y.; visualization, Z.W. and Q.T.; supervision, L.S. and H.Y.; project administration, J.G. and Z.W. All authors have read and agreed to the published version of the manuscript.

Funding

This research received no external funding.

Conflicts of Interest

We declare that we have no conflict of interest.

Appendix A. Examples of Area Calculation Error of the Scattering Ellipse

In Table A1 we list some examples of area calculation error of the scattering ellipse, with the presented approximation presented in this paper, the error is under 0.1%.
Table A1. Examples of Area Calculation Error of the Scattering Ellipse.
ScenarioPrecise Area (m2)Approximate Area (m2)Calculation Error (%)
Rising t = 0 s5.3767 × 1055.3729 × 1050.071
Rising t = 700 s6.0180 × 1066.0178 × 1060.0023
Cruising t = 0 s1.4728 × 1071.4728 × 1070.0026
Cruising t = 900 s1.4651 × 1071.4651 × 1070.00064

Appendix B. The Calculation of l1,T (τDIF, t) and ls,T (τDIF, t)

l l , T τ DIF , t = y D max τ DIF , t y D min τ DIF , t
where y D max τ DIF , t and y D max τ DIF , t are calculated as Equations (A2) and (A3), where
y D max τ DIF , t = 1 σ 1 τ DIF , t d LOS 2 t y R t + d LOS 2 t y T t + y R t y T 2 t + y R 2 t y T t y R t z R 2 t + y R t z T 2 t + y T t z R 2 t y T t z T 2 t y R 3 t y T 3 t + d LOS t σ 6 τ DIF , t + c τ DIF σ 6 τ DIF , t + σ 3 τ DIF , t + σ 2 τ DIF , t + σ 5 τ DIF , t + σ 4 τ DIF , t
y D min τ DIF , t = 1 σ 1 τ DIF , t d LOS 2 t y R t + d LOS 2 t y T t + y R t y T 2 t + y R 2 t y T t y R t z R 2 t + y R t z T 2 t + y T t z R 2 t y T t z T 2 t y R 3 t y T 3 t d LOS t σ 6 τ DIF , t c τ DIF σ 6 τ DIF , t + σ 3 τ DIF , t + σ 2 τ DIF , t + σ 5 τ DIF , t + σ 4 τ DIF , t
σ 1 τ DIF , t = 2 c 2 τ DIF 2 + 4 c d LOS t τ DIF + 2 d LOS 2 t 2 y R 2 t + 4 y R t y T t 2 y T 2 t
σ 2 τ DIF , t = c 2 τ DIF 2 y T t 2 y T 2 t
σ 3 τ DIF , t = c 2 τ DIF 2 y R t
σ 4 τ DIF , t = 2 c d LOS t τ DIF y T t
σ 5 τ DIF , t = 2 c d LOS t τ DIF y R t
σ 6 τ DIF , t is calculated as in Equation (A9).
σ 6 τ DIF , t = τ DIF y R t · c 2 τ DIF 2 2 c d LOS t τ DIF d LOS 2 t + y R 2 t 2 y R t y T t + y T 2 t + z R 2 t + 2 z R t z T t + z T 2 t · c 2 τ DIF 2 + 2 c d LOS t τ DIF + d LOS 2 t y R 2 t + 2 y R t y T t y T 2 t z R 2 t + 2 z R t z T t z T 2 t 1 2
l s , T τ DIF , t = x D max τ DIF , t x D min τ DIF , t
where x D max τ DIF , t and x D min τ DIF , t are calculated as Equations (A11) and (A12), respectively.
x D max τ DIF , t = 1 2 d LOS t + c τ DIF d LOS t + z R t z T t + c τ DIF · d LOS t z R t + z T t + c τ DIF · d LOS t z R t z T t + c τ DIF · d LOS t + z R t + z T t + c τ DIF 1 2
x D min τ DIF , t = 1 2 d LOS t + c τ DIF d LOS t + z R t z T t + c τ DIF · d LOS t z R t + z T t + c τ DIF · d LOS t z R t z T t + c τ DIF · d LOS t + z R t + z T t + c τ DIF 1 2

References

  1. Jost, T.; Pelzmann, T.; Schwinzerl, M.; Walter, M.; Schonhuber, M.; Floury, N. Using airborne measurements to model the satellite-to-aircraft channel model at L-band. In Proceedings of the 2017 11th European Conference on Antennas and Propagation (EUCAP), Paris, France, 19–24 March 2017; pp. 1448–1451. [Google Scholar] [CrossRef]
  2. Bello, P.A. Aeronautical Channel Characterization. IEEE Trans. Commun. 1973, 21, 548–563. [Google Scholar] [CrossRef]
  3. Cid, E.L.; Sanchez, M.G.; Alejos, A.V.; Fernandez, S.G. Measurement, Characterization, and Modeling of the Helicopter Satellite Communication Radio Channel. IEEE Trans. Antennas Propag. 2014, 62, 3776–3785. [Google Scholar]
  4. Pelzmann, T.; Jost, T.; Schwinzerl, M.; Pérez-Fontán, F.; Schönhuber, M.; Floury, N. Airborne measurements enhancing the satellite-to-aircraft channel model in L-band. In Proceedings of the 2016 10th European Conference on Antennas and Propagation (EuCAP), Davos, Switzerland, 10–15 April 2016; pp. 1–5. [Google Scholar] [CrossRef]
  5. Jia, R.; Li, Y.; Cheng, X.; Ai, B. 3D geometry-based UAV-MIMO channel modeling and simulation. China Commun. 2018, 15, 64–74. [Google Scholar]
  6. Schneckenburger, N.; Jost, T.; Walter, M.; Del Galdo, G.; Matolak, D.W.; Fiebig, U. Wideband Air-Ground Channel Model for a Regional Airport Environment. IEEE Trans. Veh. Technol. 2019, 68, 6243–6256. [Google Scholar] [CrossRef] [Green Version]
  7. Gulfam, S.M.; Syed, J.N.; Ahmed, A.; Patwary, M.N.; Ni, Q. A Novel 3D Analytical Scattering Model for Air-to-Ground Fading Channels. Appl. Sci. 2016, 6, 207. [Google Scholar] [CrossRef]
  8. Zhu, Q.; Jiang, K.; Chen, X.; Zhong, W.; Yang, Y. A novel 3D non-stationary UAV-MIMO channel model and its statistical properties. China Commun. 2018, 15, 147–158. [Google Scholar]
  9. Yan, C.; Fu, L.; Zhang, J.; Wang, J. A Comprehensive Survey on UAV Communication Channel Modeling. IEEE Access 2019, 7, 107769–107792. [Google Scholar] [CrossRef]
  10. Khawaja, W.; Guvenc, I.; Matolak, D.W.; Fiebig, U.; Schneckenberger, N. A Survey of Air-to-Ground Propagation Channel Modeling for Unmanned Aerial Vehicles. IEEE Commun. Surv. Tutor. 2019, 21, 2361–2391. [Google Scholar] [CrossRef] [Green Version]
  11. Kunisch, J.; de la Torre, I.; Winkelmann, A.; Eube, M.; Fuss, T. Wideband time-variant air-to-ground radio channel measurements at 5 GHz. In Proceedings of the 5th European Conference on Antennas and Propagation (EUCAP), Rome, Italy, 11–15 April 2011; pp. 1386–1390. [Google Scholar]
  12. Chang, H.; Bian, J.; Wang, C.; Bai, Z.; Zhou, W.; Aggoune, E.M. A 3D Non-Stationary Wideband GBSM for Low-Altitude UAV-to-Ground V2V MIMO Channels. IEEE Access 2019, 7, 70719–70732. [Google Scholar] [CrossRef]
  13. Dahech, W.; Patzold, M.; Gutierrez, C.A.; Youssef, N. A Non-Stationary Mobile-to-Mobile Channel Model Allowing for Velocity and Trajectory Variations of the Mobile Stations. IEEE Trans. Wirel. Commun. 2017, 16, 1987–2000. [Google Scholar] [CrossRef]
  14. Borhani, A.; Stsber, G.L.; Ptzold, M. A Random Trajectory Approach for the Development of Nonstationary Channel Models Capturing Different Scales of Fading. IEEE Trans. Veh. Technol. 2017, 66, 2–14. [Google Scholar]
  15. Zhang, X.; Liu, J.; Gu, F.; Ma, D.; Wei, J. An Extended 3-D Ellipsoid Model for Characterization of UAV Air-to-Air Channel. In Proceedings of the ICC 2019—2019 IEEE International Conference on Communications (ICC), Shanghai, China, 20–24 May 2019; pp. 1–6. [Google Scholar] [CrossRef]
  16. Walter, M.; Shutin, D.; Dammann, A.; Matolak, D.W. Modeling of Highly Non-Stationary Low Altitude Aircraft-to-Aircraft Channels. In Proceedings of the MILCOM 2018—018 IEEE Military Communications Conference (MILCOM), Los Angeles, CA, USA, 29–31 October 2018; pp. 1–5. [Google Scholar] [CrossRef]
  17. Walter, M.; Shutin, D.; Matolak, D.W.; Schneckenburger, N.; Wiedemann, T.; Dammann, A. Analysis of Non-Stationary 3D Air-to-Air Channels Using the Theory of Algebraic Curves. IEEE Trans. Wirel. Commun. 2019, 18, 3767–3780. [Google Scholar] [CrossRef]
  18. Walter, M.; Schnell, M. The Doppler-Delay Characteristic of the Aeronautical Scatter Channel. In Proceedings of the 2011 IEEE Vehicular Technology Conference (VTC Fall), San Francisco, CA, USA, 5–8 September 2011; pp. 1–5. [Google Scholar] [CrossRef]
  19. Walter, M.; Shutin, D.; Fiebig, U. Prolate Spheroidal Coordinates for Modeling Mobile-to-Mobile Channels. IEEE Antennas Wirel. Propag. Lett. 2015, 14, 155–158. [Google Scholar] [CrossRef]
  20. Walter, M.; Shutin, D.; Dammann, A. Time-Variant Doppler PDFs and Characteristic Functions for the Vehicle-to-Vehicle Channel. IEEE Trans. Veh. Technol. 2017, 66, 10748–10763. [Google Scholar] [CrossRef] [Green Version]
  21. Walter, M.; Shutin, D.; Fiebig, U. Delay-Dependent Doppler Probability Density Functions for Vehicle-to-Vehicle Scatter Channels. IEEE Trans. Antennas Propag. 2014, 62, 2238–2249. [Google Scholar] [CrossRef]
  22. Wagner, C.; Klokocni, J. The value of ocean reflections of GPS signals to enhance satellite altimetry: Data distribution and error analysis. J. Geod. 2003, 77, 128–138. [Google Scholar] [CrossRef]
  23. Jianfeng, S.; Xiaozhen, L. Discussion on the value of effective factor of earth radius in the calculation of radio wave propagation. J. Time Freq. 2010, 33, 32–38. [Google Scholar]
  24. Graziani, A.; Vanhoenackerjanvier, D.; Pereira, C.; Riva, C.; Vergani, A.; Lemorton, J. Synthetized tropospheric total attenuation time series for satellite-to-aeronautical link from L to Q band. In Proceedings of the 2016 10th European Conference on Antennas and Propagation (EuCAP), Davos, Switzerland, 10–15 April 2016. [Google Scholar]
  25. Cazzani, L.; Colesanti, C.; Leva, D.; Nesti, G.; Prati, C.; Rocca, F.; Tarchi, D. A ground-based parasitic SAR experiment. IEEE Trans. Geosci. Remote Sens. 2002, 38, 2132–2141. [Google Scholar] [CrossRef]
  26. Klein, L.; Swift, C. An improved model for the dielectric constant of sea water at microwave frequencies. IEEE Trans. Antennas Propag. 1977, 25, 104–111. [Google Scholar] [CrossRef]
  27. Meissner, T.; Wentz, F.J. The Complex Dielectric Constant of Pure and Sea Water from Microwave Satellite Observations. IEEE Trans. Geosci. Remote Sens. 2004, 42, 1836–1849. [Google Scholar] [CrossRef] [Green Version]
  28. Guan, K.; He, D.; Ai, B.; Matolak, D.W.; Wang, Q.; Zhong, Z.; Kürner, T. 5-GHz Obstructed Vehicle-to-Vehicle Channel Characterization for Internet of Intelligent Vehicles. IEEE Internet Things J. 2019, 6, 100–110. [Google Scholar] [CrossRef]
  29. Weihua, B. Study of the GNSS-R Ocean Remote Sensing Technique. Ph.D. Thesis, Chinese Academy of Sciences, Beijing, China, 2008. [Google Scholar]
  30. Yongxing, B. Study on Soil Moisture Remote Sensing Using GNSS-R Signals. Master’s Thesis, Beihang University, Beijing, China, 2013. [Google Scholar]
  31. Molisch, A.F. Wireless Communications; JOHN WILEY & SONS: Chichester, UK, 2011. [Google Scholar]
  32. Kobayashi, H.; Mark, B.L.; Turin, W. Probability, Random Processes, and Statistical Analysis; Cambridge University Press: Cambridge, UK, 2012. [Google Scholar]
  33. Haas, E. Aeronautical channel modeling. IEEE Trans. Veh. Technol. 2002, 51, 254–264. [Google Scholar] [CrossRef]
  34. Hoeher, P.; Haas, E. Aeronautical channel modeling at VHF-band. In Proceedings of the 1999 IEEE Vehicular Technology Conference (VTC Fall), Amsterdam, The Netherlands, 19–22 September 1999; pp. 1961–1966. [Google Scholar] [CrossRef]
  35. Fazli, E.H.; Werner, M. View Angle Statistics of Aircraft Airborne Antenna to GEO Satellites. In Proceedings of the 2009 International Workshop on Satellite and Space Communications, Tuscany, Italy, 9–11 September 2009. [Google Scholar]
  36. Zhu, Q.; Yang, Y.; Wang, C.; Tan, Y.; Sun, J.; Chen, X.; Zhong, W. Spatial Correlations of a 3-D Non-Stationary MIMO Channel Model With 3-D Antenna Arrays and 3-D Arbitrary Trajectories. IEEE Wirel. Commun. Lett. 2019, 8, 512–515. [Google Scholar] [CrossRef]
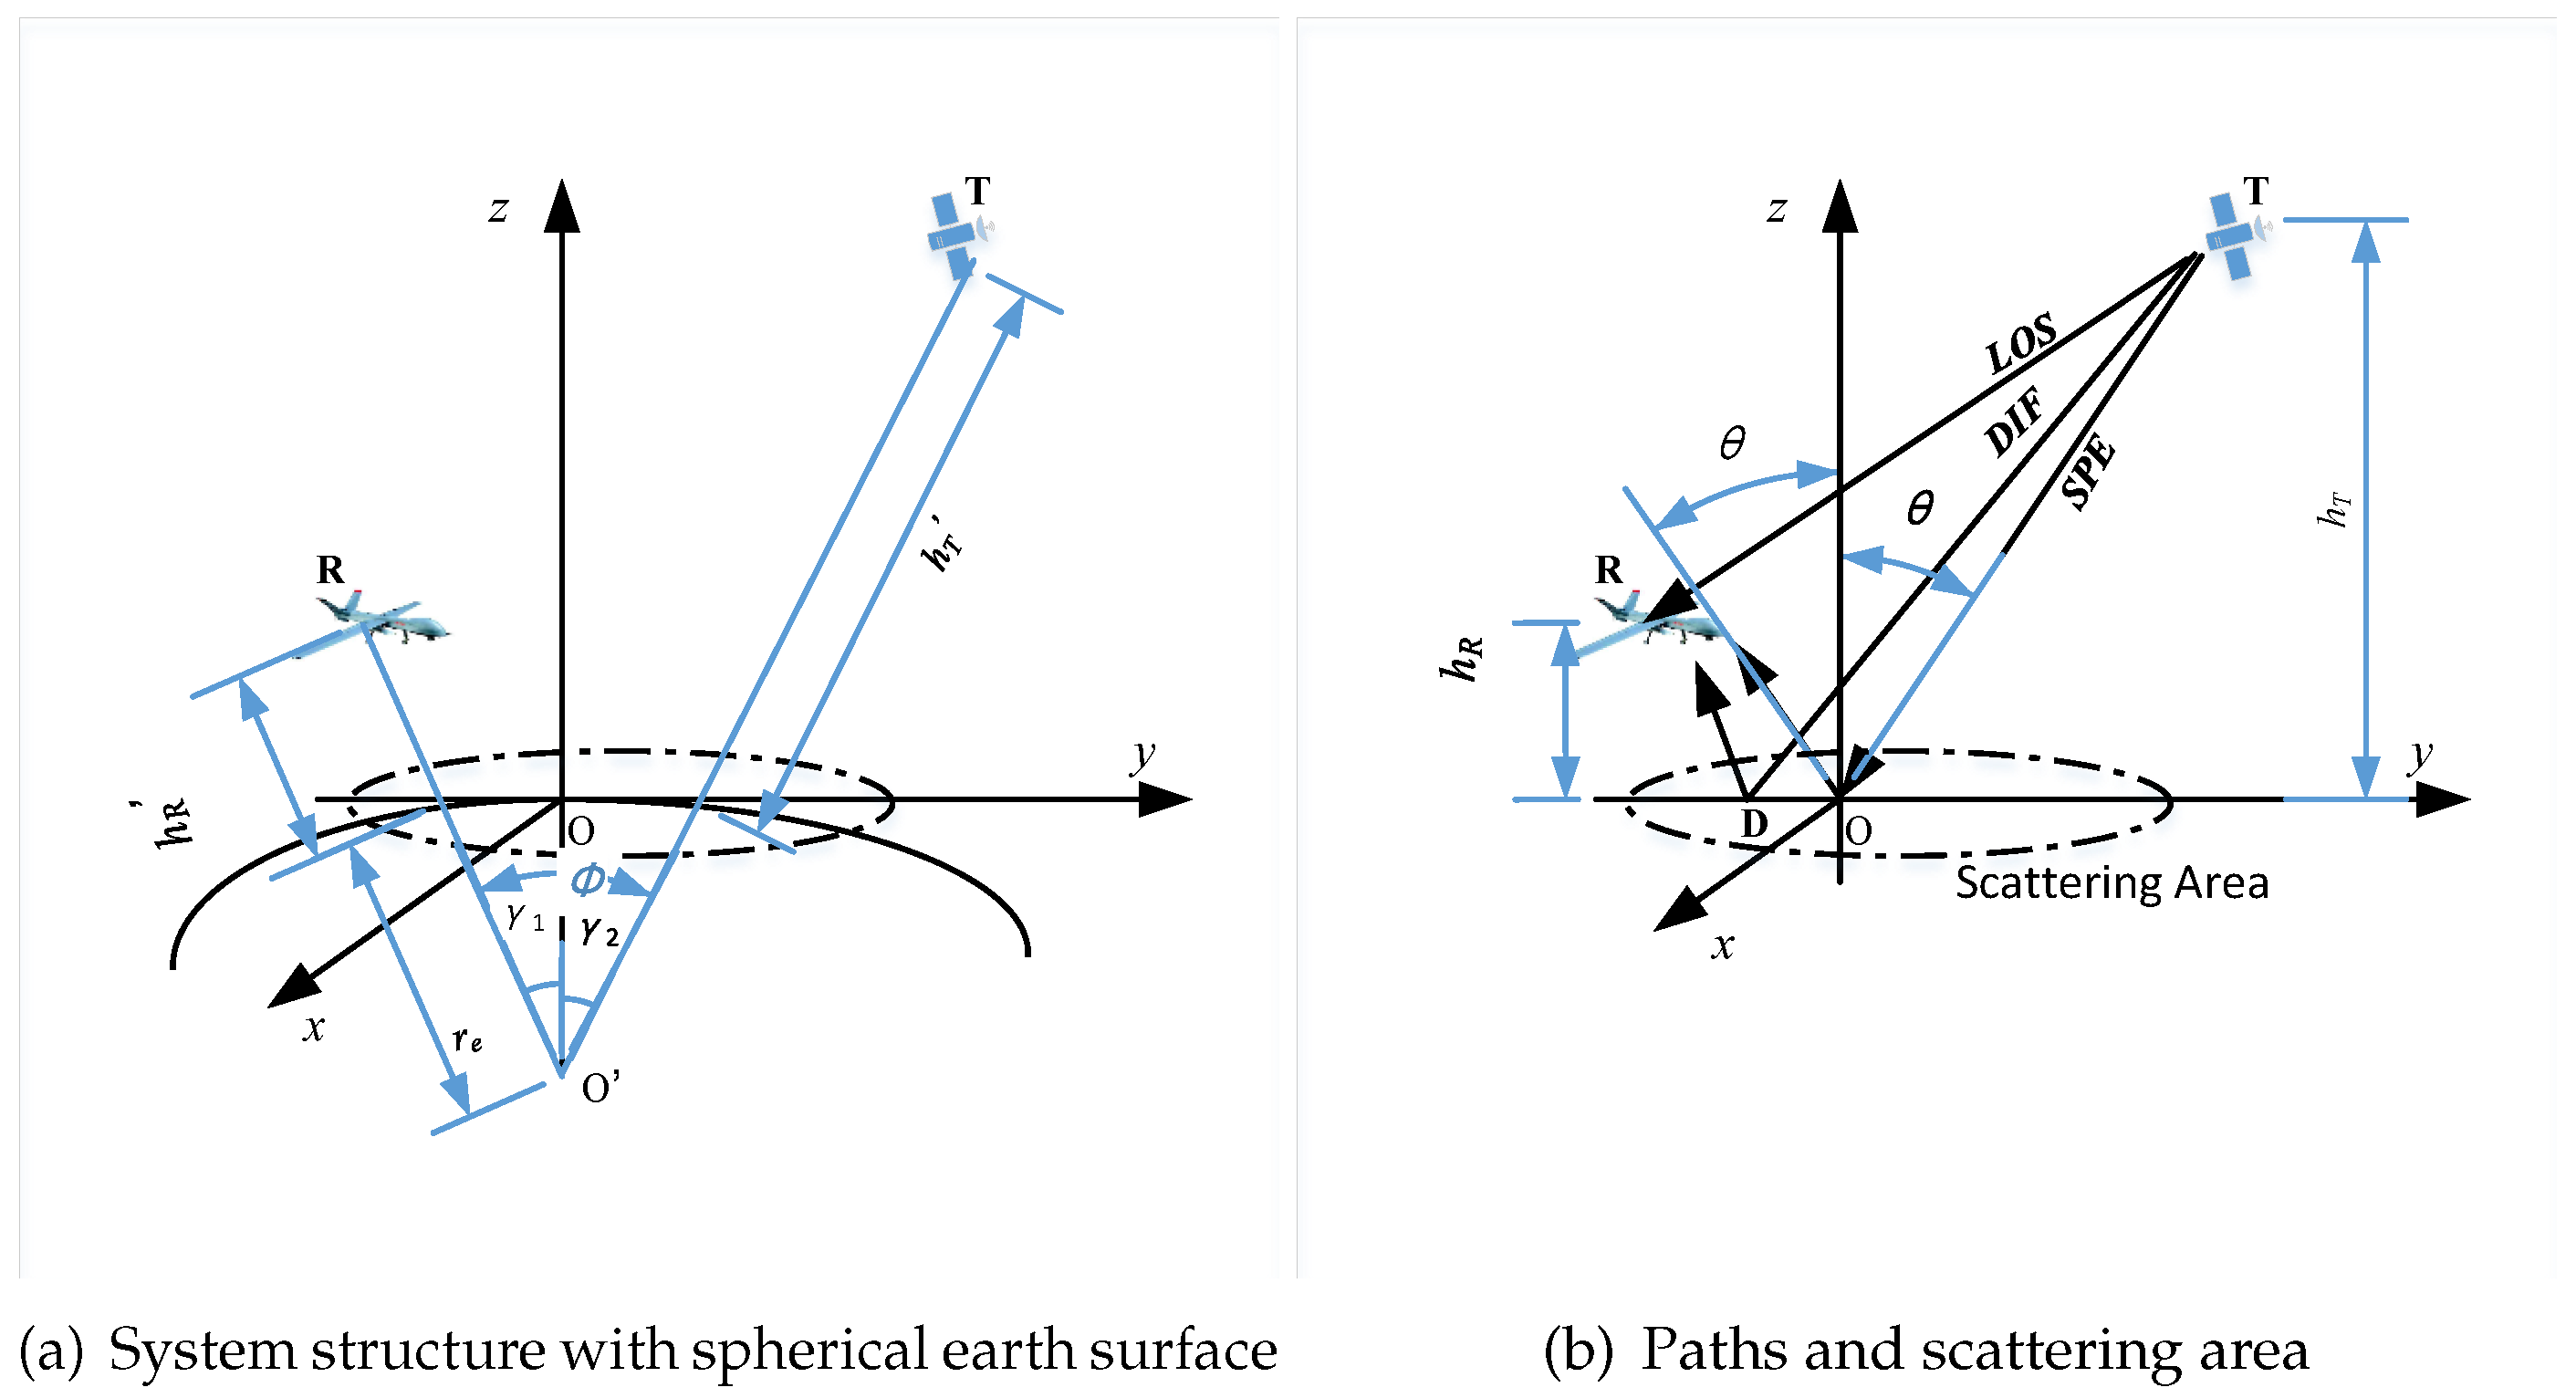
Figure 1. The geometrical structure of the system model.
Applsci 10 05041 g001
Figure 2. The structure of the scattering area(in XOY plane).
Applsci 10 05041 g002
Figure 3. The Trajectories of the Aircraft.
Applsci 10 05041 g003
Figure 4. The impulse response.
Applsci 10 05041 g004
Figure 5. The time-frequency channel transfer function of the scattering path.
Applsci 10 05041 g005
Figure 6. The normalized ACFs of the scattering path (Rising).
Applsci 10 05041 g006
Figure 7. The normalized ACFs of the scattering path (Cruising).
Applsci 10 05041 g007
Figure 8. The normalized ACFs of the scattering path (Descending).
Applsci 10 05041 g008
Figure 9. The normalized Doppler PSD (Rising).
Applsci 10 05041 g009
Figure 10. The normalized Doppler PSD (Cruising).
Applsci 10 05041 g010
Figure 11. The normalized Doppler PSD (Descending).
Applsci 10 05041 g011
Figure 12. The CDF of relative time delay.
Applsci 10 05041 g012
Figure 13. The CDF of relative path attenuation.
Applsci 10 05041 g013
Figure 14. The PDFs of normalized Doppler shift (Rising).
Applsci 10 05041 g014
Figure 15. The PDFs of normalized Doppler shift (Cruising).
Applsci 10 05041 g015
Figure 16. The PDFs of normalized Doppler shift (Descending).
Applsci 10 05041 g016
Table 1. Major parameters and symbols this paper.
SymbolDefinition
cThe speed of light
DThe scatterer
d LOS t Time variant distance between the transmitter and the receiver (length of the LOS path).
d SPE t The time variant length of the specular reflection path
d TO t The time variant distance between the transmitter T and the specular reflection point O
d OR t The time variant distance between the specular reflection point O and the receiver R
d DIF , l t The time variant length of the lth scattering sub-path.
fFrequency
G T LOS t The antenna gain of the receiver at the moment t along the LOS path
G R LOS t The antenna gain of the receiver at the moment t along the LOS path
G T SPE t The antenna gain of the receiver at the moment t along the specular reflection path
G R SPE t The antenna gain of the receiver at the moment t along the specular reflection path
G T , l DIF t The antenna gain of the receiver at the moment t along the specular reflection path
G R , l DIF t The antenna gain of the receiver at the moment t along the specular reflection path
h R The altitude of the receiver
h R t The time variant altitude of the receiver
h T The altitude of the transimitter
h T t The time variant altitude of the transimitter
h T The height of the transimitter
h R The height (the Z coordinate of R)
h R t The height (the Z coordinate of R)
h T The height (the Z coordinate of T)
h T t The time variant height (the Z coordinate of T)
h t , τ CIR of the channel
h LOS t , τ CIR of the LOS path
h SPE t , τ CIR of the specular reflection path
h DIF t , τ CIR of the scattering path
l l t The length of the half major aix of the scattering ellipse
l s t The length of the half minor aix of the scattering ellipse
LNumber of the scatterers
n RT t The unity directional vector of the LOS path from the transmitter towards the receiver
n TO The unit directional vector towards O observed from T
n RO The unit directional vector towards O observed from R
n TD , l The unit directional vector towards the lth scatterer observed from the transmitter T
n RD , l The unit directional vector towards the lth scatterer observed from the receiver R
O’The center of the earth
OThe origin of the XOY plane, also the specular reflection point
r e The radius of the earth
RThe receiver (aircraft)
S t The time variant area of the scattering ellipse
tTime
TThe transmitter (satellite)
v R t Time variant velocity vector of the receiver
v T t Time variant velocity vector of the transmitter
v R t Norm of time variant velocity vector of the receiver
v T t Norm of time variant velocity vector of the transmitter
x T t , y T t , z T t The time variant 3D coordinate of the transmitter
x R t , y R t , z R t The time variant 3D coordinate of the receiver
x D t , y D t , 0 t The time variant 3D coordinate of the scatterer
x D , l t , y D , l t , 0 t The time variant 3D coordinate of the lth scatterer
α LOS t Path attenuation of the LOS path
α SPE t Path attenuation of the specular reflection path
α DIF t Path attenuation of the scattering path
α DIF , l t Path attenuation of the lth scattering path
Δ t Time interval
Δ f Frequency interval
ε r e Relative dielectric permeittivity
γ 1 The angle between O’R and Z axis
γ 2 The angle between O’T and Z axis
Γ t Time variant reflection coefficient
Γ t Time variant reflection for vertical polarization
Γ t Time variant reflection coefficient for horizontal polarization
γ DIF Normalized Doppler shift of the scattering path
Φ The geocentric angle between T (the satellite) and R (the aircraft)
Φ t The geocentric angle between T (the satellite) and R (the aircraft)
ϕ l Additional phase shift of the lth scattering path
σ Radar cross section (RCS)
τ Delay
τ LOS t Time variant path delay of the LOS path at the moment t
τ SPE t Time variant path delay of the specular reflection path at the moment t
τ DIF t Time variant path delay of the scattering path at the moment t
τ DIF , l t Time variant path delay of the lth scattering path at the moment t
θ Reflection angle
θ t Time variant reflection angle
Table 2. Simulation Parameters.
ParameterValue
Altitude of the transmitter36,000 km
Initial altitude of the receiver (Rising, t = 0 s)300 m
Initial altitude of the receiver (Cruising, t = 0 s)11 km
Initial altitude of the receiver (Descending, t = 0 s)11 km
Initial horizontal distance between the transmitter and the receiver400 km
τ max τ SPE + 0.7 μ s τ LOS
Central frequency2 GHz
Ground velocity vector of the receiver (Rising) 0 , 222.2 , 5.94 m s
Ground velocity vector of the receiver (Cruising) 0 , 222.2 , 0 m s
Ground velocity vector of the receiver (Descending) 0 , 222.2 , 5.94 m s
Tap interval Δ t 0.1 μs
Number of taps7
number of scatterers L in CIR simulation100
number of scatterers L in CDF/PDF simulation1 × 109
G R , G T 15 dBi omini-directional
Table 3. Coefficients in Fitting Functions of CDFs of relative path attenuation α DIF with UD of D.
CasesCoefficientsRange of Relative α DIF ( dB )
Rising t = 0 s & Decending t = 1800 s a α , 0 = 0.5244 , a α , 1 = 0.4736 , b α , 1 = 0.1739 ,
a α , 2 = 0.005626 , b α , 2 = 0.1003 , w = 0.1795
18.4683 , 0
Rising t = 100 s & Decending t = 1700 s a α , 0 = 0.5498 , a α , 1 = 0.4946 , b α , 1 = 0.04013 ,
a α , 2 = 0.04481 , b α , 2 = 0.07103 , w = 0.374
8.6324 , 0
Rising t = 1100 s & Decending t = 700 s a α , 0 = 0.8712 , a α , 1 = 0.2077 , b α , 1 = 0.7888 ,
a α , 2 = 0.07236 , b α , 2 = 0.1293 , w = 0.9922
2.1539 , 0
Table 4. Coefficients in Fitting Functions of normalized Doppler shift γ DIF (Rising).
tFitting FunctionsCoefficients
t = 400 sPolynomial c 1 = 0.3246 , c 2 = 0.00763 , c 3 = 0.01599 , c 4 = 0.005074 , c 5 = 0.02261
t = 600 sPolynomial c 1 = 0.5116 , c 2 = 0.01115 , c 3 = 0.0005945 , c 4 = 0.004889 , c 5 = 0.02343
t = 800 sPolynomial c 1 = 0.7453 , c 2 = 0.01103 , c 3 = 0.01604 , c 4 = 0.003993 , c 5 = 0.02392