Abstract
Additive Manufacturing (AM) is viewed as a disruptive technology with the potential to replace many manufacturing processes. With its rapid proliferation in recent years, it is crucial to understand how to measure this technology’s social impacts. There are many studies available in the existing literature regarding the economic and environmental impacts of AM technology. However, research regarding the social impacts of this technology is still scarce. To this end, this research has developed a framework based on Social Life Cycle Assessment (SLCA) methodology to measure AM products’ social impacts throughout their life cycle stages. The proposed framework includes an underlying mathematical model that was developed to allow for the aggregation of indicator scores. Additionally, cut-off scores were determined to differentiate between positive and negative social impacts. This framework can be applied to case studies, which provides a final score that quantifies the social impacts of an AM product throughout all its life cycle stages. It also provides scores for each stakeholder category and life cycle stage, which facilitates the identification of hotspots that require attention from organizations.
1. Introduction
Additive Manufacturing (AM) technology, usually referred to as 3D printing, is gaining importance in various fields of business and industries due to its significant potentials [1]. Despite being an immature technology, AM has proved to have a considerable potential for sustainable manufacturing [2]. According to [3], “AM is expected to become a key manufacturing technology in the sustainable society of the future”. However, very few studies have been conducted regarding the understanding and assessment of AM social impacts [4]. This lack of knowledge leaves a research gap in the body of literature. This research aims to fulfill this gap by adopting a framework to assess the social impacts of an AM product throughout its different life cycle stages. In [5], the social impacts of a product are defined as the consequences of social interactions formed between the product’s surrounding system and the stakeholders engaged in the product life cycle.
Even though there are several tools and methods in the literature to assess the social impacts of products, the most common methodology among the international community, and also the most used methodology in case studies developed in this knowledge area is the Social Life Cycle Assessment (SLCA) [6]. SLCA is considered as a Life Cycle Assessment (LCA) methodology that complements the Environmental Life Cycle Assessment (E-LCA) and Life Cycle Costing (LCC), with the social and socio-economic aspects contributing to the full assessment of goods and services within the context of sustainable development [5]. SLCA can either be applied on its own or in combination with E-LCA and LCC. SLCA methodology assesses the social impacts of a product from a life cycle perspective by looking at the complete life cycle of a product, from extraction to disposal [5]. SLCA is the only social assessment methodology that considers the social impacts of products from a life cycle perspective [7].
There are various references and methodological frameworks when conducting a SLCA study. The authors in [8] have identified 14 SLCA methodological frameworks in their review. However, the general methodology for SLCA implementation mostly relies on the “UNEP/SETAC Guidelines for Social Life Cycle Assessment of Products” [5] from which more specific measurement frameworks or tools can be derived and, therefore, it is selected as the reference for this research. It provides guidance for the assessment of the social and socio-economic impacts of the products along their life cycle.
The research carried out for this paper revealed that several studies of SLCA were conducted to evaluate the social impacts of products manufactured by conventional manufacturing. However, no study was found that applied the SLCA methodology towards the social impacts of AM products. Therefore, the main objective of this study is to develop a SLCA framework to assess the social impacts of AM products on different stakeholders within different product life cycle stages. To this end, the present study focuses on the following objectives:
- Identification of possible indicators and metrics for measuring AM social impacts.
- Development of a mathematical model to support the assessment of AM social impacts.
This paper is structured into six sections. The first section presents the problem description and the objectives of the research. In the second section, the theoretical background considered relevant to the development of this study is presented. In the third section, a SLCA framework is proposed to assess the social impacts of an AM product throughout its life cycle. In the fourth section, an exploratory case study has been carried out in order to validate the initial set of indicators proposed in the developed framework. In the fifth section, research implications, limitations, and future directions are discussed. Lastly, in the sixth section, the conclusions of the study are presented.
2. Theoretical Background
This section begins with a brief overview of AM technology and continues with AM social impacts and SLCA, according to the UNEP/SETAC guidelines.
2.1. Additive Manufacturing (AM)
The term “Additive Manufacturing” refers to the technology or additive process of depositing successive thin layers of material upon each other, producing a final three-dimensional object [9]. In [10], AM is described as a digital technology, since it enables the production of physical objects from 3D computer-aid design (CAD) files. AM technology is considered to be a disruptive technology with the potential to replace many manufacturing processes in a nearing future [11]. AM technology will also influence several processes engaged in the value chain of a product, such as logistics, supply chain design, product planning, and consumer behavior. Moreover, new business models, new supply chains, and new products will be created with the continuous use of this technology [1].
2.2. Additive Manufacturing Social Impacts
As mentioned earlier, AM is a disruptive technology that is changing the industry. Generally, the impact of disruptive technologies on people and society, when they first emerge, is unclear. With the increasing use of AM technology in recent years, several researchers have now focused their efforts on studying the sustainability implications of this technology. The majority of these studies have either been highly focused on material and energy consumption (e.g., in [12,13,14]), or have been done on a broader level, referring to general aspects of sustainability (e.g., in [2,6,15]). Nonetheless, academic studies focusing on the social impacts of this technology are limited [4]. To date, the most detailed study on this topic is the review paper by [3], in which the authors addressed the social impacts of this technology in several areas, namely on population health and well-being, energy consumption and environment, manufacturing supply chains, and potential health and occupational hazards. More recently, [16] has also addressed and identified 26 social impacts of AM technology.
2.3. Social Life Cycle Assessment (SLCA)
In this research, SLCA is considered as a general methodology, from which other (more specific) measurement frameworks or tools can be derived. Some authors refer to it as a methodology [8,17], whereas some others as an approach [7,18]. The general SLCA comprises a set of phases to measure the social impacts of a product. It includes methods and techniques to collect and manipulate the data. The social and socio-economic aspects assessed by this general methodology are related to the production processes and other business practices that take place along the life cycle of a product and are accountable for positive or negative impacts on stakeholders [19]. The main goal of conducting a SLCA study is to improve the social conditions of a product throughout its life cycle. It also aims to incite a dialogue between the decision-makers on the importance of social and economic aspects of production and consumption in an attempt to improve organizations’ performances, and consequently, the well-being of its stakeholders [20]. According to [21], SLCA can be used to identify, study, and report social impacts in order to support the implementation of strategies or action plans.
2.4. SLCA According to UNEP/SETAC Guidelines
The publication of the guidelines [5] and its complementary methodological sheets [22] was considered a cornerstone in SLCA development, giving practical guidance on how to conduct SLCA [23]. As a result, following their publication, the number of case studies applying this methodology in different products and organizations has exponentially increased [24]. Nowadays, SLCA is still being applied in several case studies and in different international projects, contributing to the improvement of the methodology.
According to the UNEP/SETAC guidelines, the social impacts can be observed in five main stakeholder categories, as Worker, Local Community, Society, Value Chain Actors, and Consumer. These categories are clusters of stakeholders that are expected to have shared interests, due to their connection to the product under assessment. Each stakeholder category is associated with a number of subcategories, which are socially significant themes or attributes. The subcategories are classified according to stakeholder categories and are evaluated by means of inventory indicators. Several indicators may be used to assess each of the subcategories. Each inventory indicator explicitly defines the data to be collected. According to [5], inventory indicators can be described as specific definitions of the data sought, and they are considered the most direct evidence of the condition or result of what is intended to be measured. Inventory indicators can be quantitative, semi-quantitative, or qualitative. Some social impacts can be better captured using quantitative indicators, while others may be better captured by semi-quantitative or qualitative indicators. Thereby, the type of indicator to be used in the assessment depends on the goal of the study and the nature of the issue that is being addressed.
Another aspect that can be considered in the characterization of the indicators is the direction of the impact. According to [25], indicators may have a positive or negative desired direction for sustainability, depending on the nature of the social impact being measured. Social impacts can directly affect the organization’s stakeholders, either positively or negatively [21]. Thus, indicators with a positive desired direction for sustainability, such as employee work satisfaction or percentage of the workforce hired locally, are used to measure the social impacts that affect the stakeholders in a positive way [25]. On the other hand, the indicators with a negative desired direction for sustainability are used to measure the social impacts that negatively affect the stakeholders (e.g., the number of occupational accidents, the gender gap, child labor, etc.).
The main source of social indicators are the UNEP/SETAC methodological sheets [22]. They provide a list of more than 100 inventory indicators to assess each subcategory. Moreover, they identify whether data are available in quantitative, semi-quantitative, or qualitative type and provide data sources for each indicator. In their research [26] identified and analyzed 141 papers to study trends, consistencies, and gaps in research on the SLCA indicators. The authors argue that researchers should select the minimum set of the most important social indicators to assess the stakeholders, based on empirical experience, instead of common sense, across all industry sectors.
3. SLCA Framework Development
In this section, a SLCA framework will be proposed to study the social impacts of AM products. The first part will provide a brief overview of the proposed framework. Next, each one of the necessary phases for the development of the proposed framework will be described in greater detail.
3.1. Overview of the Proposed Framework
In order to assess the social impacts of a product manufactured by AM technology, this paper proposes a SLCA framework, which is based on the UNEP guidelines and four identified case studies in the literature [7,18,27,28]. The methods developed by these authors were used and adapted for the adoption of the proposed framework—more specifically, in the calculation of the indicators, in the scoring system, and the aggregation of the indicators’ scores. The framework aims to assess the social impacts of an AM product across its whole life cycle and, as a result, it is intended to provide a clearer perception of both the positive and negative social impacts associated with a product developed by AM technology. The proposed framework considers a set of indicators to measure the social impacts of an AM product in different subcategories, stakeholder categories, and life cycle stages. These indicators are then aggregated to obtain a single score that translates the social impact of a product produced by AM technology.
3.2. Framework Development
The UNEP guidelines for SLCA and its complementary methodological sheets were the main references for developing the SLCA framework for AM products. The four main phases of the SLCA framework were adapted to address the research objectives. The proposed framework presented in this study consists of the five following phases:
- Phase 1—Goal and scope definition
- Phase 2—Selection of stakeholder categories, subcategories, and indicators
- Phase 3—Data collection process
- Phase 4—Aggregation method
- Phase 5—Interpretation of the results
In order to develop this framework, the following assumptions were also made:
- The assessment of the social impacts of the product is determined through the assessment of the social performance of the organizations involved in the value chain of the AM product [18].
- All stakeholders could be affected in each life cycle stage; however, in a real case setting, this cannot be applied and, therefore, a selection of the stakeholders affected within each life cycle stage must be carried out.
- All stages of the product life cycle produced by AM technology are of equal importance to the present study and, for calculation purposes, all carry equal weights. Furthermore, within each life cycle stage, all of the indicators also have equal weights.
The next part of this section will explain in detail each of the phases for the developed framework in this study.
3.2.1. Phase 1—Goal and Scope Definition
The main goal of the proposed framework is to provide a quantitative method to assess the social impacts of an AM product throughout its whole life cycle. In the scope, the limits are defined regarding the life cycle of the AM product. Most of the studies in the literature regarding SLCA, adopt a “cradle to grave” approach, in which all life cycle stages from extraction to disposal are included. In this study, the “product design” stage is also considered, as designers have to make many decisions at this stage regarding the dimensions and materials used in creating the AM product, which will have significant impacts on the other life cycle stages [6]. Therefore, a “conception to grave” [6] life cycle point of view is adopted for the present study, in which the AM product life cycle can be divided into the following five main stages:
- Product design
- Raw materials production
- Manufacturing
- Use
- End of life
3.2.2. Phase 2—Selection of Stakeholder Categories, Subcategories, and Indicators
Within each life cycle stage of the product, there will be different stakeholders involved who will be affected in different ways when interacting with the product. In this framework, the five main stakeholder categories, as shown in Table 1, stated in the UNEP/SETAC Guidelines, and their respective subcategories relevant to AM social impacts are considered. The proposed framework does not consider all the subcategories mentioned in the UNEP/ SETAC Guidelines, as some of them (to the knowledge of the authors) do not bring any relevance to the context of AM technology social impacts. This framework also considers the subcategory of “Psychological working conditions”. The idea of expanding the analysis on workers beyond physical well-being was first mentioned by [29] and then developed by [30]. This subcategory is strictly related to work satisfaction within the workforce and is defined by the degree of workers’ willingness to continue fulfilling the same function and/or to continue working in the same organization [31].

Table 1.
Selected indicators.
In this study, the indicators are classified according to their type and desired direction for sustainability. The study of the social impacts of AM technology is still at an early stage and, as such, very few indicators for measuring the social impacts of this technology have been proposed [4]. The authors from [16] studied the social impacts of AM technology and proposed several indicators specific to this technology. Some of the indicators proposed by [16] were screened and adapted for the needs of the present study. The selection was made according to their relevance, applicability in the study, and data availability. These indicators are specific to AM technology and are marked with the sign “b” in Table 1. Since only a few AM-specific indicators were found in the literature, other general but applicable indicators, screened from the UNEP/SETAC methodological sheets, and previous case studies, were also considered in the study. The indicator “percentage of local suppliers” is proposed by the authors.
3.2.3. Phase 3—Data Collection Process
For this study, different data collection methods were adopted depending on the indicators’ characteristics. Hence, the selected indicators were divided into four groups on the basis of the data collection method. For each group, a calculation method and a scoring system to assess the indicator results are proposed, as shown in Appendix A, Appendix B, Appendix C and Appendix D. Table 2 contains the summary specifications of each group.
Table 2.
Indicator groups.
3.2.4. Phase 4—Aggregation Method
Following step 3, it is necessary to define a mathematical model to aggregate the scores of the indicators into a single final score that corresponds to the product life cycle score. In this framework, the scores are aggregated at each level of the assessment (i.e., subcategory, stakeholder category, life cycle stage, and finally the product life cycle). Figure 1 considers the “Manufacturing” life cycle stage to exemplify how the aggregation method works. The same procedure is applied to obtain the scores for other life cycle stages of an AM product. Finally, the scores of all life cycle stages are aggregated into an overall score that corresponds to the AM product life cycle score. This final aggregate score can be any value between 1 and 5, which demonstrates the social impact of the AM product towards its stakeholders.
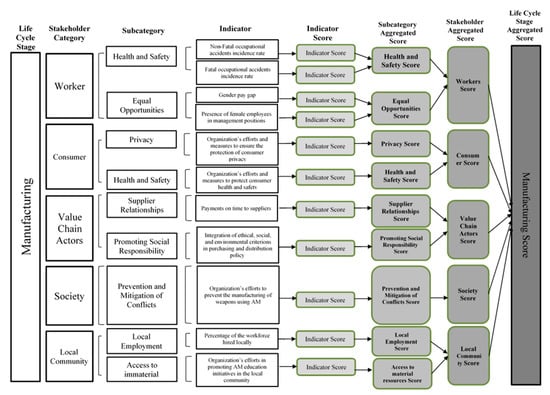
Figure 1.
Aggregation of scores for the Manufacturing stage.
In order to aggregate the different scores, it is necessary to use a mathematical method. In [18] an aggregation method was developed to conduct a social assessment of the Indian steel sector. They assign equal weights to each indicator, facilitating indicator normalization. In order to normalize an indicator, after multiplying the indicator score by the indicator weight, it is necessary to divide the obtained value by the maximum score value that can be assigned to an indicator. The normalized scores are then aggregated within each life cycle stage by summing up the scores of their respective stakeholder categories. In this way, a score between 0.20 and 1 is assigned to each life cycle stage. The final score of the product’s social impact is equal to the summation of all the life cycle stage scores, which is between 1 and 5. The structure of the aggregation method developed in the present study follows the method introduced by [18] and is illustrated in Figure 2. The method is comprised of the following steps:
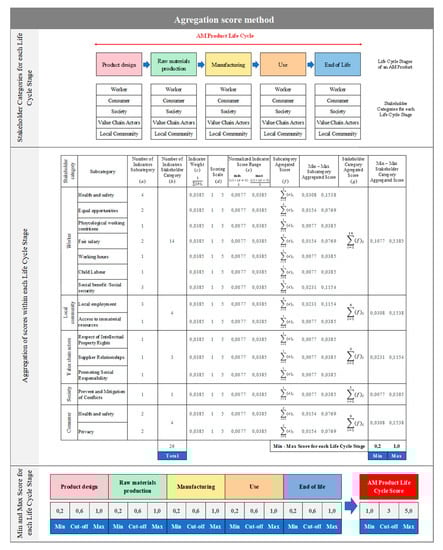
Figure 2.
Aggregation score method.
- Step 1: Indicator weights
The first step is to determine the indicators’ weights. As previously stated, equal weights are assigned to the indicators within each life cycle stage. The main reason for not assigning different weights to the indicators is to keep the approach as simple as possible due to the pilot nature of the study. As shown in Equation (1), the weight of each indicator is obtained by dividing 1 by the total number of indicators considered in each life cycle stage.
- Step 2: Normalizing the indicator score
Following the score assignment and the definition of the indicator weight, the indicators’ scores must be normalized. As shown in Equation (2), the indicator score is normalized by multiplying the indicator score with the indicator weight and dividing it by five, which corresponds to the maximum score value that can be assigned to an indicator.
where: indicator i weight is the weight assigned to the indicator i and Score i is the score assigned to indicator i.
Since the scoring scale for each indicator is set between 1 and 5, the minimum value for the Normalized Indicator Score, is (Indicator i weight × 1)/5, and the maximum value for the Normalized Indicator Score is (Indicator i weight × 5)/5. These values show the range of possible values for the indicator normalized score when conducting a case study.
- Step 3: Aggregating the indicators scores at the subcategory level
Once the scores are normalized, the aggregation process can begin. The indicators’ scores are first aggregated at the subcategory level. As shown in Equation (3), the aggregated score of each subcategory is given by the summation of the normalized indicators’ scores used to assess the respective subcategory.
where (e)i is the indicator normalized score used to assess the subcategory and n is the number of indicators used to assess the subcategory.
The minimum possible score for the subcategory is obtained by multiplying the number of indicators used to assess the subcategory with the minimum possible value for the normalized indicator score. On the contrary, the maximum possible score for the subcategory is obtained by multiplying the number of indicators used to assess the subcategory with the maximum possible value for the normalized indicator score.
- Step 4: Aggregating the subcategories scores into stakeholder category scores
This step consists of aggregating the subcategories’ scores into stakeholder categories aggregated scores. In order to do this, Equation (4) is applied. The stakeholder category aggregated score is given by the summation of the subcategories’ aggregated scores that are related to the stakeholder category.
where (f)i is the subcategory aggregated score associated with the stakeholder category and n is the number of subcategories associated with the stakeholder category.
The minimum possible score for the stakeholder category is obtained by multiplying the number of indicators used to assess the stakeholder category with the minimum possible value for the normalized indicator score. On the contrary, the maximum possible score for the stakeholder category is obtained by multiplying the number of indicators used to assess the stakeholder category with the maximum possible value for the normalized indicator score.
- Step 5: Life cycle stage aggregated score
Within each life cycle stage, different stakeholders can be affected by the interaction with the product. Thus, the life cycle stage aggregated score (h)i is given by the summation of the aggregated scores of the stakeholders affected in the life cycle stage, as shown in Equation (5).
where (g)i is the stakeholder category aggregated score affected in the life cycle stage and n is the number of stakeholder categories affected in the life cycle stage.
The aggregation of the stakeholder categories scores results in a score ranging between 0.2 and 1 for each life cycle stage, as shown in Figure 2. A score of 0.2 corresponds to the minimum possible score for each life cycle stage and is obtained if all the indicators are assigned a score of 1. On the other hand, a score of 1 corresponds to the maximum possible score for each life cycle stage and is obtained if all the indicators are assigned a score of 5. Since all the indicators’ scores are normalized for each life cycle stage in step 2, the minimum and maximum scores for each life cycle stage will always be between 0.2 and 1, regardless of the number of indicators and stakeholder categories considered in each life cycle stage.
- Step 6: Product life cycle final score
The last step of the method consists of aggregating the life cycle stages’ aggregated scores into the single final score of the product life cycle (p). As shown in Equation (6), the final score for the product life cycle is given by the summation of the life cycle stages’ aggregated scores considered in the product life cycle.
where (h)i is the life cycle stage aggregated score considered in the product life cycle and n is the number of life cycle stages considered in the product life cycle.
In this study, it is assumed that five distinct life cycle stages constitute the AM product life cycle. Therefore, the score assigned to the product life cycle ranges between 1 and 5. The score of 1 corresponds to the minimum possible score and is given by the sum of the minimum possible scores of the five life cycle stages (0.2 + 0.2 + 0.2 + 0.2 + 0.2 = 1). On the other hand, the score of 5 corresponds to the maximum possible score and is given by the sum of the maximum possible scores of the five life cycle stages (1 + 1 + 1 + 1 + 1 = 5).
3.2.5. Phase 5—Interpretation of the Results
In order to interpret the meaning of the aggregated scores, cut-off scores were determined for each level of the assessment to differentiate the positive from the negative social impacts. The cut-off score has been set as the mid score between the minimum and maximum possible scores for each level of the assessment, as shown in Equation (7).
Different score bands were adopted to allow for a more specific categorization of the social impacts. Specific details regarding the score interpretation will be presented for each level of the assessment in the next subsections.
The subcategories are assessed by a different number of indicators, which means that the subcategories will have different minimum, maximum, and cut-off scores depending on the number of indicators considered. From analyzing Figure 2, it is possible to observe that the subcategory “privacy” in the stakeholder “Consumer”, which is comprised of two indicators, has a minimum and maximum aggregated score of 0.0154 and 0.0769. As a result, the cut-off score of the subcategory is set as 0.04615, which means that, if the subcategory aggregated score is above this value, the social impact is positive. However, if the subcategory aggregated score is under this value, the social impact is negative. The same rationale is applied to the interpretation of the scores for the stakeholder categories. This is especially applicable in the case of the stakeholder categories, since it allows for the identification of stakeholders that are experiencing the most negative impacts within each life cycle and, consequently, they are negatively affected by the social impacts of the product.
As previously mentioned, all the five life cycle stages considered in the study are assigned a score between 0.2 and 1, which corresponds to the minimum and maximum possible scores. The cut-off score is set as 0.6, since it is the median score between 0.2 and 1, as shown in Figure 2. Scores above 0.6 indicate a positive social impact by the product on the life cycle stage, whereas scores below 0.6 indicate the contrary. A score between 0.2 and 0.4 corresponds to a highly negative social impact, a score between 0.4 and 0.6 corresponds to a negative social impact, a score between 0.6 and 0.8 corresponds to a positive social impact, and finally a score between 0.8 and 1 corresponds to a highly positive social impact. The life cycle stages with scores between 0.2–0.4, and 0.4–0.6 are identified as hotspots that should be investigated further.
The product’s final score corresponds to the sum of the five life cycle stages’ scores considered in the study. Aggregating the score for each life cycle stage will result in the overall score of the product life cycle ranging between 1 to 5. The cut-off score for the product life cycle is set as 3, since it is the median score between 1 and 5. The rating scale proposed for the overall social impact of the AM product life cycle is classified as highly negative, negative, positive, and highly positive when assigned a score ranging from 1–2, 2–3, 3–4, and 4–5, respectively.
4. Exploratory Case Study
According to [36], the case study approach is most suited for research areas that are either new or for which the existing theory is incomplete. According to [37], case studies can be used for different research purposes, such as exploratory, theory-building, and theory testing. The case study developed for the present study is exploratory, since it aims to validate the initial set of indicators proposed in the developed methodology. The research purpose is to determine if these indicators really capture/reflect the social impacts of AM technology.
The case study was conducted in a company based in Bristol, England, which specializes in manufacturing compact heat exchangers using AM technology. The company was founded in 2012 by two employees. In the last few years, the company has been continuously growing and currently has around 50 employees, most of whom are expert engineers qualified with Ph.D. or Masters level degrees. The AM technique used by this company is Selective Laser Melting (SLM). The company currently has eight 3D printers. Its main costumers are in the automotive sector; however, due to the unique characteristics of its products, the company recently entered other markets, such as aerospace, defense, energy generation, and motorsports.
In this case study, both primary and secondary data were used. The secondary data were collected through the company’s website and provided detailed and reliable information about the company’s structure, as well as its main products and processes. For the collection of the primary data, a structured interview questionnaire was developed considering the initial set of proposed indicators. The goal of the questionnaire was to capture how AM technology affects each of the indicators, more specifically whether AM increases, decreases, or does not have any impact on them. The responses were provided according to the perception of the respondent—who was, at the time, an engineer working in the area of quality and inspection—on the effects of AM technology on the social performance of the organization. The indicators that were considered to have no impact were excluded. The results of the questionnaire are presented in Table 3. The answers (“Increase”, “Decrease”, “No Impact”) are given, according to the respondent’s perception of the effects of AM technology on the social performance of its organization. For some indicators, the respondent was not able to identify the impact of AM technology so, in these cases, the phrase “Does not know” is displayed in the response column. Supporting evidence for the answers are also given. Based on the responses, from the initially proposed 26 indicators, 21 were selected, and 5 were regarded as “No impact”, which were excluded. It was also possible to determine the type of impact (i.e., positive or negative).
Table 3.
Results of the questionnaire.
5. Research Implications, Limitations, and Future Directions
To date, there are still very few published works regarding the social impacts of AM technology, and this research is among the first. The proposed framework can be perceived as an elementary step in measuring the social impacts of an AM product from a life cycle perspective. With the application of the proposed framework in a case study, it will be possible to identify the positive and negative social impacts associated with an AM product. The scoring system of the proposed framework would allow organizations to identify negative social impacts throughout the value chain of an AM product (at different levels of assessment), and subsequently, find alternatives/solutions to address them. The provided cut-off scores by the framework allow for the identification of hotspots within each life cycle stage that enables organizations to concentrate their efforts on finding specific measures and solutions. Furthermore, it will be possible to understand which stakeholders are most likely to be affected and which life cycle stages will have the most critical social performance.
Due to the pilot nature of this study regarding AM technology and its social impacts, a set of limitations was found during the research, namely, the stakeholders addressed in the framework were solely those mentioned in the UNEP/SETAC guidelines. It is possible that more stakeholders could be affected by the social impacts of an AM product. Additionally, the framework needs further validation from specialists in the field so it can be applied in real case studies.
The proposed framework in this research is expected to provide a solid foundation for future work. The proposals for future work are:
- Validating the applicability of the framework through various case studies in several AM companies engaged in different industries (e.g., biomedical, automotive, aeronautical [38], etc.), since they have different preferred production processes, quality restrictions, and cost models, where it is also possible to collect the necessary data for measuring the proposed indicators.
- Validating the proposed framework with different types of AM processes, since the social impacts may be different for each type of AM process.
- Examining the framework for conventional manufacturing processes (e.g., machining, and comparing the results with an AM scenario to study the differences between social impacts in contrasting manufacturing settings).
- Assigning different weights to the indicators, stakeholders, and life cycle stages according to their relevance/importance in the context of AM (e.g., using fuzzy logic).
- Exploring in detail which stakeholders are affected in each life cycle stage of the AM product.
- Including other possible stakeholder categories and subcategories based on their relevance to AM technology social impacts.
- Studying the feasibility of applying the proposed framework simultaneously with E-LCA and LCC methodologies regarding a specific AM product. This way, it may be possible to comprehensively investigate and measure the social, environmental, and economic impacts of an AM product.
- Exploring, within the framework, other AM social impacts and their connections with stakeholders and their respective subcategories.
- Validating the applicability of the social indicators used in the proposed framework and exploring more indicators specific to the context of AM technology.
- Assessing the final results when the framework is applied by different analysts to the same case study under the same conditions (i.e., the extent to which different analysts reach the same results).
6. Conclusions
The present study proposes a framework based on the “cradle to grave” concept to assess the social impacts of AM products across different life cycle stages. At each stage, different people, entities, or organizations (i.e., stakeholders) are affected. The stakeholder categories used in this framework are those proposed by [5]. Each stakeholder category is structured into subcategories (i.e., socially significant issues of interest to the stakeholders), in order to better identify the context(s) in which they would be affected. The proposed SLCA framework makes use of specific indicators to measure the social impacts of AM products. These indicators have a desired direction for sustainability that can be either positive or negative, depending on the nature of the social impact. From the body of literature, a total of 26 indicators were identified. After selecting the stakeholders, subcategories, and indicators, necessary metrics were specified to determine how the indicators would be calculated and aggregated in order to obtain a final score that corresponds to the social impact of an AM product. Finally, in order to support the implementation of the proposed SLCA AM framework, a mathematical model was developed. When the necessary data are provided, the model calculates the indicators’ scores, the life cycle stages’ scores, and the overall score of the AM product life cycle. With this model, it is possible to directly apply the framework to case studies to assess a variety of social impacts originating from products manufactured by AM technology.
Author Contributions
Formal analysis, H.C. and C.J.; supervision, H.C.; writing—original draft, B.N. and F.L.; writing—review and editing, R.G. All authors have read and agreed to the published version of the manuscript.
Funding
The authors gratefully acknowledge the funding of project FIBR3D (POCI-01- 0145-FEDER-016414), co-financed by Fundo Europeu de Desenvolvimento Regional (FEDER) and by national funds through Fundação para a Ciência e Tecnologia, Portugal. Also, acknowledge Fundação para a Ciência e Tecnologia (FCT-MCTES) for its financial support via the project UIDB/00667/2020 (UNIDEMI) and project KM3D (PTDC/EME-SIS/32232/2017).
Conflicts of Interest
The authors declare no conflict of interest.
Appendix A. Example for the Calculation Method Used in Group 1 Indicators
In this appendix, the calculation method for the indicator “Non-fatal occupational accidents incidence rate” is presented. For calculation purposes, whenever it is necessary to use data collected in the organization, random data are considered.
Indicator: Non-fatal occupational accidents incidence rate.
This indicator reveals the ratio of occupational injuries amongst the workforce in the company per year per 100,000 employees [33]. This indicator is calculated through the equation demonstrated below:
The first step is to collect relevant data in the organization under assessment regarding the number of non-fatal accidents that occurred in the year n-1 and the total number of workers in the organization. Assuming that the number of non-fatal accidents occurred in the year n-1 is 3 and the total number of workers in the organization is 80, then the incident rate in the organization is as follows:
Then, national statistical data are needed to calculate the social impact percentage. Admitting that the organization operates in Portugal, then the data used as PRP must be referred to the social context in Portugal. According to the International Labor Organization (ILO) database, the incidence rate in Portugal in 2015 was 2954.2 (. The proportion between the incidence rate in the organization and the incident rate in Portugal is given by the social impact percentage calculated below:
This indicator has a negative desired direction for sustainability; therefore, the social impact percentage calculated must be classified into one of the nine categories of social impact percentages of the scoring system, presented in Table A2. Clearly, the social impact percentage calculated (126.94%) falls within the range of 125 to 150%; therefore, the final score assigned to the indicator is 2. Table A1 summarizes the calculation method used in this example.
Table A1.
An illustrative example for indicator score calculation in Group 1.
Table A1.
An illustrative example for indicator score calculation in Group 1.
| Indicator | Incidence Rate in the Organization (% 000) (a) | Incidence Rate in Portugal (% 000) (b) | Social Impact Percentage (=((a)/(b)) × 100) (%) | Desired Direction for Sustainability | Score |
|---|---|---|---|---|---|
| Non-fatal occupational accidents incidence rate | 3750 | 2954.2 a | 126.9% | Negative | 2 |
Table A2.
Scoring system for group 1 indicators.
Table A2.
Scoring system for group 1 indicators.
| Positive Desired Direction for Sustainability | |||||||||
|---|---|---|---|---|---|---|---|---|---|
| Social impact percentage (%) | <25 | 25–50 | 50–75 | 75–100 | 100 | 100–125 | 125–150 | 150–175 | >175 |
| Score | 1 | 1.5 | 2 | 2.5 | 3 | 3.5 | 4 | 4.5 | 5 |
| Negative Desired Direction for Sustainability | |||||||||
| Social impact percentage (%) | >175 | 150–175 | 125–150 | 100–125 | 100 | 75–100 | 50–75 | 25–50 | <25 |
| Score | 1 | 1.5 | 2 | 2.5 | 3 | 3.5 | 4 | 4.5 | 5 |
Appendix B. Example for the Calculation Method Used in Group 2 Indicators
In this appendix, the calculation method for the indicator “Percentage of the workforce hired locally” is presented. For calculation purposes, whenever it is necessary to use data collected in the organization, random data are considered.
Indicator: Percentage of the workforce hired locally.
This indicator demonstrates the ratio of the workforce in the organization that is from the local community [22]. The indicator is given in the form of a percentage and is calculated through the equation presented below:
In order to calculate this indicator, first the data must be collected through the documentation provided by the organization regarding the actual place of residence of the workers. Assuming that the number of workers who are from the local community is 55 and the total number of workers in the organization is 100, the percentage of the workforce hired locally is:
Since the indicator has a positive desired direction for sustainability (the higher, the better), the percentage must be classified into one of the five percentage categories in the scoring system, presented in Table A4. As it can be observed, the percentage calculated (55%) falls within the range of 40–60%; therefore, the final score assigned to the indicator is 3. Table A3 summarizes the calculation method used for this example.
Table A3.
An illustrative example for indicator score calculation in Group 2.
Table A3.
An illustrative example for indicator score calculation in Group 2.
| Indicator | Number of Workers from the Local Community (a) | Total Number of Workers in the Organization (b) | Percentage of the Workforce Hired Locally (=((a)/(b)) × 100) | Desired Direction for Sustainability | Score |
|---|---|---|---|---|---|
| Percentage of the workforce hired locally | 55 | 100 | 55% | Positive | 3 |
Table A4.
Scoring systems for group 2 indicators.
Table A4.
Scoring systems for group 2 indicators.
| Positive Desired Direction for Sustainability | |||||
|---|---|---|---|---|---|
| Percentage (%) | 0–20 | 20–40 | 40–60 | 60–80 | 80–100 |
| Score | 1 | 2 | 3 | 4 | 5 |
| Negative desired direction for sustainability | |||||
| Percentage (%) | 80–100 | 60–80 | 40–60 | 20–40 | 0–20 |
| Score | 1 | 2 | 3 | 4 | 5 |
Appendix C. Example for the Calculation Method Used in Group 3 Indicators
In this appendix, the calculation method for the indicator “Preventive measures and emergency protocols regarding accidents and injuries” is presented. For calculation purposes, whenever it is necessary to use data collected in the organization, random data are considered.
Indicator: Preventive measures and emergency protocols regarding accidents and injuries.
This indicator reveals the competence of the measures taken to ensure the well-being of the workforce [16,22].
The first step is to collect data regarding the efforts of the organization in ensuring the health and safety of its workforce. These data can be collected through the documentation provided by the organization and interviews with the managers of the organization. To have concrete proof that the measures are being executed in the organization’s daily work, observations during field visits at the organization facilities should also be done to collect the necessary data.
Following the data analysis, the authors assign a level of implementation (such as, not implemented, partially implemented, or fully implemented) to each element addressed in this method, according to their interpretation of the data collected in the previous step. As shown in the example of Table A5, the authors considered that the elements Communication and Monitoring are fully implemented (meriting a score of 1), but the elements Policy, Deployment, and Response are only partially implemented (meriting a score of 0.6) so, the final score for the indicator is be 3.8 (0.6 + 1 + 0.6 + 1.0 + 0.6).
Table A5.
An illustrative example for indicator score calculation in Group 3.
Table A5.
An illustrative example for indicator score calculation in Group 3.
| Indicator | Element | Level of Implementation | Score |
|---|---|---|---|
| Preventive measures and emergency protocols regarding accidents and injuries | Policy | P | 0.6 |
| Communication | F | 1 | |
| Deployment | P | 0.6 | |
| Monitoring | F | 1 | |
| Response | P | 0.6 | |
| Total Score | 3.8 |
Notes: F = Fully Implemented (score = 1), P = Partially Implemented (score = 0.6), N = Not Implemented (score = 0).
Appendix D. Example for the Calculation Method Used in Group 4 Indicators
In this appendix, the calculation method for the indicator “Use of Personal Protective Equipment (PPE)” is presented. For calculation purposes, whenever it is necessary to use data collected in the organization, random data are considered.
Indicator: Use of Personal Protective Equipment (PPE).
This reveals the level of use of personal protective equipment (PPE) by the workers at the workplaces and the situations in which their use is mandatory. It can demonstrate not only the lack of training given to workers regarding their use but also the organization’s lack of control and awareness for the importance of the use of PPE.
Since the workers of the organization are the only stakeholders affected by this indicator, the questionnaire carried out to assess the indicator must be addressed to the workers.
The workers must respond on the basis of their perception of the question “Do you use Personal Protective Equipment in every required workplace and situation?”, according to the five-point response scale, demonstrated in Table A6.
Table A6.
Five-point response scale used in the example.
Table A6.
Five-point response scale used in the example.
| Score | Response |
|---|---|
| 1 | I never use PPE when required. |
| 2 | I rarely use PPE when required |
| 3 | I often use PPE when required. |
| 4 | Most of the time I use PPE when required. |
| 5 | I always use PPE when required. |
Assuming that the organization has 100 workers, and the results of the questionnaire are those shown below:
- 5–50 workers
- 4–20 workers
- 3–10 workers
- 2–15 workers
- 1–5 workers
The weighted average can be calculated as follows:
The final score of the indicator corresponds to the exact value of the weighted average calculated, which gives a final score of 3.95. Table A7 sums up the calculation method used for the example provided above.
Table A7.
An illustrative example for score calculation of indicators in Group 4.
Table A7.
An illustrative example for score calculation of indicators in Group 4.
| Indicator | Five-Point Response Scale | Results of the Questionnaire | Weighted Average | Score |
|---|---|---|---|---|
| Do you use Personal Protective Equipment in every required workplace and situation? | 1: I never use PPE when required. | 5–50 workers 4–20 workers 3–10 workers 2–15 workers 1–5 workers | 3.95 | |
| 2: I rarely use PPE when required | ||||
| 3: I often use PPE when required. | ||||
| 4: Most of the time, I use PPE when required. | ||||
| 5: I always use PPE when required. |
References
- Jiang, R.; Kleer, R.; Piller, F.T. Predicting the future of additive manufacturing: A Delphi study on economic and societal implications of 3D printing for 2030. Technol. Forecast. Soc. Chang. 2017. [Google Scholar] [CrossRef]
- Ford, S.; Despeisse, M. Additive manufacturing and sustainability: An exploratory study of the advantages and challenges. J. Clean. Prod. 2016. [Google Scholar] [CrossRef]
- Huang, S.H.; Liu, P.; Mokasdar, A.; Hou, L. Additive manufacturing and its societal impact: A literature review. Int. J. Adv. Manuf. Technol. 2013, 67, 1191–1203. [Google Scholar] [CrossRef]
- Matos, F.; Jacinto, C. Additive manufacturing technology: Mapping social impacts. J. Manuf. Technol. Manag. 2019. [Google Scholar] [CrossRef]
- UNEP/SETAC. Guidelines for Social Life Cycle Assessment of Products; United Nations Environment Programme: Nairobi, Kenya, 2019; Volume 15, ISBN 9789280730210. [Google Scholar]
- Ma, J.; Harstvedt, J.D.; Dunaway, D.; Bian, L.; Jaradat, R. An exploratory investigation of Additively Manufactured Product life cycle sustainability assessment. J. Clean. Prod. 2018. [Google Scholar] [CrossRef]
- Wang, S.W.; Hsu, C.W.; Hu, A.H. An analytic framework for social life cycle impact assessment—Part 1: Methodology. Int. J. Life Cycle Assess. 2016, 21, 1514–1528. [Google Scholar] [CrossRef]
- Sureau, S.; Mazijn, B.; Garrido, S.R.; Achten, W.M.J. Social life-cycle assessment frameworks: A review of criteria and indicators proposed to assess social and socioeconomic impacts. Int. J. Life Cycle Assess. 2017, 1–17. [Google Scholar] [CrossRef]
- Attaran, M. The rise of 3-D printing: The advantages of additive manufacturing over traditional manufacturing. Bus. Horiz. 2017, 60, 677–688. [Google Scholar] [CrossRef]
- Khajavi, S.H.; Partanen, J.; Holmström, J. Additive manufacturing in the spare parts supply chain. Comput. Ind. 2014, 65, 50–63. [Google Scholar] [CrossRef]
- Campbell, T.; Ivanova, O. Additive manufacturing as a disruptive technology: Implications of three-dimensional printing. Technol. Innov. 2013, 15, 67–79. [Google Scholar] [CrossRef]
- Peng, T.; Kellens, K.; Tang, R.; Chen, C.; Chen, G. Sustainability of additive manufacturing: An overview on its energy demand and environmental impact. Addit. Manuf. 2018, 21, 694–704. [Google Scholar] [CrossRef]
- Al-Meslemi, Y.; Anwer, N.; Mathieu, L. environmental performance and key characteristics in additive manufacturing: A literature review. Procedia CIRP 2018, 69, 148–153. [Google Scholar] [CrossRef]
- Kellens, K.; Mertens, R.; Paraskevas, D.; Dewulf, W.; Duflou, J.R. Environmental impact of additive manufacturing processes: Does am contribute to a more sustainable way of part manufacturing? Procedia CIRP 2017, 61, 582–587. [Google Scholar] [CrossRef]
- Chen, D.; Heyer, S.; Ibbotson, S.; Salonitis, K.; Steingrímsson, J.G.; Thiede, S. Direct digital manufacturing: Definition, evolution, and sustainability implications. J. Clean. Prod. 2015. [Google Scholar] [CrossRef]
- Ribeiro, A. Additive Manufacturing Social Impacts: A Conceptual Model. Master’s Thesis, Nova University of Lisbon, Lisbon, Portugal, 2017. [Google Scholar]
- Di Cesare, S.; Silveri, F.; Sala, S.; Petti, L. Positive impacts in social life cycle assessment: State of the art and the way forward. Int. J. Life Cycle Assess. 2018, 23, 406–421. [Google Scholar] [CrossRef]
- Singh, R.K.; Gupta, U. Social life cycle assessment in Indian steel sector: A case study. Int. J. Life Cycle Assess. 2017. [Google Scholar] [CrossRef]
- Tsalis, T.; Avramidou, A.; Nikolaou, I.E. A social LCA framework to assess the corporate social profile of companies: Insights from a case study. J. Clean. Prod. 2017, 164, 1665–1676. [Google Scholar] [CrossRef]
- Bork, C.A.S.; De Barba, D.J.; De Oliveira Gomes, J. Social life cycle assessment of three companies of the furniture sector. Procedia CIRP 2015, 29, 150–155. [Google Scholar] [CrossRef]
- Benoît, C.; Norrs, G.A.; Valdivia, S.; Ciroth, A.; Moberg, A.; Bos, U.; Prakash, S.; Ugaya, C.; Beck, T. The guidelines for social life cycle assessment of products: Just in time! Int. J. Life Cycle Assess. 2010, 15, 156–163. [Google Scholar] [CrossRef]
- UNEP/SETAC. The Methodological Sheets for Sub-Categories in Social Life Cycle assessment in S Ocial L Ife C Ycle a Ssessment (S-LCA). 2013, p. 152. Available online: https://www.safenano.org/knowledgebase/guidance/life-cycle-assessment/ (accessed on 16 June 2020).
- Traverso, M.; Bell, L.; Saling, P.; Fontes, J. Towards social life cycle assessment: A quantitative product social impact assessment. Int. J. Life Cycle Assess. 2016, 597–606. [Google Scholar] [CrossRef]
- Petti, L.; Serreli, M.; Di Cesare, S. Systematic literature review in social life cycle assessment. Int. J. Life Cycle Assess. 2016, 422–431. [Google Scholar] [CrossRef]
- Van Haaster, B.; Ciroth, A.; Fontes, J.; Wood, R.; Ramirez, A. Development of a methodological framework for social life-cycle assessment of novel technologies. Int. J. Life Cycle Assess. 2017, 22, 423–440. [Google Scholar] [CrossRef]
- Kühnen, M.; Hahn, R. Indicators in social life cycle assessment: A review of frameworks, theories, and empirical experience. J. Ind. Ecol. 2017. [Google Scholar] [CrossRef]
- Foolmaun, R.K.; Ramjeeawon, T. Comparative life cycle assessment and social life cycle assessment of used polyethylene terephthalate (PET) bottles in Mauritius. Int. J. Life Cycle Assess. 2013, 18, 155–171. [Google Scholar] [CrossRef]
- Ciroth, A.; Franze, J. LCA of an Ecolabeled Notebook. Consideration of Social and Environmental Impacts along the Entire Life Cycle; GreenDeltaTC GmbH: Berlin/Heidelberg, Germany, 2011; ISBN 978-1-4466-0087-0. [Google Scholar]
- Jørgensen, A.; Le Bocq, A.; Nazarkina, L.; Hauschild, M. Methodologies for social life cycle assessment. Int. J. Life Cycle Assess. 2008, 13, 96–103. [Google Scholar] [CrossRef]
- Aparcana, S.; Salhofer, S. Development of a social impact assessment methodology for recycling systems in low-income countries. Int. J. Life Cycle Assess. 2013, 18, 1106–1115. [Google Scholar] [CrossRef]
- Arcese, G.; Lucchetti, M.C.; Massa, I. Modeling Social Life Cycle Assessment framework for the Italian wine sector. J. Clean. Prod. 2017, 140, 1027–1036. [Google Scholar] [CrossRef]
- Eurostat. European Statistics on Accidents at Work (ESAW)—Summary Methodology; Publications Office of the European Union: Luxembourg, 2013; ISBN 978-92-79-28419-9. [Google Scholar]
- Siebert, A.; Bezama, A.; O’Keeffe, S.; Thrän, D. Social life cycle assessment indices and indicators to monitor the social implications of wood-based products. J. Clean. Prod. 2018. [Google Scholar] [CrossRef]
- Leythienne, D.; Ronkowski, P. A Decomposition of the Unadjusted Gender Pay Gap Using Structure of Earnings Survey Data; Publications Office of the European Union: Luxembourg, 2018; ISBN 9789279868771. [Google Scholar]
- Dreyer, L.C.; Hauschild, M.Z.; Schierbeck, J. Characterisation of social impacts in LCA: Part 1: Development of indicators for labour rights. Int. J. Life Cycle Assess. 2010, 15, 247–259. [Google Scholar] [CrossRef]
- Eisenhardt, M. Building theories from case research. Acad. Manag. Rev. 1989, 14, 532–550. [Google Scholar] [CrossRef]
- Voss, C.; Tsikriktsis, N.; Frohlich, M. Case research in operations management. Int. J. Oper. Prod. Manag. 2002. [Google Scholar] [CrossRef]
- Torres-Carrillo, S.; Siller, H.R.; Vila, C.; López, C.; Rodríguez, C.A. Environmental analysis of selective laser melting in the manufacturing of aeronautical turbine blades. J. Clean. Prod. 2020, 246, 119068. [Google Scholar] [CrossRef]
© 2020 by the authors. Licensee MDPI, Basel, Switzerland. This article is an open access article distributed under the terms and conditions of the Creative Commons Attribution (CC BY) license (http://creativecommons.org/licenses/by/4.0/).