Abstract
Concrete gravity dams are one of the most common water retention structures, some of which are located in seismically active regions. Determination of damage level after earthquakes plays an important role in assessing the safety behavior of concrete dams. Compared with the traditional performance parameters obtained from numerical simulations, such as the damage coefficient, energy dissipation, failure modes, and stress state, etc., the displacement of dams can be acquired from daily monitoring data conveniently and quickly. It is of great significance for the rapid and effective evaluation of dam properties after earthquakes. The residual displacement in the concrete gravity dam crest was adopted as the performance parameter in the paper, and the linear mapping function between the residual displacement and the damage coefficient was established based on the concrete damaged plasticity model (CDP). Based on the traditional classification method with damage coefficient, a residual displacement-based seismic damage classification method with corresponding level limits was proposed. The seismic fragility analysis of Guandi concrete gravity dam was conducted as an example to illustrate the presented methodology. The results indicate that the proposed method is reasonable, effective, and can be easily applied to different projects after slight modifications.
1. Introduction
Concrete gravity dams are widely used due to their simple structure, safety, and reliability, strong adaptability to topographic and geological conditions. Numerous concrete gravity dams are in service in the world and are critical components of a nation’s infrastructure. However, some of them are located in seismically active regions. Earthquakes may cause varying degrees of damage in concrete gravity dams. The presence of damage impairs the durability and operational performance of concrete gravity dams. Determinations of damage level are closely linked with the performance assessment of concrete dams. Traditional seismic damage classification methods are promoted based on the performance parameters of damage coefficient, energy dissipation, failure modes, and stress state, etc. These parameters are widely used in the field of damage of dams from earthquake waves, there are still some problems that need to be improved. For example, the stress state-based method tends to be localized, and it is difficult to reflect the global damage level; the determination of conversion coefficient between the local and global damage coefficients has a certain degree of subjectivity, and the calculation of intermediate variables is easily influenced by numerical simulation model and its parameters. It is well known that the displacement, as a daily monitoring physical quantity in dams, not only can reflect the behavior of dams directly but can be obtained conveniently and quickly. Therefore, establishing a classification method for evaluating the damage of dams based on the displacement is of great significance for the real-time assessment of dams after earthquakes.
Fragility analysis is one of the key methods to evaluate the state of structures after the earthquake waves and has been widely concerned [1,2,3,4,5]. Performance parameter selection of damage degree and corresponding damage classification are the critical points when analyzing the seismic fragility analysis of concrete dams [6,7]. Methods of failure modes-based [8], stress state on weak position-based [9], energy dissipation-based [10], performance-based [11] and the damage coefficient [12,13] have been introduced and applied to study seismic fragility of concrete dams, respectively. Four (intact, slight, moderate, and severe) or five levels (slight, moderate, severe, destruction, and complete destruction) of seismic damage are used commonly in some standards [14,15]. However, the determination of stress, energy dissipation, failure modes, and weight factors, and so on, may meet various challenges or not be readily available in time.
Changes in stress, damage degree, and strength degradation can be directly reflected in the physical quantity of displacement. The objective of this paper is to study (1) the relationship between the residual displacement and the damage coefficient and (2) the residual displacement-based seismic damage classification method for gravity dams. The remainder of this paper is organized as follows. In Section 2, methods for expressing the relationship between the displacement and the damage are presented, and the fragility analysis method and process of dams are showed. In Section 3, first, a finite-element model of Guandi gravity dam is established, then the variation curves of displacements with the peak ground acceleration (PGA) are analyzed and the linear functional relationship between the displacement and the damage coefficient is proposed, finally, the residual displacement-based seismic damage classification method is proposed and the seismic fragility is analyzed and compared. In Section 4, some conclusions are presented.
2. Methodology
2.1. Concrete Damaged Plasticity Model
Lubliner et al. [16] and Lee and Fenves [17] proposed the concrete damaged plasticity model (CDP), which can describe the nonlinear behavior of concrete with good convergence under unidirectional, cyclic, and dynamic loading. The model is a commonly used method to analyze the nonlinear seismic response of concrete gravity dams [18,19,20,21,22]. It is mainly used to simulate the non-recoverable degradation of material caused by damage under low hydrostatic pressure. The degradation is mainly manifested in a material’s tensile and compressive yield strengths on a macroscopic level. Different reduction factors of damage and stiffness are used for tension and compression.
In the CDP model, the total strain tensor is decomposed into elastic and plastic parts, and εp, respectively, i.e.,
With this information, the stress tensor is given by
where is the scalar stiffness degradation variable, is the effective stress, and is the initial elastic stiffness of the material.
The stress–cracking strain curves for the uniaxial tension limit states and the stress–crushing strain in uniaxial compression limit states are needed to define the elastic, plastic, and damage behaviors of concrete, the stress-strain relationships under uniaxial tension and compression loading are
2.2. Relationship Determination of Residual Displacement and Damage Coefficient
The effect of various earthquakes on the nonlinear behavior of concrete gravity dams can be directly reflected in the residual displacement. Under the action of a seismic wave with a big PGA, the state (e.g., damage) of concrete gravity dams will be worse than that with a small PGA [23]. Wang et al. [24] concluded that the maximum displacement in the crest of the Pine Flat gravity dam is about between 30 mm to 480 mm with the PGA from 0.1 g to 0.8 g, the others are about 35 mm to 160 mm with the PGA from 0.1 g to 0.6 g in the Jin’anqiao concrete dam [25], about 23 mm to 329 mm with the PGA from 0.1 g to 1.0 g in the Koyna concrete gravity dam, and about 15 mm to 80 mm with the PGA from 0.1 g to 1.0 g [26]. Based on the research above, the displacement in concrete gravity dam crest and the damage degree of dams may have a certain correlation with the earthquake intensity, respectively. Therefore, the function to describe the potential and possible relationship between them under the ith earthquake wave can be expressed by
where and are the dimensionless damage coefficient of dams and residual displacement in the dam crest under the ith earthquake, respectively; is the function form.
Peak ground acceleration (PGA) is the commonly used ground motion parameter when studying the seismic fragility of dams. Each earthquake wave is standardized at different levels, and eight PGAs, ranging from 1 m/s2 to 8 m/s2 are obtained. So the dimensionless damage coefficient () and residual displacement () of dams under the ith earthquake can be calculated by
where and are the damage coefficient of dams and residual displacement in the dam crest under ith earthquake with a PGA of j m/s2, with j = 1, 2, …, 8; and are the maximum values of and ; and are the sets of dimensionless damage coefficients and residual displacement under the ith earthquake; The damage coefficient of dams () can be calculated by Equation (8) [21], where is the length of the damage path in crack path p; is the total length to which crack path p is expected to grow; is the damage dissipation energy at the crack path p; and q is the number of crack paths.
Then, the parameters need to be solved in Equation (5) can be calculated based on the sets of and in Equations (6) and (7).
In the field of the damage coefficient-based seismic damage classification analysis in gravity dams, the level limits of different damage degrees have been studied and lots of results have been made. Therefore, the residual displacement-based level limits under the ith earthquake can be determined based on the Equations (5)–(8) and the known level limit obtained by the damage coefficient-based seismic damage classification, that is
where is the classification level of seismic damage, k = 1, 2, 3, 4 stands for the damage state of “intact”, “slight”, “moderate,” and “severe” in concrete dams.
At last, the final level limits of the proposed classification method can be expressed by
where is the number of earthquake waves.
2.3. Fragility Analysis of Dams
Based on the related research [27], the seismic fragility can be expressed by the following lognormal function,
where is the variable of dam response; is the bearing capacity, and are the logarithmic standard deviations of and , respectively.
According to Cornell’s study [28], there is an exponential regression relationship between ground motion parameters (PGA is selected in the paper) and the seismic response variables, which is called the probabilistic seismic demand model, and it has been adopted by the SAC-FEMA standard [29], that is
Equation (12) can also be given as,
where a and b are the constants; IM is the ground motion parameters. The fragility of structure can be concluded by inserting Equation (13) into Equation (11):
If
Equation (17) can be given by inserting Equations (15) and (16) into Equation (14):
Based on the Equation (17), seismic fragility curves of dams can be expressed.
3. Case Study
3.1. Project Specifications
Guandi hydropower project is located in Liangshan, Sichuan Province. It is composed of a roller compacted concrete (RCC) dam, a flood discharge structure, an underground powerhouse on the right bank, and so on. The normal water level is 1330 m, with a corresponding capacity of 752.8 million m3. The maximum dam height is 168 m. The elevation of the barrage is about 1334.00 m. The dam crest length is 516.00 m, the lowest base elevation 1166.00 m, and the maximum dam bottom width 153.2 m. Guandi hydropower project is located on the west margin of the Yangtze Paraplatform, with complex cracks under the dam, strong regional neotectonic movement, relatively stable zone in the near dam reservoir area.
3.2. Finite-Element Model and Material Parameters
A two-dimensional finite element model with the dam-foundation system is shown in Figure 1a. The width to the upstream or downstream and the depth of the foundation is two times of the dam height. The X-axis is pointing downstream, and the Y-axis is vertically upward. Rigid constraints were imposed on the three truncated boundaries of the foundation, and a massless foundation was adopted in the model. The upstream elevation of the dam foundation interface is 1190 m while the downstream elevation is 1180 m, and the corresponding dam heights are 144 m and 154 m, respectively. Except for the crest and foundation surface with normal concrete of CI and CII, the rest of the dam is poured with RI~RV RCC (as seen in Figure 1b). The dynamic elastic modulus and dynamic strength are increased by 30% on the basis of the corresponding static parameters. The foundation is mainly composed of grade III1 and grade III2 rocks and contains a small amount of grade II, grade III3, and grade IV rocks. The fracture and disturbed belt are N40°~50° E/NW∠15°~20°(A), N30°~40°E/SE∠20°~25°(B), N10°~35°W/NE∠15°~20°(C) and N35° E/NW∠25°~30°(D).
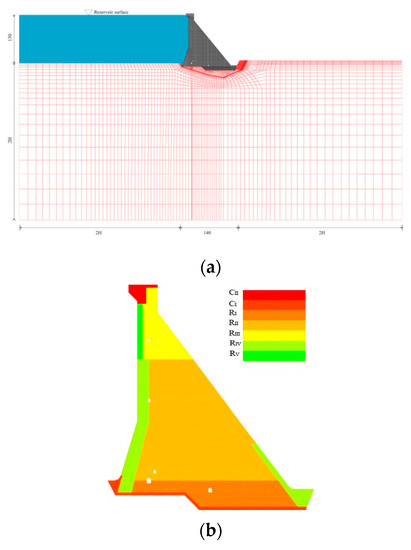
Figure 1.
Finite element model of Guandi concrete gravity dam: (a) dam-foundation system; (b) materials of the dam
Related material parameters are shown in Table 1 and Table 2. The modulus and strength of the dam were increased by 30% to account for the effect of the strain rate. The Rayleigh damping method can be expressed as [30]:
where is the mass matrix, the stiffness matrix, and are the damping coefficients, and can be defined as,
where is the first natural frequency, is the second natural frequency, the damping ratio is 5%.

Table 1.
Performance parameters of concrete material.

Table 2.
Performance parameters of foundation material.
3.3. Loadings
The calculation loads include the weight of the dam body, upstream hydrostatic pressure, dynamic water pressure, uplift pressure, and seismic load. The upstream water table is assumed to be 130 m. Westergaard added mass [31] is employed to include the hydrodynamic effects and was computed as
where is the hydrodynamic pressure, is the ground acceleration, is the water density, is the depth of water, and is the height of the point from the foundation.
Twenty-eight earthquake waves are selected as the excitations for fragility analysis of Guandi dam based on the site conditions with epicentral distances (EpiD) of 5.7 to 30.3 km and magnitudes ranging from 5.2 to 7.36, as shown in Table 3. The horizontal and vertical seismic actions are considered and the amplitude of acceleration in the vertical direction takes two-thirds of that in the horizontal direction. Additionally, the PGA of each earthquake wave is treated to eight grades with 0.1 g, 0.2 g, 0.3 g, 0.4 g, 0.5 g, 0.6 g, 0.7 g, and 0.8 g (a total of 224 groups). Figure 2 shows the horizontal and vertical acceleration time-histories curves of Whittier Narrows-01.

Table 3.
Earthquake waves.

Figure 2.
Acceleration time-histories curves of the Whittier Narrows-01 wave.
3.4. Analysis and Results
(1) Function relation between the residual displacement and the damage coefficient.
Typical damage modes of Guandi dam under selected 28 earthquake waves are concluded in Figure 3. The upstream crest corner was called point A. As shown in Figure 3, the main damaged locations are as follows: (Location 1) neck area at the change of downstream face slope; (Location 2) along lift joints at various elevations, the change of upstream face slope and around the drainage gallery; (Location 3) along with dam-foundation interface at the toe and heel of the dam.
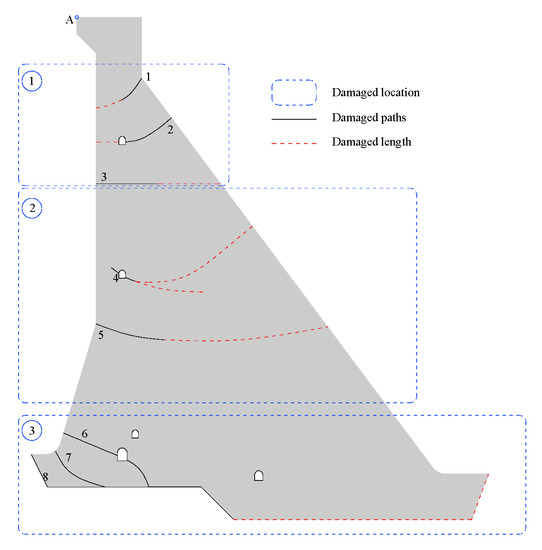
Figure 3.
Typical damage modes of the Guandi gravity dam.
Figure 4 shows the graph of the relation between the residual displacement in point A and the PGA. It can be seen that the residual displacement of point A increases with increasing PGA. Specifically, as the PGA of earthquake wave 10 increases from 0.1 g to 0.8 g, the residual displacement increases from 2.23 mm to 644.45 mm. The residual displacement has a fluctuation range under different earthquake with the same PGA. Figure 5 shows the scatter diagram of the dimensionless damage coefficient of dams () and the dimensionless residual displacement in the dam crest () under 28 earthquake waves. To study the correlation between and variables, Pearson’s correlation coefficient is adopted in the paper, as seen in Equation (21). Results show that the Pearson’s correlation coefficient between and in the dam under 28 seismic waves is 0.93, indicating that there is a strong correlation between and .
where is the correlation coefficient between X and Y variables; is the covariance; and are the variances of X and Y variables, respectively.
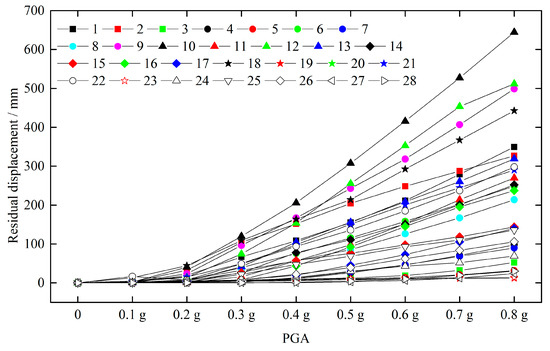
Figure 4.
Graph of the relation between the residual displacement in point A and the peak ground acceleration (PGA).
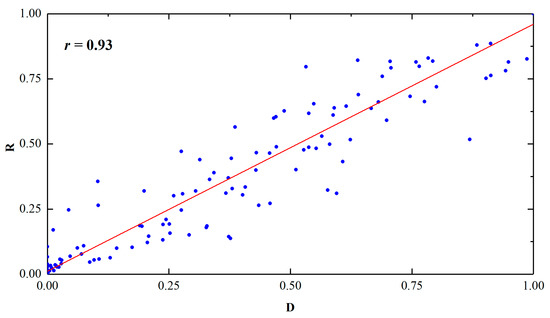
Figure 5.
Scatter diagram of R and D under 28 earthquake waves.
The best-fit curves are shown in Figure 6 for the relationship between the and under earthquake waves 1–4. It can be seen that there is an approximately linear functional relationship between the and under these earthquake waves. For earthquake waves 1–4, the best-fit equations are linear functions as follows,
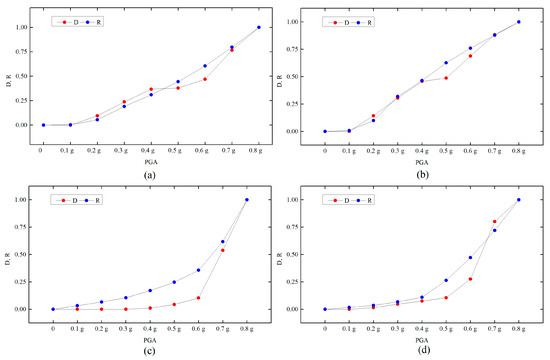
Figure 6.
Correlation of R and D under various earthquake waves. (a) Correlation of R and D under wave 1; (b) Correlation of R and D under wave 2; (c) Correlation of R and D under wave 3; (d) Correlation of R and D under wave 4.
Taking the residual displacement obtained from the fitting functions between and under 28 earthquake waves as the prediction value, the average relative error under 28 earthquake waves is 13.52%, with the fluctuation of 4.95%–25.04%. The relative error shows that the relationship between and in the Guandi concrete gravity dam can be described by a linear function with high accuracy. Therefore, the linear functions of the and can be defined by
Therefore, the residual displacement-based level limits are as follows
(2) Classification of seismic damage
Damage-based classification of seismic damage has been commonly used in the field of concrete dams. According to the related researches [8,23,32], the damage-based classification is shown in Table 4. According to Equations (27) and (28), the residual displacement-based level limits can be calculated with , and (as seen in Table 5). Table 6 shows the residual displacement-based classification of seismic damage of the Guandi gravity dam. As shown in Table 5, the residual displacement level limits of the intact, slight, moderate, and severe state are 13.29 mm, 39.60 mm, and 105.38 mm, respectively, and the level limits account for 0.009%, 0.027% and 0.073% of dam height. In addition, the coefficient of variations is between 34.17% and 55.47% due to the randomness of earthquake waves. The dam structure is a highly nonlinear system, it is reasonable that the response characteristics of the dam under different earthquake actions are quite different, so the average value of displacements under various earthquake waves is adopted for the further analysis.

Table 4.
Damage-based classification of damage states for gravity dams.

Table 5.
Residual displacement-based level limits under various earthquakes.

Table 6.
Residual displacement-based classification of seismic damage.
(3) Comparative fragility analysis
Based on the seismic fragility analysis method of dams, a series of functions between the probability and the logarithm of PGA are as follows
Figure 7 shows the seismic fragility curves of the Guandi dam. Generally speaking, Concrete gravity dams are designed based on two earthquake levels, the operating basis earthquake (OBE) and the maximum creditable earthquake (MCE), to ensure the seismic safety. The PGAs of OBE and MCE for the Guandi dam are 0.352 g and 0.415 g.
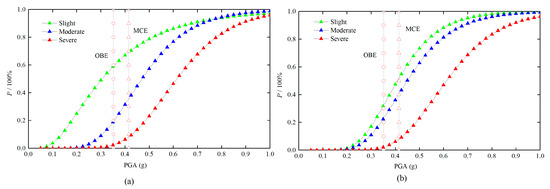
Figure 7.
Seismic fragility curves for the Guandi dam. (a) Residual displacement-based; (b) damage-based.
Figure 7a shows the seismic fragility curves defined by the residual displacement-based classification of damage for the Guandi dam, and Figure 7b shows the seismic fragility curves defined by the damage-based classification of damage. Figure 7a shows that the probabilities of slight and moderate damage under the OBE are 59.2% and 19.3%, while the severe damage is only 2.3%. It indicates that the Guandi dam under the OBE is mainly the slight damage. The corresponding probabilities under the MCE are 69.0%, 35.4%, and 8.1%, respectively. The proportion of moderate damage probability has increased. In contrast to Figure 7a, the probabilities of different damage states under the OBE (MCE) in Figure 7b are 32.3% (51.9%), 22.7% (40.4%) and 2.2% (7.8%), respectively.
Obviously, the difference between probabilities based on the residual displacement, and the damage is very small. It indicates that the residual displacement-based performance parameter and the corresponding classification method of seismic damage are reasonable and feasible. Displacements of dams are the must-be-monitored physical quantity, thereby making it easier to acquire the monitoring data. Residual displacement-based seismic evaluation procedures can be implemented conveniently and quickly.
4. Conclusions
In the present study, the following conclusions can be drawn:
- A linear mapping function between the residual displacement and the PGA under various earthquakes is obtained. Results show that residual displacement increases with increasing PGA, and the rate of increase varies with earthquake waves.
- Based on a series of linear mapping functions, equations for residual displacement-based level limits are established. The corresponding classification of seismic damage is made combined with the damage-based method.
- Seismic fragility analysis results of the Guandi concrete gravity dam show that the damage degree under the OBE is mainly slight. The proportion of moderate damage probability is much larger under the MCE. The probability of severe damage or even dam failures is very small with the two levels. It indicates that the proposed method is reasonable and feasible.
- Displacement is a must-be-monitored physical quantity in the field of concrete dams. Selecting displacement as the performance parameter to assess the safety behavior of dams makes the evaluation process timely and the results effective.
Author Contributions
Conceptualization, X.L., and L.P.; methodology, J.C.; software, X.L.; validation, J.C., Z.W., and C.C.; writing—original draft preparation, X.L.; writing—review and editing, L.P. All authors have read and agreed to the published version of the manuscript.
Funding
This research was funded by the National Key R&D Program of China (No. 2016YFC0401907).
Conflicts of Interest
The authors declare no conflict of interest.
References
- Kwag, S.; Ryu, Y.; Ju, B. Efficient seismic fragility analysis for large-scale piping system utilizing Bayesian approach. Appl. Sci. 2020, 10, 1515. [Google Scholar] [CrossRef]
- Pang, R.; Xu, B.; Zhou, Y.; Zhang, X.; Wang, X. Fragility analysis of high CFRDs subjected to mainshock-aftershock sequences based on plastic failure. Eng. Struct. 2020, 206, 110152. [Google Scholar] [CrossRef]
- Stochino, F.; Attoli, A.; Concu, G. Fragility curves for RC structure under blast load considering the Influence of seismic demand. Appl. Sci. 2020, 10, 445. [Google Scholar] [CrossRef]
- Bao, C.; Xu, F.; Chen, G.; Ma, X.; Mao, M.; Zhang, S. Seismic vulnerability analysis of structure subjected to uneven foundation settlement. Appl. Sci. 2019, 9, 3507. [Google Scholar] [CrossRef]
- Cao, A.; Nahar, T.; Kim, D.; Choi, B. Earthquake risk assessment of concrete gravity dam by cumulative absolute velocity and response surface methodology. Earthq. Struct. 2019, 17, 511–519. [Google Scholar]
- Ellingwood, B.; Tekie, P.B. Fragility analysis of concrete gravity dams. J. Infrastruct. Syst. 2001, 7, 41–48. [Google Scholar] [CrossRef]
- Ma, Z.Y.; Zhang, W.; Zhou, Q.; Tang, K.R. A deformation-based method for seismic fragility analysis of gravity dam. J. Vib. Shock 2017, 36, 51–58. [Google Scholar]
- Li, X.Y.; Zhong, H.; Lin, G. Numerical simulation of damage process and failure modes of concrete gravity dams due to earthquakes. J. Water Resour. Eng. 2011, 42, 1209–1217. [Google Scholar]
- Abdelhamid, H.; Mahmoud, B.; Hussein, M. Seismic fragility and uncertainty analysis of concrete gravity dams under near-fault ground motions. Civ. Environ. Res. 2013, 5, 27–30. [Google Scholar]
- Kratzig, W.B.; Meyer, I.F.; Meskouris, K. Damage evolution in reinforced concrete members under cyclic loading. In Proceedings of the 5th International Conference on Structural Safety and Reliability, San Francisco, CA, USA, 7–11 August 1989; ASCE: New York, NY, USA; Volume 2, pp. 795–804. [Google Scholar]
- Shen, H.Z.; Zhang, C.H.; Kou, L.H. Performance-based seismic damage assessment model for concrete gravity dams. J. Tsinghua Univ. 2007, 47, 86–91. [Google Scholar]
- Park, Y.J.; Ang, A.H.S. Mechanistic seismic damage model for reinforced concrete. J. Struct. Div. ASCE 1985, 111, 722–739. [Google Scholar] [CrossRef]
- Zhang, S.; Wang, G.; Pang, B.; Du, C. The effects of strong motion duration on the dynamic response and accumulated damage of concrete gravity dams. Soil Dyn. Earthq. Eng. 2013, 45, 112–124. [Google Scholar] [CrossRef]
- Grünthal, G. European Macroseismic Scale 1998: EMS-98; European Seismological Commission: Luxembourg, 1998. [Google Scholar]
- Ministry of Housing and Urban-Rural Development of the People’s Republic of China. GB50011-2010 Code for Seismic Design of Buildings; Ministry of Housing and Urban-Rural Development of the People’s Republic of China: Beijing, China, 2010.
- Lubliner, J.; Oliver, J.; Oller, S.; Oñate, E. A plastic-damage model for concrete. Int. J. Solid Struct. 1989, 25, 299–329. [Google Scholar] [CrossRef]
- Lee, J.; Fenves, G.L. Plastic-damage model for cyclic loading of concrete structures. J. Eng. Mech. 1998, 124, 892–900. [Google Scholar] [CrossRef]
- Bhattacharjee, S.S.; Leger, P. Seismic cracking and energy dissipation in concrete gravity dams. Earthq. Eng. Struct. Dyn. 2010, 22, 991–1007. [Google Scholar] [CrossRef]
- Shao, C.J.; Qiang, Y.J. Seismic plastic damage response analysis of koyna concrete gravity dam. J. Vib. Shock 2006, 24, 179–182. [Google Scholar]
- Long, Y.C.; Zhang, C.H.; Xu, Y.J. Nonlinear seismic analyses of a high gravity dam with and without the presence of reinforcement. Eng. Struct. 2009, 31, 2486–2494. [Google Scholar] [CrossRef]
- Zhang, S.; Wang, G.; Sa, W. Damage evaluation of concrete gravity dams under mainshock-aftershock seismic sequences. Soil Dyn. Earthq. Eng. 2013, 50, 16–27. [Google Scholar] [CrossRef]
- Wang, G.; Wang, Y.; Lu, W.; Yu, M.; Wang, C. Deterministic 3D seismic damage analysis of Guandi concrete gravity dam: A case study. Eng. Struct. 2017, 148, 263–276. [Google Scholar] [CrossRef]
- Hariri-Ardebili, M.A.; Saouma, V.E. Collapse fragility curves for concrete dams: Comprehensive study. J. Struct. Eng. 2016, 142, 04016075. [Google Scholar] [CrossRef]
- Wang, Y.; Li, Z.; Wu, Z.; Fan, X.; Tian, Z. Seismic Fragility Analysis of Gravity Dams Considering the Fuzziness of Damage States Thresholds. Adv. Eng. Sci. 2020, 52, 110–120. [Google Scholar]
- Chen, D.; Yang, Z.; Wang, M.; Xie, J. Seismic performance and failure modes of the Jin’anqiao concrete gravity dam based on incremental dynamic analysis. Eng. Fail. Anal. 2019, 100, 227–244. [Google Scholar] [CrossRef]
- Gavabar, S.G.; Alembagheri, M. A Study on Seismic Performance and Fragility of Gravity Dams with Various Monolith Shapes Using Nonlinear IDA. Geotech. Geol. Eng. 2020, 38, 1133–1150. [Google Scholar] [CrossRef]
- Baker, J.W. Efficient analytical fragility function fitting using dynamic structural analysis. Earthq. Spectra 2013, 31, 579–599. [Google Scholar] [CrossRef]
- Cornell, C.A.; Jalayer, F.; Hamburger, R.; Foutch, D. The probabilistic basis for the 2000 SAC federal emergency management agency steel moment frame guidelines. J. Struct. Eng. 2002, 128, 526–533. [Google Scholar] [CrossRef]
- Federal Emergency Management Agency. Recommended Seismic Design Criteria for New Steel Moment-Frame Buildings: FEMA350; FEMA: Washington, DC, USA, 2000. [Google Scholar]
- Clough, R.W.; Penzien, J. Dynamics of Structures, 3rd ed.; Computer & Structures, Inc.: Berkeley, CA, USA, 1995. [Google Scholar]
- Westergaard, H.M. Water pressures on earthquakes. Transactions 1933, 98, 418–472. [Google Scholar]
- Zhong, H.; Li, X.Y.; Lin, G. Analyses of failure modes-based seismic of gravity dams. J. Dalian Univ. Technol. 2012, 52, 60–65. [Google Scholar]
© 2020 by the authors. Licensee MDPI, Basel, Switzerland. This article is an open access article distributed under the terms and conditions of the Creative Commons Attribution (CC BY) license (http://creativecommons.org/licenses/by/4.0/).