Abstract
This work quantifies the impact of using sCO2-mixtures (s-CO2/He, s-CO2/Kr, s-CO2/H2S, s-CO2/CH4, s-CO2/C2H6, s-CO2/C3H8, s-CO2/C4H8, s-CO2/C4H10, s-CO2/C5H10, s-CO2/C5H12 and s-CO2/C6H6) as the working fluid in the supercritical CO2 recompression Brayton cycle coupled with line-focusing solar power plants (with parabolic trough collectors (PTC) or linear Fresnel (LF)). Design parameters assessed are the solar plant performance at the design point, heat exchange dimensions, solar field aperture area, and cost variations in relation with admixtures mole fraction. The adopted methodology for the plant performance calculation is setting a constant heat recuperator total conductance (UAtotal). The main conclusion of this work is that the power cycle thermodynamic efficiency improves by about 3–4%, on a scale comparable to increasing the turbine inlet temperature when the cycle utilizes the mentioned sCO2-mixtures as the working fluid. On one hand, the substances He, Kr, CH4, and C2H6 reduce the critical temperature to approximately 273.15 K; in this scenario, the thermal efficiency is improved from 49% to 53% with pure s-CO2. This solution is very suitable for concentrated solar power plants coupled to s-CO2 Brayton power cycles (CSP-sCO2) with night sky cooling. On the other hand, when adopting an air-cooled heat exchanger (dry-cooling) as the ultimate heat sink, the critical temperatures studied at compressor inlet are from 318.15 K to 333.15 K, for this scenario other substances (C3H8, C4H8, C4H10, C5H10, C5H12 and C6H6) were analyzed. Thermodynamic results confirmed that the Brayton cycle efficiency also increased by about 3–4%. Since the ambient temperature variation plays an important role in solar power plants with dry-cooling systems, a CIT sensitivity analysis was also conducted, which constitutes the first approach to defining the optimum working fluid mixture for a given operating condition.
1. Introduction
The need to improve the efficiency of energy power plants emphasizes the importance of optimizing their equipment design and the inlet and operation conditions. For this reason, it is important to analyze how the use of fluid mixtures affects the operating conditions—mainly, plant efficiency [1]. There are different external conditions to the plant (environmental conditions) that mark the need to have a working fluid that adapts to these variable environments, both for low and high temperatures, with the objective that the plant works optimally.
The ever-increasing necessity to reduce the environmental impact of industrial and urban energy conversion processes has led engineers to consider the use of sCO2-mixtures as working fluid for thermodynamic power and refrigeration cycles [2,3], emphasizing the mitigation of air pollution and the emission of greenhouse gases, and reducing energy production costs [4].
Several configurations of the Brayton cycle are currently under study [5]. One of the very interesting features of this cycle is its ability to achieve high efficiency in a variety of applications operating with intermediate temperature levels: concentrated solar power (CSP) [6,7], waste heat recovery [8,9], coal-fired power plants [10,11,12], and Gen IV nuclear reactors [13,14,15] among others. In this work, the influence of fluid mixtures on the recompression Brayton cycle (cf. Figure 1) has been studied. This power cycle is the evolution of the previous configuration proposed by Angelino [16,17] and has clear connections with Sulzer and Feher’s work [18,19]. The cycle is named after the re-compressor located parallel to the main compressor, which means that the flow is split into two for the compression process. The first amount of stream flows into the cooler, where its temperature is reduced to a value close to the critical temperature. The second stream is not cooled but compressed directly in the re-compressor [5]. In the work of Al-Sulaiman [20], it was determined that the recompression cycle showed the best performance in comparison with other configurations (simple, pre-compression, and divided expansion cycles).
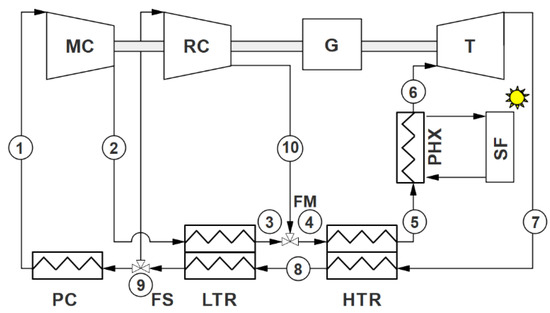
Figure 1.
Recompression Brayton cycle layout. MC: main compressor; RC: recompressor; G: generator; T: turbine; PC: precooler; FS: fluid split; FM: fluid mixture; LTR: low-temperature recuperator; HTR: high-temperature recuperator; PHX: primary heat exchanger; SF: solar field.
The novelty of this work over the state of the art is new mixtures with mixing ratio and new fluids, in the recompression Brayton cycle. In Section 2, the methodology with which this work was developed is explained. The obtained results of the recompression Brayton cycle using sCO2-mixtures are discussed in Section 3. Conclusions and future work are discussed in Section 4. An increase in the thermal efficiency of the recompression Brayton power cycle using sCO2-mixtures is the main conclusion of this manuscript.
2. Assumptions and Methods
This work proposes a comparison between the performance of the cycles operating with pure s-CO2 and the cycles of admixtures of s-CO2 with He, Kr, H2S, CH4, C2H6, C3H8, C4H8, C4H10, C5H10, C5H12, and C6H6. These mixtures have been used because their physical properties stimulate the better behavior of the plant cycle.
The computer program SCSP (Supercritical Concentrated Solar Power Plant) is used for the simulations of the performance of the recompression Brayton cycle using pure s-CO2 and sCO2-mixtures. This program has been developed by members of the Energy Engineering Department at the Technical University of Madrid [21] and it is based on the software core developed by Dyreby in his doctoral thesis [22]. SCSP sets a constant heat recuperator total conductance for the performance calculation methodology and uses optimization algorithms (SUBPLEX [23], NEWUOA [24] and BOBYQA [25]) to calculate the optimal cycle performance. Figure 2 illustrates the iteration process for the cycle models integrated into the SCSP software.
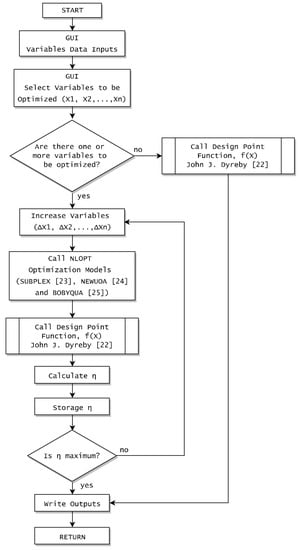
Figure 2.
Iteration process for the cycle models integrated into the SCSP software.
The fluid properties were obtained from the REFPROP (Reference fluid Properties) database developed by NIST (National Institute of Standards and Technology) in the USA [26]. Figure 3a,b show, respectively, the critical pressure and temperature of the mixture when the mole fraction of the additive fluid changes. Figure 3a specifies that the tendency of the pressure lines is very different among the different binary mixtures based on s-CO2, as there a non-linearity between the critical pressure and the mole fraction. Figure 3b shows that the critical temperature distributions of mixtures follow a monotonous, nearly linear trend. The critical temperatures of s-CO2/He, s-CO2/Kr, s-CO2/CH4, and s-CO2/C2H6 have a downward slope, while the critical temperatures of s-CO2/H2S, s-CO2/C3H8, s-CO2/C4H10, s-CO2/C5H10, s-CO2/C5H12, s-CO2/C4H8, and s-CO2/C6H6 have an upward slope. Therefore, based on the critical temperature distribution trends, the s-CO2 binary mixtures can be divided into two groups: ‘group A’ mixtures (substances for reducing the critical temperature) and ‘group B’ mixtures (substances for increasing the critical temperature).
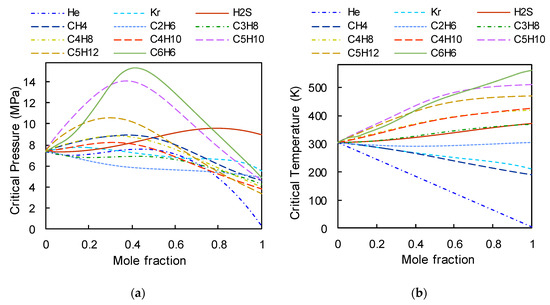
Figure 3.
Properties of mixtures: (a) variation of the critical pressure vs. the mole fraction of added fluid; (b) variation of the critical temperature vs. the mole fraction of added fluid.
The performances of the pure s-CO2 and sCO2-mixtures’ recompression Brayton cycle have been analyzed. The input parameters for the simulation are shown in Table 1. The results obtained were validated with the Thermoflex 27 software [27], UniSim Design R451 software [28] (UniSim uses Peng-Robinson equation of state for thermodynamic property estimations), and scientific articles about the effect of gaseous admixtures on cycles with s-CO2 [1,29,30].

Table 1.
Main assumptions for the power cycles calculations.
3. Results and Discussion
The results for group A and group B of the binary mixtures are calculated for a total heat exchanger conductance (UAtotal) of 5000, 10,000, and 15,000 kW/K (combining low and high temperature heat exchangers, i.e., UAtotal is the sum of UALT and UAHT).
The optimal efficiency of the s-CO2 recompression Brayton cycle using pure s-CO2 is for a CIT (Compressor Inlet Temperature) equal to the critical temperature and a CIP (Compressor Inlet Pressure) above the critical pressure [22]. These values are 45.4% (CIP = 7.41 MPa and UAtotal = 5000 kW/K), 48.4% (CIP = 7.43 MPa and UAtotal = 10,000 kW/K), and 49.4% (CIP = 7.44 MPa and UAtotal = 15,000 kW/K).
As mentioned above, the s-CO2 binary mixtures are divided into two groups: substances for reducing the critical temperature, group A, which include s-CO2/He, s-CO2/Kr, s-CO2/CH4, and s-CO2/C2H6; and substances for increasing the critical temperature, group B, which include s-CO2/H2S, s-CO2/C3H8, s-CO2/C4H10, s-CO2/C5H10, s-CO2/C5H12, s-CO2/C4H8 and s-CO2/C6H6.
In the case of group A, sCO2-mixtures, the recompression Brayton cycle efficiency is maximum when the cycle works with a CIT and CIP nearly the critical point. To avoid the phase changing zone, the condition of working just above the critical point was appointed.
In the case of group B sCO2-mixture, a CIT range of 318.15 to 333.15 K and CIP just above critical pressure were considered in this study.
3.1. Results of ‘Group A’ Mixtures (Substances for Reducing the Critical Temperature)
For ‘group A’ mixtures, the maximum molar fractions for the s-CO2/He, s-CO2/Kr and s-CO2/CH4 mixtures have been fixed at 90.0/10.0, 68.0/32.0 and 67.0/33.0 respectively because in these conditions their critical temperatures are close to 273.15 K. The molar fraction span for the s-CO2/C2H6 was 100.0/0.0 to 0.0/100.0 because its critical temperature range is approximately 304.13 K to 290.21 K. This means that the CIT’s range studied is approximately 304.13 K to 273.15 K, except for the s-CO2/C2H6. The power cycle diagrams for pressure with respect to the enthalpy are shown in Figure 4, where it is possible to see the cycle has a different behavior when it uses sCO2-mixture as working fluid.
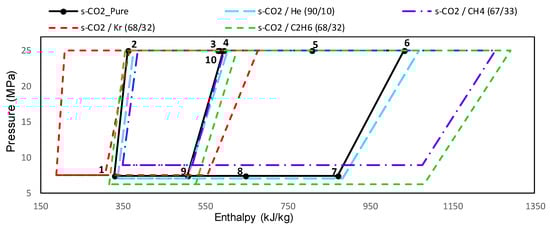
Figure 4.
Real gas cycles with sCO2-mixtures as working fluid in the thermodynamic plane P-h. Group A mixtures with UAtotal = 15,000 kW/K.
For the study of the Brayton cycle performance, optimal values of CIT and CIP at the main compressor and recompressor inlet has been considered; it has been observed that the sCO2-mixtures produce a gain in cycle efficiency over pure s-CO2 cycles of approximately 4%. Also, a linear trend is observed for s-CO2/Kr and s-CO2/CH4 (cf. Figure 5).
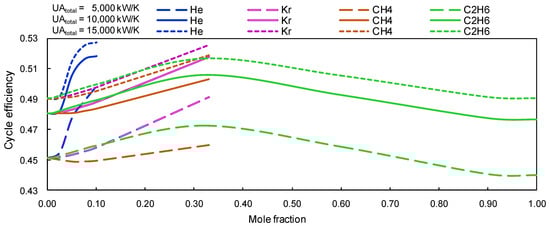
Figure 5.
Cycle thermal efficiency versus mole fraction. Group A mixtures with UAtotal of 5000, 10,000 and 15,000 kW/K.
Table 2 shows the results summary (cycle thermal efficiency and working fluid properties using group A sCO2-mixtures) for the Brayton cycle working with UAtotal = 15,000 kW/K, CIT and CIP optimized. To summarize the results obtained, some working fluid properties which have a direct impact on the cycle performance and on the power cycle equipment detail design are shown in this table.
Table 2.
Results summary for ‘group A’ mixtures with UAtotal = 15,000 kW/K, CIT and CIP optimized.
The turbomachine dimensions are constrained to the working fluid density [33,34]. If the density is increased, the compressor and turbine sizes will be minimized. The addition of krypton provides higher density values; hence, the turbomachines would have a minimized size. However, the isobaric heat capacity (Cp), kinetic viscosity and thermal conductivity must also be considered in the heat exchangers design. The heat exchanger’s heat transfer coefficients are closely related to the viscosity (dynamic and kinetic), thermal conductivity, density and isobaric heat capacity [35]. The highest Cp and density values and the lowest kinetic viscosity value minimize the recuperator (low-temperature recuperator (LTR) and high-temperature recuperator (HTR)) dimensions. The ethane mixture is the solution for maximizing the isobaric heat capacity. Moreover, the helium mixture and krypton mixture are the solution for minimizing the kinetic viscosity.
Another important issue to be considered is the Ultimate Heat Sink (UHS) thermal storage system, this system design depends on the mixture critical temperature. Here, two possible technical solutions are going to be studied. The night cooling radiative panels could be proposed as the first technical solution, and this proposal has been discussed by Ana Dyreson [36]. The cooling fluid’s lowest temperature for this proposal could be between 278.15 and 298.15 K; for this scenario, the ethane mixture, with a critical temperature around 290.82 K, is the optimal solution, as stated by J. Muñoz-Antón [37] and Steven A. Wright [38].
In the future, alternative refrigerants could also be utilized to vary the UHS temperature range. Cooling with cold storage system based on water ice could be proposed as the second technical solution. In this case, the helium mixture, with a critical temperature around 274.24 K, is the most suitable option.
In conclusion, maximizing the working fluid density in turbomachines minimizes the equipment dimensions, but also has to be warrantied the equipment manufacturability. Maximizing the Cp and density values and minimizing the kinetic viscosity value reduce the heat exchangers size, and finally, selecting a mixture with a critical temperature compatible with the UHS storage system. The optimum s-CO2 mixtures could be obtained with helium or ethane. However, another constraint, which was not cited before, is the added substance’s maximum operating temperature. Helium has a maximum working temperature of around 2000 K, and the maximum working temperature of ethane is around 675 K. Accordingly, for the purposes in this work, the optimum mixture is s-CO2/He (90.0/10.0). However, for future works, it would be advisable to continue researching on a mixture based on adding both helium and ethane, as this last fluid has a very beneficial impact on the heat exchanger and also simplifies the UHS storage system’s economical and technical design, opening future research paths for studying diverse refrigeration thermodynamic cycles coupled with the main s-CO2 Brayton power cycle.
A schematic diagram of the pressure vs. enthalpy for the s-CO2 Recompression Brayton cycle is shown in Figure 6, this cycle works with CIP and CIT optimal values, pure s-CO2 as working fluid and UAtotal = 15,000 kW/K. The specific heat contributing to the cycle through the primary heat exchanger is represented by qPHX. The specific work of the main compressor is wmc, the specific work of the recompressor is wrc, the specific work of the turbine is wt, the maximum achievable temperature in the high-pressure side from the low-pressure side is Tt, and Δha is the specific enthalpy increment between the entrance of the primary heat exchanger and the exit of the turbine.
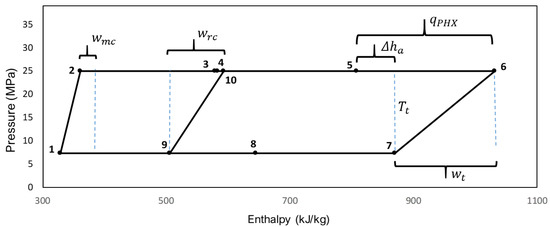
Figure 6.
Pressure vs enthalpy. Recompression Brayton cycle using pure s-CO2 and UAtotal = 15,000 kW/K.
The thermal efficiency of the recompression Brayton cycle is properly defined as the net specific work divided by the net supply of heat [19]. The thermal efficiency can be expressed as
where γ is the split fraction of the flow of the plant. The thermal efficiency depends on three dimensionless variables: the dimensionless main compression work, wmc/wt, the dimensionless recompression work, wrc/wt, and the dimensionless additional enthalpy supplied due to real gas conditions, Δhrg/wt. These terms depend on the thermodynamic properties of the working fluid in the recompression cycle. Further, Δhrg is the difference between the heat needed in a cycle working at real gas conditions and the heat needed in an ideal cycle [39]. It can be expressed by:
where ΔhTt is the enthalpy variation of the isothermal Tt; this variable tends to zero when the turbine works at high temperatures. Thus, in these cases, Equation (1) can be approximated to:
The dimensionless variables wmc/wt, wrc/wt and Δha/wt play an important role in the cycle efficiency. For this reason, the fluctuation of wmc/wt, wrc/wt and Δha/wt of the s-CO2 mixtures with respect to the pure s-CO2 have been obtained using the next equations:
where is the variation of the dimensionless main compression work of the sCO2-mixtures respect to the pure s-CO2, is the variation of the dimensionless recompression work of the sCO2-mixtures respect to the pure s-CO2, is the variation of the dimensionless additional enthalpy of the sCO2-mixtures respect to the pure s-CO2, and is the total variation of the dimensionless cycle work of the sCO2-mixtures respect to the pure s-CO2. It has been observed that the cycle efficiency increases when increases [40]. Therefore, the influence of the dimensionless variables wmc/wt, wrc/wt and Δha/wt on the cycle efficiency can be displayed in Figure 7.
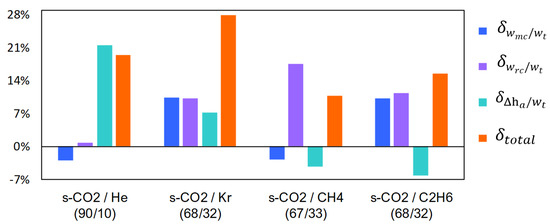
Figure 7.
Variation of the parameters wmc/wt, wrc/wt and Δha/wt of the s-CO2 mixtures with respect to the pure s-CO2. Recompression Brayton cycle with UAtotal = 15,000 kW/K for Group A.
The adoption of s-CO2 cycles is particularly promising for large-scale, high-temperature CSP plants [2]. Four factors are important for incorporating s-CO2 into CSP plants: superior performance vs. steam Rankine cycles, the ability to integrate thermal energy storage, ultimate heat sink thermal energy storage [36,37,38], and dry cooling [41]. This work presents air-cooled s-CO2 cycle configurations specifically selected for a CSP application. The estimated cost calculation of the PTC (parabolic trough collector) and LF (linear Fresnel) systems were developed with the following equation [42]:
where is the cost of the solar field, is the effective area of the solar field, is the linear collector unitary costs, and is the construction factor of the solar field. The linear collector unitary costs and construction factor (cf. Table 3) have been obtained from Thermoflex 27 software [27].
Table 3.
Linear collector unitary costs. PTC: parabolic trough collector; LF: linear Fresnel; HTF: Heat Transfer Fluid.
The better performance of the plant implies a smaller solar field effective area; this, in turn, reduces the cost of the 50 MW plant. In view of this, Figure 8 shows that the savings with the installation of PTC could reach up to 8 million USD for the mixture of s-CO2/He with a 10% molar fraction.
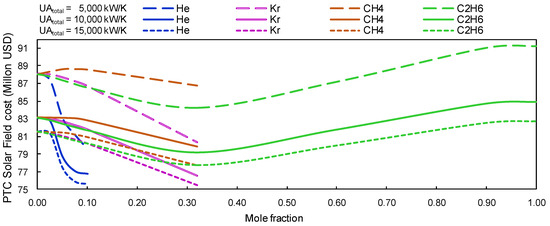
Figure 8.
PTC Solar Field cost vs. a concentration of s-CO2 for group A mixtures.
The solar field’s effective area with linear Fresnel is larger than the solar field’s effective area with the parabolic trough collector (approximately 12%). Nevertheless, the estimated cost of the solar field with LF is lower than the solar field with PTC, because the price per square meter of the solar field with LF is lower than that of the PTC. Thermodynamic results show that savings, when the Brayton cycle coupled with LF’s solar field uses s-CO2 mixtures, could reach 6 million USD compared to using pure s-CO2 (cf. Figure 9).
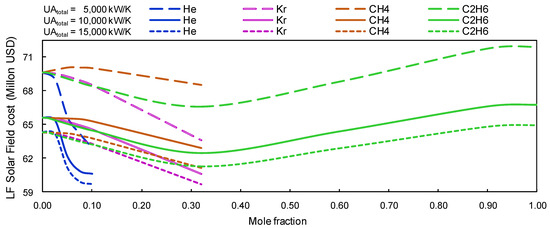
Figure 9.
LF Solar Field cost vs. a concentration of s-CO2 for ‘group A’ mixtures.
3.2. Results of Group B Mixtures (Substances for Increasing the Critical Temperature)
For group B mixtures, the cycle works with a CIP just above critical pressure and a CIT’s range from 318.15 K to 333.15 K. This CIT’s range has been studied in this work because most of CSPs are located in sites where the ambient temperature is above the s-CO2 critical temperature, i.e., CIT = 318.15, 323.15, 328.15, and 333.15 K [43,44].
In the case of CIT equal to 318.15 K and UAtotal = 15,000 kW/K, the maximum molar fractions for the s-CO2/H2S, s-CO2/C3H8, s-CO2/C4H10, s-CO2/C5H10, s-CO2/C5H12, s-CO2/C4H8 and s-CO2/C6H6 mixtures have been fixed at 66.0/34.0, 72.5/27.5, 90.0/10.0, 97.5/2.5, 97.5/2.5, 92.5/7.5, and 92.5/7.5 respectively, because the critical temperatures in these conditions are just below to 318.15 K. The power cycle diagrams for pressure with respect to the enthalpy are shown in Figure 10, where it is possible to see the cycle has a different behavior when it uses sCO2-mixture as working fluid.
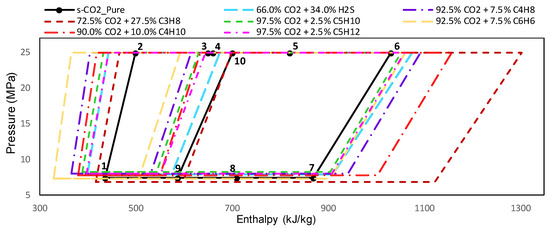
Figure 10.
Real gas cycles with mixtures as working fluid in the thermodynamic plane P-h. Group B mixtures with a CIT = 318.15 K and UAtotal = 15,000 kW/K.
Comparing the recompression Brayton cycle using pure s-CO2 and the same cycle using ‘group B’ sCO2-mixtures, it can be observed that the cycle efficiency with group B mixtures decreases when it works with CIT and CIP just above the critical point. In contrast, a better efficiency has been obtained if the cycle works with sCO2-mixtures and higher compressor inlet temperatures, i.e., 318.15, 323.15, 328.15 and 333.15 K. Most series of cycle efficiency versus molar fraction have a linear trend, with a minority of lines following an exponential trend, such as the mixtures s-CO2/H2S and s-CO2/C3H8. The cycle efficiency improves by about 3 to 4%, when the cycle works with group B sCO2-mixtures, CIP just above critical pressure and CIT = 318.15 K, as shown in Figure 11.
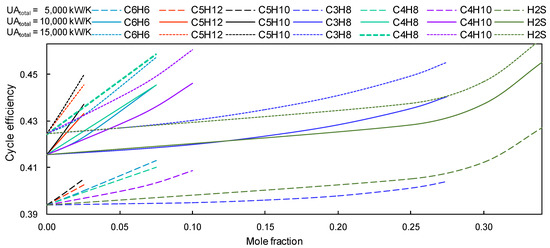
Figure 11.
Cycle efficiency vs. a concentration of s-CO2. Group B mixtures with a CIT = 318.15 K.
The same analysis of ‘group A’ mixtures (substances added for decreasing the critical temperature) has been developed with ‘group B’ mixtures (substances added for increasing the critical temperature). As a result of this analysis, it has been observed that the cycle efficiency increases when increases. Therefore, the influence of the parameters wmc/wt, wrc/wt and Δha/wt on the cycle efficiency that works with UAtotal = 15,000 kW/K and CIT = 318.15 K can be seen in Figure 12.
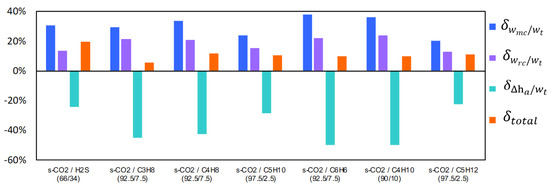
Figure 12.
Variation of the parameters wmc/wt, wrc/wt and Δha/wt of the s-CO2 mixtures with respect to the pure s-CO2. Recompression Brayton cycle with UAtotal = 15,000 kW/K, CIP = just above the critical pressure of the working fluid and CIT = 318.15 K for group B mixtures.
Due to the mixtures used in the recompression Brayton cycle, savings in PTC installations could reach up to 7 million USD for CIT = 318.15 K (cf. Figure 13). The maximum saving was obtained with the s-CO2/H2S mixture (66.0/34.0), and the minimum saving was obtained with s-CO2/C5H12 mixture (97.5/2.5).
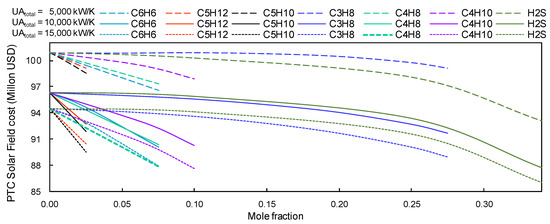
Figure 13.
PTC’s solar field estimated cost vs concentration of s-CO2. Group B mixtures with a CIT = 318.15 K and CIP = just above the critical pressure of the working fluid.
Alternatively, in the case of linear Fresnel installations, savings could reach 6 million USD for CIT = 318.15 K (cf. Figure 14). In the same way as for the PTC installations, the maximum saving for LF installations was obtained with the s-CO2/H2S mixture (66.0/34.0).
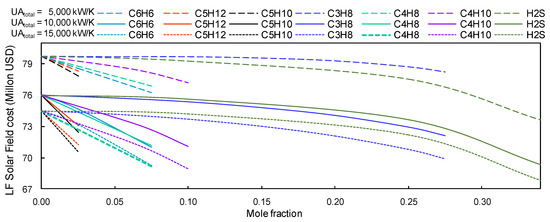
Figure 14.
LF’s solar field estimated cost vs concentration of s-CO2. Group B mixtures with a CIT = 318.15 K and CIP = just above the critical pressure of the working fluid.
There are different issues to be considered when selecting the optimum sCO2-mixture. The first one is the mixture density; as already explained in this work, the density has a direct impact on the turbomachine’s final dimension. It has been seen benzene mixtures provide the maximum density at the compressor inlet (Table 4). Other important considerations to be assessed are related to the isobaric heat capacity and kinetic viscosity. As mentioned before in this study, the highest Cp and density values and the lowest kinetic viscosity value minimize the recuperator (low-temperature recuperator (LTR) and high-temperature recuperator (HTR)) dimensions. The s-CO2/H2S and s-CO2/C4H10 mixtures have higher Cp values, and the s-CO2/C6H6 mixture has a higher density value. The s-CO2/C4H8 and s-CO2/C4H10 mixtures have lower kinetic viscosity value.
Table 4.
Results summary for ‘group B’ mixtures with CIT = 318.15 K, CIP = critical pressure 1 and UAtotal = 15,000 kW/K.
Another important factor impacting in the power cycle performance is the mixture maximum operating temperature. At an operating temperature of around 823.15 K at the turbine inlet, hydrocarbons pyrolysis or chemical decomposition could occur. Also, air infiltration in the power cycle working fluid due to leakages could provoke added substance auto-ignition. The mixture substances which are more stable in these scenarios are the cyclic hydrocarbons, short-string hydrocarbons, and hydrocarbons with double links. Based on the REFPROP fluid property library information [26], the maximum operating temperature for benzene and hydrogen sulfide is 725 K and 760 K, respectively. The advantage of benzene is that it has a lower mole fraction than hydrogen sulfide.
This study paves the way for future works which should achieve a detailed equipment design and cost assessments. The final recommendation extracted from this analysis is to compare the cycle performance and detailed equipment design with benzene and hydrogen sulfide mixtures. Subsequent analyses should be focused on comparing the results with the other mixtures in Table 4.
Another complementary power cycle design work will be focused on adding two or more substances to the sCO2-mixtures, considering the benefits provided by each individual substance, and balancing the required critical temperature according to the CSP-sCO2 location ambient conditions.
For the case where CIT equal to 323.15, 328.15 and 333.15 K, the maximum molar fractions for the s-CO2/H2S, s-CO2/C3H8, s-CO2/C4H10, s-CO2/C5H10, s-CO2/C5H12, s-CO2/C4H8 and s-CO2/C6H6 mixtures are shown in Table 5. Bearing in mind that in these conditions the critical temperatures are below to CIT’s range studied, i.e., if the additives molar fraction exceeds these values, the mixture critical temperature will be greater than CIT’s range studied. A power cycle efficiency improvement from 3% to 4% has been obtained for group B sCO2-mixtures.
Table 5.
Results summary for group B mixtures with CIP = critical pressure 1 and UAtotal = 15,000 kW/K.
Thermodynamic results show savings in PTC’s installations could reach up to 11 million USD for CIT = 323.15 K, 9 million USD for CIT = 328.15 K, and 10 million USD for CIT = 333.15 K. Alternatively, in the case LF’s installations, the savings could reach 8 million USD for CIT = 323.15 K, 7 million USD for CIT = 328.15 K, and 7 million USD for CIT = 333.15 K.
As discussed previously for Table 4, there are several factors when selecting the optimum s-CO2 mixture, namely power cycle efficiency impact, critical temperature, the plant location’s ambient temperature, equipment, performance, and cost, etc. When increasing the CIT (cf. Table 5), the first conclusion is the requirement to increase the substance’s mole fraction to reach critical temperature values just below of the CIT’s range (323.15, 328.15 and 333.15 K).
The substance’s addition influences in the sCO2-mixtures properties. The higher impact on the plant’s equipment design has been gained by density, isobaric heat capacity and kinetic viscosity, similar to working with CIT = 318.15 K. Therefore, the recommendations for the power cycle detail design are the same as cited in Table 4.
The dry-cooling technical solution is usually adopted in deserts, where water is a scarce resource and the ambient temperature is high. A typical temperature selected for CSP design is 318.15 K, hence, the CIT = 333.15 K is a solution in these places because the difference between the plant location’s ambient temperature and CIT is around 15.00 K.
To summarize the conclusions obtained from Table 5, it is important to highlight that the substance addition mole fraction has an important impact on sCO2-mixture decomposition. The target should be aligned with the mole fraction minimization. For example, the benzene mole fraction is 12.50%, which is much lower than hydrogen sulfide at 50.00% when the cycle works with CIT = 333.15 K.
Finally, it is important to remark that the plant results showed in Table 4 and Table 5 were obtained with a CIP just above the critical pressures. A future study will focus on optimizing the CIP in order to make a comparison with the work developed by J. Dyreby [22] wherein plant efficiency improvement has been demonstrated to increase the CIP above the critical pressure.
4. Conclusions
This study was mainly focused on quantifying the impact of CSP-sCO2 thermal efficiency due to the mixing of the substances (He, Kr, CH4 C2H6, C3H8, C4H8, C4H10, C5H10, C5H12, and C6H6) with pure s-CO2. The obtained results confirmed that the variations in working fluid properties directly impact in the cycle thermodynamic efficiency.
On one hand, it is confirmed that He, Kr, CH4 and C2H6 addition reduces the critical temperature, and hence it increases the power cycle thermal efficiency. Detailed results are summarized in Table 2. The working fluids mixtures s-CO2/He (90.0/10.0) and s-CO2/Kr (68.0/32.0) increase the power cycle efficiency from 49.0% to 53.0%. Further, krypton and helium are inert gases and the addition of them to the pure s-CO2 is very beneficial for avoiding the equipment materials corrosion. The group sCO2-mixtures, for reducing the sCO2 critical temperature, are very suitable for the CSP-sCO2 night sky cooling technology.
On the other hand, another CSP ultimate heat sink technical solution is the dry-cooling system with air-cooled heat exchangers. Most CSPs are located in sites where the ambient temperature is above the s-CO2 critical temperature (CIT = 318.15, 323.15, 328.15, and 333.15 K). In this scenario, the target is setting the CIT near the working fluid’s critical temperature, hence, it is required to increase the working fluid critical temperature by adding H2S, C3H8, C4H8, C4H10, C5H10, C5H12 or C6H6 to the cycle’s working fluid. In Table 4 and Table 5 the results obtained for the CSP with dry-cooling scenario are summarized. As a result of this work, it is concluded that the solar power plant design-point efficiency is improved by about 3–4% when adding the mentioned substances in comparison with the reference pure s-CO2.
In works developed by Dyreby [22] and Marchionni [45], it was observed that an increase in the turbine inlet temperature (TIT) implies an improvement in the performance of the recompression Brayton cycle. As a result of this study, it is concluded that this effect of increasing the TIT is equivalent to the use of mixtures of supercritical fluids in the Brayton cycles.
Future works should align with the working fluid chemical composition customization according to the ambient conditions where the solar power plant will be located. The environmental impact should also play an important role, and the substances added should be environmentally friendly. For this reason, inert gases in combination with other substances are advisable in future CSP-sCO2 conceptual designs.
Additional simulations are required to analyze more complex Brayton cycle configurations: the recompression with partial cooling cycle (RCPC) and recompression with main compressor intercooling cycle (RCMCI), both with reheating.
In addition, it will be necessary to analyze the variation of increasing the CIP for compensating the CIT increment in hot locations.
Also, detailed experimental analysis is required to verify that the possible reactions and chemical decomposition of mixtures do not affect the plant’s performance.
Author Contributions
R.V.-C. and L.C.-E. developed the computer program SCSP (Supercritical Concentrated Solar Power Plant); All authors wrote the paper. All authors have read and agreed to the published version of the manuscript.
Funding
This work was supported by the Community of Madrid’s Industrial Doctorates program (IND2018/IND-9952).
Conflicts of Interest
The authors declare no conflict of interest.
Nomenclature
| CO2 | Carbon Dioxide |
| CH4 | Methane |
| C2H6 | Ethane |
| C3H8 | Propane |
| C4H8 | 1-Butene |
| C4H10 | Butane |
| C5H10 | Cyclopentane |
| C5H12 | Isopentane |
| C6H6 | Benzene |
| CIP | Compressor Inlet Pressure |
| CIT | Compressor Inlet Temperature |
| CSP-sCO2 | Concentrated Solar Power Plant coupled to s-CO2 Brayton power cycles |
| FM | Flow Mixture |
| FS | Flow Split |
| G | Generator |
| H2S | Hydrogen Sulfide |
| He | Helium |
| HTF | Heat Transfer Fluid |
| HTR | High Temperature Recuperator |
| Kr | Krypton |
| LF | Linear Fresnel |
| LTR | Low Temperature Recuperator |
| MC | Main Compressor |
| NIST | National Institute of Standards and Technology |
| PC | Precooler |
| PHX | Primary Heat Exchanger |
| PTC | Parabolic Trough Solar Collector |
| RC | Recompressor |
| RCMCI | Recompression with Main Compression and Intercooling Cycle |
| REFPROP | Reference Fluid Thermodynamic and Transport Properties Database |
| s-CO2 | Supercritical Carbon Dioxide |
| SF | Solar Field |
| T | Turbine |
| TIT | Turbine Inlet Temperature |
| TIP | Turbine Inlet Pressure |
| UA | Heat Exchanger Conductance |
References
- Guo, J.-Q.; Li, M.-J.; Xu, J.-L.; Yan, J.-J.; Wang, K. Thermodynamic Performance Analysis of Different Supercritical Brayton Cycles using CO2-based binary Mixtures in the Molten Salt Solar Power Tower Systems. Energy 2019, 173, 785–798. Available online: https://linkinghub.elsevier.com/retrieve/pii/S0360544219301975 (accessed on 13 October 2019). [CrossRef]
- Bonalumi, D.; Lasala, S.; Macchi, E. CO2-TiCl4 Working Fluid for High-Temperature Heat Source Power Cycles and Solar Application. Renew. Energy 2018. [Google Scholar] [CrossRef]
- Li, M.-J.; Tao, W.-Q. Review of Methodologies and Polices for Evaluation of Energy Efficiency in High Energy-Consuming Industry. Appl. Energy 2017, 187, 203–215. [Google Scholar] [CrossRef]
- Rivera-González, L.; Bolonio, D.; Mazadiego, L.F.; Valencia-Chapi, R. Long-Term Electricity Supply and Demand Forecast (2018–2040): A LEAP Model Application towards a Sustainable Power Generation System in Ecuador. Sustainability 2019, 11, 5316. [Google Scholar] [CrossRef]
- Crespi, F.; Gavagnin, G.; Sánchez, D.; Martínez, G.S. Supercritical Carbon Dioxide Cycles for Power Generation: A Review. Appl. Energy 2017, 195, 152–183. [Google Scholar] [CrossRef]
- Zhu, H.-H.; Wang, K.; He, Y.-L. Thermodynamic Analysis and Comparison for Different Direct-Heated Supercritical CO2 Brayton Cycles Integrated into a Solar Thermal Power Tower System. Energy 2017, 140, 144–157. [Google Scholar] [CrossRef]
- Ma, Z.; Turchi, C.S. Advanced Supercritical Carbon Dioxide Power Cycle Configurations for Use in Concentrating Solar Power Systems Modular S-CO2. Power 2011, 4–7. Available online: https://pdfs.semanticscholar.org/fa85/c53c198d807ed65513ac11019c12f095cfad.pdf (accessed on 13 October 2019).
- Manente, G.; Lazzaretto, A. Innovative Biomass to Power Conversion Systems Based on Cascaded Supercritical CO2 Brayton Cycles. Biomass Bioenergy 2014, 69, 155–168. [Google Scholar] [CrossRef]
- Wu, C.; Yin, X.; Ma, L.; Zhou, Z.; Chen, H. Design and Operation of a 5.5 MWe Biomass Integrated Gasification Combined Cycle Demonstration Plant. Energy Fuels 2008, 22, 4259–4264. [Google Scholar] [CrossRef]
- Mecheri, M.; Le, Y. Supercritical CO2 Brayton Cycles for Coal- Fired Power Plants. Energy 2016, 103, 758–771. [Google Scholar] [CrossRef]
- Park, S. Thermodynamic and Economic Investigation of Coal-Fired Power Plant Combined with Various Supercritical CO2 Brayton Power Cycle. Appl. Therm. Eng. 2017, 130, 611–623. [Google Scholar] [CrossRef]
- Moullec, Y.L. Conceptual Study of a High Efficiency Coal-Fired Power Plant with CO2 Capture Using a Supercritical CO2 Brayton Cycle. Energy 2013, 49, 32–46. [Google Scholar] [CrossRef]
- Li, M.-J.; Zhu, H.-H.; Guo, J.-Q.; Wang, K.; Tao, W.-Q. The Development Technology and Applications of Supercritical CO2 Power Cycle in Nuclear Energy, Solar Energy and other Energy Industries. Appl. Eng. 2017, 126, 255–275. [Google Scholar] [CrossRef]
- Li, M.-J.; Jie, Y.-J.; Zhu, H.-H.; Qi, G.-J.; Li, M.-J. The Thermodynamic and Cost-Benefit-Analysis of Miniaturized Lead-Cooled Fast Reactor with Supercritical CO2 Power Cycle in the Commercial Market. Prog. Nucl. Energy 2018, 103, 135–150. [Google Scholar] [CrossRef]
- Qi, H.; Gui, N.; Yang, X.; Tu, J.; Jiang, S. The Application of Supercritical CO2 in Nuclear Engineering: A Review. J. Comput. Multiph. Flows 2018. [Google Scholar] [CrossRef]
- Angelino, G. Carbon Dioxide Condensation Cycles for Power Production. J. Eng. Gas Turbines Power 1968, 90, 287. Available online: http://gasturbinespower.asmedigitalcollection.asme.org/article.aspx?doi=10.1115/1.3609190 (accessed on 13 October 2019). [CrossRef]
- Angelino, G. Real Gas Effects in Carbon Dioxide Cycles. In Power for Land, Sea, and Air; Turbo Expo: London, UK, 1969; Volumes 1–12. [Google Scholar] [CrossRef]
- Sulzer, G. Verfahren zur Erzeugung von Arbeit aus Warme. 1950. Available online: https://worldwide.espacenet.com/patent/search/family/004477343/publication/CH269600A?q=pn%3DCH269600A (accessed on 13 October 2019).
- Feher, E.G. The Supercritical Thermodynamic Power Cycle. Energy Convers. 1968, 8, 85–90. Available online: http://linkinghub.elsevier.com/retrieve/pii/0013748068901058 (accessed on 13 October 2019). [CrossRef]
- Al-Sulaiman, F.A.; Atif, M. Performance Comparison of Different Supercritical Carbon Dioxide Brayton Cycles Integrated with a Solar Power Tower. Energy 2015, 82, 61–71. [Google Scholar] [CrossRef]
- Coco-Enríquez, L. Nueva Generación de Centrales Termosolares Con Colectores Solares Lineales Acoplados A Ciclos Supercriticos de Potencia. Ph.D. Thesis, Universidad Politécnica de Madrid, Madrid, Spain, 2017. [Google Scholar] [CrossRef]
- Dyreby, J.J. Modeling the Supercritical Carbon Dioxide Brayton Cycle with Recompression. Ph.D. Thesis, University of Wisconsin-Madison, Madison, WI, USA, 2014. [Google Scholar]
- Rowan, T.H. Functional Stability Analysis of Numerical Algorithms. Ph.D. Thesis, The University of Texas at Austin, Austin, TX, USA, 1990. Available online: http://citeseerx.ist.psu.edu/viewdoc/summary?doi=10.1.1.31.5708 (accessed on 13 October 2019).
- Powell, M.J.D. The NEWUOA Software for Unconstrained Optimization without Derivatives; Springer: Berlin/Heidelberg, Germany, 2006; pp. 255–297. Available online: http://link.springer.com/10.1007/0-387-30065-1_16 (accessed on 13 October 2019).
- Powell, M. The BOBYQA Algorithm for Bound Constrained Optimization without Derivatives. NAREP 2009, 39. Available online: http://www6.cityu.edu.hk/rcms/publications/preprint26.pdf (accessed on 13 October 2019).
- Lemmon, E.W.; Bell, I.H.; Huber, M.L.; McLinden, M.O. NIST Standard Reference Database 23: Reference Fluid Thermodynamic and Transport Properties-REFPROP; version 10.0; Natl Inst Stand Technol Stand Ref Data Program: Gaithersbg, MD, USA, 2018. Available online: https://www.nist.gov/sites/default/files/documents/2018/05/23/refprop10a.pdf (accessed on 13 October 2019).
- Thermoflow Inc. Thermoflow Software. Available online: http://www.thermoflow.com/ (accessed on 13 October 2019).
- Honeywell International Inc. UniSim® Software. 2017. Available online: https://www.honeywellprocess.com/en-US/online_campaigns/unisim-design/Pages/index.html# (accessed on 13 October 2019).
- Vesely, L.; Dostal, V.; Stepanek, J. Effect of Gaseous Admixtures on Cycles with Supercritical Carbon Dioxide. In Proceedings of the ASME Turbo Expo 2016: Turbomachinery Technical Conference and Exposition, Seoul, Korea, 13–17 June 2016. [Google Scholar] [CrossRef]
- Hu, L.; Chen, D.; Huang, Y.; Li, L.; Cao, Y.; Yuan, D. Investigation on the Performance of the Supercritical Brayton Cycle with CO2-Based Binary Mixture as Working Fluid for an Energy Transportation System of a Nuclear Reactor. Energy 2015, 89, 874–886. Available online: https://ideas.repec.org/a/eee/energy/v89y2015icp874-886.html (accessed on 13 October 2019). [CrossRef]
- Kulhánek, M.; Dostál, V. Thermodynamic Analysis and Comparison of Supercritical Carbon Dioxide Cycles. 2011. Available online: http://www.sCO2powercyclesymposium.org/resource_center/system_concepts/thermodynamic-analysis-and-comparison-of-supercritical-carbon-dioxide-cycles (accessed on 13 October 2019).
- Wang, K.; Li, M.-J.; Guo, J.-Q.; Li, P.; Liu, Z. A Systematic Comparison of Different S-CO2 Brayton Cycle Layouts Based on Multi-Objective Optimization for Applications in Solar Power Tower Plants. Appl. Energy 2018, 212, 109–121. [Google Scholar] [CrossRef]
- Holaind, N.; Bianchi, G.; De Miol, M.; Saravi, S.S.; Tassou, S.A.; Leroux, A. Design of Radial Turbomachinery for Supercritical CO2 systems using Theoretical and Numerical CFD Methodologies. Energy Procedia 2017, 123, 313–320. [Google Scholar] [CrossRef]
- Cho, S.K.; Bae, S.J.; Jeong, Y.; Lee, J.; Lee, J.I. Direction for High-Performance Supercritical CO2 Centrifugal Compressor Design for Dry Cooled Supercritical CO2 Brayton Cycle. Appl. Sci. 2019, 9, 4057. [Google Scholar] [CrossRef]
- Vesely, L. Study of Power Cycle with Supercritical CO2. Ph.D. Thesis, Czech Technical University in Prague, Prague, Czech Republic, 2018. Available online: https://pdfs.semanticscholar.org/4914/4a496e3456eb45e0ea5cc2f07bffa2964f4e.pdf?_ga=2.199714603.422084581.1576280964-1144149164.1576280964 (accessed on 13 October 2019).
- Dyreson, A.; Miller, F. Night Sky Cooling for Concentrating Solar Power Plants. Appl. Energy 2016, 180, 276–286. [Google Scholar] [CrossRef]
- Muñoz, J.; Martínez-Val, J.M.; Abbas, R.; Abánades, A. Dry Cooling with Night Cool Storage to Enhance Solar Power Plants Performance in Extreme Conditions Areas. Appl. Energy 2012, 92, 429–436. [Google Scholar] [CrossRef]
- Wright, S.A.; Davidson, C.S.; Scammell, W.O. Bulk Energy Storage using a Supercritical CO2 Waste Heat Recovery Power Plant. In Proceedings of the 4th Int Symp—Supercrit CO2 Power Cycles, Pittsburg, PA, USA, 9–10 September 2014; Available online: http://sCO2symposium.com/papers2014/systemConcepts/84-Wright.pdf (accessed on 13 October 2019).
- González-Portillo, L.F.; Muñoz-Antón, J.; Martínez-Val, J.M. Thermodynamic Mapping of Power Cycles Working Around the Critical Point. Energy Convers. Manag. 2019, 192, 359–373. [Google Scholar] [CrossRef]
- González-Portillo, L.F. A New Concept in Thermal Engineering Optimization: The Pericritical Cycle with Multi-Heating and its Application to Concentrating Solar Power. Ph.D. Thesis, E.T.S.I. Industriales (UPM), Madrid, Spain, 2019. [Google Scholar] [CrossRef]
- Turchi, C.S.; Ma, Z.; Dyreby, J. Supercritical Carbon Dioxide Power Cycle Configurations for Use in Concentrating Solar Power Systems. In ASME Turbo Expo 2012: Turbine Technical Conference and Exposition; American Society of Mechanical Engineers Digital Collection: Copenhagen, Denmark, 2012; Volumes 1–7. [Google Scholar] [CrossRef]
- Coco-Enríquez, L.; Muñoz-Antón, J.; Martínez-Val, J.M. New Text Comparison Between CO2 and other Supercritical Working Fluids (Ethane, Xe, CH4 and N2) in Line-Focusing Solar Power Plants Coupled to Supercritical Brayton Power Cycles. Int. J. Hydrogen Energy 2017, 42, 17611–17631. [Google Scholar] [CrossRef]
- Vijaykumar, R.; Bauer, M.L.; Lausten, M.; Shultz, A.M. Optimizing the Supercritical CO2 Brayton Cycle for Concentrating Solar Power Application. In Proceedings of the 6th Int Symp—Supercrit CO2 Power Cycles, Pittsburgh, PA, USA, 27–29 March 2018; Available online: http://sCO2symposium.com/papers2018/power-plants-applications/093_Paper.pdf (accessed on 13 October 2019).
- Siddiqui, M.; Taimoor, A.; Almitani, K. Energy and Exergy Analysis of the s-CO2 Brayton Cycle Coupled with Bottoming Cycles. Processes 2018, 6, 153. Available online: http://www.mdpi.com/2227-9717/6/9/153 (accessed on 13 October 2019). [CrossRef]
- Marchionni, M.; Bianchi, G.; Tassou, S.A. Techno-Economic Assessment of Joule-Brayton Cycle Architectures for Heat to Power Conversion from High-Grade Heat Sources Using CO2 in the Supercritical State. Energy 2018, 148, 1140–1152. [Google Scholar] [CrossRef]
© 2019 by the authors. Licensee MDPI, Basel, Switzerland. This article is an open access article distributed under the terms and conditions of the Creative Commons Attribution (CC BY) license (http://creativecommons.org/licenses/by/4.0/).