Abstract
A significant rise of groundwater pollution has been registered worldwide, where nitrate has been recognized as the most widespread pollutant. In this context, the groundwater vulnerability assessment and more specifically the delineation of “Nitrate Vulnerable Zones” represents a reliable cost-effective tool for groundwater management. In this study, the Agricultural Nitrate Hazard Index (ANHI) method was applied to two case histories in southern Italy: the Lete River catchment and the eastern sector of the Campania Plain. The first area is characterized by agricultural activities and a low anthropic influence while the eastern part of the Campania Plain, around Caserta city, is strongly urbanized and developed on an extensive alluvial plain filled with volcaniclastic deposits. The parametric method applied suggests moderate hazard for the more natural setting highlighting how the intensive crop farming and livestock activities that characterized the area negatively influenced the results. For the eastern part of the Campania Plain, where a strong urbanization and widespread industrial crops are dominant, a low to very low hazard has been identified. The groundwater quality value, in contrast with the methodology results underlines the importance of further risk evaluations based on accurate aquifer characterization. A multiple year assessment based on land use change and climate variation could further highlights the difference between the study areas.
1. Introduction
Groundwater resources represent the most important freshwater supplies through the world especially in arid and semiarid regions, for all kinds of human utilizations and needs. Nevertheless, the human impacts connected to the numerous anthropogenic activities (agricultural, industrial, and domestic) have made these resources highly susceptible to external pollution and quality deterioration through time [1]. The groundwater pollution is generally a slow and threatening process that always produces negative effects on water quality and availability. Moreover, this process has some characteristics, such as (i) usually invisible, (ii) difficult to determinate, (iii) able to generate negative long-term impacts, and (iv) almost irreversible [2]. Among the various pollutant (organic and inorganic ones) that can affect groundwater quality, nitrate (NO3) is considered as the main and most worrying one since 1970 [3]. Aquifer NO3 pollution has become a frequent and serious problem especially in the high populated alluvial plains where it is principally derived from agricultural activities that usually spread fertilizers upon the territory [4,5,6,7,8]. The indiscriminate use of nitrogen fertilizers has been identified as the most widespread non-point source of pollutant all around the world [9,10,11,12,13]. The Directive 91/676/EEC, concerning the Protection of Waters against Pollution caused by Nitrates from Agricultural Sources considers surface freshwater and groundwater affected by NO3 pollution when its concentration exceeds 50 mg/L, because all the levels above this threshold can be considered dangerous for humans and the environment [14]. Moreover, if a concentration higher than 25 mg/L is detected, the water can be considered under high risk of pollution, making necessary the execution of protective and preventive measures [15]. Therefore, the protection of groundwater from NO3 pollution along with a preliminary identification of those areas more susceptible to the phenomena has become a key requirement for the realization of a sustainable regional groundwater management plan especially when an efficient and well distributing water quality monitoring system is missing. Different methodologies have been created and modified over time for the identification of those areas more susceptible to the groundwater pollution and to correctly assess NO3 groundwater vulnerability. They can be divided into three main categories: (i) ground/surface water numerical models, (ii) statistical analysis, and (iii) overlay rating-index. The numerical models like GLEAMS [16] and MODFLOW [17] can generate highly reliable results. For example, Podlasek et al. [18] simulated groundwater flow and NO3 transport inside a highly agricultural area. Nevertheless, they are often time-consuming and due to need of a large amount of data are usually restricted to site specific assessment. The statistical models are commonly used to obtain the spatial distribution of pollutant observed concentrations and sometimes are also utilized for groundwater vulnerability and water quality assessment [19,20,21]. Additionally, in this case they require a huge dataset to produce a reliable result and furthermore they did not account for the site hydrological characteristics. The last category of the rating methods is the most utilized and modified one to produce intrinsic and pollutant specific aquifer vulnerability assessment. A complete review, analyzing all the previous cited category is given in Machiwal et al. [22]. The main advantage of the rating methods lies in their ease of use, inasmuch the only need for the groundwater vulnerability assessment is the site’s hydrogeological information that usually are made available by the local authority’s website. As main drawback they can suffer from subjectivities and require real pollutant concentrations to be properly calibrated and validated [23,24]. Depending on the situation and on data availability, all these methodologies can represent a practical and useful tool for vulnerability maps realization and therefore useful for urban planning and risk assessment classification. Based on the Nitrate Directive 91/676/EEC, the Italian Government has defined the guidelines for the identification of areas vulnerable to nitrate pollution from agriculture, agro-livestock-related activities, and the protection thereof [25]. Following this directive, Padovani and Trevisan [26] proposed a methodology for calculating the hazard ratios by NO3 from agricultural sources (Agricultural Nitrate Hazard Index—ANHI method), referring to the structural plan and methodology of the Agricultural Hazard Indices (AHI) proposed by Capri et al. [27]. This method represents a parametric index able to rank the different sites in terms of their vulnerability to NO3 contamination, in a Geographic Information System (GIS) environment. GIS technique can provide an estimate of the groundwater vulnerability mapping at relatively low cost. The above index-based methodology is based on the elaboration of different thematic maps, each one connected to a specific site property, whose topologic overlay results in the synthetic ANHI Map. Although different methodologies were designed to delineate “Nitrate Vulnerable Zone” (NVZ) in recent years [28,29], the AHNI method provides a significant characterization in areas where very specific information are available. If easy and friendly susceptibility assessments allow to delineate NVZ on a large scale [28], the definition of the potential hazard from NO3 contamination originating from agriculture on a smaller scale becomes of paramount importance for management purposes [30,31]. To verify the validity of the methodology in different hydrogeological settings, as also suggested by Corniello and Ducci [32], the ANHI method was applied in two study areas strongly differentiated not only from a geological and socioeconomic point of view but also considering a degree of naturalization where the land cover and use strongly differ. The first site is located in the northern Campania region (southern Italy), corresponding to the catchment area of the Lete river (SITE A, Figure 1) while the second one is in the eastern Campania Plain and coincides with the sub-urban area of Caserta city and surrounding area (SITE B, Figure 1). The aims of this application are (i) to assess the NO3 susceptibility related to the surface anthropogenic activities in the two study areas and (ii) to compare the above settings to highlight the relationship between hazard values and land use in territories with different vocations. Furthermore, the main advantages and drawbacks of the applied methodology will be discussed to further define its applicability specifically in nonagricultural areas.
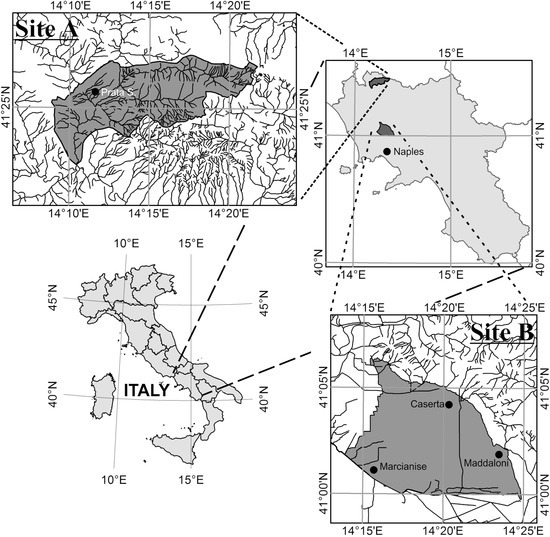
Figure 1.
Location map of the study sites where Site A indicates the Lete River catchment while Site B refers to the eastern Campania Plain sector.
2. Study Areas
2.1. Site A, the Lete River Catchment
The catchment area of the Lete River is located in the south-western sector of the Matese Mountains (Figure 2a), characterized by well bedded Meso-Cenozoic limestone and dolostone (Figure 2b). These rocks are deeply fractured and characterized by a karst system, evidenced also by the presence of numerous sinkholes [33], which strongly influences the hydrogeological setting [33]. The catchment area of the Lete River has a hierarchical order equal to 5 and is about 80 km2 wide. The hydrographic pattern, set mainly on carbonate bedrock, is parallel or slightly angled. The morphology of the area consists of rugged and locally inaccessible mountains; major tectonic features often result in deep valleys walled by steep to moderately steep flanks. The choice of this area is motivated by the presence of numerous springs of mineral waters, also of considerable socioeconomic interest [34,35], related to the complex structural arrangement of the area [36] that determined the existence of several hydrogeological basins. Land uses are predominantly dominated by agricultural activities, mainly cereal crops and livestock farming and subordinate tree crops [37] (Figure 2c). Based on di Gennaro [38], systems and subsystems of lands were identified related to different soil types (Figure 2d), divided into groups according to FAO [39].
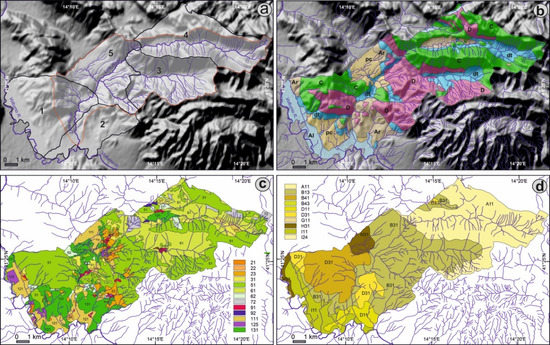
Figure 2.
(a) Digital elevation model of the study area (Shuttle Radar Topography Mission dataset): location of area (in red) and boundary of municipalities (in black): 1—Pratella, 2—Ailano, 3—Valle Agricola, 4—Letino, 5—Prata Sannita. (b) Lithological map: D—dolostones, C—limestones and dolomitic limestones, Ar—marly-calcareous sandstones, pc—coherent to incoherent pyroclastic deposit, dt—talus breccias, Al—alluvial deposits. (c) Land use map 2009 [37]: 21—vineyards, 22—fruit trees and berry plantations, 23—olive groves, 31—pastures, 51—broad-leaved forest, 61—natural grasslands, 62—sparsely vegetated areas, 72—bare rocks, 91—urban areas and artificial lands, 92—water bodies, 111—cereals crop, 125—industrial crops, 131—rotation grass. (d) Soil classification based on “I Sistemi di Terre” Map 2002 [38]: key as in Table S5.
2.2. Site B, Eastern Sector of Campania Plain
The second field of investigation includes the southern slopes of the Tifatini Mountains and the eastern part of the Campania Plain which together cover an area of about 166 km2 (Figure 3a). The hill sectors consist of Mesozoic limestone, intensely fractured and faulted, covered with thin pyroclastic deposits related to the volcanic activity of the Phlegrean Fields and the Vesuvius. The low-land area is mainly characterized by the Campania Grey Tuff (CGT) pyroclastic deposits and subordinated colluvial layers. The latter (Figure 3b) form a large piedmont glacis connected to the hills through wedges of detrital fans consisting of reworked volcanic and calcareous even coarse debris [40,41,42]. Below the CGT, marine and transitional sediments intercalated with pyroclastic layers [42,43,44] are found; above the CGT a discontinuous layer of paleosol, with a maximum thickness of 2 m [41,43], marks the transition to the thin volcaniclastic deposits of the Neapolitan Yellow Tuff. Alluvial sediments are present close to the hill slopes. The groundwater body, in the plain, is characterized by the presence of two superposed layers: the first one, a few meters b.g.l., is less important and mostly phreatic; the second one, known as the main aquifer, occurs at almost 40 m b.g.l., close to the carbonate slopes, rising up to a few meters b.g.l. in the plain sector [45]. This aquifer is continuously extended, semiconfined and mainly hosted in the pre-CGT pyroclastics. It is fed by the carbonate mountains, strongly karstified and faulted [46]. In the alluvial plain, tuff deposits and paleosols represent aquitards. The investigated area is highly urbanized and is the site of numerous industrial and agricultural activities [37]. Similarly to site A, systems and subsystems of lands were identified related to different soil types (Figure 3d) based on di Gennaro [38]. The eastern sector of the Campania Plain is characterized by a Peninsular Tyrrhenian climate according to the scheme proposed in Capri et al. [27], with values of precipitation between 600 and 1000 mm/year and average temperatures of 15–16 °C [47]. The choice of this site for the present analysis was dictated by the large number of anthropogenic activities, such as industrial and agricultural, the limited depth of the main groundwater table [45], and the numerous detected NO3 values beyond the threshold limit of 50 mg/L [10].
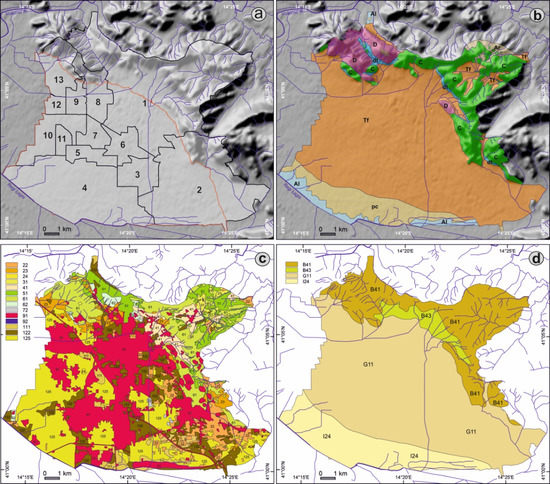
Figure 3.
(a) Digital elevation model of the study area (Shuttle Radar Topography Mission dataset): location of area (in red) and boundary of municipalities (in black): 1—Caserta 2—Maddaloni, 3—San Marco Evangelista, 4—Marcianise, 5—Capodrise, 6—San Nicola La Strada, 7—Recale, 8—Casagiove, 9 Casapulla, 10—Macerata Campania, 11—Portico di Caserta, 12—Curti, 13—San Prisco. (b) Lithological map: D—dolostones, C—limestones and dolomitic limestones, Ar—marly-calcareous sandstones, Tf—Campanian Grey Tuff, dt—talus breccias, Al—alluvial deposits. (c) Land use map 2009 [37]: 22—fruit trees and berry plantations, 23—olive groves, 24—citrus orchards, 31—pastures, 41—annual crops associated with permanent crops, 51—broad-leaved forest, 61—natural grasslands, 62—sparsely vegetated areas, 72—bare rocks, 91—urban areas and artificial lands, 92—water bodies, 111—cereals crop, 122—horticultural crops, 125—industrial crops. (d) Soil classification based on “I sistemi di Terre” Map 2002 [38]: key as in Table S5.
3. Materials and Methods
3.1. The ANHI Method
The ANHI method is based on a parametric approach developed in 2002 by Padoan and Trevisan [26], following the Directive 91/676/EC (reiterated by the new 2006/118/EC) concerning the protection of water from pollution caused by nitrates from agricultural sources. The method allows to assess the potential hazard of groundwater contamination by nitrates from agricultural sources through the analysis of two factors types that come into play in the hazard assessment: the Hazard Factors (HF) that discriminate the different agronomic practices like fertilization, manure and sludge application, and the Control Factors (CF), connected to the climate and landscape characteristics like soil type and meteorological condition. A scoring was assigned to each one, on the basis of the weight they assume in the final evaluation.
The HF identify agricultural activities which supply or may supply nitrogen amount to soil and then produce impacts on the aquifer. Five hazard classes were assigned to them (Table 1)

Table 1.
Nitrogen supply from different fertilization types and relative hazard classes [26].
The CF refer to the intrinsic parameters of the site, which can potentially modify the HF in a positive, negative, or null way. The CF represent those factors (climatic, pedologic, and agronomic) that regulate the hydrologic balance and determine the behavior of nitrates in soil. In the ANHI calculation these factors are the natural nitrogen content in soil, the climate, agronomic practices, and the irrigation system used. The ranking of each CF is shown in Table 2, Table 3, Table 4 and Table 5.
Table 2.
Control classes for the soil nitrogen content (CFa).
Table 3.
Control classes for the climate (CFc).
Table 4.
Control classes for agronomic practices (CFpa).
Table 5.
Control classes for the irrigation system (CFi).
The whole procedure was elaborated into a GIS environment and the ANHI Map was produced for the two sites (details in Supplementary Materials). The final ANHI index was estimated by the formula:
where HF represent all the farming activities (HFfm is mineral fertilizer, HFfo is organic fertilizer, and HFfd represents sludges) and CF the control factors (CFa is nitrogen soil content, CFc is climate, CFpa indicates agronomy practices, and CFi is the irrigation amount). Finally, the values obtained, ranked based on percentiles of 135,125 possible combinations, express the degree of potential hazard.
AHNIg = (HFfm + HFfo + HFfd) × (CFa × CFc × CFpa × CFi)
3.2. The GIS Elaboration
To define CF and HF, spatially related data were acquired and then processed into a GIS environment. The information system developed consists of a relational geodatabase in which alphanumeric data, vector and raster cartography were collected (Figure 4). The maps are referred to the WGS84 ellipsoid and to the Universal Transverse Mercator Zone 33 system. Among the cartographic documents, the Agricultural Soil Use Map (Carta dell’Uso Agricolo del Suolo—CUAS) of Campania [37] plays a key role in the calculation of ANHI, as the factors to consider are mainly estimated based on areal extensions of the individual agro-forestry units. A supply amount of nitrogen was assigned for each crop according to the FAO guidelines and previous literature. The soil characteristics, such as composition and texture, derived from di Gennaro [38], were assigned to the territorial units reported in the hierarchical map “Land Systems of the Campania”, each of which is characterized by a relative concentration of nitrates (Table S5). The Land System represents homogeneous geomorphological units with respect to lithology, climate, pedology, vegetation, and agro-forestry. Among them, Land Sub-Systems are represented by soils, classified based on Word Reference Base (FAO, 1998) (Table S5). The estimated load of nitrogen supplied through the spreading of fertilizer can be deduced from the number of animals in the area. For this purpose, the data published by the National Institute of Statistics (ISTAT) for all the analyzed municipalities for the year 2007 was utilized (Supplementary Materials). The method followed for the definition of CF and HF and the corresponding hazard class, with all the approximations, is summarized in Table S1 in Supplementary Materials. Through the topological overlay, the intersection of cartographic documents, exclusively in vector format, led to a partitioning of the investigated areas; in this way each partition is characterized by attributes, represented by the scores provided by the method, relating to each single factor which contributes to the assessment of the hazard.
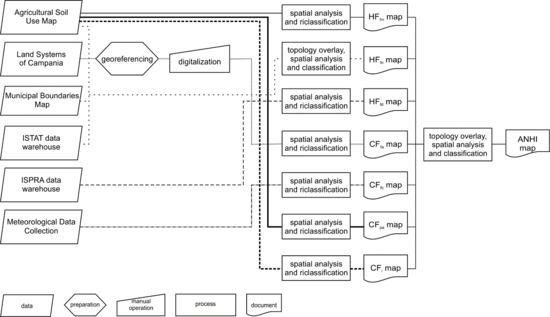
Figure 4.
Flow chart of the Geographic Information System realized showing the input data, the analytical processes, and the final map output.
4. Results
4.1. ANHI Assessment in the Lete River
Given that each land subsystem can be characterized by different types of soil, with diversified content of nitrogen, to rank the CFa the highest score to have broader control ranges was assigned. Based on data of the National Hydrographic Service (Department of Naples; 2004), the values of average annual rainfall, measured in a time interval between 1916 and 1999, account to more than 1200 mm/year, with an average temperatures ranging between 6 and 15 °C. Based on these values, the Matese climate is accounted in the control class with a score of 1.10 [27,48]. The assessment of hazard indexes was extended to a wider area with respect to the river catchment as the estimate of some factors (HFfo, CFpa) is based on parameters related to municipal areas which together cover an area larger than the catchment one (Figure 5a). The spatial analysis performed on the whole area shows (Figure 5b) that more than 60% of the territory is ranked as potential hazard class 2 (very low); significantly lower percentages of territory are assigned to class 4 (28.19%: moderate, especially along the Valle Agricola mountain basin) and class 3 (11.71%: low). The areas that expose the region to higher potential hazard (moderate) are those used for grazing (61), and to a lesser extent those intended for the production of cereals (111 and 121) and grass meadows (132). Low or very low classes are especially related to those areas still in pastures and “alfalfa” production. The woods are the type of land use more widespread, but the exposure to a potential hazard of nitrate contamination is very low.
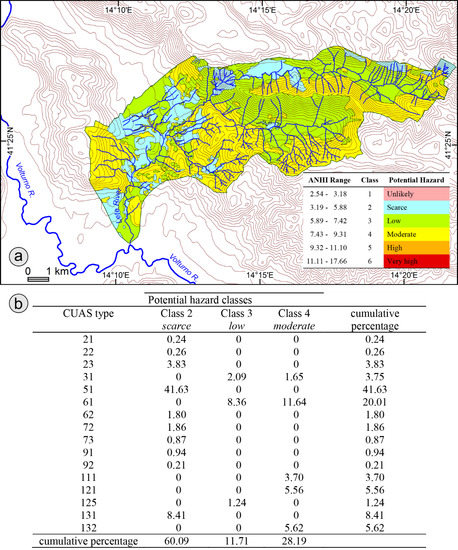
Figure 5.
(a) Agricultural Nitrate Hazard Index map; in legend classification of Agricultural Nitrate Hazard Index (ANHI) with the related scores assigned to each class; (b) percentage value of potential hazard class related to the Agricultural Soil Use Map (Carta dell’Uso Agricolo del Suolo—CUAS) class.
4.2. ANHI Assessment in the North-East Sector of the Campania Plain
The analysis of the parametric data (Figure 6b) derived from the ANHI Map shows that a large part of the area (about 96.6%), considered with respect to the whole administrative boundaries, presents hazard classes 2 (very low—49.34%:) and 3 (low—47.30%:); lower percentage unit (approximately 1.6%) are related to the class 4 (moderate) and class 1 (unlikely) (Table 6). In detail, the main hazard comes by areas ranked as of low potential risk, attributed to pasture areas and natural grasslands (61) and those intended for the production of industrial crops (125) and horticultural crops (122). Areas designed to accommodate fruit trees and berry plantations (22) are ranked as very low potential hazard. If the sole flat land is considered, comprised between the heights of 80 and 20 m above sea level, about 106 km2 wide (Figure 6a), which is the most populated area and is mainly used for intensive agricultural purposes (125 and 122), it is noted that this area is mainly characterized by a potential low hazard (about 49%). Finally, excluding the urban areas and the artificial surfaces, areas with very low hazard potential are widespread (approximately 9%) (Figure 6b).
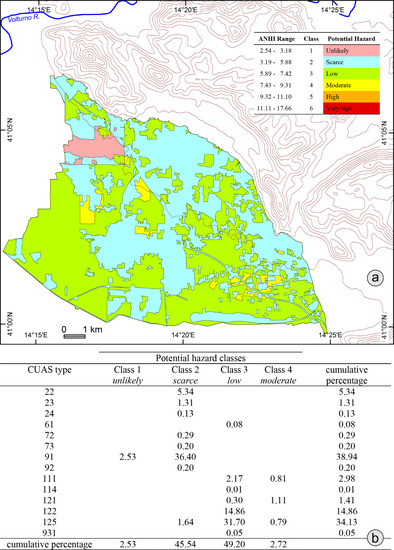
Figure 6.
(a) Agricultural Nitrate Hazard Index map in the sector comprised between 80 and 20 m a.s.l.; in legend classification of ANHI with the related scores assigned to each class; (b) percentage value of potential hazard class related to CUAS class.
Table 6.
Potential hazard ranking for the study sites.
5. Discussions
A correct estimation of Nitrate Vulnerable Zone (NVZ) is becoming a key issue for public authorities, and in this context the rating methodologies based on overlay index and weights system have found a fertile field of application especially in the last 20 years. Several studies have yet stated how land-use patterns, type of aquifer, and soil-drainage capacity strongly influence nitrate contamination [49,50,51]. This has made necessary to choose the most suitable methodology for the delineation of groundwater vulnerability zones according to the site characteristic and data availability to define optimal management strategies [52]. Accordingly, with the results obtained from the two applications, the agricultural and livestock activities, strongly influence the final susceptibility to the NO3 pollution [53,54]. Despite the higher naturality of Lete River catchment compared to the analyzed municipality of Caserta, the intensive agricultural activities along with grazing and manure practices much more negatively influenced the final vulnerability to NO3 pollution in this zone. It is worth mentioning that those areas characterized with the higher susceptibility to NO3 pollution are not necessarily the same area with higher nitrate concentrations. Indeed, the proposed methodology greatly differs from a canonical groundwater vulnerability assessment as ANHI considers only the parameters directly correlated with NO3 pollution processes, while such intrinsic site factors such as depth to the water table, vadose zone, and aquifer characteristic are completely neglected. These differences can lead to completely different results. It is noteworthy that the evaluations carried out through the parametric ANHI analysis are forward-looking and therefore require validation through groundwater chemical and physical analyses. In fact the results obtained through the application of the method are in contradiction with the concentration data obtained through geochemical analysis of groundwater obtained from literature: for example the values of NO3 concentration dissolved in the commercial water (Prata and Lete), bottled at the Pratella spring (Lete River), are about 4 mg/L, whereas the values estimated in the water abstracted in the eastern Campanian Plain are significantly higher (about 50 mg/L) [32]. In this latter case, it is not excluded the direct contribution of nitrate leached by the widespread volcanic soils and by the pyroclastic substrate; in fact, it has been established that these types of soils are generally rich in nitrates [55,56]. In addition, in this sector of the Campania Plain that includes the Caserta municipality, previous studies have stated that although the region is characterized by a lower intrinsic vulnerability to external pollution, a much more higher risk is highlighted due to the domestic wastewater and a general bad maintenance of well and sewers [10,11]. Accordingly, also Busico et al. [10] reported NO3 groundwater concentration 2–3 times higher than the 50 mg/L, especially in sub-urban areas. The results also highlighted the main drawbacks of the methodology that required for its application very detailed input data. It is also evident how the absence of parameters relating to the vadose zone and aquifer characteristics could bring erroneous results. Nevertheless, the method clearly analyzes only the sources of nitrates derived from crops and livestock farming, and therefore an area with a high naturalness, but mainly used for agricultural and pastoral activities, has higher chance of contamination than another characterized by intense urbanization. Summarizing, the ANHI method has proven to be highly suitable in describing the aquifer pollution suitability related to the human surface activities making its utilization especially useful in assessing and predicting the potential pollution impact of the various land use change practices. It is worth mentioning that this method needs to be further integrated with more specific analysis such as groundwater monitoring, quality and intrinsic vulnerability assessment to obtain a proper and reliable evaluation. In fact, both methods aim at the drafting of cartographic results which can interact with each other allowing the realization of more detailed risk maps. For example, Riseei et al. [57] integrated a similar ANHI methodology with multivariate data-driven model to assess NO3 pollution in a semiarid environment in Iraq and Kazemi et al. [58] improved the NVZ distribution using different interpolation methods. Considering this characteristic, it is necessary to make the appropriate consideration accordingly with the real pollution situation without stopping at preliminary results. This is mandatory considering that a future worst scenario will occur if correct land management planning is not applied, assisted by rigorous groundwater monitoring from a quantitative and qualitative point of view.
6. Conclusions
The ANHI methodology was successfully applied in two different study areas. The results obtained in this study show that while in the eastern margin of the Campania Plain the potential hazard of contamination is low or very low (ca. 96%) although the area is highly anthropized, about 28% of the catchment area of the Lete River, that is very natural, is characterized by moderate potential hazard mainly linked to husbandry activities that could represent a serious risk for groundwater quality. It is also true that the methodology did not account in the evaluation of the impacts due to civil and industrial wastewater, may be not governed by adequate disposal facilities that also in this case can negatively impact on groundwater quality especially in highly urbanized areas. However, this method has proven to be a valuable tool in evaluating the effect of the various surface agricultural practices, and to be potentially applied worldwide, especially where specific information is available. Moreover, the structuring of a GIS, based on the division into portions of the investigated areas, each linked to a single record of continuously upgradeable fields, enables the verification of the spatial and temporal variations of the different factors, allowing continuous monitoring aimed at the preservation of the water resources and the territory as a whole.
Supplementary Materials
The following are available online at https://www.mdpi.com/2076-3298/7/10/80/s1, Table S1: Ranking scheme of the hazard factors (HF) and the control factors (CF). The former are referred to agricultural activities which produce or may produce impacts on the aquifers; the latter are referred to parameters which modify the hazard factors in positive, negative, or null way. Table S2: Nitrogen supply from the different adopted crops. Table S3: HFfm scores for the different crops recognized in the study area, based on CUAS. Table S4: HFfm scores for the different crops recognized in the study area, based on CUAS. Table S5: The main soil types found and relationship between soil and nitrate concentration. Table S6: Correlation between CUAS type and fertilization type. Table S7: Correlation between CUAS type and irrigation systems. Appendix: Land System of Campania Plain.
Author Contributions
Conceptualization, M.V., G.B., and D.R.; methodology, M.V., D.R.; software, M.V.; validation, M.V., B.G.; formal analysis, M.V.; investigation, M.V., G.B., D.R., resources, M.V.; data curation, M.V.; writing—original draft preparation, M.V., D.R.; writing—review and editing, B.G., D.R.; supervision, D.R. All authors have read and agreed to the published version of the manuscript.
Funding
This research received no external funding.
Conflicts of Interest
The authors declare no conflict of interest.
References
- Razandi, Y.; Pourghasemi, H.R.; Neisani, N.S.; Rahma, O. Application of analytical hierarchy process, frequency ratio, and certainty factor models for groundwater potential mapping using GIS. Earth Sci. Inform. 2015, 8, 867–883. [Google Scholar] [CrossRef]
- Chenini, I.; Zguibi, A.; Kouzana, L. Hydrogeological investigations and groundwater vulnerability assessment and mapping for groundwater resource protection and management: State of the art and a case study. Afr. Earth Sci. 2015, 109, 11–26. [Google Scholar] [CrossRef]
- Townsend, A.R.; Howarth, R.W.; Bazzaz, F.A.; Booth, M.S.; Cleveland, C.C.; Collinge, S.K.; Dobson, A.P.; Epstein, P.R.; Holland, E.A.; Keeney, D.R.; et al. Human health effects of a changing global nitrogen cycle. Front. Ecol. Environ. 2003, 1, 240–246. [Google Scholar] [CrossRef]
- Rufino, F.; Busico, G.; Cuoco, E.; Darrah, T.H.; Tedesco, D. Evaluating the suitability of urban groundwater resources for drinking water and irrigation purposes: An integrated approach in the Agro-Aversano area of southern Italy. Environ. Monit. Assess. 2019, 191, 768. [Google Scholar] [CrossRef]
- Li, Y.; Zhang, Z.; Fei, Y.; Chen, H.; Qian, Y.; Dun, Y. Investigation of quality and pollution characteristics of groundwater in the Hutuo river alluvial plain, North China plain. Environ. Earth Sci. 2016, 75, 581. [Google Scholar] [CrossRef]
- Busico, G.; Kazakis, N.; Cuoco, E.; Colombani, N.; Tedesco, D.; Voudouris, K.; Mastrocicco, M. A novel hybrid method of specific vulnerability to anthropogenic pollution using multivariate statistical and regression analyses. Water Res. 2020, 171, 115386. [Google Scholar] [CrossRef]
- Bui, D.T.; Khosravi, K.; Karimi, M.; Busico, G.; Khozani, Z.S.; Nguyen, H.; Mastrocicco, M.; Tedesco, D.; Cuoco, E.; Kazakis, N. Enhancing nitrate and strontium concentration prediction in groundwater by using new data mining algorithm. Sci. Total Environ. 2020, 715, 136836. [Google Scholar] [CrossRef]
- Mastrocicco, M.; Colombani, N.; Palpacelli, S.; Castaldelli, G. Large tank experiment on nitrate fate and transport: The role of permeability distribution. Environ. Earth Sci. 2011, 63, 903–914. [Google Scholar] [CrossRef]
- Menció, A.; Boy, M.; Mas-Pla, J. Analysis of vulnerability factors that control nitrate occurrence in natural springs (Osona Region, NE Spain). Sci. Total Environ. 2011, 409, 3049–3058. [Google Scholar] [CrossRef]
- Busico, G.; Cuoco, E.; Sirna, M.; Mastrocicco, M.; Tedesco, D. Aquifer vulnerability and potential risk assessment: Application to an intensely cultivated and densely populated area in Southern Italy. Arab. J. Geosci. 2017, 10, 222. [Google Scholar] [CrossRef]
- Busico, G.; Kazakis, N.; Colombani, N.; Mastrocicco, M.; Voudouris, K.; Tedesco, D. A modified SINTACS method for groundwater vulnerability and pollution risk assessment in highly anthropized regions based on NO3− and SO42− concentrations. Sci. Total Environ. 2017, 609, 1512–1523. [Google Scholar] [CrossRef]
- Puig, R.; Soler, A.; Widory, D.; Mas-Pla, J.; Domènech, C.; Otero, N. Characterizing sources and natural attenuation of nitrate contamination in the Baix Ter aquifer system (NE Spain) using a multi-isotope approach. Sci. Total Environ. 2017, 580, 518–532. [Google Scholar] [CrossRef]
- Kazakis, N.; Matiatos, I.; Ntona, M.M.; Bannenberg, M.; Kalaitzidou, K.; Kaprara, E.; Mitrakas, M.; Ioannidou, A.; Vergemezis, G.; Voudouris, K. Origin, implications and management strategies for nitrate pollution in surface and ground waters of Anthemountas basin based on a δ15N-NO3− and δ18O-NO3− isotope approach. Sci. Total Environ. 2020, 724, 138211. [Google Scholar] [CrossRef]
- Sutton, M.A.; Howard, C.M.; Erisman, J.W.; Billen, G.; Bleeker, A.; Grennfelt, P.; van Grisven, H.; Grizzetti, B. The European Nitrogen Assessment: Sources, Effects and Policy Perspectives; Cambridge University Press: Cambridge, UK, 2011. [Google Scholar]
- European Commission. Report from the Commission to the Council and the European Parliament on Implementation of Council Directive 91/676/EEC Concerning the Protection of Waters against Pollution Caused by Nitrates from Agricultural Sources Based on Member State Reports for the Period 2004–2007; European Commission: Brussels, Belgium, 2011. [Google Scholar]
- Leonard, R.A.; Knisel, W.G.; Still, D.A. Gleams: Groundwater loading effects of agricultural management systems. Trans. Am. Soc. Agric. Eng. 1987, 30, 1403–1418. [Google Scholar] [CrossRef]
- Harbaugh, A.W.; Banta, E.R.; Hill, M.C.; McDonald, M.G. The US Geological Survey Modular Ground-Water Model-User Guide to Modularization Concepts and the Ground-Water Flow Process; Open-file Report 00-92; Geological Survey (U.S.): Reston, VA, USA, 2000.
- Podlasek, A.; Bujakowski, F.; Koda, E. The spread of nitrogen compounds in an active groundwater exchange zone within a valuable natural ecosystem. Ecol. Eng. 2020, 146, 105746. [Google Scholar] [CrossRef]
- Busico, G.; Cuoco, E.; Kazakis, N.; Colombani, N.; Mastrocicco, M.; Tedesco, D.; Voudouris, K. Multivariate statistical analysis to characterize/discriminate between anthropogenic and geogenic trace elements occurrence in the Campania Plain, Southern Italy. Environ. Pollut. 2018, 234, 260–269. [Google Scholar] [CrossRef] [PubMed]
- Zhang, Y.; Xu, M.; Li, X.; Qi, J.; Zhang, Q.; Guo, J.; Yu, L.; Zhao, R. Hydrochemical characteristics and multivariate statistical analysis of natural water system: A case study in Kangding County, Southwestern China. Water 2018, 10, 80. [Google Scholar] [CrossRef]
- Ahmad, T.; Gupta, G.; Sharma, A.; Kaur, B.; Alsahli, A.A.; Ahmad, P. Multivariate Statistical Approach to Study Spatiotemporal Variations in Water Quality of a Himalayan Urban Fresh Water Lake. Water 2020, 12, 2365. [Google Scholar] [CrossRef]
- Machiwal, D.; Cloutier, V.; Güler, C.; Kazakis, N. A review of GIS-integrated statistical techniques for groundwater quality evaluation and protection. Environ. Earth Sci. 2018, 77, 681. [Google Scholar] [CrossRef]
- Kazakis, N.; Voudouris, K. Groundwater vulnerability and pollution risk assessment of porous aquifers to nitrate: Modifying the drastic method using quantitative parameters. J. Hydrol. 2015, 525, 13–25. [Google Scholar] [CrossRef]
- Huan, H.; Jinsheng, W.; Yanguo, T. Assessment and validation of groundwater vulnerability to nitrate based on a modified DRASTIC model: A case study in Jilin City of northeast China. Sci. Total Environ. 2012, 440, 14–23. [Google Scholar] [CrossRef] [PubMed]
- D.Lgs 18 agosto 2000, No. 258. Disposizioni correttive ed integrative del decreto legislativo 11 maggio 1999, No. 152, in materia di tutela delle acque dall’inquinamento, a norma dell’articolo 1, comma 4, della legge 24 aprile 1998, No. 128. Available online: https://www.camera.it/parlam/leggi/deleghe/testi/00258dl.htm (accessed on 21 August 2020).
- Padovani, L.; Trevisan, M. I Nitrati di Origine Agricola Nelle Acque Sotterranee. Quaderni di Tecniche di Protezione Ambientale 75. Pitagora Editrice 2002, 15, 103. [Google Scholar]
- Capri, E.; Padovani, L.; Trevisan, M. La Previsione della Contaminazione Delle Acque Sotterranee da Prodotti Fitosanitari; Pitagora: Bologna, Italy, 1999. [Google Scholar]
- Busico, G.; Mastrocicco, M.; Cuoco, E.; Sirna, M.; Tedesco, D. Protection from natural and anthropogenic sources: A new rating methodology to delineate “Nitrate Vulnerable Zones”. Environ. Earth Sci. 2019, 78, 104. [Google Scholar] [CrossRef]
- Ducci, D. An Easy-to-Use Method for Assessing Nitrate Contamination Susceptibility in Groundwater. Geofluids 2018, 2018, 1371825. [Google Scholar] [CrossRef]
- Arauzo, M. Vulnerability of groundwater resources to nitrate pollution: A simple and effective procedure for delimiting Nitrate Vulnerable Zones. Sci. Total Environ. 2017, 575, 799–812. [Google Scholar] [CrossRef]
- Matzeu, A.; Secci, R.; Uras, G. Methodological approach to assessment of groundwater contamination risk in an agricultural area. Agric. Water Manag. 2017, 84, 46–58. [Google Scholar] [CrossRef]
- Pisciotta, A.; Cusimano, G.; Favara, R. Groundwater nitrate risk assessment using intrinsic vulnerability methods: A comparative study of environmental impact by intensive farming in the Mediterranean region of Sicily, Italy. J. Geochem. Explor. 2015, 156, 89–100. [Google Scholar] [CrossRef]
- Corniello, A.; Ducci, D. Groundwater chemistry and contamination in the Volturno River Plain (Southern Italy). In Groundwater and Ecosystems: Lisbon 2007: Abstract Book: XXXV IAH Congress, International Association of Hydrogeologists, Proceedings of the XXXV IAH Congress “Groundwater and Ecosystems”, Lisbon, Portugal, 17–21 September 2007; Ribeiro, L., Chambel, A., Condesso de Melo, M.T., Eds.; International Association of Hydrogeologists: Lisbon, Portugal, 2007. [Google Scholar]
- Del Prete, S.; De Riso, R.; Santo, A. Primo contributo sui sinkholes di origine naturale in Campania. In Atti del Convegno Stato dell’arte Sullo Studio dei Fenomeni di Sinkhole e Ruolo Delle Amministrazioni Statali e Locali nel Governo del Territorio; APAT: Roma, Italy, 2004; pp. 361–376. [Google Scholar]
- Corniello, A.; Ducci, D.; Guarino, P.M. I rilievi carbonatici del Matese Occidentale e la Piana di Venafro: Idrogeologia e idrogeochimica. Boll. Soc. Geol. Ital. 1999, 118, 523–535. [Google Scholar]
- Corniello, A. Considerazioni idrogeologiche su talune acque minerali e termominerali della provincia di Caserta. Mem. Soc. Geol. Ital. 1988, 41, 1053–1063. [Google Scholar]
- Ietto, A. Assetto strutturale e ricostruzione paleogeografica del Matese occidentale (Appennino meridionale). Soc. Nat. Napoli 1970, 78, 441–471. [Google Scholar]
- Carta Dell’utilizzazione Agricola Dei Suoli Della Campania in Scala 1:50.000; Napoli, SESIRCA—Settore Sperimentazione Informazione ricerca e Consulenza in Agricoltura della Regione Campania. 2004. Available online: https://sit2.regione.campania.it/content/carta-utilizzazione-agricola-dei-suoli (accessed on 21 August 2020).
- Di Gennaro, A. I Sistemi di Terre Della Campania; S.EL.CA: Firenze, Italy, 2008. [Google Scholar]
- FAO. World Reference Base for Soil Resources; World Soil Resources Report 84; Food and Agriculture Organization of the United Nations: Rome, Italy, 1998. [Google Scholar]
- Di Girolamo, P. Piroclastiti stratificate riferibili al II periodo flegreo nella pianura campana tra il Volturno e Napoli. Per. Mineral. 1968, 37, 341–371. [Google Scholar]
- Putignano, M.L.; Ruberti, D.; Tescione, M.; Vigliotti, M. Evoluzione recente di un territorio di pianura a forte sviluppo urbano: La Piana Campana nell’area di Caserta. Boll. Soc. Geol. Ital. 2007, 126, 11–24. [Google Scholar]
- Ruberti, D.; Vigliotti, M.; Marzaioli, R.; Pacifico, A.; Ermice, A. Stratigraphic architecture and anthropic impacts on subsoil to assess the intrinsic potential vulnerability of groundwater: The northeastern Campania Plain case study, southern Italy. Environ. Earth Sci. 2014, 71, 319–339. [Google Scholar] [CrossRef]
- Ruberti, D.; Vigliotti, M.; Rolandi, R.; Di Lascio, M. Effect of palaeomorphology on facies distribution of the Campania Ignimbrite in the northern Campania Plain, southern Italy. In Vesuvious, Campi Flegrei and Campanian Volcanism; De Vivo, B., Belkin, H.E., Rolandi, G., Eds.; Elsevier: Amsterdam, The Netherlands, 2019; Chapter 9; pp. 207–229. ISBN 9780128164549. [Google Scholar] [CrossRef]
- Aprile, F.; Sbrana, A.; Toccaceli, R.M. Il ruolo dei depositi piroclastici nell’analisi cronostratigrafica dei terreni quaternari del sottosuolo della Piana Campana (Italia meridionale). Il Quaternario 2004, 17, 547–554. [Google Scholar]
- Corniello, A.; Ducci, D.; Musmarra, D. Lo Stato delle Conoscenze Acquisite sulle Acque Sotterranee del Bacino Nord—Occidentale Propedeutico alla Redazione del Piano di Tutela Delle Acque; S.EL.CA: Firenze, Italy, 2004. [Google Scholar]
- Celico, P.; Civita, M.; Cornelio, A. Idrogeologia del margine nord-orientale della Conca Campana (Massicci dei Tifatini e del M. Maggiore). Mem. Note Ist. Geol. Appl. UNIV. Napoli. 1977, 13, 1–29. [Google Scholar]
- Mastrocicco, M.; Busico, G.; Colombani, N. Deciphering Interannual Temperature Variations in Springs of the Campania Region (Italy). Water 2019, 11, 288. [Google Scholar] [CrossRef]
- Capri, E.; Civita, M.; Corniello, A.; Cusimano, G.M.; De Maio, M.; Ducci, D.; Fait, G.; Fiorucci, A.; Hauser, S.; Pisciotta, A.; et al. Assessment of nitrate contamination risk: The Italian experience. J. Geochem. Explor. 2009, 102, 71–86. [Google Scholar] [CrossRef]
- Wongsanit, J.; Teartisup, P.; Kerdsueb, P.; Tharnpoophasiam, P.; Worakhunpiset, S. Contamination of nitrate in groundwater and its potential human health: A case study of lower Mae Klong river basin, Thailand. Environ. Sci. Pollut. Res. 2015, 22, 11504–11512. [Google Scholar] [CrossRef]
- Ascott, M.J.; Gooddy, D.C.; Wang, L.; Stuart, M.E.; Lewis, M.A.; Ward, R.S.; Binley, A.M. Global patterns of nitrate storage in the vadose zone. Nat. Commun. 2017, 8, 1416. [Google Scholar] [CrossRef]
- Klaas, K.S.Y.; Imteaz, M.A.; Arulrajah, A. Development of groundwater vulnerability zones in a data-scarce eogenetic karst area using Head-Guided Zonation and particle tracking simulation methods. Water Res. 2017, 122, 17–26. [Google Scholar] [CrossRef]
- Pinardi, M.; Soana, E.; Laini, A.; Bresciani, M.; Bartoli, M. Soil system budgets of N, Si and P in an agricultural irrigated watershed: Surplus, differential export and underlying mechanisms. Biogeochemistry 2018, 140, 175–197. [Google Scholar] [CrossRef]
- Castaldelli, G.; Soana, E.; Racchetti, E.; Pierobon, E.; Mastrocicco, M.; Tesini, E.; Fano, E.A.; Bartoli, M. Nitrogen budget in a lowland coastal area within the po river basin (Northern Italy): Multiple evidences of equilibrium between sources and internal sinks. Environ. Manag. 2013, 52, 567–580. [Google Scholar] [CrossRef] [PubMed]
- Schroeder, D. Structure and weathering of potassium containing minerals. Proc. Cong. Int. Potash Inst. 1979, 11, 43–63. [Google Scholar]
- Bertsch, P.M.; Thomas, G.W. Potassium status of temperate region soils. In Potassium in Agriculture; Munson, R.D., Ed.; American Society of Agronomy: Madison, WI, USA, 1985; pp. 131–162. [Google Scholar]
- Rizeei, H.M.; Azeez, O.S.; Pradhan, B.; Khamees, H.H. Assessment of groundwater nitrate contamination hazard in a semi-arid region by using integrated parametric IPNOA and data-driven logistic regression models. Environ. Monit. Assess. 2018, 190, 633. [Google Scholar] [CrossRef] [PubMed]
- Kazemi, E.; Karyab, H.; Emamjome, M. Optimization of interpolation method for nitrate pollution in groundwater and assessing vulnerability with IPNOA and IPNOC method in Qazvin plain. J. Environ. Health Sci. Eng. 2017, 15, 23. [Google Scholar] [CrossRef] [PubMed]
© 2020 by the authors. Licensee MDPI, Basel, Switzerland. This article is an open access article distributed under the terms and conditions of the Creative Commons Attribution (CC BY) license (http://creativecommons.org/licenses/by/4.0/).