1. Introduction
1.1. Acid Mine Drainage
Mineral exploration frequently targets sulfide ore bodies. When this occurs, drill cuttings rich in sulfides are generated. Mineralized surface rock with sulfides naturally oxidize, forming sulfuric acid and releasing metals in the rock matrix; iron-rich red staining from this process is frequently seen (Equation (1)).
Disposal of sulfide-rich drill cuttings is expected to similarly allow them to oxidize and lead to the development of acid on cuttings surface with consequent metals release. However, documentation of this effect is absent in the literature. In the summer of 2016, we conducted an investigation of a mineralized area, the Pebble deposit in Southwest Alaska, that had seen intensive exploration drilling but no mining, and sampled drill cuttings that remained on the surface.
1.2. Site Location
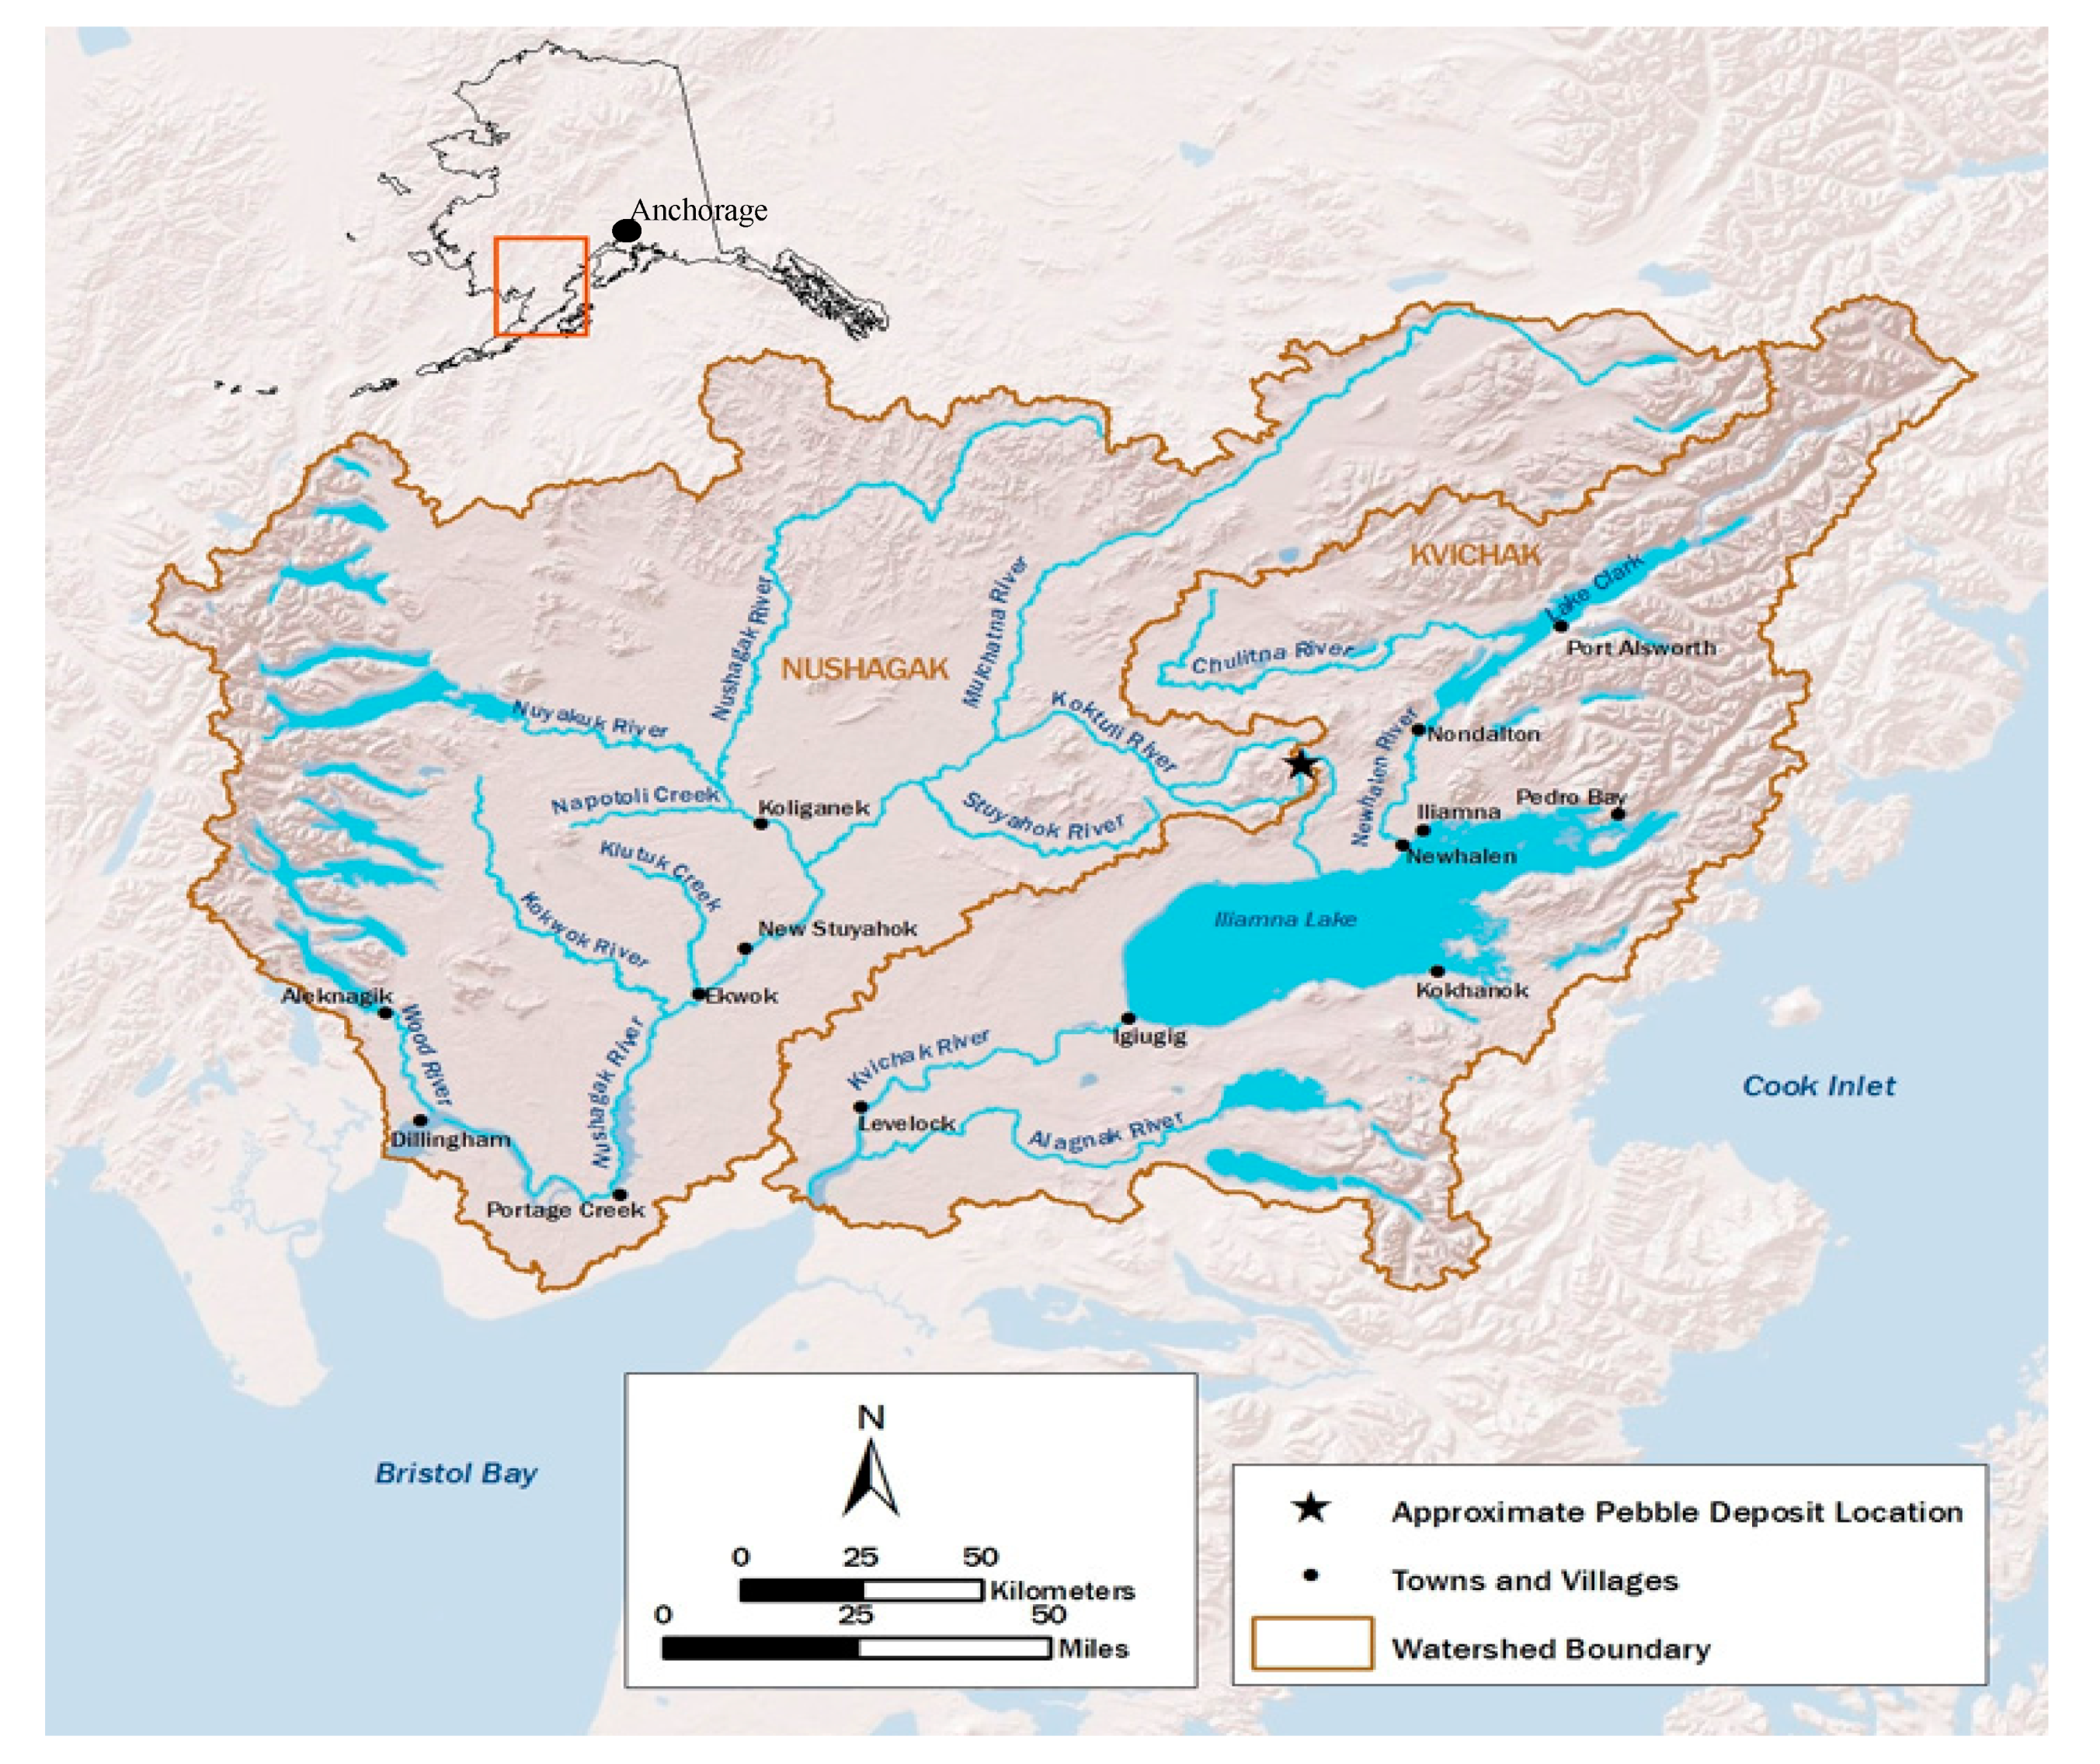
The site is located 320 km by air from Anchorage, and 16 km from Nondalton village (
Figure 1). Field crew were transported by helicopter daily from the nearby village of Nondalton from 1–5 August 2016. Sampling was conducted from 1–5 August 2016.
The deposit landscape consists of low rolling hills with lakes, small ponds, wetlands, and over 4000 documented springs [
1]. The main deposit is on a high plateau at about 305 m asl (meters above sea level), bordered by hills of approximately 450–600 m asl. East of the deposit plateau, the landscape drops to a wide plain, rich in artesian waters, at about 260 m asl. The deposit is bounded on all sides by highly productive salmon streams. Salmon have been documented in tributaries throughout the area, including in waters on top of the deposit [
2].
1.3. Mineral Exploration
Mineral exploration drilling for porphyry Cu, Au, and Mo at the proposed Pebble mine in Southwestern Alaska began in 1988 and intensified during 2004–2012. In total 1355 holes were drilled, ranging in depth from a few meters up to 1830 m deep. No drilling was conducted after 2012. Holes targeting the ore body are designated as DDH (diamond drill hole); holes drilled to determine bedrock competency are designated as GH (geophysical holes) and are generally shallow (less than 100 m). The first number of the drill hole identifier provides the year of drilling, e.g., DDH 6355 was drilled in 2006, GH08-111 was drilled in 2008.
The targeted economic ore is primarily copper–iron sulfides, including chalcopyrite (CuFeS
2) and bornite (Cu
5FeS
4), and the molybdenum sulfide molybdenite (MoS
2), hosted in pyrite (FeS
2) and arsenopyrite (FeAsS) [
3]. The deposit is overlain by non-sulfide “overburden” material. There is surface mineralization in the western area of the deposit, then, the deposit angles such that up to 305 m of benign overburden covers the mineral zone in the eastern section.
Exploration drilling generates waste containing drilling muds, used to lubricate the drill bit, and fine rock “cuttings,” created as the drill bit moves through bedrock. Sulfide-rich drill cuttings could be generated at GH sites on the western deposit where there is surface mineralization and at all DDH sites. Deep holes would generate a significant volume of cuttings. DDH drilled through extensive overburden before reaching ore on the eastern deposit could generate volume but fewer sulfide cuttings, although sulfides would make up the topmost layer of these waste cuttings. Fine-grained sulfide-rich cuttings in ore or sulfide host rock would weather relatively quickly due to high surface area. Cu and Mo would be the primary metals released. GH holes on the eastern deposit would not be expected to generate significant, if any, sulfide-rich cuttings.
1.4. Drill Waste Disposal Methods
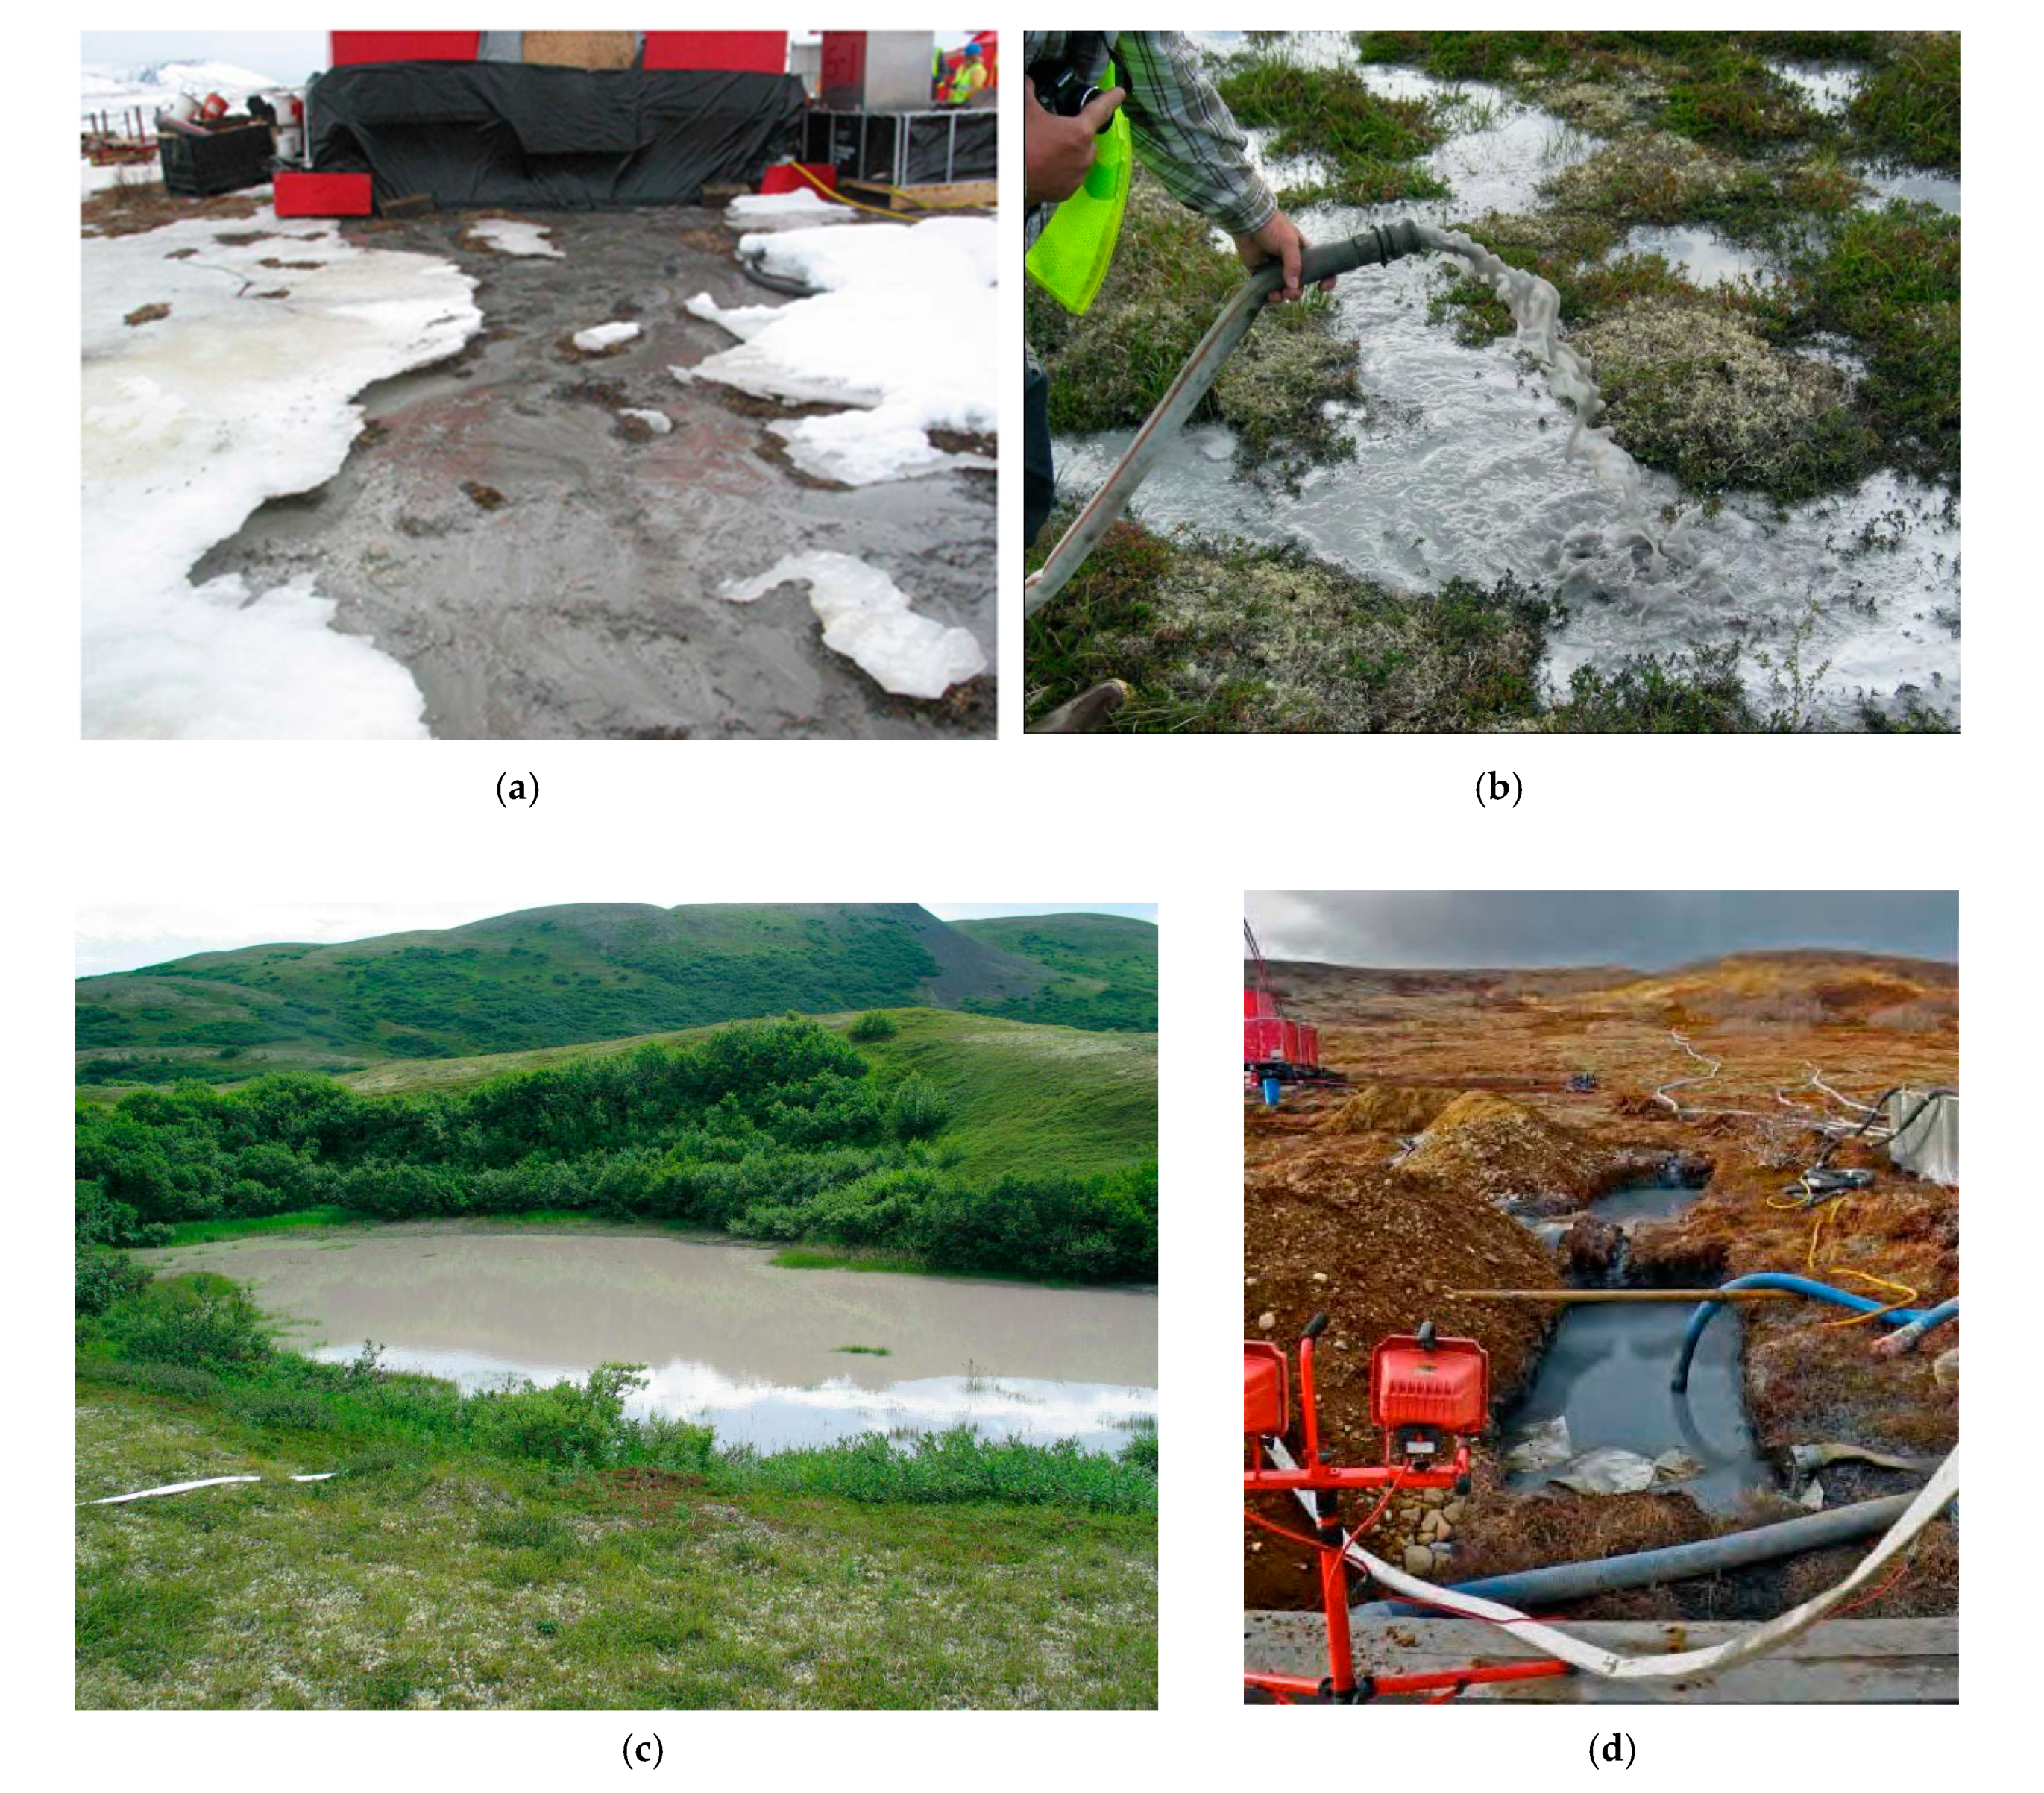
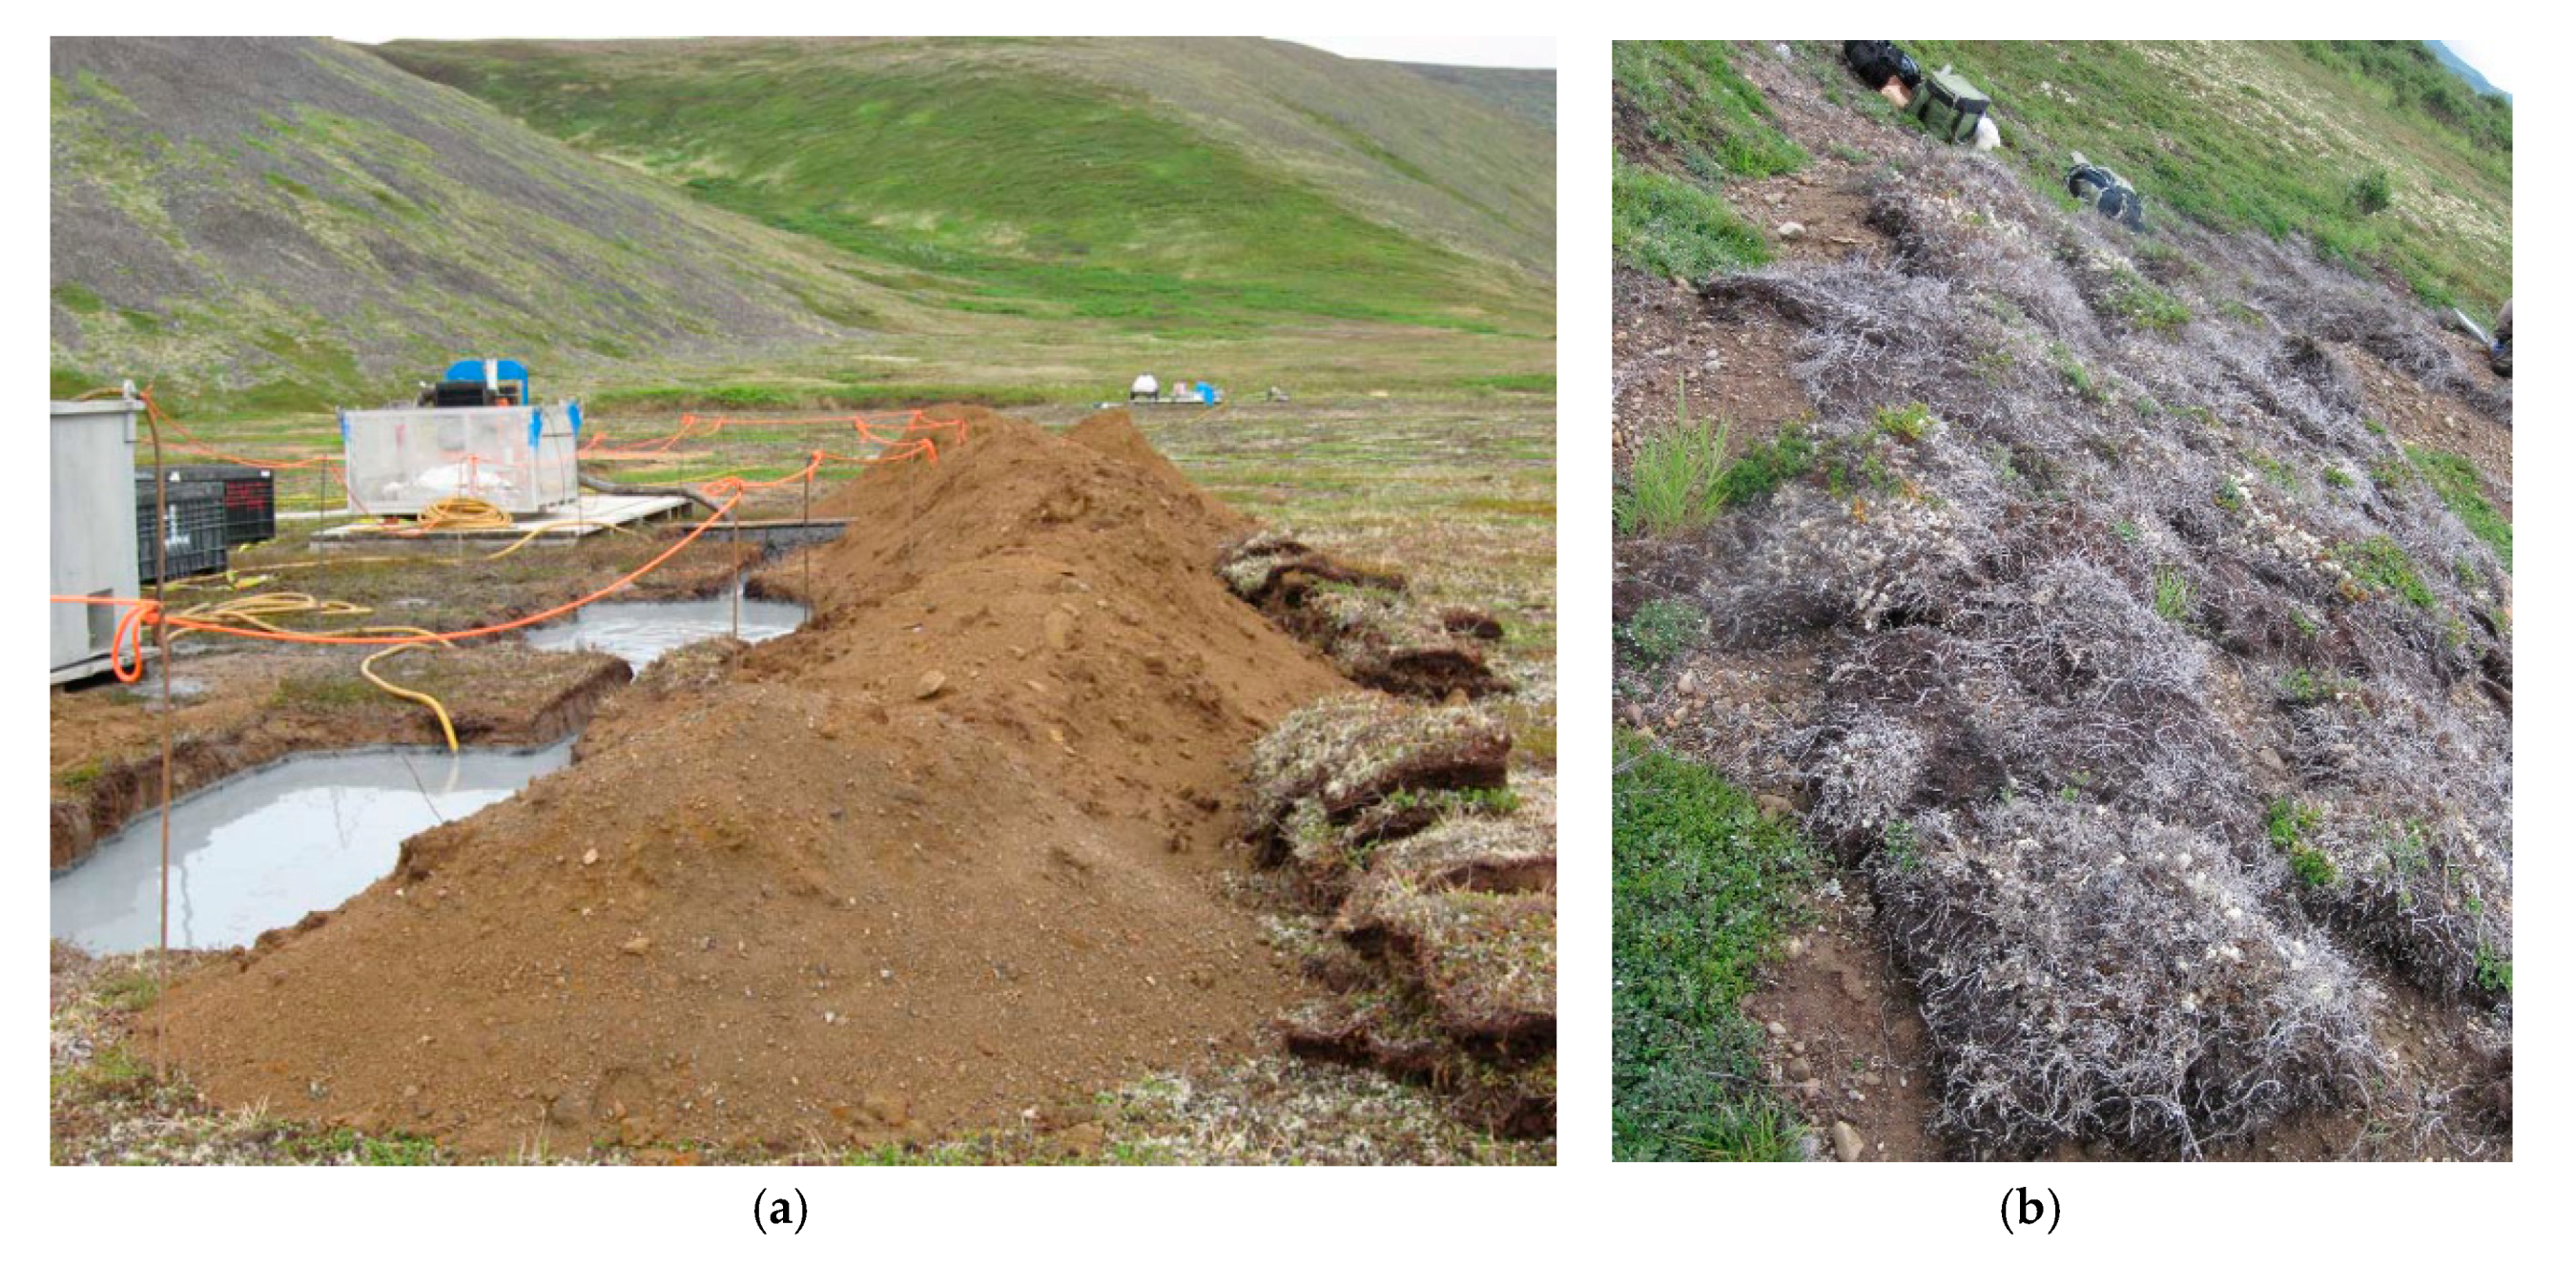
Drilling waste at Pebble was disposed of directly onto the landscape (
Figure 2a–c) [
4,
5] or run through a series of unlined sumps to settle cuttings before pumping sump water onto the landscape for disposal (
Figure 2d). Heavier material-like cuttings would sink in the sump, and are presumed to remain there; the sump was then covered with the initial soil mat that had been removed. Lining a sump would involve deploying and installing the liner, which is time consuming and expensive; as a result, liners are only occasionally used in sumps for drill cuttings, and were not utilized at this site.
Although sumps went into use in about 2003, drilling waste continued to be disposed of on land at times of the year or at locations where digging sumps was difficult. Some sumps were dug in wetlands. Large pumps were used when sumps were near water bodies to move sump wastewater by distances of up to 610 m to upland ponds and natural depressions such as kettles (
Figure 2c). Kettles are depressions created by melting remnant glaciers. Ponds, which may be connected to groundwater, form in many kettles.
2. Materials and Methods
Of the 99 total drill sites inspected, 11 were sampled for drill cuttings or background soil and four were photographed or had field chemistry but no laboratory analysis. At least 11 sites had visual evidence of cuttings on the landscape; seven of these were confirmed by laboratory testing. At an additional 13 drill sites, dead vegetation covered sumps. The remaining sites were fully reclaimed or had artesian flow, physical hazards or non-native plants as described elsewhere [
6,
7].
2.1. Site Selection
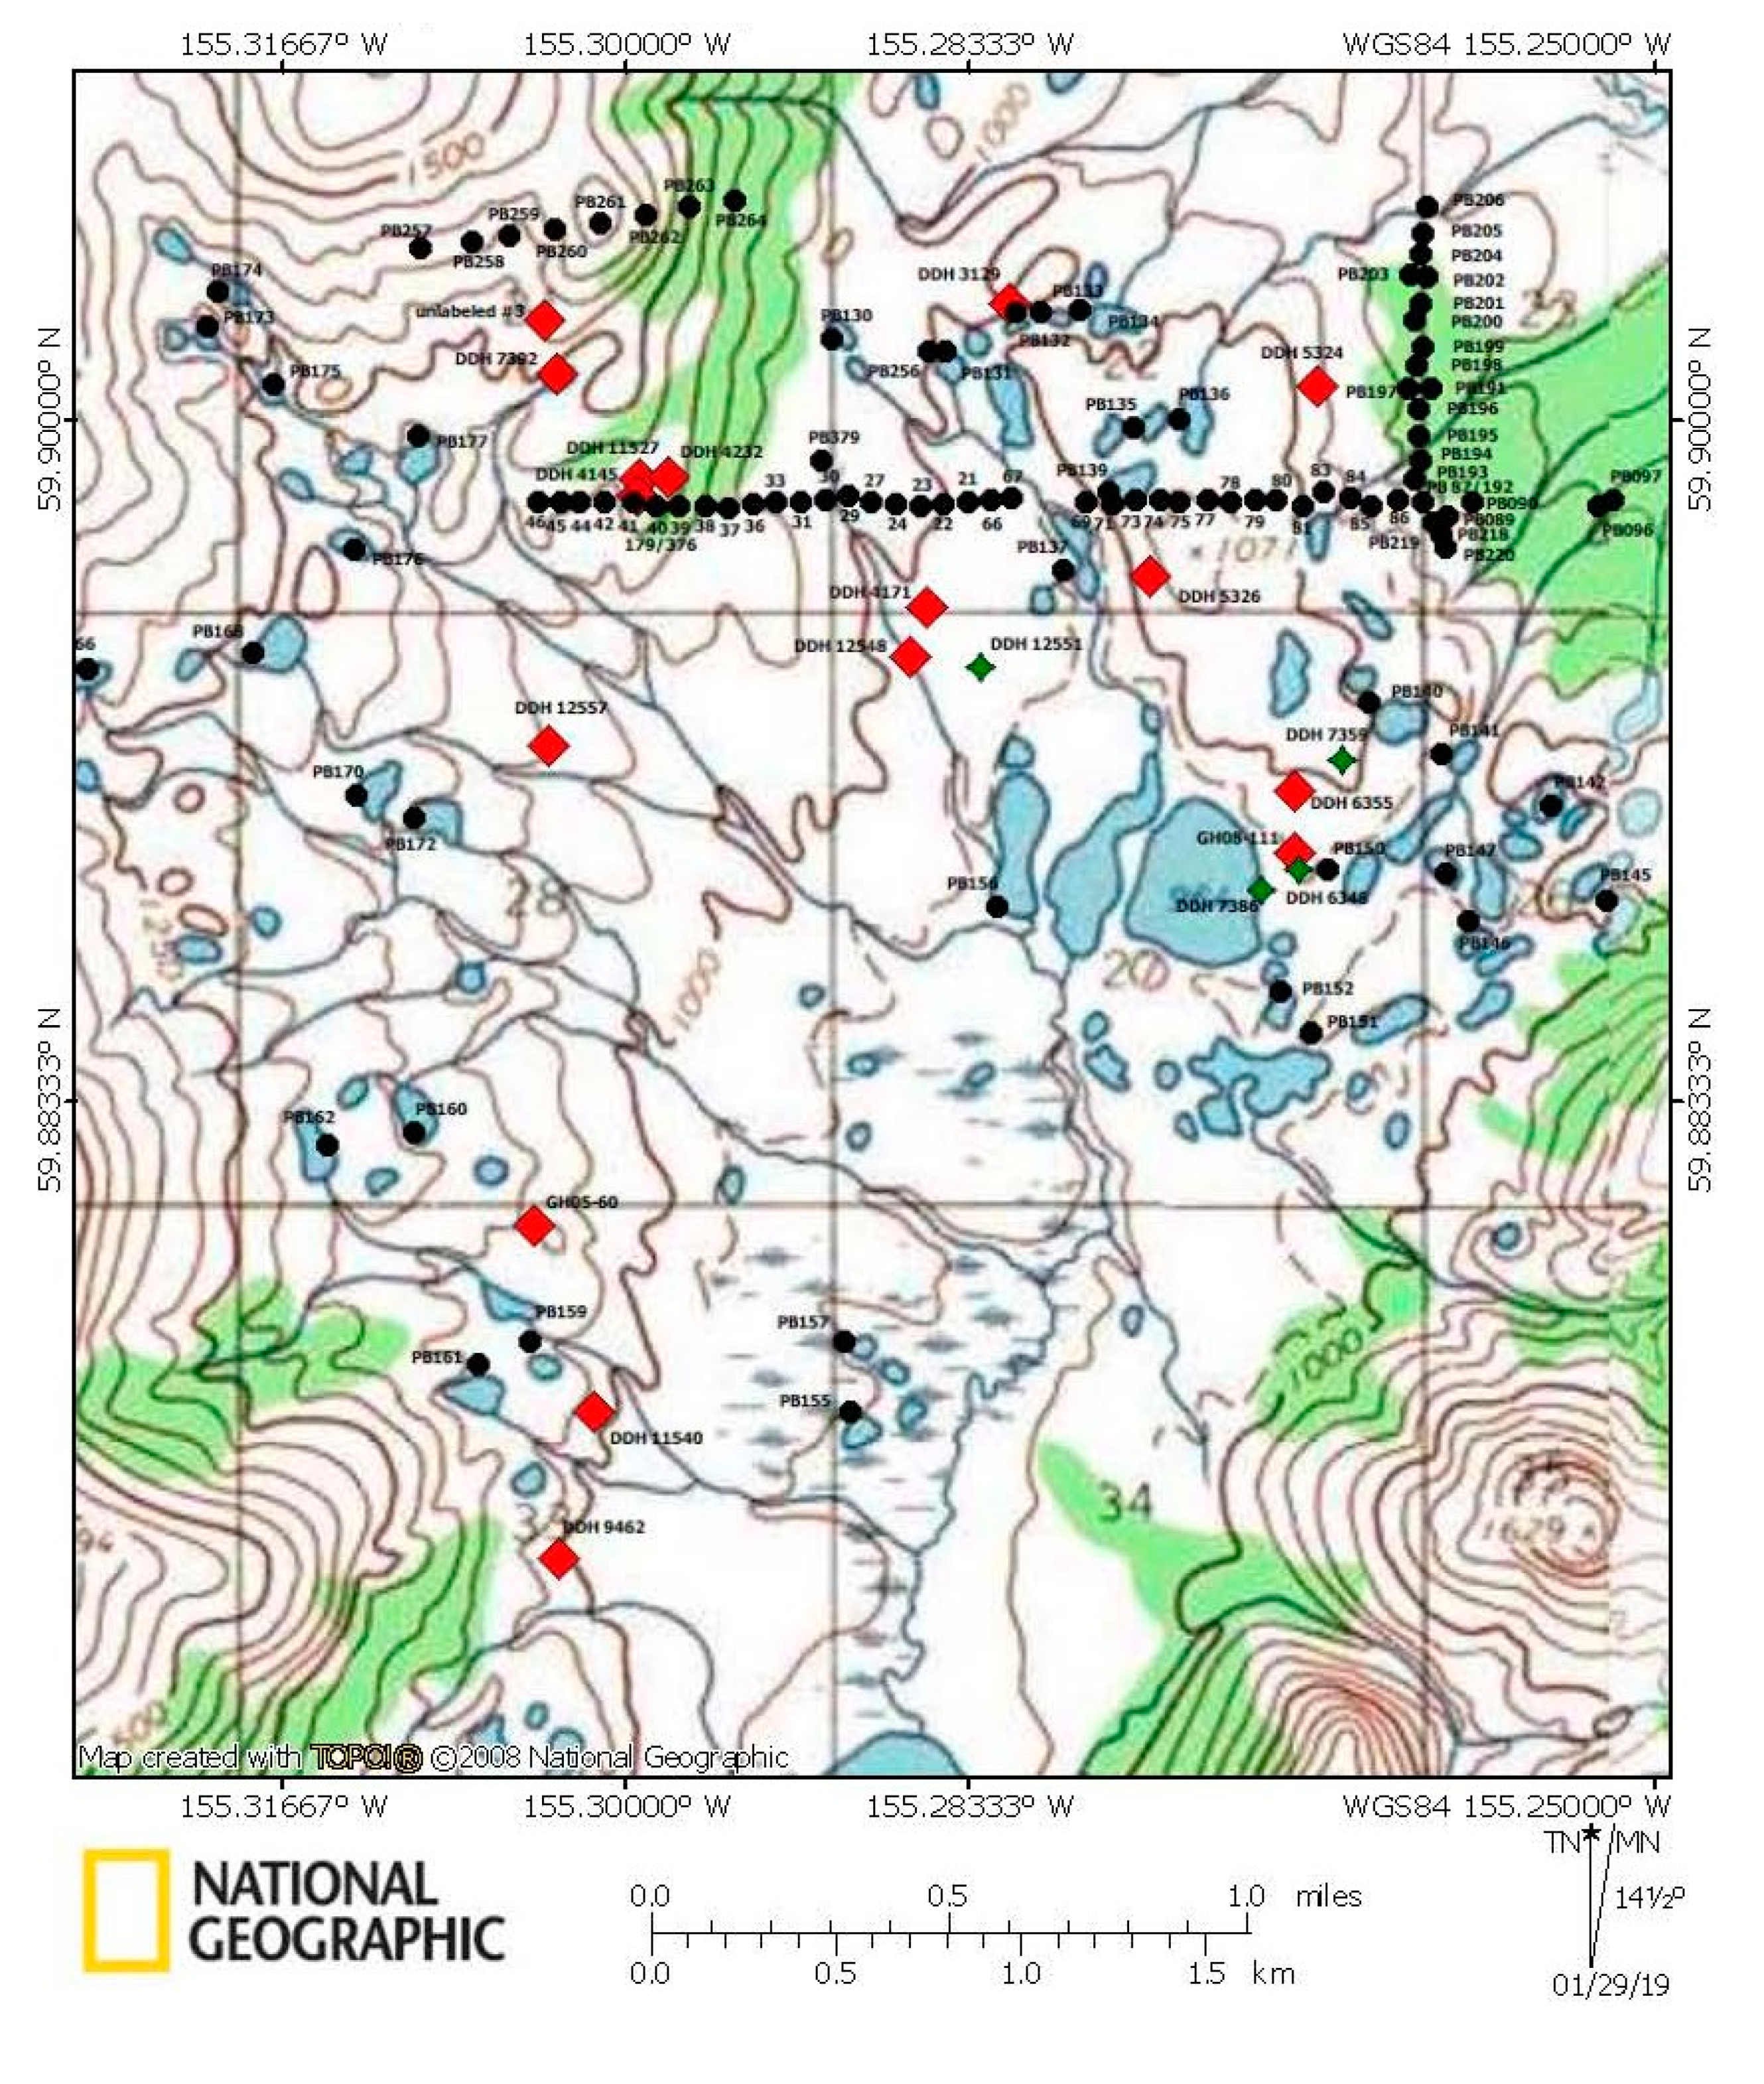
The exploration company, Pebble Limited Partnership (PLP), provided the Alaska Department of Natural Resources (ADNR) with a spreadsheet listing the 1355 drill-holes (
Figure 3), along with the length of the borehole and locations. Target sites were chosen based on documented history of problems as shown in the PLP spreadsheet provided to ADNR or observations from the air once on site. Upon landing at a target site, we walked to nearby drill sites to optimize our time and introduce randomness into the type of drill site inspected, ensuring sites documented as having no history of problems were included.
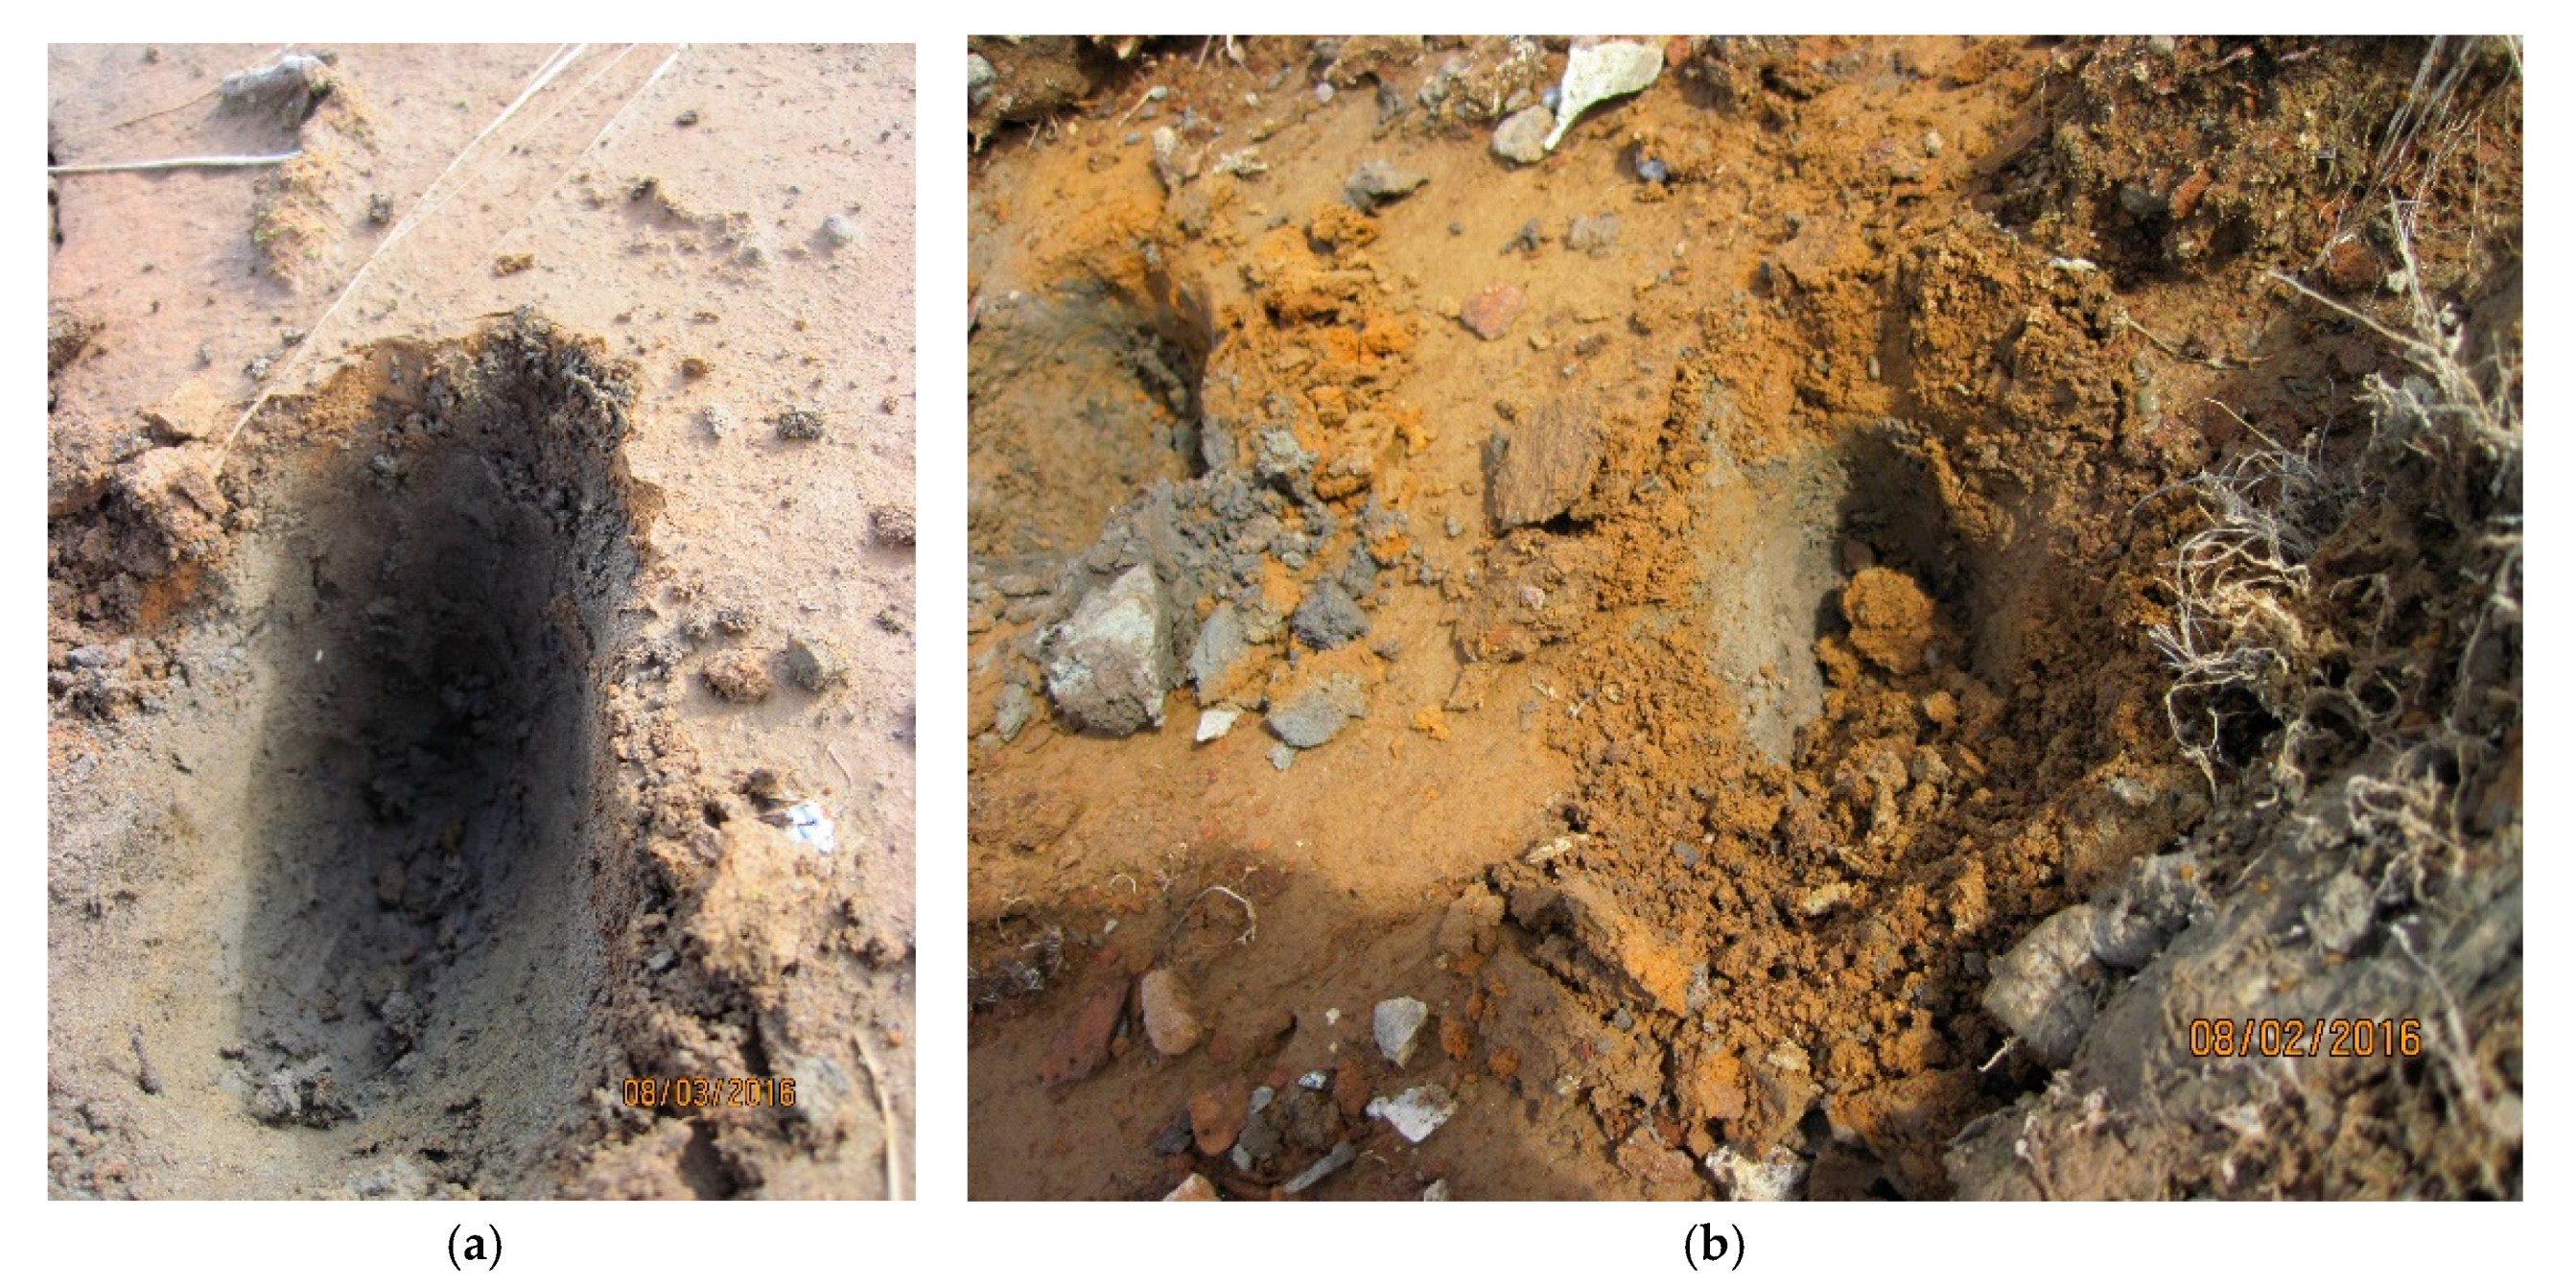
Drill cuttings were visually distinct from background soils, with different texture and color and could sometimes be identified from the air. Cuttings were also observed at the base of some drill stems, suggesting potential intermittent flushing from down-hole, possibly during periods when the water table would rise (
Figure 4).
2.2. Field Chemistry
Upon arrival at a site, the area was photo-documented and coordinates were taken from a handheld ETrex 10 GPS. For soil pH, two to three subsamples were homogenized and mixed in a glass beaker with a small amount of distilled water. The mixture was allowed to sit for several minutes until the pH stabilized, and was measured with a YSI 556 or YSI 1030. Field meters were calibrated each morning and checked each evening in pH buffers (pH 4.01, 7.00, 10.01). Field pH was collected for 12 soil samples, eight of which had additional analytical testing.
2.3. Sample Types
Twelve soil samples were collected for analytical chemistry and included samples of apparent drill cuttings, reclamation soil on sump covers, and one sample of drill waste obtained from within a sump. These were compared to U.S. Geological Survey (USGS) data on the geographically closest soil or pond sediment samples, mineralized soil, mineralized rock (“rubble outcrop”), and a single sample of “drill cuttings mud” [
8].
2.3.1. USGS Samples
The USGS performed studies in the Pebble deposit region from 2007–2009, collecting soil, rock, sediment, and water samples [
8]. Samples collected by USGS have the identifier “PB” and analytical methods are available [
8].
The USGS mineralized material consisted of two sets of soil samples in the discovery zone (set 1: PB033, PB36–42, PB44-46; set 2: PB257–264) and three weathered outcrop samples (PB179, PB376, PB379) collected near the deposit discovery site. Outcrop samples were described as having pyrite and iron oxide staining [
8].
A single USGS sample described as “greenish-orange drill cutting mud” collected downgradient of DDH 4232, in the area of mineralized soil, was collected in 2007 and, based on the date of the drill hole, was likely disposed onto the landscape in 2004; therefore, weathering on the surface for 3 years at the time of collection.
To select USGS soil and pond sediment samples for comparison, we obtained all USGS sample locations [
8], plotted the sites utilizing National Geographic Topo! mapping software, and overlaid this on a map of our sample sites.
2.3.2. Samples of Drill Waste
Samples were collected from cuttings that appeared to be oxidized, unoxidized, or in the process of oxidizing, and from vegetation and pond water potentially impacted by cuttings. Some samples were collected where several drill-holes may have disposed of waste in a single location and may represent waste from more than one drill site.
Drill cuttings were observed as if flushed from drill stems at eight sites. Three were submitted for analytical testing (DDH 3129, DDH 7392, GH05–60), and only field pH was measured for two (DDH 5326, DDH 9462). Three had only photo-documentation (DDH 4145, DDH 4232, unlabeled site near DDH 7392).
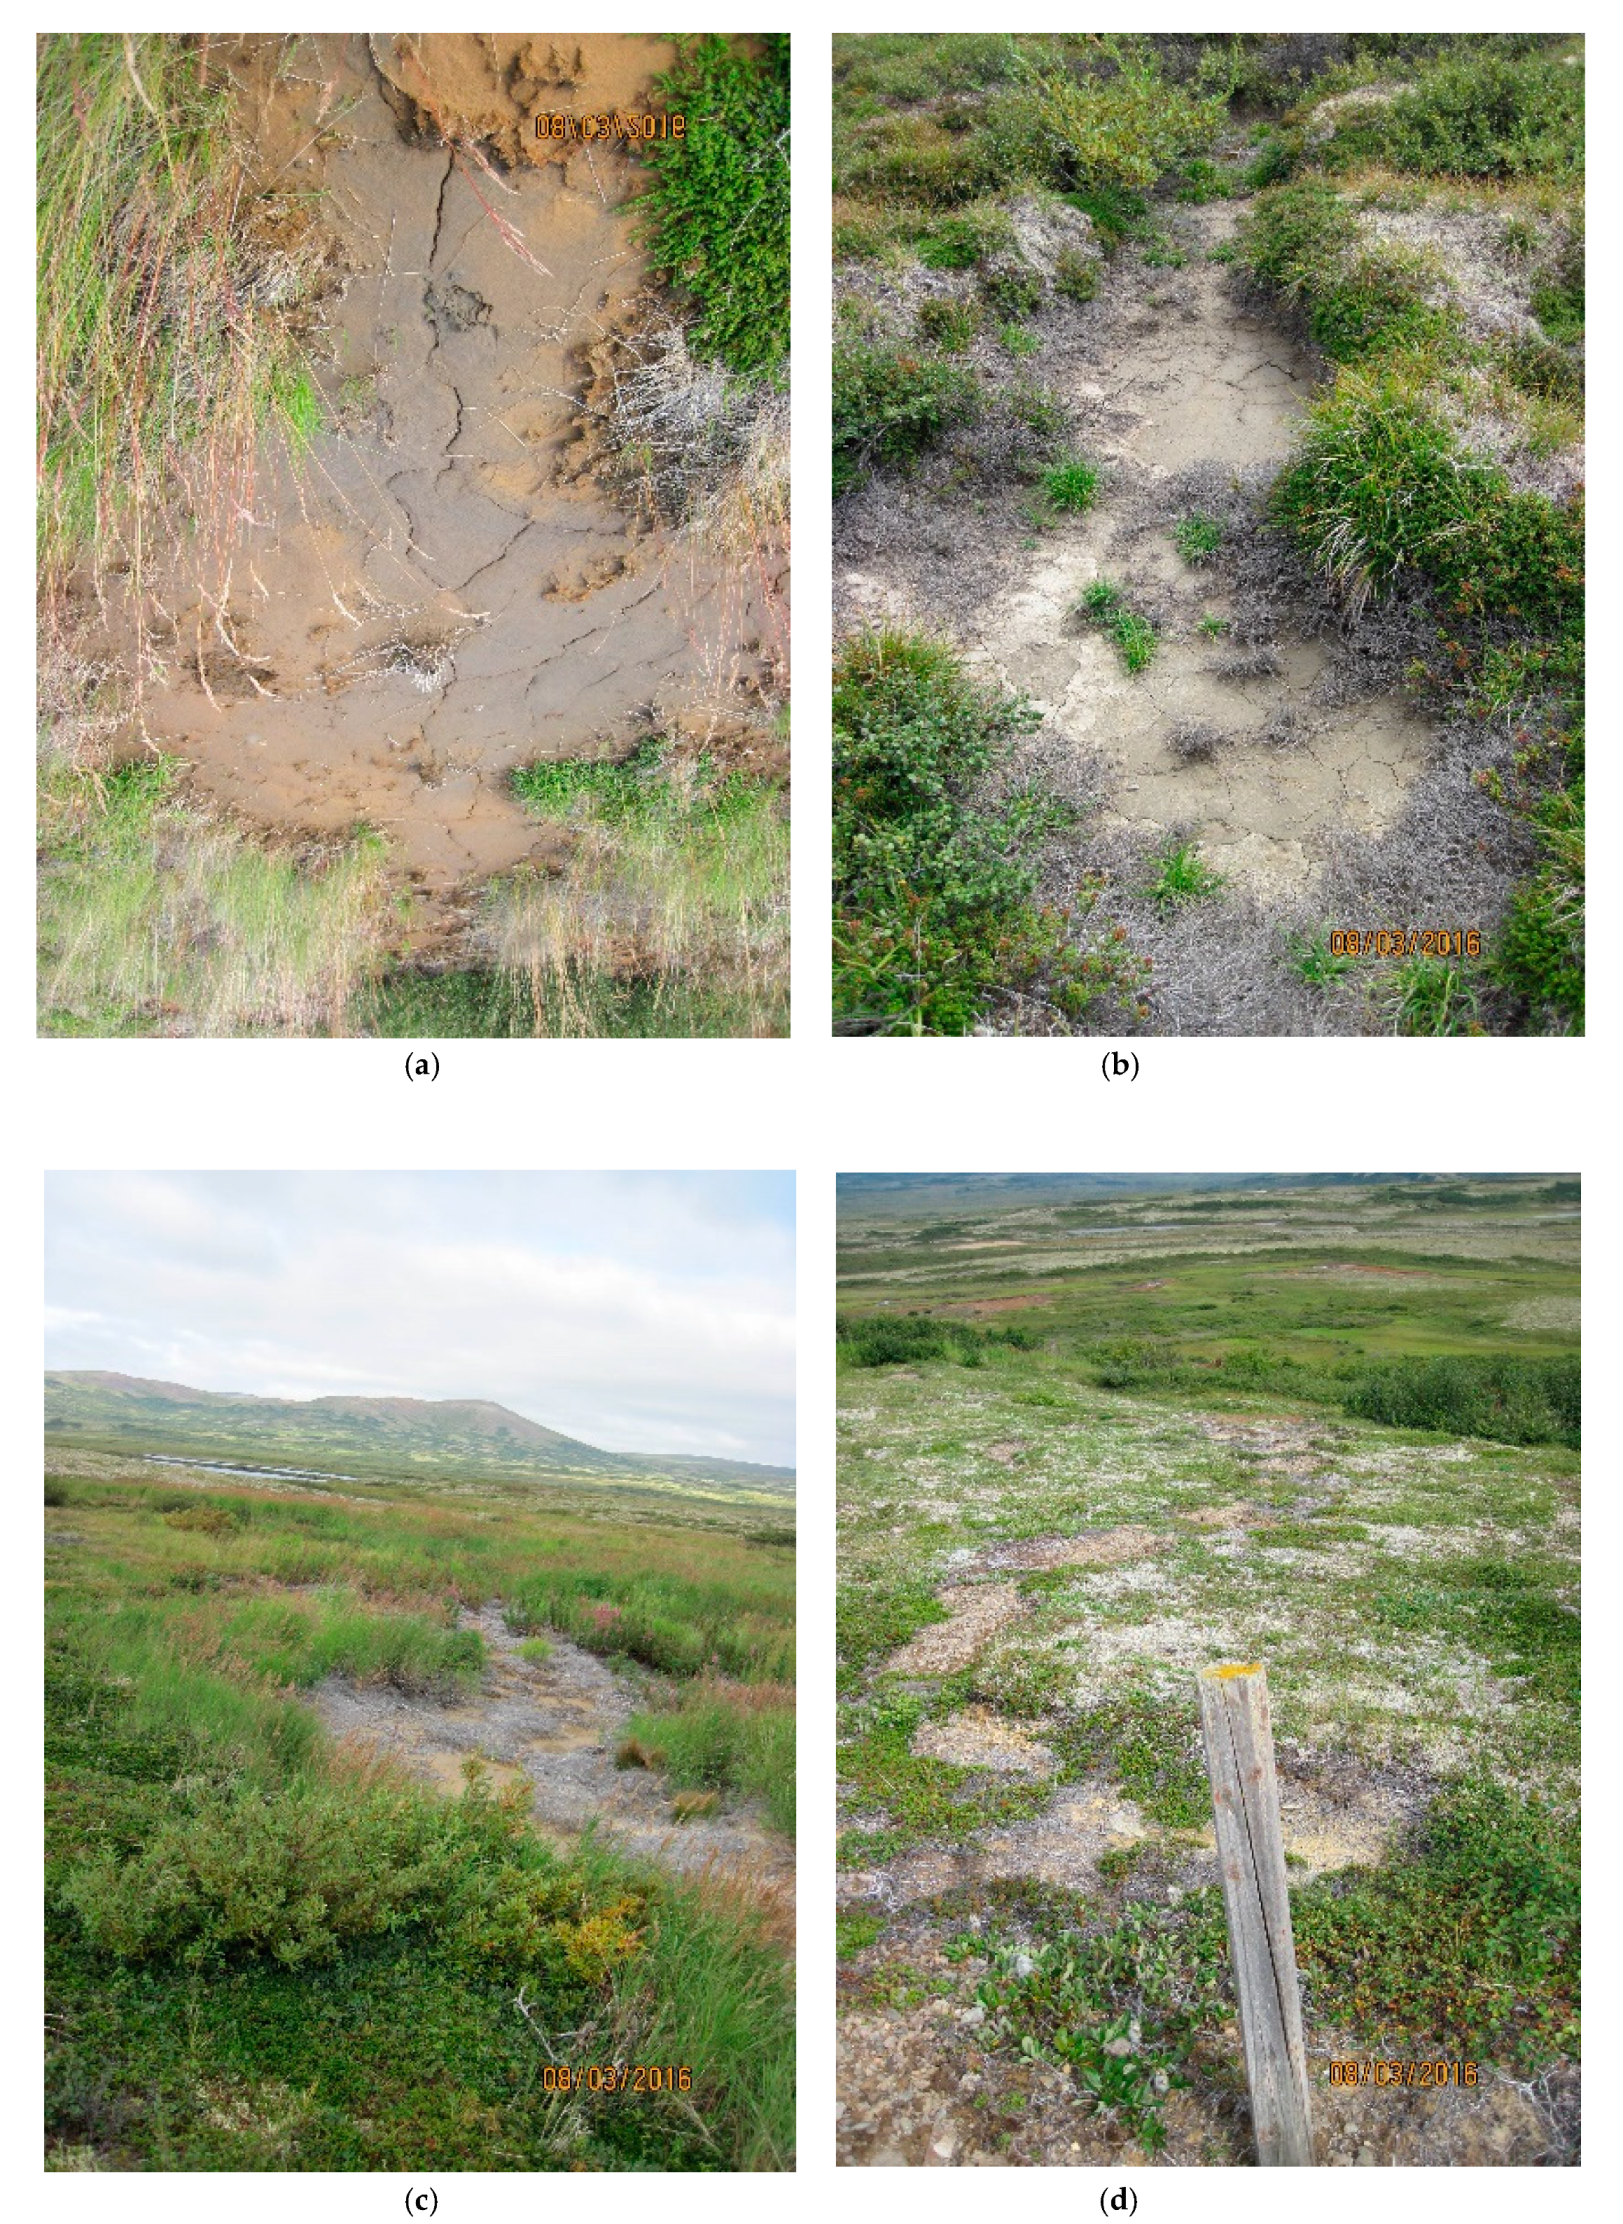
Six samples were collected in two areas of apparent widespread waste disposal. Specific sites appeared to be in the process of oxidizing, with fine texture-like cuttings, but without the classic yellow–orange coloration of oxidation (
Figure 4). Because of the practice of pumping sump water some distance, the source of this material could not be identified. These sites are labeled with the identification of the geographically closest drill-sites. The first area was bounded by DDH 4171, DDH 12548, and DDH 12551; the second area by DDH 6348, DDH 6355, and GH08-111. Four were submitted for laboratory analysis (labeled DDH 4171, DDH 6355, DDH 12548, and GH08-111) and two, near DDH 6355, had only field pH.
At two sites where cuttings were evident near ponds (DDH 3129, GH05-60), pond water was collected for analysis. Samples of vegetation were co-collected with soil at one site where drill cuttings buried the tundra mat (DDH 7392), at one site where vegetation appeared covered in some substance (GH08-111), and at one of many sites where dead vegetation was present on top of sumps (DDH 12557).
2.3.3. Samples of Reclamation Material
When a sump is dug, the overlying vegetation and soil are removed and set aside to be placed over the sump during reclamation. This is referred to here as “reclamation soil”, “tundra mat”, or “vegetation”. At many sites, the location of the sumps were evident by the lack of vegetation as a distinct rectangle covering them, despite no evidence of cuttings (
Figure 5) [
4,
5,
9]. Reclamation soil samples were collected at three sites (DDH 5324, DDH 11527, DDH 12557) to determine if there was chemical contamination. At site DDH11527, an attempt was made to retrieve drill waste in a sump. A hole was dug 2-feet deep into the cover of the sump and a 34-inch steel pipe was driven 24-inches further down (total depth, 47 inches). However, the core retrieved was the color and texture of reclamation soil, not drill waste.
2.3.4. Drill Sump Core
At a single site, DDH 11540, a hole was dug 3-feet into the reclamation soil covering the sump and a 34” steel pipe used to extract a 7-inch-long core of the drill waste contents. This represents original drill waste deposited in 2011 during drilling as waste moved through a series of sumps. The material was distinctly different from native material and sump cover, presenting as a gray–blue color that quickly expanded when removed from the pipe. The sump cover was replaced on top of the sump after the core was taken.
2.4. Analytical Chemistry
Soil subsets were homogenized in a Ziploc bag, and double-bagged for storage and transport. Samples were submitted to the University of Alaska Applied Science, Engineering, and Technology (ASET) laboratory for general chemistry analysis. Analysis was conducted for pH, specific conductance (SC), fluoride (F), chloride (Cl), sulfate (SO4), nitrate (NO3), beryllium (Be), sodium (Na), magnesium (Mg), aluminum (Al), potassium (K), calcium (Ca), vanadium (V), chromium (Cr), manganese (Mn), iron (Fe), cobalt (Co), nickel (Ni), copper (Cu), zinc (Zn), arsenic (As), selenium (Se), molybdenum (Mo), silver (Ag), cadmium (Cd), antimony (Sb), barium (Ba), thallium (Tl), lead (Pb), thorium (Th), and uranium (U).
Total metals for soil, sediment, and vegetation were determined using an ICP-MS (method EPA 200.8), on an Agilent ICP-MS 7500c. The extraction method, EPA 3050b, used HNO3 and H2O2. No analysis was performed for dissolved metals. For anions, pH and SC, analysis was determined from 1:5 water extracts of soil and vegetation on a Dionex ICS 5000+. Duplicate soil samples were collected at four sites. Paired samples of soil and vegetation were collected at three sites, including at one of the sites with duplicate soil samples. No duplicates were collected for vegetation. All samples were placed in a cooler containing gel ice in the field, and placed in a refrigerator upon return to the field camp each evening. Samples were transported to the laboratories within two to seven days of collection.
The USGS analyzed soil and sediment samples by ICPAES-MS (inductively coupled plasma-atomic emission spectroscopy and mass spectroscopy) after an HF–HCl–HNO
3–HClO
4 digestion [
8]. Another method, ICPMS-AR, was also applied, but only for soil collected in 2007. This was an aqua regia (HCl and HNO
3) digestion followed by ICP-MS analysis. The ICPMS-AR and ICPAES-MS methods produced similar results with the exception of Fe, for which the ICPAES-MS produced results an order of magnitude lower. Because the ICPMS-AR method was applied to a limited number of samples, while all USGS samples (2007–2009) were analyzed by ICPAES-MS, we only provide the ICPAES-MS results in tables in this paper. For water, the method applied by USGS to most samples was ICP-MS-HR (high resolution), which also may differ from the method used by the ASET lab. It is important to keep the differences in mind when comparing Fe concentrations in the ASET results to USGS results. We provide results for Fe by ICPMS-AR, where available, in the
Supplementary Information.
3. Results
3.1. Natural Soil and Rock Chemistry
Naturally mineralized rock and soil are found at the surface of the western section of the deposit. Mineralized rock stands out as being elevated in As and Mo relative to mineralized soil, but not necessarily in Cu (
Table 1). Analyte concentrations of sump cover (“reclamation”) soil are below the range of concentrations of nearby naturally mineralized soil.
Cu is naturally elevated in soil and rock at the western deposit where there is likely surface mineralization. Soil collected from sump covers at sites DDH 11527 and DDH 12557, on the western deposit, are higher in Cu than soil collected at site DDH 5324 further east (
Table 1). All are likely examples of natural soil and not drill waste. This suggests that although sites DDH 11527 and DDH 12557 were bare of vegetation, the lack of vegetation on sumps is not due to drill waste toxicity.
3.2. Drill Waste
Field and analytical chemistry determined that sites with drill cuttings, whether at the base of drill casings or in areas where drill waste had been discharged over a wide area, were universally elevated in Cu and Mo in the upper range or exceeding the range for nearby soil, sediment, mineralized soil, and mineralized rock (
Table 2). Some, but not all, drill waste discharge samples were acidic and/or elevated in As or Zn. The drill cuttings mud collected in the waste sump at DDH 11540 had chemistry very similar to drill cuttings discharge waste we collected in 2016. Also similar was the sample, PB180, noted as “drill cuttings” collected by the USGS in 2008. Sulfate, an oxidation product of weathered sulfides, was not analyzed in USGS samples. Although sump covers (ASET lab) and nearby soil (USGS) have similar Fe content, drill cuttings (ASET lab) appear to have much higher concentrations than nearby soil. Due to differences in analytical methods, results for Fe should be viewed with caution.
Five samples were acidic (DDH 6355, GH08-111, DDH 3129, DDH 7392, GH05-60) and three with only photos visually appeared to be oxidized (DDH 4145, DDH 4232, unlabeled site near DDH 7392). The sample at DDH 5326 had cuttings with classic oxidation on the surface and unoxidized cuttings below (
Figure 6); the field pH of the mixed layers was 6.4 and it appeared to be in the process of oxidizing.
A set of samples collected amidst a cluster of drill sites (DDH 4171, DDH 12548, DDH 12551) was fine-textured material, gray in color. It had higher sulfate and minerals (Cu, Fe, Mo, Zn) than reclamation soil or nearby soils, but did not have the very low pH of drill cuttings. This may represent waste material from drill-holes with lower concentrations of target sulfides. Geochemical testing by PLP determined that waste rock, which has the most similar chemistry to the sulfidic drill cuttings, could take more than 20 years to go acidic [
10].
The drill waste material cored out of a sump (DDH 11540) had a pH of 6.3; it is possible that alkaline material disposed of in the sump has, to date, prevented acid from forming. Oxidation of sulfide materials buried in the sump will likely occur more slowly than on the surface, but could potentially be occurring at some rate as the water table rises and falls. Whether oxidation occurs or not, there are indications that seepage is escaping the sump and causing an increase in Cu and Mo in a wetland spring downgradient [
7].
3.3. Ponds
Two sites allowed an examination of the potential impacts of drill waste on ponds. At site DDH 3129, drill cuttings presented as a flowpath from the abandoned drill casing towards the shores of pond PB132. Based on the wide banks between vegetation and waterline, the pond is fed by meteoric-water [
11]. The hole was drilled in 2003, but it is possible cuttings flowed out of the drill hole more recently. Although there is an apparent increase in Fe in pond water between 2008 (USGS) and 2016 (ASET lab) (
Table 3), this may be due to differences in analytical methods, as discussed earlier. Although cuttings were high in Cu and Fe, pond sediment was lower in Cu relative to nearby ponds and was not high in Fe. Site GH05-60 similarly had cuttings at the base of the abandoned drill stem elevated in Cu, Fe, and Mo. Water collected from an un-named pond at a distance of about 300 m from GH05-60 had high concentrations of Fe (3522 µg/L), but had low concentrations of Cu and Mo. All four ponds within 400 m of GH05-60 had elevated Cu in sediment; two were upgradient and two downgradient, suggesting the Cu was from naturally mineralized soil. The pond from which water was collected was surrounded by vegetation right to the waterline, suggesting it was groundwater-fed.
3.4. Vegetation
Dead vegetation was observed at all sites with drill cuttings on the surface. Where drill cuttings were located at the base of drill stems, there was no vegetation in the path of flow, or vegetation was buried. At some locations where drilling waste had been disposed of in depressions, the lack of vegetation was more widespread (
Figure 5). Dead vegetation was also commonly observed on sump covers (
Figure 6), but based on chemical analysis, this was not due to toxic metals (
Table 4). Instead, this may be a result of mishandling tundra mats. A regulatory inspection visit noted that tundra mats were left drying and desiccated [
12].
4. Discussion
Although the process of pyrite oxidation, producing acid and elevated metals, is well-documented, there is a lack of documentation on the oxidation of cuttings at hard rock sulfide mine sites. The purpose of the investigation discussed in this paper was to determine whether cuttings themselves could pose some risk from the process of pyrite oxidation and acid generation.
Most regulatory bodies allow the discharge of mining drill cuttings directly to the surface because most drill waste is related to drilling water wells, not mining exploration. However, in the experience of the authors, most regulators do not recognize the potential damage to surface and aquatic resources posed by sulfidic mine exploration drill cuttings. The Alaska Department of Natural Resources observed, at the Pebble mine:
“The practice results in the deposition of finely ground rock, bentonitic clay, and other additive materials being deposited on the tundra. … Gray coatings of clay were seen in areas where drill fluids have been recently discharged, but in areas where drilling was done in previous years there was no evidence of the coatings, and the tundra appears healthy. … There is some concern in places where multiple wells are being discharged into topographic depressions. This practice can result in considerable amounts of clay material being deposited in the depression [4]”.
We sampled sites throughout the deposit. The sites with acidic cuttings, or neutral pH cuttings with elevated Cu and Mo, were on the western deposit, with the exception of samples collected in the wide discharge disposal area near DDH 6355 and GH08-111. While we would not expect a shallow GH hole to produce acidic cuttings, this GH site had many DDH sites within 350 m that may have contributed discharge from encountering the deep ore body, including DDH 6348 (37 m), DDH 7386 (90 m), DDH 6355 (135 m), and DDH 7359 (330 m). This is the only site on the eastern side with evidence of acidic or metal-rich cuttings that had a GH designation. Sump covers, regardless of location, resembled natural soil.
Metals from drill waste do settle in sumps, as evidenced by the drill waste collected from within the sump at DDH 11540. The extent to which cuttings observed on the surface are from direct discharge of drill waste versus discharge of water from sumps in which cuttings have settled cannot be determined unless mining companies record the location of disposal locations, which was not done at this site. However, contaminants may potentially leach from unlined sumps. A single drill waste sump sample (DDH 11540) was not acidic, but sump contents were, expectedly, elevated in Cu, Mo, and sulfate (
Table 2). The possibility that sump contents may be migrating into a wetland is discussed in a companion paper [
6,
7]. Ideally, groundwater downgradient from several sumps should be monitored to see if groundwater is being impacted.
In addition to sites of apparent widespread disposal, drill cuttings were observed in patterns that suggest intermittent artesian flow from abandoned drill stems (DDH 3129, DDH 7392, GH05-60). If these are fresh cuttings moving from down-hole, the drill-hole closure is failing; these represent sites agencies should inspect regularly, even after new closures. The impacts of placing drill waste into kettle ponds is less clear. The sampled trails of cuttings had no discernable impact on two ponds investigated, with the exception of an apparent increase in Fe, which may have been an artifact of analytical methods. However, some pond sediment sampled by the USGS appeared quite elevated in Cu and future work to understand the impacts of drill waste disposal at mine sites should sample pond sediment of receiving ponds to determine whether long-term pond chemistry changes in either meteoric water ponds or groundwater-fed ponds.
Sites where vegetation had not re-established were from four to thirteen years old. Dead vegetation on sumps is not due to drilling discharge waste, and is distinct from the impacts of drill waste discharge that killed or buried vegetation. Potentially, there may be chemical impacts to vegetation, as shown by the similarity in drill cuttings and vegetation chemistry. Future work should collect and analyze soil cores and vegetation controls to determine whether chemical impacts are occurring.
5. Conclusions
We documented eight areas where the discharge of drill waste has resulted in visibly weathered drill cuttings on the land surface. At five of these sites we were able to measure low pH, and elevated levels of Cu, Fe, Mo, Zn and sulfate. The remaining three sites were not sampled.
Allowing drill waste to be placed directly on the tundra has led to acid generation in the waste and the release of Cu, Mo, and other metals. At six of seven sites where cuttings were sampled, Cu was 545–4865 mg/kg, similar to the 1320 mg/kg Cu concentration in the single sample of drill cuttings analyzed by the USGS in 2008 and Mo ranged from 17–645 mg/kg, with the USGS sample at 104 mg/kg. These are one to two orders of magnitude above the median copper concentration in nearby soil samples. The damage directly to the tundra is not severe but is long lasting. Direct disposal has consequences that can be addressed through policy and regulatory discretion.
Drill cuttings sump contents need further sampling to determine the rate of chemistry changes, and whether groundwater downgradient from sumps is being impacted.
Finally, further studies should be conducted to determine whether there are impacts from sulfidic drill waste deposited in isolated water bodies, such as glacial kettles. Research sites should be sampled before and after drilling to ensure clean control samples.
Author Contributions
For research articles with several authors, a short paragraph specifying their individual contributions must be provided. Conceptualization, D.M.C. and K.Z.; methodology, K.Z.; formal analysis, K.Z.; investigation, D.M.C. and K.Z.; resources, D.M.C. and K.Z.; data curation, K.Z.; writing—original draft preparation, K.Z.; writing—review and editing, D.M.C.; visualization, K.Z.; supervision, D.M.C.; project administration, D.M.C.; funding acquisition, D.M.C.
Funding
This research was funded by United Tribes of Bristol Bay (no grant number). We were able to prepare this paper through funding from the Edgerton Foundation (no grant number).
Acknowledgments
The authors would like to acknowledge George Alexie for assistance in the field.
Conflicts of Interest
The authors have no financial interests that could bias or influence the work. However, funding for field work was supplied by the United Tribes of Bristol Bay (utbb.org), a group known to actively oppose development of the Pebble Project. The authors may have personal interests that could be considered a bias. The authors have been called as expert witnesses in a case against the state of Alaska related to the Pebble Project, in 2009. The authors have assisted NGOs, including United Tribes of Bristol Bay, by providing technical review of material related to Pebble project permitting, such as review of baseline information gathered by the Pebble Limited Partnership. The authors held no bias in conducting the work related to this paper. They approached and reported on the project objectively. The funders had no role in the design of the study; in the collection, analyses, or interpretation of data; in the writing of the manuscript, or in the decision to publish the results.
References
- Pebble Limited Partnership (PLP). Pre-Permitting Environmental/Socio-Economic Data Report Series. Report D-6: Seep Inventory Site Plan, 2008; Pebble Limited Partnership (PLP): Anchorage, AK, USA, 2008. [Google Scholar]
- Woody, C.A.; O’Neal, S.L. Fish Surveys in Headwater Streams of the Nushagak and Kvichak River Drainages, Bristol Bay, Alaska, 2008 and 2009; The Nature Conservancy: Anchorage, AK, USA, 2009. [Google Scholar]
- Gaunt, J.D.; Rebagliati, C.M.; Lang, J.; Titley, E.; Melis, L.; Barratt, D.; Hodgson, S. Technical Report on the 2009 Program and Update on Metallurgy, Pebble Copper-Gold-Molybdenum Project; Iliamna Lake area, southwestern Alaska, US; Northern Dynasty Minerals, Ltd.: Vancouver, BC, Canada, 2010. [Google Scholar]
- Cole, W.; (Alaska Department of Natural Resources (ADNR)). Field Inspection of the Pebble Copper/Gold Project, 26–27 July 2007. Available online: http://www.dnr.state.ak.us/mlw/mining/largemine/pebble/field-reports/index.cfm (accessed on 20 June 2019).
- Alaska Department of Natural Resources (ADNR). Field Report, Pebble Copper/Gold Project, 5 April 2007. Available online: http://dnr.alaska.gov/mlw/mining/largemine/pebble/field-reports/index.cfm (accessed on 20 June 2019).
- Zamzow, K.; Chambers, D.M. Investigation of Reclaimed Drill Sites, Pebble Prospect; Center for Science in Public Participation: Bozeman, MT, USA; Dillingham, AK, USA, 2016. [Google Scholar]
- Zamzow, K.; Chambers, D.M. Incomplete reclamation of mineral exploration drilling at the Pebble copper-gold prospect, Southwest Alaska, 2016: Potential impacts to wetlands and water bodies. Environments 2019. submitted. [Google Scholar]
- Anderson, E.D.; Smith, S.M.; Giles, S.A.; Granitto, M.; Eppinger, R.G.; Bedrosian, P.A.; Shah, A.K.; Kelley, K.D.; Fey, D.L.; Minsley, B.J.; et al. Geophysical, Geochemical, and Mineralogical Data from the Pebble Cu-Au-Mo Porphyry Deposit Area, Southwest Alaska. U.S. Geological Survey Data Series 608, 2011. Available online: https://pubs.usgs.gov/ds/608. Available online: https://pubs.usgs.gov/ds/608/downloads/Geochemical%20Relational%20Database/PebbleGeochem_xls/ (accessed on 20 June 2019).
- Malloy, K.; Benkert, R.; (Alaska Department of Fish and Game (ADFG)); Vohden, J.; Lovell, S.; (ADNR); Harpole, G.; Kusche, K.; (Alaska Department of Environmental Conservation (ADEC)). Field Report, Pebble Copper/Gold Project, June 2010. Available online: http://dnr.alaska.gov/mlw/mining/largemine/pebble/field-reports/index.cfm (accessed on 20 June 2019).
- Pebble Limited Partnership (PLP). Pebble Project Supplemental Environmental Baseline Document 2004 through 2012, Chapter 11 Geochemical Characterization, Section 11.7, Table 11–22; Pebble Limited Partnership (PLP): Anchorage, AK, USA, 2018. [Google Scholar]
- Rains, M.C. Water sources and hydrodynamics of closed-basin depressions, Cook Inlet region, Alaska. Wetlands 2019, 31, 377–387. [Google Scholar] [CrossRef]
- Alas, J.; Brekken, J.; (ADFG). Field Monitoring Report, Pebble Copper/Gold Exploration Project, 25p, 17 October 2012. Available online: http://www.dnr.state.ak.us/mlw/mining/largemine/pebble/field-reports/index.cfm (accessed on 20 June 2019).
© 2019 by the authors. Licensee MDPI, Basel, Switzerland. This article is an open access article distributed under the terms and conditions of the Creative Commons Attribution (CC BY) license (http://creativecommons.org/licenses/by/4.0/).


