Abstract
This study assesses the environmental performance of three wastewater treatment setups through an attributional, gate-to-gate life cycle assessment (functional unit: 1 m3 of treated wastewater): (Sc1) a traditional municipal wastewater treatment plant, (Sc2) an aquaculture recirculation system using microalgae, and (Sc3) a domestic system combining UASB pretreatment with microalgae polishing. Inventory data were analyzed in SimaPro with ReCiPe 2016 Midpoint (Hierarchist) across seven effect categories. Robustness was tested through sensitivity analyses (±20%) of power consumption and influent characteristics, as well as an additional scenario exploring the offset of methane-recovery electricity. The global warming impact remained consistent across scenarios, ranging from 60.5 to 65.1 kg CO2-eq·m−3, indicating no significant difference within the operational parameters. In most categories, power consumption and influent-related burdens were the main contributors, while the impacts from flocculants and microalgae inoculum were minimal. Sc3 showed a lower freshwater eutrophication potential compared to Sc1 and Sc2 (0.028 vs. approximately 0.049 kg P-eq·m−3). Normalization highlighted human carcinogenic toxicity and aquatic ecotoxicity as key impact categories. The methane-offset scenario caused only slight changes at low CH4 outputs, suggesting that energy recovery depends on context.
1. Introduction
According to UNESCO/UN-Water, rapid population growth, heavy urbanization, and agricultural and industrial expansion have made access to fresh water one of the biggest environmental issues (https://www.unesco.org/reports/wwdr/en/2024/s?utm accessed on 9 March 2026).
Scientific research shows that wastewater treatment increases with country income: low-income nations discharge the majority of untreated wastewater [1,2,3]. In 2023, the world produced about 380 billion m3 of wastewater [4]. Most of it came from Asia (159 billion m3), followed by Europe (68 billion m3) and North America (67 billion m3) [1]. The release of these large volumes leads to eutrophication, water-quality degradation, and the loss of ecosystem services, resulting in a systemic and enduring environmental issue [4,5]. Sustainable wastewater management and reuse solutions are needed because more than 40% of the world’s population may face water scarcity by 2030 [1].
Worldwide, municipal wastewater is a major contributor to primary water pollution in areas with insufficient treatment plants, since traditional wastewater treatment plants have been designed primarily to reduce suspended solids, BOD, and COD. However, this method tends to produce effluents rich in inorganic N and P, whose concentrations drive eutrophication, degradation of aquatic systems, and the loss of ecosystem services [4,5,6]. Adding a tertiary treatment (e.g., denitrification, dephosphatation, disinfection) considerably improves effluent quality, but at the cost of increased electricity/chemical reagent consumption, reducing the system’s economic and environmental sustainability [7].
The drinking water and sanitation sector accounts for 4% of global electricity consumption by water utilities. Urban energy consumption can reach 40% in some countries [7]. Activated sludge plants require 0.5–2.0 kWh per m3 of wastewater, with the aeration stage alone accounting for 50–60% of this energy use [8], contributing up to 30% of operational expenses [7]. Aeration, sludge treatment, and chemical addition in activated sludge-based systems are thought to cause most of their greenhouse gas emissions and inefficient resource use [9].
Sustainability-oriented engineering research emphasizes the need for technological solutions to be supported by system-level optimization and integrated assessment frameworks, ensuring that hidden operational difficulties do not offset environmental benefits. Research by Vallati et al. [10,11,12] indicates that integrating model-based optimization, scenario analysis, and performance-driven system design is essential to improving the environmental efficiency of complex infrastructures, particularly in energy- and resource-intensive sectors. These works underscore that sustainability cannot be evaluated solely on functional performance; it must account for trade-offs among energy consumption, emissions, and resource use across the entire system.
Since conventional systems cannot recover nutrients or other important chemicals from wastewater flows, they will reach their sustainability limits due to their high energy demand and climatic impact. Despite the high energy cost of manufacturing nitrogen and its strategic importance to farming, wastewater nitrogen and phosphorus are typically removed or converted into unusable forms (e.g., gaseous N2 via volatilization or as sludge). This linear “take out and throw away” strategy challenges sustainable water management, which uses resource recovery and waste valorization as inputs to new production processes [4,13]. Thus, wastewater treatment is now seen as resource management (water, nutrients, and energy) and environmental sustainability, not just purification. This shift in perspective needs a holistic, cyclical examination of treatment technologies and quantitative analysis (e.g., LCA) to compare technical alternatives beyond operational efficacy [11,14,15,16]. This makes wastewater treatment an important node in the water–energy–food nexus, and technology decisions here affect climate change, water security, and the development of the circular economy.
Despite these limitations, advanced biological processes for resource recovery have gained significant attention. There is increasing interest in utilizing microalgae-based systems to improve wastewater treatment by combining effluent purification with impact reduction and by-product generation [5,9]. Unlike traditional biological systems that rely on heterotrophic bacteria, which usually convert nitrogen to volatile N2 and organic carbon to CO2, and precipitate phosphorus as sludge, microalgae and cyanobacteria are known for their ability to directly consume inorganic nutrients (nitrogen and phosphate), remove organic matter, and capture CO2 from the atmosphere. This enables both pollution treatment and biomass production [5,13,17].
Recent reviews highlight that microalgae cultures (often in symbiotic partnership with bacteria) can effectively remove total nitrogen, total phosphorus, BOD5, and COD from various waste waters, including municipal, agricultural, and industrial sources, without extensive use of chemical coagulants [17,18]. Velásquez-Orta et al. [6] report that in high-rate systems such as high-rate aerated ponds (HRAP) with microalgae-bacteria consortia, it is technically feasible to remove approximately 90% of ammonium, 70% of COD, and up to 50% of phosphate depending on operating conditions. Similarly, replacing culture medium with wastewater can cut the cost of producing 1 kg of microalgae by around 75%, reducing both freshwater use and the need for commercial fertilizers [19,20,21,22,23].
Another prominent feature is microalgae’s potential to treat various types of wastewater matrices. Several research works have pointed to their efficacy in both household wastewater and agricultural- and industrial-waste waters from sources such as landfill leachates, (centrate) of treatment plants, olive oil industry discharges, swine farming wastewater, or petrochemical effluents [6,18,24,25]. This adaptability is partly attributed to the metabolic flexibility of microalgae-bacteria consortia, whose composition and performance can be adjusted to variations in organic load, salinity, nutrient availability, or influent pH [6]. In addition, microalgae have shown the ability to tolerate and remove various emerging contaminants, such as drugs, hormones, and microplastics, and to adsorb or accumulate heavy metals present in water. The latter are sequestered by biosorption mechanisms through functional groups on the algal cell wall or via intracellular bioaccumulation, mitigating the harmful effects of metals in the environment [13,26]. An additional operational benefit of algal systems is that the oxygen produced during photosynthesis can be utilized in situ by heterotrophic bacteria to decompose organic matter, thereby reducing the need for mechanical aeration and lowering the overall energy expenditure of the treatment [16]. It should also be noted that microalgal biomass is generated very rapidly (growth rates 10 to 50 times higher than those of terrestrial plants) and does not usually produce toxic compounds, facilitating its subsequent management and avoiding the generation of additional residual sludge [13,27].
The combination of effluent treatment and biomass production means that microalgae treatment is closely aligned with the principles of the circular economy: waste (wastewater) is converted into a source of usable resources. Numerous studies indicate that this biomass can serve as a raw material for the production of high-value bioproducts (e.g., biopolymers, pigments, antioxidants), as a nutrient-dense biofertilizer, as an additive in animal feed (due to its protein and micronutrient composition), or can be converted into bioenergy through processes such as biogas, bioethanol, or biodiesel production [13,17,27,28,29,30,31]. Yet the technical feasibility of each recovery pathway will vary with biomass harvest efficiency (lipid/carbohydrate/protein proportions, water content, etc.) and the energy costs of evaporation/drying or conditioning. Several studies show that biomass drying, an energy-intensive process, is particularly challenging when producing biodiesel from microalgae; therefore, wet biomass-based processes are preferable to dry ones, as they reduce process costs and increase the likelihood of success [32,33,34,35,36].
The true sustainability of microalgae-based systems cannot be assessed solely based on pollutant removal efficiency or biomass productivity under controlled conditions. Operational and contextual parameters that influence net environmental performance, such as energy used for mixing and harvesting, infrastructure and space requirements, the fate of the generated biomass product, and temporal dynamics in effluent composition, must be considered. Dammak et al. [32] highlight that for algal technologies to be more environmentally compatible than their conventional counterparts, a correct process engineering and operational configuration must be adopted, as the environmental performance of an algal treatment system can significantly differ depending on whether the wastewater characteristics are appropriately matched with the desired biomass destination and cultivation regime. The majority of LCA research on microalgae focuses on specific configurations, a single effluent type, or a single biomass valorization pathway, thereby complicating direct comparisons of results and the extrapolation of conclusions to alternative situations [32,33,34,35]. Similarly, there are few systematic comparisons between conventional and microalgae systems within a single analytical framework that account for various operational conditions [9,35]. This lack of comprehensive multi-scenario analyses limits the potential of LCA as a decision-making tool for the design and selection of more sustainable treatment technologies. Although there is a growing amount of LCA research on microalgae-assisted wastewater treatment, most studies are limited to specific configurations, effluent types, or biomass pathways, which hinders cross-context comparison and the broad applicability of results. Additionally, comprehensive comparisons within established frameworks between conventional and microalgae-based systems in different operational scenarios are scarce.
This study aims to compare the environmental impacts of traditional wastewater treatment with microalgae-assisted alternatives using Life Cycle Analysis, with harmonized gate-to-gate boundaries and a common functional unit (1 m3 of treated wastewater). To improve cross-context comparability, we employ a multi-scenario design covering three decision-relevant contexts: (Sc1) a centralized municipal WWTP benchmark, (Sc2) a high-recirculation aquaculture system with inherent effluent management and water reuse, and (Sc3) a decentralized domestic train with UASB pretreatment and microalgae polishing. The study assesses the performance of microalgae-based configurations relative to the conventional reference, identifies the main impact factors, and evaluates the robustness of the conclusions to plausible variability (±20%). Additionally, it investigates whether eutrophication benefits occur without shifting burdens to toxicity or resource categories. We hypothesize that upstream electricity demand and influent-related costs primarily drive outcomes across scenarios, while microalgae-specific inputs are secondary. The study quantifies trade-offs across key impact categories to identify when microalgae integration is environmentally advantageous, supporting the design and planning of more sustainable, resilient sanitation pathways aligned with water security and circular economy goals.
2. Materials and Methods
2.1. Goal and Scope Definition
This study evaluates the potential environmental implications of three wastewater treatment procedures for aquaculture and household effluents using a life-cycle assessment (LCA) methodology aligned with ISO 14040 [36] and ISO 14044 [37].
The assessed systems comprise two alternatives utilizing microalgae and a traditional wastewater treatment system, which serves as the reference scenario. The study aims to facilitate decision-making on environmental sustainability and water resource management, particularly in tropical regions and areas with inadequate treatment facilities. An attributional life cycle assessment (LCA) was applied to quantify the environmental impacts of the wastewater treatment systems under representative operating conditions.
This approach was chosen because the study aims to compare the environmental performance of different treatment configurations rather than evaluate market-driven effects or large-scale system changes; therefore, marginal variations were not included. The findings are intended to guide researchers, environmental managers, and decision-makers in wastewater management.
2.2. System Description and Scenarios
The analysis considered three different wastewater treatment systems (Figure 1). Scenario 1 (Sc1, Conventional) was based on the wastewater treatment process at the Río Frío Wastewater Treatment Plant (WWTP), which includes standard processes used in a typical municipal treatment system. The information for this case was extracted from management reports and internal records of the RIO FRIO EMPAS plant (Empresa Pública de Alcantarillado de Santander S.A.E.S.P., Bucaramanga, Colombia).
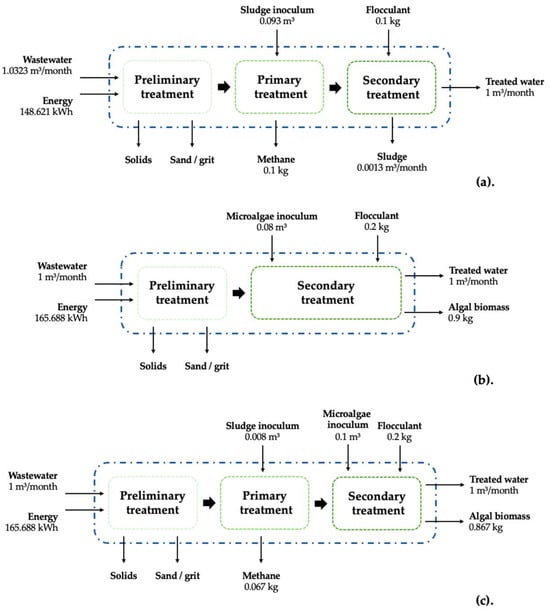
Figure 1.
Graphical representation of the scenarios evaluated. (a) conventional system, (b) aquaculture system, and (c) domestic + algae system.
In the second scenario (Sc2, Aquaculture system), a system resembling an Aquaculture Recirculation Complex was assessed, intended for the sustainable utilization of post-consumption effluent from aquaculture activities, incorporating recirculation and purification processes. The conditions of operation were obtained from Zuorro et al. [34]. Scenario 3 (Sc3, Domestic + algae) evaluated an upflow anaerobic reactor integrated with microalgae cultures, in which wastewater treatment is improved through nutrient uptake by microalgal biomass. The operational setup and performance data for this system were obtained from lab-scale experiments conducted at the INValgae laboratory (Cúcuta, Colombia) under controlled conditions (3 cycles of 25 days each of operation of a 200 L raceway inoculated with 15% v/v of Chlorella sp. and 75% v/v of treated effluent and a final volume of 120 L, under a light cycle of 12/12 h, and an average radiation of 100 µmol m−2 s−1).
The microalgae systems were assessed for their efficacy in removing contaminants and their environmental performance relative to traditional treatment methods. The Life Cycle Inventory (LCI) for Scenarios 1, 2, and 3 can be found in Table A1, Table A2 and Table A3.
The mass and energy balances for each scenario are presented in Table 1.

Table 1.
Mass and energy balance of the three evaluated scenarios.
2.3. Functional Unit
The functional unit (FU) established for the study was one cubic meter (1 m3) of treated wastewater, facilitating direct comparison among the various treatment systems assessed.
The water processed in the three scenarios is presumed to serve a similar role in terms of treatment efficacy and pollutant load reduction. The analysis excluded the transportation of wastewater to treatment facilities and the subsequent procedures related to the utilization or eventual disposal of the produced microalgal biomass.
2.4. System Boundaries
The analysis was conducted within gate-to-gate system parameters, encompassing the admission of wastewater into the pilot systems or treatment facility, through treatment, to the acquisition of treated water as the primary output.
The operational processes essential for wastewater treatment, including electricity usage and treatment system operation, were evaluated within the system boundaries. The subsequent item was explicitly omitted: wastewater conveyance. Capital goods and infrastructure have minimal environmental impact in operation and subsequent processing or upgrading of microalgal biomass.
2.5. Production Process Description
The structures and systems evaluated in this study were developed at a laboratory scale, using experimental data obtained from the INValgae laboratory (Cúcuta, Colombia) under controlled conditions.
System management was based on each technology setup and accounted for the operational period, hydraulic conditions, and energy requirements for effluent treatment. The treatment function in microalgae-based systems consisted of the interaction between effluent and microalgal biomass, with dissolved requirements removed.
2.6. Life Cycle Inventory
Life cycle inventory (LCI) was developed using a combination of primary and secondary data. Primary data were obtained from laboratory-scale experiments on the microalgae treatment system [34], while operational data from the Río Frío wastewater treatment plant were used for the baseline scenario. The monitored inputs and outputs included electricity consumption, treated water volume, and other material and energy flows associated with the treatment processes. Secondary data from databases integrated into the LCA SimaPro® software (Version 9.1.1), particularly Ecoinvent, were used to model background processes and, where possible, adapted to local conditions. Electricity consumption was modeled using the Colombian electricity mix.
2.7. Impact Assessment Methodology
An environmental impact assessment was conducted with SimaPro® software (Version 9.1.1) employing the ReCiPe 2016 Midpoint methodology from a Hierarchist cultural viewpoint [38,39]. Seven pertinent environmental effect categories for evaluating wastewater treatment systems were chosen based on prior research and specialized literature. These categories provide a thorough examination of the environmental impacts associated with resource use, emissions, and the ecological performance of the evaluated systems.
2.7.1. Allocation and Multifunctionality
The distribution of environmental consequences was directly assigned to treated water, which was regarded as the system’s primary output [40]. Although microalgal biomass was generated as a co-product in two scenarios, its impacts were not allocated because the study’s primary focus was on wastewater treatment. The mass ratio of treated water to biomass produced is considerably more favorable to water. Biomass was excluded from value in the context of the investigation.
Given these factors, no system extension or other allocation mechanisms were implemented.
2.7.2. Normalization and Weighting
Impact assessment results were mainly interpreted at the characterization level. Weighting was not used to avoid adding subjective bias to the interpretation. Normalization was only applied to make comparisons among impact categories easier (https://www.rivm.nl/en/documents/normalization-scores-recipe-2016?utm_source=chatgpt.com accessed on 9 March 2026). For this purpose, normalization factors from the ReCiPe Midpoint (H) method were used with the World reference [41,42], which reflects estimated annual per capita emissions globally and was deemed more suitable for this study conducted outside the European context.
2.7.3. Sensitivity and Uncertainty Analysis
The uncertainty associated with the primary inventory data was addressed qualitatively due to the experimental nature of the laboratory-scale systems. The reported values correspond to average measurements obtained during the operational period of the experiments conducted under controlled conditions. Potential sources of uncertainty include measurement variability, operational fluctuations, and assumptions related to the representation of laboratory conditions in the LCA model. In addition, a sensitivity analysis was performed on key parameters, such as electricity consumption and pollutant removal efficiencies, to evaluate the robustness of the results to variations in the inventory data.
A sensitivity analysis was performed to assess the influence of critical parameters on the LCA results. Electricity consumption and characterization factors varied within ±20% for each scenario, following the approach proposed by Wang et al. [43].
The sensitivity of the impacts was determined by evaluating the percentage change in results relative to the base value, thereby identifying the parameters with the most significant influence on the environmental performance of the systems.
2.7.4. Alternative Improvement Scenario: Methane Recovery and Energy Offset
To assess techniques for reducing the environmental impacts of energy consumption in wastewater treatment systems, an alternative enhancement scenario was proposed that emphasizes the use of methane (CH4) produced during anaerobic processes. Methane generation was assessed based on the volumes measured experimentally during the treatment of aquaculture and domestic wastewater.
The recoverable potential energy of the produced methane was evaluated using conversion coefficients reported in the literature for electricity generation from biogas. This methodology has been widely employed in LCA studies to assess the displacement of electricity consumption and its impact on environmental impact categories [44].
3. Results
Impacts Evaluation
Figure 2 shows the seven categories assessed across the three scenarios: global warming (kg CO2 eq), freshwater eutrophication (kg P eq), freshwater ecotoxicity (kg 1,4-DCB), marine ecotoxicity (kg 1,4-DCB), human carcinogenic toxicity (kg 1,4-DCB), fossil resource scarcity (kg oil eq), and water consumption (m3).
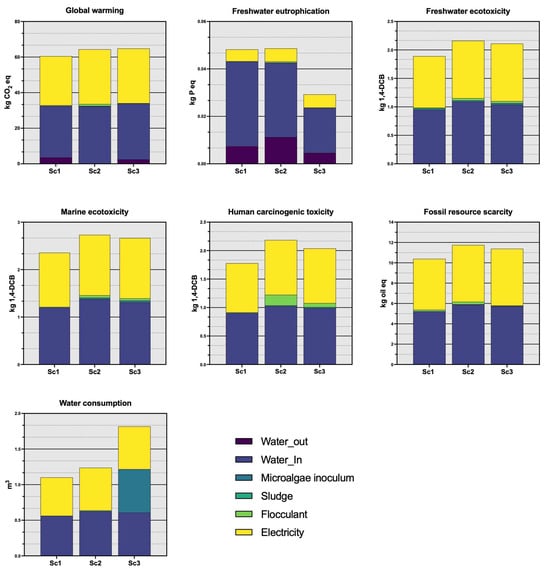
Figure 2.
Comparative life cycle impact results for global warming, eutrophication, toxicity, resource scarcity, and water consumption across three wastewater scenarios.
The implications of global warming are quantified as 60.51 kg CO2 eq for residual wastewater, 64.35 kg CO2 eq for aquaculture wastewater, and 65.06 kg CO2 eq for domestic wastewater. In every scenario, the primary contributions are attributed to energy consumption (27.59–30.75 kg CO2 eq) and influent water (28.81–32.28 kg CO2 eq). Insignificant contributions are linked to flocculant utilization (0.17–1.10 kg CO2 eq), microalgae inoculum (up to 0.22 kg CO2 eq), and sludge management, which remains minimal throughout scenarios.
For freshwater eutrophication, the values are 0.0482 kg P eq for residual wastewater, 0.0487 kg P eq for aquaculture wastewater, and 0.0282 kg P eq for household wastewater. The principal contributions derive from influent water (0.0188–0.0356 kg P eq) and energy use (0.0050–0.0055 kg P eq). Contributions from flocculant application and microalgae inoculum do not exceed 0.0011 kg P eq in any scenario, but sludge-related contributions are minimal.
Freshwater ecotoxicity varies from 1.89 kg 1,4-DCB for residual wastewater, 2.15 kg 1,4-DCB for aquaculture wastewater, to 2.10 kg 1,4-DCB for domestic wastewater. The primary sources are influent water (0.95–1.09 kg 1,4-DCB) and energy usage (0.91–1.01 kg 1,4-DCB). The application of flocculants results in the contribution of 0.0096 to 0.0389 kg of 1,4-DCB, whereas the microalgae inoculum provides a maximum of 0.0291 kg of 1,4-DCB. Contributions connected to sludge are negligible.
Marine ecotoxicity values are 2.36 kg of 1,4-DCB for residual wastewater, 2.73 kg of 1,4-DCB for aquaculture wastewater, and 2.67 kg of 1,4-DCB for domestic wastewater. Influent water and electricity are the primary sources, with combined values ranging from 2.34 to 2.65 kg of 1,4-DCB. The contributions of flocculant and microalgae inoculum stay under 0.0 kg of 1,4-DCB, whilst sludge contributions are minimal.
The human carcinogenic toxicity levels are 1.79 kg of 1,4-DCB for residual wastewater, 2.17 kg for aquaculture wastewater, and 2.04 kg for household wastewater. The predominant contributions are attributed to influent water (0.90–1.02 kg 1,4-DCB) and energy use (0.86–0.96 kg 1,4-DCB). The utilization of flocculants results in a contribution of up to 0.187 kg of 1,4-DCB, whilst the contributions from microalgae inoculum stay under 0.019 kg of 1,4-DCB.
The results for fossil resource scarcity are 10.38 kg oil eq for residual wastewater, 11.71 kg oil eq for aquaculture wastewater, and 11.38 kg oil eq for household wastewater. Electricity consumption constitutes the predominant portion (5.01–5.59 kg oil eq), succeeded by influent water (5.23–5.87 kg oil eq). The utilization of flocculants contributes between 0.042 and 0.245 kg of oil eq, whilst the contributions from microalgae inoculum stay under 0.051 kg of oil eq.
Total water usage is 1.10 m3 for residual wastewater, 1.24 m3 for aquaculture wastewater, and 1.21 m3 for domestic wastewater. Influent water (0.56–0.63 m3) and electricity-associated water consumption (0.54–0.60 m3) constitute the primary contributions across all scenarios. The contribution of microalgae inoculum is minimal for residual wastewater, slightly elevated for aquaculture wastewater (0.0028 m3), and substantial for household wastewater (0.61 m3). Contributions from flocculant and sludge remain below 0.01 m3 in all cases.
Across categories, the significance of differences between scenarios varies. For global warming, results are within a narrow range (≈60.5–65.1 kg CO2-eq·m−3), indicating that the three configurations are generally comparable within the assessed boundaries, with impacts mainly driven by electricity demand and influent contributions. In contrast, freshwater eutrophication shows a clear reduction for the domestic configuration (Sc3) compared to Sc1/Sc2 (≈0.028 vs. ≈0.048–0.049 kg P-eq·m−3), suggesting a decision-relevant improvement rather than a minor difference. Toxicity-related categories (human carcinogenic toxicity and freshwater/marine ecotoxicity) remain among the highest-impact endpoints and show limited variation across scenarios, implying that changing the treatment setup alone does not significantly alter toxicity burdens within the current gate-to-gate scope.
These indicate that system-level drivers—particularly electricity use and influent characterization—govern the overall environmental profile. At the same time, microalgae-specific inputs (inoculum and flocculant) contribute marginally in most categories at the evaluated scale.
Figure 3 displays the normalized life cycle impact assessment results for the three assessed scenarios (Sc1, Sc2, and Sc3), articulated in normalization units across seven midpoint impact categories: global warming, freshwater eutrophication, freshwater ecotoxicity, marine ecotoxicity, human carcinogenic toxicity, fossil resource scarcity, and water consumption.
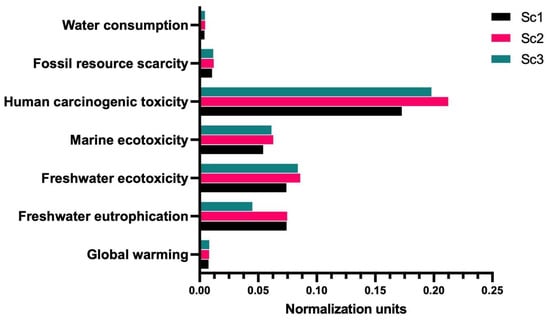
Figure 3.
Normalized midpoint life cycle impact assessment results for the three evaluated scenarios.
In all scenarios, human carcinogenic toxicity exhibits the highest normalized contribution, with values of 0.173 normalization units for Sc1, 0.212 for Sc2, and 0.198 for Sc3, establishing it as the predominant effect category post-normalization.
The second biggest normalized contributions are to freshwater ecotoxicity and freshwater eutrophication. Freshwater ecotoxicity measures 0.074 for Sc1, 0.086 for Sc2, and 0.084 for Sc3; freshwater eutrophication levels are 0.074 for Sc1, 0.075 for Sc2, and 0.045 for Sc3. Marine ecotoxicity shows moderate normalized values, rising from 0.054 in Sc1 to 0.063 in Sc2, then stabilizing at a comparable level in Sc3 (0.061). Reduced normalized contributions are noted for fossil resource shortages, with values between 0.0106 and 0.0120 normalization units, and for water use, which exhibits the lowest normalized values across all scenarios (0.0041–0.0046 normalization units).
Finally, Global warming exhibits comparatively low normalized values throughout the categories, with values of 0.0075 for Sc1, 0.0080 for Sc2, and 0.0081 for Sc3.
The normalization step indicates that toxicity-related impacts dominate the comparative environmental priority across all scenarios, whereas climate change contributes comparatively less to the normalized burden. Consequently, conclusions based solely on greenhouse-gas metrics would be incomplete for scenario selection in this system; instead, decision-making should emphasize strategies that address toxicity hotspots (notably those linked to electricity supply chains and influent-related burdens) alongside any eutrophication gains.
Figure 4 illustrates the outcomes of the normalized sensitivity analysis conducted on power usage across the three assessed scenarios (Sc1, Sc2, and Sc3). The electricity intake was adjusted by −20% and +20% relative to the baseline value for each scenario, in accordance with the methodological framework established by Hootmirdoosti et al. [45]. The results are shown as normalized by the seven midpoint impact categories. In each case, variations in electricity consumption result in significant changes across the different categories. The degree of these changes varies across the categories; in particular, human carcinogenic toxicity shows the widest range. For Sc1, normalized values of this quantity grow from 0.139 normalization units at −20% electric readjustment to 0.207 upon +20%, relative to the baseline of 0.173. A similar tendency is observed in Sc2 and Sc3, whose values increased from 0.174 to 0.250 and from 0.161 to 0.235, respectively.
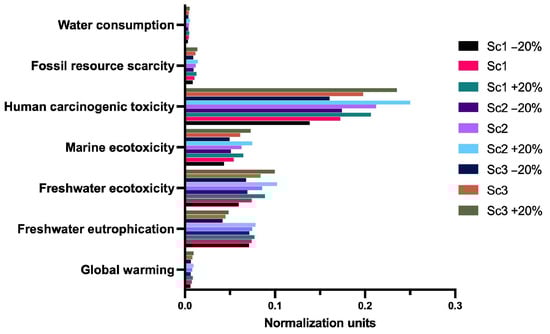
Figure 4.
Normalized life cycle impact sensitivity to electricity consumption.
Freshwater and marine ecotoxicity are highly sensitive to power fluctuations. Freshwater ecotoxicity for Sc2 ranges from 0.070 (−20%) to 0.102 (+20%), whereas marine ecotoxicity fluctuates from 0.051 to 0.075 normalization units. The same trends are also observed for Sc1 and Sc3, as their normalized values increase with increasing electrical input.
Freshwater eutrophication exhibits modest sensitivity, with normalized values for Sc1 rising from 0.071 to 0.077, and for Sc3 from 0.0416 to 0.0484, within the −20% to +20% electricity variation range. Reduced sensitivity is noted for fossil resource scarcity, global warming, and water use, which exhibit comparatively minor absolute changes in normalization units over the spectrum of electrical variation. For instance, global warming fluctuates between 0.0061 and 0.0097 normalization units across all scenarios, yet water usage remains under 0.0056 normalization units, even with a +20% increase in electricity input.
Overall, the ±20% variation in electricity mainly affects the magnitude of results. At the same time, the qualitative interpretation remains stable: toxicity-related categories continue to dominate normalized burdens, and eutrophication remains among the most responsive categories. Importantly, the sensitivity outcomes confirm that categories showing small separation between scenarios (e.g., global warming) should be interpreted as broadly comparable under plausible operational variability. In contrast, the reduction in eutrophication observed for Sc3 represents a more decision-relevant differentiation that persists despite fluctuations in electricity.
Figure 5 illustrates the normalized life-cycle effect assessment outcomes for an alternative enhancement scenario that includes methane (CH4) recovery and its application in power generation, compared with the baseline configurations. Results are presented for Sc1 (residual wastewater) and Sc3 (domestic wastewater), both with and without CH4 utilization, expressed in normalization units across seven midpoint impact categories: global warming, freshwater eutrophication, freshwater ecotoxicity, marine ecotoxicity, human carcinogenic toxicity, fossil resource scarcity, and water consumption.
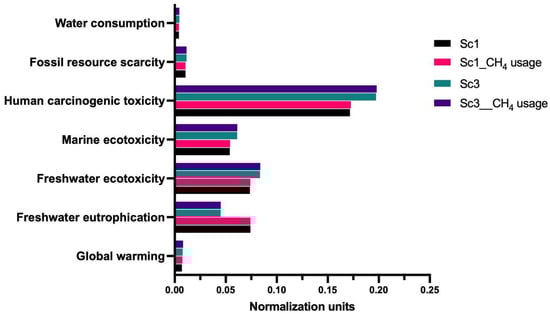
Figure 5.
Normalized life cycle impact assessment results for the alternative scenario, including methane (CH4) recovery and energy offset.
These results suggest that methane recovery, as implemented in the evaluated configuration, yields only marginal changes in normalized impacts relative to baseline, indicating that the dominant environmental hotspots remain upstream (electricity/influent) rather than within the added recovery step. Therefore, while recovery may offer operational co-benefits, it does not materially shift overall environmental priorities under the assessed assumptions.
The integration of methane recovery in Sc1 results in a few changes across most impact categories. Normalized global warming increases marginally from 0.00705 in the baseline to 0.00754 with the use of CH4. Freshwater eutrophication has remained relatively stable (0.07415 to 0.07423), whereas freshwater and marine ecotoxicity have increased slightly, from 0.07374 to 0.07413 and from 0.05390 to 0.05419, respectively. The human carcinogenic toxicity stays consistently stable, with values of 0.17170 and 0.17260. The scarcity of fossil resources and water use exhibits negligible change, remaining approximately at 0.0106 and 0.0041 normalization units, respectively.
In the methane recovery scenario for Sc3, there are a few fluctuations across impact categories. Global warming rises from 0.00780 to 0.00813 normalization units, whereas freshwater eutrophication exhibits a minimal increase from 0.04499 to 0.04504. Freshwater and marine ecotoxicity have remained remarkably stable at 0.0838 and 0.0613, respectively. The human carcinogenic toxicity exhibits a slight rise from 0.19728 to 0.19788 normalization units. The scarcity of fossil resources remains constant at 0.0116, while water consumption stays below 0.00455 normalization units.
The alternative scenario indicates that adding methane recovery produces only marginal shifts in normalized impacts relative to baseline, implying that the main environmental hotspots remain governed by upstream drivers rather than the added recovery step under the present assumptions.
Figure 6 illustrates the sensitivity analysis results for changes in influent characteristics across the three assessed wastewater scenarios (Sc1: residual wastewater, Sc2: aquaculture wastewater, and Sc3: household wastewater). The analysis was conducted by applying −20%, baseline, and +20% variations to the influent-related parameters, while assuming a constant removal efficiency. Results are presented in normalization units for the seven midpoint impact categories.
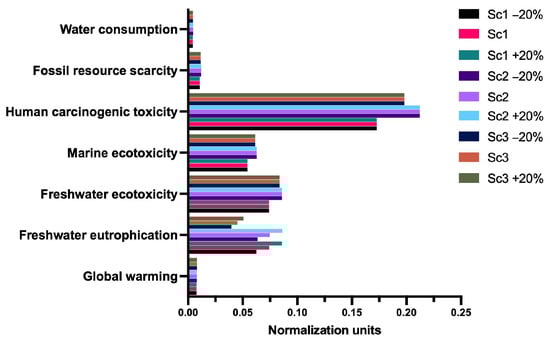
Figure 6.
Sensitivity analysis of normalized life-cycle impact categories to ±20% variation in influent characterization.
In all instances, differences in influent categorization result in noticeable alterations across most effect categories. Human carcinogenic toxicity exhibits the highest normalized values and the greatest range of variance. For Sc1, values rise from 0.139 normalization units at −20% to 0.207 at +20%, relative to a baseline value of 0.173. For Sc2, the values range from 0.174 to 0.212, whilst Sc3 exhibits values between 0.161 and 0.235, normalized units.
Freshwater and marine ecotoxicity are relatively sensitive to the influent characterization. The freshwater ecotoxicity scores for Sc1 are between 0.060 and 0.089, Sc2 between 0.070 and 0.102, and Sc3 between 0.068 and 0.100, normalized units. Marine ecotoxicity shows a similar pattern, with Sc1 ranging from 0.044 to 0.065, Sc2 from 0.051 to 0.075, and Sc3 from 0.050 to 0.073 normalization units.
Reduced sensitivity is observed for fossil resource shortages, water consumption, and global warming, which remain relatively constant across the −20% to +20% influent variation range. The shortage of fossil resources ranges from 0.0085 to 0.0143 normalization units; water usage consistently remains under 0.0056 normalization units throughout all scenarios. Global warming has the lowest normalized values, ranging from 0.0061 to 0.0097 normalization units.
Overall, the ±20% influent-variation analysis primarily affects impact magnitudes but does not alter the central interpretation: toxicity-related impacts remain the dominant normalized contributors across scenarios. At the same time, eutrophication and aquatic ecotoxicity are the most responsive categories to influent characterization. Consequently, categories showing limited separation between scenarios should be interpreted as broadly comparable under plausible influent variability. In contrast, scenario selection should be guided by the categories that remain consistently differentiated—most notably, the eutrophication performance of Sc3—along with targeted mitigation of upstream toxicity hotspots.
4. Discussion
This study’s goal-and-scope decisions explain the relatively small differences observed between scenarios. The gate-to-gate assessment emphasizes operational inputs and omits wastewater conveyance, capital goods/infrastructure, and downstream algal biomass (processing and valorization). Upstream electricity uses and influent-related stresses are the main factors across most impact categories, and these elements are present in all three configurations, which limits scenario differences. When sensitivity analyses assume constant removal performance, the functional unit (1 m3 of treated wastewater) assumes consistent treatment effectiveness across systems, standardizing outputs and reducing variability. Additionally, no allocation or system expansion considers the potential benefits or drawbacks of microalgal biomass as a co-product, excluding resource recovery pathway advantages and making microalgae-based scenarios more like the conventional reference. In an operation-focused context with common upstream drivers, small differences among scenarios suggest that scenario choice will likely depend on the few categories that consistently differ (e.g., eutrophication in Sc3) and on the aim to target mitigation of electricity- and influent-related hotspots, rather than on the treatment setup.
Our findings confirm previous LCA research, showing that, within operational limits (gate-to-gate), system-level drivers common across configurations—such as grid electricity and influent-related burdens—mainly influence several midpoint categories. This reduces the differences between scenarios, even when treatment trains vary. This pattern aligns with HRAP-based wastewater treatments, where environmental impact is primarily driven by energy demand and downstream handling assumptions, rather than solely by the biological treatment phase [46].
Table 2 compares the LCA analysis of algae-based wastewater treatment, highlighting the evaluated system context, the main methodological choices (FU, boundaries, LCIA), and the main impact contributors. In a case where a microalgae system for wastewater treatment and co-product recovery is analyzed, the relative advantage of one configuration over another is strongly influenced by upstream energy use and treatment context, with benefits often limited to specific impact categories rather than being universally applicable [33]. In another LCA case of a microalgae-based treatment integrated into a shrimp recirculating aquaculture system (RAS), the microalgae treatment contributes less than 10% of the significant impacts, with electricity as the main driver. This supports the idea that differences between scenarios are small when the energy source remains consistent [47,48]. Our earlier study on wastewater-based algal biomass for animal feed found that factors like eutrophication and toxicity often dominate normalized results, and that reducing energy use is a key lever, even across different functional units [34]. Finally, in another example using aquaculture raceway systems, the study reveals that biomass valorization routes and stirring/operational energy are major constraints [49]; therefore, practical implementation will depend on minimizing energy use and optimizing biomass management, rather than on the specific configuration.
Table 2.
Cross-study comparison of system scope, functional units, LCIA settings, and dominant impact contributors in LCA of wastewater treatment and microalgae-based configurations.
Overall, small differences between scenarios are expected within an attributional gate-to-gate scope; however, the main point is that a configuration can significantly alter a dominant pathway, as seen in Sc3’s freshwater eutrophication. Conversely, improvements across categories usually require directly addressing electricity and influent hotspots.
The life cycle assessment results indicate that the environmental performance of the evaluated microalgae-based wastewater treatment systems is governed by a limited number of dominant impact categories, consistently driven by system-level inputs rather than process-specific emissions. Across all scenarios, human carcinogenic toxicity, freshwater and marine ecotoxicity, and fossil resource scarcity emerge as the most influential impact categories after characterization and normalization, highlighting the relevance of upstream resource consumption and energy-related processes.
The predominance of human carcinogenic toxicity as a leading impact category has been widely reported in LCA studies of wastewater treatment systems, particularly when electricity consumption and chemical inputs are included within the system boundaries [9,35,50]. This category is mainly associated with emissions arising from electricity generation mixes and the production of auxiliary inputs, rather than from the biological treatment process itself. Similar patterns have been observed in microalgae-based systems, where indirect emissions linked to energy use outweigh direct process emissions [32,33].
Ecotoxicity-related categories, both freshwater and marine, also play a central role in shaping the overall environmental profile. These impacts are primarily driven by influent and effluent characterization and by upstream processes associated with energy and material supply chains. Previous studies have shown that nutrient-rich wastewaters and residual pollutant loads can strongly influence ecotoxicity indicators, particularly when background datasets attribute significant burdens to electricity generation and chemical manufacturing [51,52]. The relevance of these categories is therefore consistent with earlier LCA assessments of both conventional and algae-based wastewater treatment systems [48,53].
Fossil resource scarcity further reflects the dependence of the evaluated scenarios on grid electricity, reinforcing the role of operational energy demand as a cross-cutting driver of environmental impacts. This finding aligns with a substantial body of literature indicating that energy demand is a critical determinant of environmental performance in wastewater treatment, regardless of the biological process employed [54,55].
In microalgae-based systems, reliance on externally supplied electricity can offset the potential environmental benefits associated with nutrient removal and biomass production, particularly when energy recovery strategies are not implemented [18,56].
When normalized, the results consistently shift environmental priorities toward toxicity-related impact categories, confirming patterns previously reported for wastewater treatment systems. Human carcinogenic toxicity clearly dominates the normalized environmental profile, followed by freshwater and marine ecotoxicity, while global warming, fossil resource scarcity, and water consumption contribute comparatively less. This behavior highlights the added value of normalization, as it reveals impact pathways that may be underestimated when relying solely on characterized results [50,54]. Similar shifts toward toxicity-dominated profiles have been reported in LCAs of microalgae-based wastewater treatment, reflecting the strong linkage between electricity-related emissions and multiple toxicity pathways [32,33,53].
Although global warming potential is relevant at the characterization level, its lower normalized contribution has been attributed to the normalization reference values applied to climate change indicators, which tend to dilute the relative importance of greenhouse gas emissions compared to toxicity-related impacts [35,50]. A comparable pattern is observed in water consumption, which generally remains a secondary contributor when system boundaries focus on treatment processes rather than on the complete water supply chain [44].
The sensitivity analysis further confirms the central role of electricity demand as a robust system-level driver. Variations in electricity consumption produce consistent responses across most impact categories, particularly human carcinogenic toxicity, freshwater and marine ecotoxicity, and fossil resource scarcity. These results are consistent with previous studies showing that electricity consumption exerts a disproportionate influence on toxicity-related and resource depletion indicators in wastewater treatment systems [41,57]. Notably, while changes in electricity demand affect the magnitude of impacts, the relative ranking of impact categories remains stable, indicating that the main conclusions of the assessment are resilient to plausible fluctuations in energy use.
While electricity demand governs upstream environmental burdens, influent characterization defines the magnitude and distribution of nutrient- and toxicity-related impacts. Differences in organic load, nutrient concentration, and compositional variability among wastewater types directly influence eutrophication and ecotoxicity indicators, even when similar removal efficiencies are assumed. This behavior has been consistently reported in previous LCA studies, in which higher influent loads lead to larger residual emissions and increased environmental burdens, independent of treatment technology [4,9,52]. In microalgae-based systems, nutrient-rich influents can enhance biomass productivity while simultaneously intensifying eutrophication and ecotoxicity risks if nutrient removal is incomplete [5,51].
Influent characterization also indirectly affects environmental performance by influencing operational requirements, such as aeration, mixing, and downstream processing, thereby modulating electricity demand and associated impacts [54,55]. These interactions highlight the importance of accurately representing influent composition and load in LCA studies, as influent variability constitutes a key source of uncertainty and a fundamental determinant of environmental outcomes [53,58].
The methane recovery scenario was modeled as a theoretical improvement within an attributional LCA framework, implemented by reducing net electricity consumption while holding all other system flows constant. This approach is consistent with methodological strategies previously applied to anaerobic and hybrid wastewater treatment systems [57,59,60]. Biogas recovery and energy valorization have previously been reported to mitigate environmental impacts, most notably the climate change impact category, by displacing fossil-based electricity [61,62], but, as can be seen from the results herein, only limited benefits of methane redirection are available under low biogas production scenarios. It is similar at smaller-scale or low-organic-load systems, where limited biogas production limits the role of energy recovery beyond small benefits [63].
Despite its limited quantitative effect, the inclusion of methane recovery remains methodologically relevant, as it allows the evaluation of the marginal contribution of energy recovery strategies and supports the identification of optimization pathways under idealized conditions [59,63]. From a systems perspective, methane recovery should therefore be regarded as a complementary strategy whose effectiveness is highly context-dependent and strongly influenced by scale, organic loading rate, and conversion efficiency.
Overall, the integrated approach shows that there is no inherent environmental performance advantage of microalgae as a wastewater treatment solution over conventional systems, but this depends strongly on how and where the process is implemented. Operational energy requirements and feed characteristics appear to be the main levers for sustainability, with energy recovery options (e.g., methane use) providing secondary benefits when properly accounted for. From a life-cycle perspective, these findings challenge technology-centered sustainability claims and emphasize the need for system-oriented, context-specific implementation strategies to ensure that microalgae-based wastewater treatment effectively contributes to sustainable water management.
5. Conclusions
This study used an attributional gate-to-gate LCA (ReCiPe 2016 Midpoint, H) to compare a conventional municipal WWTP, an aquaculture recirculation system with microalgae, and a domestic train combining UASB pretreatment with microalgae polishing (FU: 1 m3 treated wastewater). Global warming impacts were similar across scenarios (≈60.5–65.1 kg CO2-eq·m−3), mainly because upstream electricity demand and influent-related burdens are consistent hotspots, while microalgae-specific inputs contribute minimally. After normalization, human carcinogenic toxicity and aquatic ecotoxicity were the primary environmental concerns, indicating that climate-focused metrics can miss significant health and ecosystem risks. Although differences between scenarios are generally limited within the chosen operational boundaries, Sc3 showed a notable reduction in freshwater eutrophication (≈0.028 vs. ≈0.048–0.049 kg P-eq·m−3). Sensitivity analyses (±20% for electricity and influent characterization) affected the magnitudes but did not alter the dominance of the electricity/influent pathways. The methane-recovery electricity-offset case resulted in only slight changes under low CH4 yields, suggesting energy recovery is supplementary and context-dependent. Policy implications include prioritizing grid decarbonization and energy-efficiency measures (mixing/aeration/pumping), as well as influent source control and monitoring of toxic loads. Limitations stem from the gate-to-gate scope (excluding conveyance, infrastructure, and downstream biomass valorization) and reliance on site-wide influent and operational assumptions. Future research should develop site-specific inventories, expand boundaries to include biomass pathways and infrastructure, and combine LCA with techno-economic and local risk assessments to support scalable implementation.
Author Contributions
Conceptualization, A.Z., J.B.G.-M. and C.B.-F.; methodology, A.Z., J.B.G.-M. and A.F.B.-S.; software, C.B.-F., A.Z. and J.B.G.-M.; validation, A.Z. and A.F.B.-S.; formal analysis, L.N.S.G. and L.T.R.N.; investigation, J.B.G.-M., L.N.S.G. and L.T.R.N.; resources, A.Z. and A.F.B.-S.; data curation, A.Z. and J.B.G.-M.; writing—original draft preparation, L.N.S.G. and L.T.R.N.; writing—review and editing, J.B.G.-M. and A.F.B.-S.; visualization, A.F.B.-S., A.Z. and J.B.G.-M.; supervision, A.Z. and J.B.G.-M.; project administration, A.Z. and A.F.B.-S.; funding acquisition, A.Z. and A.F.B.-S. All authors have read and agreed to the published version of the manuscript.
Funding
This study received financial support from Sapienza University through the Academic Mid Projects 2021 (Grant No. RM12117A8B58023A). Also, the NeWater project received funding through the WATER4ALL Partnership. Additionally, funding was provided by Universidad Francisco de Paula Santander (Colombia) (FINU 001-2025), the Ministry of Science and Technology of Colombia, and the Colombian Institute of Educational Credit and Technical Studies Abroad (MINCIENCIAS-ICETEX) under the project titled “FOTOLIX” with the ID 2023-0686.
Institutional Review Board Statement
Not applicable.
Data Availability Statement
The original contributions presented in this study are included in the article. Further inquiries can be directed to the corresponding authors.
Acknowledgments
We would like to express our sincere gratitude to Sapienza University of Rome and Universidad Francisco de Paula Santander (Colombia) for providing the equipment for this research. We also thank the Colombian Ministry of Science, Technology, and Innovation, MINCIENCIAS, for supporting national Doctorates through the Francisco José de Caldas scholarship program.
Conflicts of Interest
The authors declare no conflicts of interest.
Appendix A. Life Cycle Inventory (LCI) Data for the Evaluated Scenarios
Table A1.
Life Cycle Inventory (LCI) for Scenario 1—Conventional Wastewater Treatment (Río Frío WWTP).
Table A1.
Life Cycle Inventory (LCI) for Scenario 1—Conventional Wastewater Treatment (Río Frío WWTP).
| Category | Flow | Quantity | Unit |
|---|---|---|---|
| Technosphere Output | Treated wastewater effluent (Río Frío WWTP) | 1 | m3 |
| Technosphere Input | Influent wastewater | 1.0323 | m3 |
| Technosphere Input | Polyacrylamide (market for polyacrylamide, GLO—Ecoinvent) | 0.2 | kg |
| Technosphere Input | Electricity, medium voltage (Colombia electricity mix) | 148.62 | kWh |
| Emission to Air | Methane (CH4) | 0.1 | kg |
| Emission to Water | COD (Chemical Oxygen Demand) | 0.247 | kg |
| Emission to Water | BOD5 (Biological Oxygen Demand) | 0.076 | kg |
| Emission to Water | Nitrate | 0.003 | kg |
| Emission to Water | Phosphate | 0.001 | kg |
| Emission to Water | Suspended solids | 0.1 | kg |
| Emission to Water | Chloride | 4 | kg |
| Waste for Treatment | Raw sewage sludge sent to municipal incineration | 0.0013 | kg |
Table A2.
Life Cycle Inventory (LCI) for Scenario 2—Aquaculture Effluent Treatment with Microalgae.
Table A2.
Life Cycle Inventory (LCI) for Scenario 2—Aquaculture Effluent Treatment with Microalgae.
| Category | Flow | Quantity | Unit |
|---|---|---|---|
| Technosphere Output | Aquaculture treated effluent | 1 | m3 |
| Technosphere Output | Microalgae biomass | 0.9 | kg |
| Technosphere Input | Aquaculture influent wastewater | 1.0323 | m3 |
| Technosphere Input | Microalgae inoculum (primary treatment) | 0.08 | m3 |
| Technosphere Input | Aluminum chloride (market for aluminum chloride, GLO—Ecoinvent) | 0.2 | kg |
| Technosphere Input | Electricity, medium voltage (Colombia electricity mix) | 165.688 | kWh |
| Emission to Water | COD (Chemical Oxygen Demand) | 0.0325 | kg |
| Emission to Water | BOD5 (Biological Oxygen Demand) | 0.0090 | kg |
| Emission to Water | Nitrate | 0.0047 | kg |
| Emission to Water | Phosphate | 0.0313 | kg |
| Emission to Water | Suspended solids | 0 | kg |
| Emission to Water | Chloride | 0 | kg |
Table A3.
Life Cycle Inventory (LCI) for Scenario 3—Domestic Wastewater Treatment with Microalgae.
Table A3.
Life Cycle Inventory (LCI) for Scenario 3—Domestic Wastewater Treatment with Microalgae.
| Category | Flow | Quantity | Unit |
|---|---|---|---|
| Technosphere Output | Domestic treated effluent | 1 | m3 |
| Technosphere Output | Microalgae biomass | 0.867 | kg |
| Technosphere Input | Domestic wastewater influent | 1 | m3 |
| Technosphere Input | Microalgae inoculum (primary treatment) | 0.1 | m3 |
| Technosphere Input | Aluminum sulfate, powder (RoW—Ecoinvent market) | 0.2 | kg |
| Technosphere Input | Electricity, medium voltage (Colombia electricity mix) | 165.688 | kWh |
| Emission to Air | Methane (CH4) | 0.067 | kg |
| Emission to Water | COD (Chemical Oxygen Demand) | 0.043 | kg |
| Emission to Water | BOD5 (Biological Oxygen Demand) | 0.16745 | kg |
| Emission to Water | Nitrate | 0.005 | kg |
| Emission to Water | Phosphate | 0 | kg |
| Emission to Water | Suspended solids | 0.02 | kg |
| Emission to Water | Chloride | 0.03 | kg |
References
- Zafar, S.J.; Sipra, H.M.; Abbas, M.; Zaman, T.; Adil, M.Z.; Ahmad, A.M.; Hamza, M.; Hassan, S.A. Utilizing Agrofood Wastewater for Sustainable and Environmentally Friendly Manufacturing. Discov. Environ. 2025, 3, 81. [Google Scholar] [CrossRef]
- Qadir, M.; Drechsel, P.; Jones, E.R. Domestic Wastewater Treatment and Agricultural Reuse Progress and Reporting Challenges. Discov. Water 2025, 5, 74. [Google Scholar] [CrossRef]
- Jones, E.R.; van Vliet, M.T.H.; Qadir, M.; Bierkens, M.F.P. Country-Level and Gridded Estimates of Wastewater Production, Collection, Treatment and Reuse. Earth Syst. Sci. Data 2021, 13, 237–254. [Google Scholar] [CrossRef]
- Goswami, R.K.; Agrawal, K.; Verma, P. Multifaceted Role of Microalgae for Municipal Wastewater Treatment: A Futuristic Outlook toward Wastewater Management. Clean 2023, 51, 2100286. [Google Scholar] [CrossRef]
- Chai, W.S.; Tan, W.G.; Halimatul Munawaroh, H.S.; Gupta, V.K.; Ho, S.-H.; Show, P.L. Multifaceted Roles of Microalgae in the Application of Wastewater Biotreatment: A Review. Environ. Pollut. 2021, 269, 116236. [Google Scholar] [CrossRef]
- Velásquez-Orta, S.B.; Yáñez-Noguez, I.; Ramírez, I.M.; Ledesma, M.T.O. Pilot-Scale Microalgae Cultivation and Wastewater Treatment Using High-Rate Ponds: A Meta-Analysis. Environ. Sci. Pollut. Res. 2024, 31, 46994–47021. [Google Scholar] [CrossRef]
- Tsalas, N.; Golfinopoulos, S.K.; Samios, S. Assessing Energy Consumption and Treatment Efficiency Correlation: The Case of the Metamorphosis Wastewater Treatment Plant in Attica, Greece. Urban Sci. 2025, 9, 201. [Google Scholar] [CrossRef]
- Hamawand, I. Energy Consumption in Water/Wastewater Treatment Industry—Optimisation Potentials. Energies 2023, 16, 2433. [Google Scholar] [CrossRef]
- dos Santos, A.M.; Deprá, M.C.; dos Santos, A.M.; Cichoski, A.J.; Zepka, L.Q.; Jacob-Lopes, E. Sustainability Metrics on Microalgae-Based Wastewater Treatment System. Desalination Water Treat. 2020, 185, 51–61. [Google Scholar] [CrossRef]
- Vallati, A.; Vollaro, R.d.L.; Tallini, A.; Cedola, L. Photovoltaics Noise Barrier: Acoustic and Energetic Study. Energy Procedia 2015, 82, 716–723. [Google Scholar] [CrossRef]
- Vallati, A.; Fiorini, C.V.; Grignaffini, S.; Ocłoń, P.; Di Matteo, M.; Kobylarczyk, J. Energy Retrofit Optimization for Social Building in Temperate Climate Zone. Energy Build. 2023, 282, 112771. [Google Scholar] [CrossRef]
- Pedone, L.; Molaioni, F.; Vallati, A.; Pampanin, S. Energy Refurbishment Planning of Italian School Buildings Using Data-Driven Predictive Models. Appl. Energy 2023, 350, 121730. [Google Scholar] [CrossRef]
- Kundu, P.; Dutta, N.; Bhattacharya, S. Application of Microalgae in Wastewater Treatment with Special Reference to Emerging Contaminants: A Step towards Sustainability. Front. Anal. Sci. 2024, 4, 1513153. [Google Scholar] [CrossRef]
- Ali Yildirim, M.; Bartyzel, F.; Vallati, A.; Woźniak, M.K.; Ocłoń, P. Efficient Energy Storage in Residential Buildings Integrated with RESHeat System. Appl. Energy 2023, 335, 120752. [Google Scholar] [CrossRef]
- Vallati, A.; Di Matteo, M.; Sundararajan, M.; Muzi, F.; Fiorini, C.V. Development and Optimization of an Energy Saving Strategy for Social Housing Applications by Water Source-Heat Pump Integrating Photovoltaic-Thermal Panels. Energy 2024, 301, 131531. [Google Scholar] [CrossRef]
- Akinbuja, O.; Orta, S.V.; Boodhoo, K. Life Cycle Assessment of Microalgae-Assisted Microbial Fuel Cells. Int. J. Life Cycle Assess. 2025, 30, 2133–2144. [Google Scholar] [CrossRef]
- Ahmad, I.; Abdullah, N.; Koji, I.; Yuzir, A.; Mohamad, S.E. Potential of Microalgae in Bioremediation of Wastewater. Bull. Chem. React. Eng. Catal. 2021, 16, 413–429. [Google Scholar] [CrossRef]
- El Bakraoui, H.; Slaoui, M.; Mabrouki, J.; Hmouni, D.; Laroche, C. Recent Trends on Domestic, Agricultural and Industrial Wastewaters Treatment Using Microalgae Biorefinery System. Appl. Sci. 2022, 13, 68. [Google Scholar] [CrossRef]
- Al-Jabri, H.; Das, P.; Khan, S.; Thaher, M.; AbdulQuadir, M. Treatment of Wastewaters by Microalgae and the Potential Applications of the Produced Biomass—A Review. Water 2020, 13, 27. [Google Scholar] [CrossRef]
- Ummalyma, S.B.; Sirohi, R.; Udayan, A.; Yadav, P.; Raj, A.; Sim, S.J.; Pandey, A. Sustainable Microalgal Biomass Production in Food Industry Wastewater for Low-Cost Biorefinery Products: A Review. Phytochem. Rev. 2023, 22, 969–991. [Google Scholar] [CrossRef]
- Gómez-Serrano, C.; Morales-Amaral, M.M.; Acién, F.G.; Escudero, R.; Fernández-Sevilla, J.M.; Molina-Grima, E. Utilization of Secondary-Treated Wastewater for the Production of Freshwater Microalgae. Appl. Microbiol. Biotechnol. 2015, 99, 6931–6944. [Google Scholar] [CrossRef]
- Kang, Z.; Kim, B.-H.; Ramanan, R.; Choi, J.-E.; Yang, J.-W.; Oh, H.-M.; Kim, H.-S. A Cost Analysis of Microalgal Biomass and Biodiesel Production in Open Raceways Treating Municipal Wastewater and under Optimum Light Wavelength. J. Microbiol. Biotechnol. 2015, 25, 109–118. [Google Scholar] [CrossRef] [PubMed]
- Guiza-Franco, L.; Orozco-Rojas, L.G.; Sanchez-Galvis, M.; Garcia-Martinez, J.B.; Barajas-Ferreira, C.; Zuorro, A.; Barajas-Solano, A.F. Production of Chlorella Vulgaris Biomass on UV-Treated Wastewater as an Alternative for Environmental Sustainability on High-Mountain Fisheries. Chem. Eng. Trans. 2018, 64, 517–522. [Google Scholar] [CrossRef]
- Baldisserotto, C.; Demaria, S.; Arcidiacono, M.; Benà, E.; Giacò, P.; Marchesini, R.; Ferroni, L.; Benetti, L.; Zanella, M.; Benini, A.; et al. Enhancing Urban Wastewater Treatment through Isolated Chlorella Strain-Based Phytoremediation in Centrate Stream: An Analysis of Algae Morpho-Physiology and Nutrients Removal Efficiency. Plants 2023, 12, 1027. [Google Scholar] [CrossRef] [PubMed]
- Pritišanac, E.; Fafanđel, M.; Haberle, I.; Geček, S.; Markić, M.; Bolf, N.; Vukadin, J.; Crnković, G.; Klanjšček, T.; Žilić, L.; et al. Comparative Study of the Microalgae-Based Wastewater Treatment, in an Oil Refining Industry Cogeneration Concept. Water 2025, 17, 2217. [Google Scholar] [CrossRef]
- Yang, X.-Y.; Wei, Y.-X.; Su, Y.-Q.; Zhang, Z.-W.; Tang, X.-Y.; Chen, Y.-E.; Yuan, M.; Yuan, S. The Strategies Microalgae Adopt to Counteract the Toxic Effect of Heavy Metals. Microorganisms 2025, 13, 989. [Google Scholar] [CrossRef]
- El-Sheekh, M.M.; El-Kassas, H.Y.; Ali, S.S. Microalgae-Based Bioremediation of Refractory Pollutants: An Approach towards Environmental Sustainability. Microb. Cell Fact. 2025, 24, 19. [Google Scholar] [CrossRef]
- Barajas-Solano, A.F.; Guzmán-Monsalve, A.; Kafarov, V. Effect of Carbon-Nitrogen Ratio for the Biomass Production, Hydrocarbons and Lipids on Botryoccus Braunii UIS 003. Chem. Eng. Trans. 2016, 49, 247–252. [Google Scholar] [CrossRef]
- Barajas-Solano, A.F.; Gonzalez-Delgado, A.D.; Kafarov, V. Effect Of Thermal Pre-Treatment on Fermentable Sugar Production of Chlorella Vulgaris. Chem. Eng. Trans. 2014, 37, 655–660. [Google Scholar] [CrossRef]
- Cuéllar-García, D.J.; Rangel-Basto, Y.A.; Urbina-Suarez, N.A.; Barajas-Solano, A.F.; Muñoz-Peñaloza, Y.A. Lipids Production from Scenedesmus Obliquus through Carbon/Nitrogen Ratio Optimization. J. Phys. Conf. Ser. 2019, 1388, 12043. [Google Scholar] [CrossRef]
- Calijuri, M.L.; Do Couto, E.d.A.; Assemany, P.P.; Ribeiro, V.J.; Lorentz, J.F.; Castro, J.d.S.; Assis, L.R.d.; Oliveira, A.P.d.S.; Pereira, A.S.A.d.P.; Marangon, B.B.; et al. Microalgae-Based Wastewater Treatment and Biomass Valorization: Insights, Challenges, and Opportunities from 15 Years of Research. ACS Omega 2025, 10, 49273–49299. [Google Scholar] [CrossRef] [PubMed]
- Dammak, I.; Fersi, M.; Hachicha, R.; Abdelkafi, S. Current Insights into Growing Microalgae for Municipal Wastewater Treatment and Biomass Generation. Resources 2023, 12, 119. [Google Scholar] [CrossRef]
- Arashiro, L.T.; Josa, I.; Ferrer, I.; Van Hulle, S.W.H.; Rousseau, D.P.L.; Garfí, M. Life Cycle Assessment of Microalgae Systems for Wastewater Treatment and Bioproducts Recovery: Natural Pigments, Biofertilizer and Biogas. Sci. Total Environ. 2022, 847, 157615. [Google Scholar] [CrossRef] [PubMed]
- Zuorro, A.; García-Martínez, J.B.; Barajas-Solano, A.F.; Rodríguez-Lizcano, A.; Kafarov, V. Environmental Footprint of Inland Fisheries: Integrating LCA Analysis to Assess the Potential of Wastewater-Based Microalga Cultivation as a Promising Solution for Animal Feed Production. Processes 2023, 11, 3255. [Google Scholar] [CrossRef]
- Crippa, I.; Dolci, G.; Grosso, M.; Rigamonti, L. Life Cycle Assessment of Microalgal Biomass Valorization from a Wastewater Treatment Process. Waste Biomass Valorization 2025, 16, 525–541. [Google Scholar] [CrossRef]
- ISO 14040:2006; Environmental Management—Life Cycle Assessment—Principles and Framework. International Organization for Standardization: Geneva, Switzerland, 2006.
- ISO 14044:2006; Environmental Management—Life Cycle Assessment—Requirements and Guidelines. International Organization for Standardization: Geneva, Switzerland, 2006.
- Huijbregts, M.A.J.; Steinmann, Z.J.N.; Elshout, P.M.F.; Stam, G.; Verones, F.; Vieira, M.; Zijp, M.; Hollander, A.; van Zelm, R. ReCiPe2016: A Harmonised Life Cycle Impact Assessment Method at Midpoint and Endpoint Level. Int. J. Life Cycle Assess. 2017, 22, 138–147. [Google Scholar] [CrossRef]
- Database & Support Team at PRé Sustainability. SimaPro Database Manual Methods Library; PRé Sustainability: Amersfoort, The Netherlands, 2024. [Google Scholar]
- Dominguez Aldama, D.; Grassauer, F.; Zhu, Y.; Ardestani-Jaafari, A.; Pelletier, N. Allocation Methods in Life Cycle Assessments (LCAs) of Agri-Food Co-Products and Food Waste Valorization Systems: Systematic Review and Recommendations. J. Clean. Prod. 2023, 421, 138488. [Google Scholar] [CrossRef]
- Pizzol, M.; Laurent, A.; Sala, S.; Weidema, B.; Verones, F.; Koffler, C. Normalisation and Weighting in Life Cycle Assessment: Quo Vadis? Int. J. Life Cycle Assess. 2017, 22, 853–866. [Google Scholar] [CrossRef]
- Bayazıt Subaşı, A.; Askham, C.; Sandorf, E.D.; Dias, L.C.; Campbell, D.; Taş, E.F.; Itsubo, N.; Nagawa, C.B.; Kyarimpa, C.M.; Djerma, M.; et al. Weighting Factors for LCA—A New Set from a Global Survey. Int. J. Life Cycle Assess. 2024, 29, 2107–2136. [Google Scholar] [CrossRef]
- Wang, Q.-L.; Li, W.; Gao, X.; Li, S.-J. Life Cycle Assessment on Biogas Production from Straw and Its Sensitivity Analysis. Bioresour. Technol. 2016, 201, 208–214. [Google Scholar] [CrossRef]
- Osman, A.I.; Fang, B.; Zhang, Y.; Liu, Y.; Yu, J.; Farghali, M.; Rashwan, A.K.; Chen, Z.; Chen, L.; Ihara, I.; et al. Life Cycle Assessment and Techno-Economic Analysis of Sustainable Bioenergy Production: A Review. Environ. Chem. Lett. 2024, 22, 1115–1154. [Google Scholar] [CrossRef]
- Hootmirdoosti, S.; Okati, N.; Nowrouzi, M.; Erfani, M. Life Cycle Analysis of the Wastewater Treatment System in Zabol Industrial Town: Environmental Impacts, Energy Demand, and Greenhouse Gas Emissions. Integr. Environ. Assess. Manag. 2024, 20, 1747–1758. [Google Scholar] [CrossRef]
- Arashiro, L.T.; Montero, N.; Ferrer, I.; Acién, F.G.; Gómez, C.; Garfí, M. Life Cycle Assessment of High Rate Algal Ponds for Wastewater Treatment and Resource Recovery. Sci. Total Environ. 2018, 622–623, 1118–1130. [Google Scholar] [CrossRef] [PubMed]
- Arbour, A.J.; Bhatt, P.; Simsek, H.; Brown, P.B.; Huang, J.-Y. Life Cycle Assessment on Environmental Feasibility of Microalgae-Based Wastewater Treatment for Shrimp Recirculating Aquaculture Systems. Bioresour. Technol. 2024, 399, 130578. [Google Scholar] [CrossRef] [PubMed]
- Sfez, S.; Van Den Hende, S.; Taelman, S.E.; De Meester, S.; Dewulf, J. Environmental Sustainability Assessment of a Microalgae Raceway Pond Treating Aquaculture Wastewater: From up-Scaling to System Integration. Bioresour. Technol. 2015, 190, 321–331. [Google Scholar] [CrossRef]
- Buonocore, E.; Mellino, S.; De Angelis, G.; Liu, G.; Ulgiati, S. Life Cycle Assessment Indicators of Urban Wastewater and Sewage Sludge Treatment. Ecol. Indic. 2018, 94, 13–23. [Google Scholar] [CrossRef]
- González-Camejo, J.; Aparicio, S.; Pachés, M.; Borrás, L.; Seco, A. Comprehensive Assessment of the Microalgae-Nitrifying Bacteria Competition in Microalgae-Based Wastewater Treatment Systems: Relevant Factors, Evaluation Methods and Control Strategies. Algal Res. 2022, 61, 102563. [Google Scholar] [CrossRef]
- Saranya, G.; Ramachandra, T.V. Life Cycle Assessment of Biodiesel from Estuarine Microalgae. Energy Convers. Manag. X 2020, 8, 100065. [Google Scholar] [CrossRef]
- Patel, K.; Singh, S.K. A Life Cycle Approach to Environmental Assessment of Wastewater and Sludge Treatment Processes. Water Environ. J. 2022, 36, 412–424. [Google Scholar] [CrossRef]
- Lam, T.Q.K.; Sreekeshava, K.S.; Bhargavi, C.; Ganesh, C.R.; Ambale, N.S.; Do, T.M.D. Exploring the Potential of Green Microalgae-Based Phycoremediation Treated Wastewater for Sustainable Concrete Production. Adv. Civ. Eng. 2024, 2024, 8564202. [Google Scholar] [CrossRef]
- Meneses, M.; Pasqualino, J.C.; Castells, F. Environmental Assessment of Urban Wastewater Reuse: Treatment Alternatives and Applications. Chemosphere 2010, 81, 266–272. [Google Scholar] [CrossRef] [PubMed]
- Bilgaiyan, P.; Shivhare, N.; Gowripathi Rao, N.R.N.V. Phytoremediation of Wastewater through Implemented Wetland—A Review. In Proceedings of the E3S Web of Conferences; EDP Sciences: Les Ulis, France, 2023; Volume 405. [Google Scholar]
- Rebello, T.A.; Gonçalves, R.F.; Calmon, J.L. Mitigation of Environmental Impacts in Warm-Weather Wastewater Treatment Plants Using the Life Cycle Assessment Tool. Int. J. Environ. Sci. Technol. 2022, 19, 4763–4778. [Google Scholar] [CrossRef]
- El-Moustaqim, K.; El Bakraoui, H.; Mabrouki, J.; Fouad, Y.; Slaoui, M.; Hmouni, D.; Benyeogor, M.S.; Igbigbi, T.L. Combination of Microalgae Method, Decantation, and Filtration for Domestic Wastewater Treatment. Sustainability 2023, 15, 16110. [Google Scholar] [CrossRef]
- Rebello, T.A.; Roque, R.P.; Gonçalves, R.F.; Calmon, J.L.; Queiroz, L.M. Life Cycle Assessment of Urban Wastewater Treatment Plants: A Critical Analysis and Guideline Proposal. Water Sci. Technol. 2021, 83, 501–514. [Google Scholar] [CrossRef]
- Salvador, R.; Barros, M.V.; Rosário, J.G.D.P.D.; Piekarski, C.M.; da Luz, L.M.; de Francisco, A.C. Life Cycle Assessment of Electricity from Biogas: A Systematic Literature Review. Environ. Prog. Sustain. Energy 2019, 38, 13133. [Google Scholar] [CrossRef]
- Massara, T.M.; Komesli, O.T.; Sozudogru, O.; Komesli, S.; Katsou, E. A Mini Review of the Techno-Environmental Sustainability of Biological Processes for the Treatment of High Organic Content Industrial Wastewater Streams. Waste Biomass Valorization 2017, 8, 1665–1678. [Google Scholar] [CrossRef]
- Yilmaz, M.; Guven, H.; Ozgun, H.; Ersahin, M.E.; Koyuncu, I. The Application of Life Cycle Assessment (LCA) to Anaerobic Technologies for the Treatment of Municipal Wastewater: A Review. Process Saf. Environ. Prot. 2024, 182, 357–370. [Google Scholar] [CrossRef]
- Ogbu, C.A.; Alexiou Ivanova, T.; Ewemoje, T.A.; Alabi, H.A.; Roubík, H. Towards Environmentally Sustainable Water Management in Africa: A Comprehensive Review of Life Cycle Assessment Studies in Water and Wastewater Treatment. Int. J. Life Cycle Assess. 2025, 30, 956–979. [Google Scholar] [CrossRef]
- Ahmed, M.; Hasan, C.K.; Rahman, H.; Hossain, M.A.; Uddin, S.A. Prospects of Using Wastewater as a Resource-Nutrient Recovery and Energy Generation. Am. J. Environ. Sci. 2015, 11, 99–114. [Google Scholar] [CrossRef]


Disclaimer/Publisher’s Note: The statements, opinions and data contained in all publications are solely those of the individual author(s) and contributor(s) and not of MDPI and/or the editor(s). MDPI and/or the editor(s) disclaim responsibility for any injury to people or property resulting from any ideas, methods, instructions or products referred to in the content. |
© 2026 by the authors. Licensee MDPI, Basel, Switzerland. This article is an open access article distributed under the terms and conditions of the Creative Commons Attribution (CC BY) license.