Abstract
Poyang Lake, China’s largest freshwater lake, is an ecologically significant but increasingly vulnerable system threatened by eutrophication and harmful algal blooms driven by human activities. Phytoplankton organisms, as primary producers and sensitive bioindicators, provide critical insights into these ecological changes; however, comprehensive seasonal assessments remain scarce. This study examined intra-annual phytoplankton dynamics at 15 representative sites, with the objectives of quantifying seasonal and spatial variations in community composition, density, biomass, and diversity, and identifying key environmental drivers. Surface water samples were collected during four seasons. Phytoplankton were identified microscopically, and diversity was quantified using Shannon–Wiener, Pielou’s evenness, and Margalef’s richness indices. Concurrent measurements included water temperature (WT), dissolved oxygen (DO), nutrients (TN, TP, NO3−-N, NO2−-N, NH4+-N), chemical oxygen demand (COD), pH, and transparency. Pearson correlation and redundancy analysis (RDA) were applied to evaluate phytoplankton–environment relationships. A total of 118 phytoplankton species belonging to 7 phyla were identified. Chlorophyta, Cyanobacteria, and Bacillariophyta exhibited the highest species richness. The highest seasonal abundances were observed for Microcystis wesenbergii (0.998) in winter, Aulacoseira granulata var. angustissima (0.780) in spring, and Snowella lacustris (0.520) in autumn, indicating pronounced seasonal shifts in dominant taxa across Poyang Lake. Phytoplankton density and biomass peaked in summer, while diversity indices significantly declined with increasing WT. RDA revealed that WT, DO, TP, and transparency collectively explained 45.7% of the community variation, with DO emerging as the most influential factor. These findings demonstrate that physical drivers, particularly thermal conditions and oxygen availability, exert stronger influences on phytoplankton diversity than nutrients alone, challenging nutrient-centric paradigms. Management should integrate hydrological and oxygen regulation with nutrient control, while long-term monitoring, depth-stratified sampling, and trait-based approaches are recommended to improve predictive models under climate variability.
1. Introduction
Poyang Lake, the largest freshwater lake in China, is situated in the northern part of Jiangxi Province and plays a vital role in the regional hydrology and ecology of the Yangtze River Basin. Often regarded as Jiangxi’s “mother river,” it supports local livelihoods and economic development [1]. The lake drains approximately 9% of the Yangtze River watershed and contributes about 15.5% of its total discharge, serving as a critical flood buffer and water replenishment zone for the middle and lower reaches of the Yangtze River [2]. However, in recent years, the intensification of human activities including aquaculture, mining, industrialization, sand extraction, and urbanization within the lake’s basin has led to growing environmental pressures, resulting in localized eutrophication and deteriorating ecological conditions [3]. Elevated nutrient concentrations have stimulated phytoplankton proliferation, with cyanobacterial blooms reported in several areas of the lake [1,4].
Hydrologically, Poyang Lake is influenced by five major tributaries and its dynamic connection with the Yangtze River, leading to significant seasonal variations in water level, flow velocity, and nutrient fluxes [5]. These fluctuations affect sediment transport, nutrient cycling, and overall ecosystem functioning, underscoring the need for continuous water quality monitoring to mitigate anthropogenic impacts and preserve ecological integrity [6,7].
Phytoplankton organisms, as primary producers, are fundamental to aquatic ecosystems, driving biogeochemical cycles and serving as sensitive bioindicators of environmental change [8,9,10]. Their community structure and spatial distribution reflect changes in water quality and trophic status [11]. While traditional taxonomic methods have been widely used, functional group approaches based on morphological and physiological traits offer deeper insights into phytoplankton adaptive strategies under varying environmental conditions [12,13,14].
In Poyang Lake, phytoplankton assemblages display strong seasonal dynamics. Bacillariophyta (e.g., Aulacoseira spp.) tend to dominate during the high-water season, benefiting from turbulent mixing and cooler temperatures, whereas Cyanobacteria (e.g., Microcystis spp.) thrive in warm, stable conditions typical of the dry season [15,16]. Recent studies applying functional group analysis have further elucidated how these communities respond to nutrient loading, hydrological changes, and climate variability [17].
Building on the established foundation of limnological research in Poyang Lake, which has highlighted the significant impact of its hydrological connection to the Yangtze River on physicochemical conditions [5,18], this study presents a contemporary, high-resolution assessment of phytoplankton dynamics. Previous studies have identified key seasonal successions, revealing that diatoms (Bacillariophyta) dominate during cooler, high-water periods, while cyanobacteria flourish in warmer, low-water months [6,15]. These patterns are increasingly influenced by anthropogenic pressures from aquaculture and urbanization, which raise the risks of nutrient enrichment and eutrophication [3,4]. Recent advancements have utilized functional group classifications to enhance our understanding of phytoplankton-environment interactions [17].
In contrast to prior investigations, this research offers a comprehensive intra-annual analysis across all four seasons, incorporating detailed community metrics such as taxonomic composition, density, biomass, and diversity indices, alongside multivariate statistical techniques like RDA. The primary objective was to assess seasonal and spatial variations in the phytoplankton community and to quantify how environmental factors correlate with phytoplankton richness and composition. We hypothesized that (i) phytoplankton diversity and taxonomic dominance would show significant seasonal variations, (ii) a range of physical and chemical variables would collectively explain the patterns observed in surface phytoplankton assemblages, and (iii) the biological activity of the phytoplankton community would influence key water quality parameters, such as DO and COD, in surface waters. The findings challenge traditional nutrient-centric paradigms by demonstrating that physical and chemical conditions, particularly WT and DO, have a more substantial influence on phytoplankton diversity than nutrient concentrations alone. This offers new insights for predictive bloom management and ecosystem-based conservation strategies.
2. Materials and Methods
2.1. Description of the Study Area
Poyang Lake, situated in Jiangxi Province, China, is the nation’s largest freshwater lake and a key part of the downstream Yangtze River basin (28°22′–29°45′ N, 115°47′–116°45′ E; seen in Figure 1). The basin spans approximately 162,000 km2 and receives water from five major tributaries—the Gan, Fu, Xin, Xiu, and Rao Rivers—which collectively drive the lake’s significant hydrological dynamics. Water levels and nutrient flows vary greatly with the seasons: during the wet season (April–August), the lake expands to nearly 4000 km2, while in the dry season (November–February), its area shrinks to less than 10% of that size [18]. The hydrological balance is influenced by local rainfall, tributary inflows, and the backflow from the Yangtze River, resulting in annual water-level fluctuations of up to 10 m [18]. These fluctuations directly impact ecosystem processes, affecting habitat availability, nutrient cycling, and biological productivity. Additionally, rainfall patterns further influence hydrology and ecological conditions [19]. Poyang Lake supports rich biodiversity, providing crucial habitats for phytoplankton, fish, and migratory birds. Its dynamic hydrological regime creates a variety of ecological niches that are highly sensitive to seasonal changes and human disturbances [20].
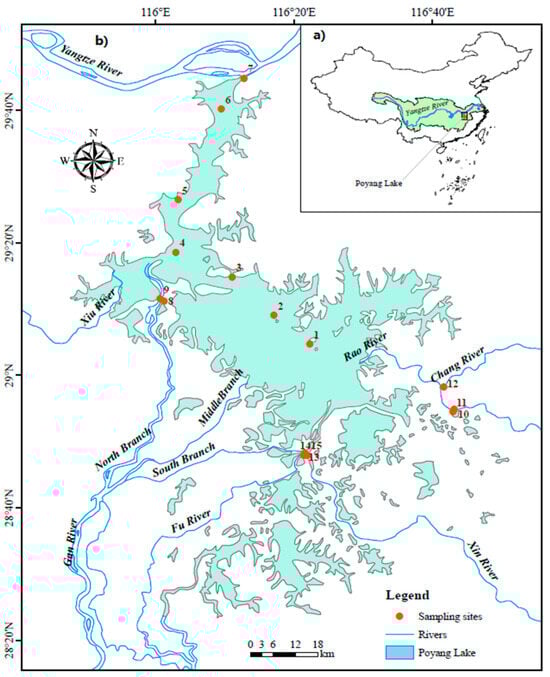
Figure 1.
Geographical location and sampling sites in Poyang Lake (a) Map of Poyang Lake and Surrounding Areas; (b) Sampling Locations in Poyang Lake.
2.2. Study Design and Sampling
This study was conducted across four distinct seasons (winter, spring, summer, and autumn) at 15 strategically selected sites in Poyang Lake (Figure 1). To capture the lake’s spatial heterogeneity, it was divided into three regions reflecting key hydrological and land-use gradients: the northern district (sites 1–5), the middle district (sites 6–11), and the southern district (sites 12–15). Site selection within each region was designed to represent: (i) major tributary inflow zones, (ii) mid-lake open-water zones, and (iii) nearshore areas influenced by anthropogenic activities such as aquaculture and sand extraction. To complement the seasonal field sampling, environmental data were compiled monthly from established routine monitoring records.
Phytoplankton samples were collected from the surface layer (0–0.5 m) between 09:00 and 12:00 using a 5 L Peterson water sampler. From each site, a 1 L water sample was transferred to a clean, pre-rinsed bottle and immediately preserved with Lugol’s iodine solution for subsequent laboratory analysis.
2.3. Sample Processing and Identification
In the laboratory, preserved samples were allowed to settle for 48 h, after which the supernatant was carefully siphoned off and the remaining volume adjusted to 30 mL. Phytoplankton were identified to the lowest possible taxonomic level (genus or species) using an Olympus IX73 inverted microscope (Olympus, Tokyo, Japan) at 400× magnification, following the taxonomic criteria of Hu [21]. Colonial taxa were counted as single colonies to reflect their natural occurrence in surface waters.
2.4. Enumeration and Biomass Estimation
Phytoplankton enumeration was conducted using a 1 mL Sedgwick–Rafter counting chamber (Wildco®, Yulee, FL USA). For accuracy, at least 20 cells per taxon were measured to estimate mean cell volume, approximated to the nearest geometric shape. Biovolume was then converted into biomass (mg/L) according to the method of Helbling [22].
2.5. Community Structure Indices
To describe phytoplankton community structure, four diversity indices were calculated: the dominance index, Shannon–Wiener diversity index, Pielou’s evenness, and Margalef’s richness, using standard ecological formulas. These metrics allowed consistent comparisons of phytoplankton composition and diversity across spatial and seasonal gradients in Poyang Lake.
where N = abundance (cells/L); C = number of cells counted in the chamber; At = Total area of the counting chamber (mm2); As = Area of the field actually counted (mm2); V = Volume of sample in the chamber (mL).
Biomass was estimated based on biovolume. For each species, the dimensions of at least 30 randomly selected cells were measured. Each taxon was classified according to the closest geometric shape spheres for coccoid algae, cylinders for diatoms, and prisms for filamentous taxa. Standard geometric formulas were applied to compute cell volumes. Biovolume (µm3) was then converted to biomass (mg/L) using a specific density of 1 g cm−3. This approach adheres to the standardized protocols for estimating phytoplankton biovolume and biomass outlined by Hillebrand [23].
To describe community structure, three diversity indices were utilized: the Shannon-Wiener diversity index [24], Pielou’s evenness index [25], and Margalef’s richness index [25]. The Shannon-Wiener index was calculated as follows:
where H is the Shannon-Wiener diversity index
ln is the natural log
Pi is the proportion of the entire community made up of species i
Pielou’s evenness index was computed as:
where H is the Shannon-Wiener diversity index
ln is the natural log
S is the total number of species
Margalef’s richness index was calculated as:
where R is the Margalef’s Richness index
S is the total number of species found
N is the total number of individuals in the sample
The dominant species of phytoplankton were identified by calculating the dominance index (Y) following Lampitt [26]:
where Ni represents the abundance of the ith species, N is the total abundance of all species, and f denotes the frequency of occurrence of the ith species. A species was considered dominant if Y > 0.02. At each sampling site, in situ measurements were taken for WT (°C), pH, transparency (m), and COD using a portable multiparameter probe (YSI Professional Plus) (Labshark Manufacturer: Changde Bikeman Biotechnology Co., Ltd., Changde, China). Additional water samples were transported to the Observation and Research Station for the Wetland and Ecosystem of Poyang Lake for nutrient analysis. Nutrient concentrations, including TN, TP, nitrate (NO3−-N), nitrite (NO2−-N), and ammonium (NH4+-N), were determined according to the Standard Methods for the Examination of Water and Wastewater [27], correcting the previous reference to Mgese [28].
2.6. Statistical Analysis
Phytoplankton data from four seasonal surveys and corresponding water quality records from Poyang Lake were organized and summarized by sampling site using Microsoft Excel (Office 365, v2108). Spatial analysis and mapping were performed with ArcGIS (version 10.8.1, Esri, Redlands, CA, USA). Statistical analyses were conducted using SPSS (version 24), where descriptive statistics (mean ± standard error) were calculated to assess spatial and seasonal variations across different stream sections. One-way ANOVA was used to evaluate temporal differences, with significance set at p ≤ 0.05.
Phytoplankton density, biomass, and diversity indices were analyzed in R, utilizing the vegan package for ecological visualizations and difference plots. Pearson correlation analysis was also carried out in R (version 4.4.3, Durham, NC, USA) to examine relationships among various water quality parameters. RDA was conducted using CANOCO version 5; [29,30]. Prior to multivariate analysis, species abundance and environmental variables were log-transformed using the formula log (X + 1).
3. Results
3.1. Seasonal Variations Physicochemical Parameters in Poyang Lake
Seasonal monitoring of physicochemical parameters in Poyang Lake revealed significant temporal variations essential for understanding phytoplankton dynamics and overall water quality. WT showed the most pronounced seasonal changes, ranging from a summer peak of 33.36 ± 0.20 °C to a winter low of 11.90 ± 0.27 °C, a pattern driven by increased solar irradiance and decreased cloud cover in summer. DO levels were notably higher in winter (9.95 ± 0.25 mg/L) compared to spring (8.12 ± 0.16 mg/L), summer (8.09 ± 0.18 mg/L), and autumn (8.00 ± 0.17 mg/L) (Table 1). This trend can be attributed to enhanced atmospheric diffusion, stronger wind-induced mixing, and higher flow velocities during the colder months. The lake water remained slightly alkaline, with pH values stable across seasons (7.16 ± 0.09 in summer to 7.59 ± 0.09 in autumn), indicating a strong buffering capacity. The slight increase in autumn pH is likely associated with heightened photosynthetic activity that reduces dissolved CO2 concentrations.

Table 1.
Seasonal variations in water quality parameters in Poyang Lake.
Nutrient concentrations exhibited complex dynamics: TN significantly decreased from 2.07 ± 0.06 mg/L in winter to 1.51 ± 0.06 mg/L in autumn, a trend mirrored by NO3−-N levels, which fell from 1.10 ± 0.04 mg/L in spring to 0.62 ± 0.06 mg/L in summer, reflecting substantial biological uptake by phytoplankton and other primary producers. In contrast, NH4+-N and NO2−-N concentrations peaked in summer (0.33 ± 0.02 mg/L and 0.18 ± 0.04 mg/L, respectively), suggesting increased mineralization of organic matter and potentially incomplete nitrification at higher temperatures. TP showed minimal variation, with a slight peak in summer (0.12 ± 0.01 mg/L). COD steadily declined from winter (3.90 ± 0.13 mg/L) to autumn (1.79 ± 0.08 mg/L), consistent with seasonal organic matter inputs followed by microbial decomposition, which intensifies in warmer periods. Transparency remained consistently low across all seasons (0.33–0.38 m), indicating persistently high suspended sediment loads, a defining characteristic of Poyang Lake.
3.2. Phytoplankton Composition and Community Structure of Poyang Lake
In Poyang Lake, a total of 118 phytoplankton species were identified across seven phyla, indicating a heterogeneous distribution. The phylum with the highest species richness was Chlorophyta, comprising 35 species, which accounted for 29% of the total diversity. Following closely was Cyanobacteria, with 33 species representing 28% of the total. Bacillariophyta contributed significantly with 28 species, making up 24% of the overall composition. Euglenophyta included 8 species, accounting for 7%, while Dinophyta had 7 species, representing 6%. Cryptophyta comprised 5 species, corresponding to 4%, and Chrysophyta included 2 species, contributing 2% to the total (see Figure 2). The high richness of Chlorophyta, Cyanobacteria, and Bacillariophyta reflects their broad ecological adaptability under the prevailing limnological conditions, while the prominence of Bacillariophyta, despite limited genera, indicates the competitive success of a few dominant taxa. Collectively, these patterns highlight the ecological dynamics and interspecific interactions shaping phytoplankton assemblages in Poyang Lake.
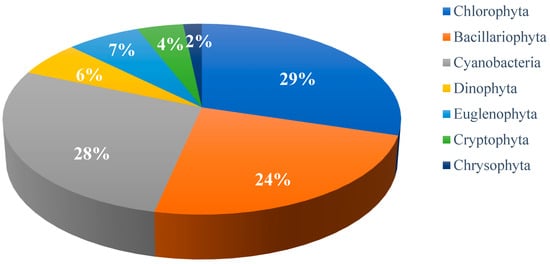
Figure 2.
Percentage composition of phytoplankton species in Poyang Lake.
3.3. Dominant Phytoplankton Species in Poyang Lake
In Poyang Lake, seventeen phytoplankton species with dominance values (Y) exceeding 0.02 were identified as dominant taxa across four sampling seasons, highlighting significant seasonal succession primarily within the Bacillariophyta and Cyanobacteria phyla. The number of dominant species varied by season: 9 in winter, 10 in spring, 8 in summer, and 13 in autumn, indicating a dynamic community structure.
Among Bacillariophyta, Aulacoseira granulata var. angustissima was consistently dominant, with high dominance values of 0.71 in winter, 0.78 in spring, and 0.43 in autumn. Other diatoms, such as Melosira varians and Ulnaria acus, exhibited clear seasonal peaks, with Ulnaria acus particularly dominant in autumn (Y = 0.36). The Cyanobacteria included key species with pronounced seasonal patterns; Microcystis wesenbergii dominated in winter (Y = 0.998) and summer (Y = 0.34), while Dolichospermum circinale as prevalent in both winter (Y = 0.388) and autumn (Y = 0.309). Snowella lacustris emerged as a dominant species in autumn (Y = 0.52), and Pseudanabaena limnetica was notably dominant in spring (Y = 0.52) (see Table 2).
Table 2.
Dominant species of phytoplankton in Poyang Lake in 2024.
Chlorophyta species demonstrated sporadic dominance, with Tetradesmus obliquus dominant in winter and summer, and Monactinus simplex dominant in winter and autumn. The Cryptophyta appeared in spring and autumn, with Teleaulax acuta achieving a high dominance value (Y = 0.36). The seasonal shift from cyanobacterial dominance in warmer months to a more mixed assemblage, including diatoms and cryptophytes in cooler periods, reflects ecological response to changing temperature and light conditions. The persistent dominance of certain species, particularly cyanobacteria, suggests stable niches and adaptations to the specific physicochemical conditions of Poyang Lake.
3.4. Phytoplankton Density and Biomass in Poyang Lake
Phytoplankton density and biomass in Poyang Lake exhibited discernible seasonal fluctuations. Density reached its peak during summer at 133.67 ± 45.53 × 10⁴ cells/L, followed closely by spring (128.81 ± 54.52 × 10⁴ cells/L) and winter (122.68 ± 85.00 × 10⁴ cells/L), with the lowest density recorded in autumn (103.34 ± 78.82 × 10⁴ cells/L). This pattern indicates a moderate level of seasonal variability, with the highest cell abundances coinciding with the warm, stable water conditions of summer that are conducive to phytoplankton growth and replication.
In contrast to density, phytoplankton biomass demonstrated a different seasonal pattern, with the highest value also occurring in summer (0.28 ± 0.21 mg/L) and the lowest in spring (0.23 ± 0.09 mg/L). Winter and autumn biomass values were intermediate at 0.27 ± 0.23 mg/L and 0.26 ± 0.17 mg/L, respectively (see Figure 3b). The notably higher standard deviations relative to mean values, particularly in winter and autumn, suggest substantial spatial patchiness in biomass distribution across the lake. The divergence between density and biomass trends, particularly the relatively stable biomass despite fluctuating cell counts, indicates seasonal shifts in community composition toward larger-celled or higher-biomass species during certain periods. This is consistent with the observed successional patterns where larger diatoms and colonial cyanobacteria, which contribute disproportionately to biomass, become dominant during winter and summer months.
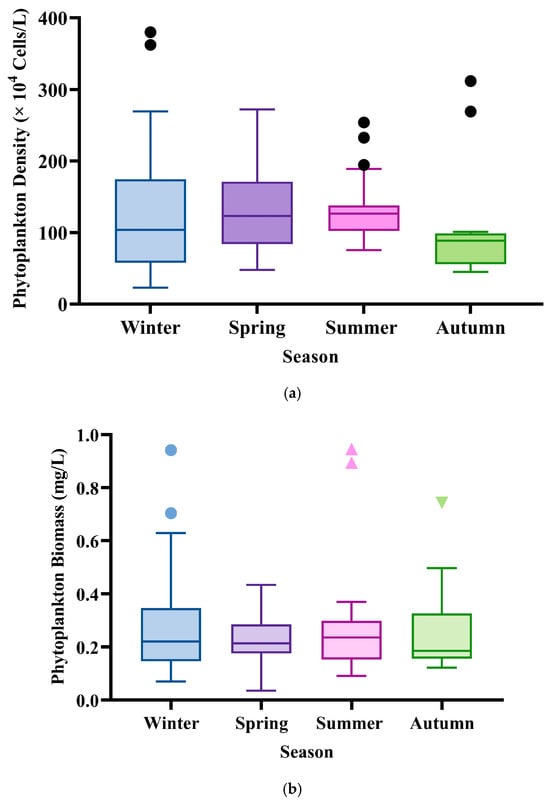
Figure 3.
(a) Seasonal changes in phytoplankton density (104 Cells/L); (b) Season variation in phytoplankton biomass (mg/L) in Poyang Lake. Note: The black dots typically represent individual data points that are considered outliers in phytoplankton density for each season, indicating values that fall outside the range defined by the boxplot boundaries, while the triangles typically denote key summary statistics or points of interest, such as the standard deviation (SD) representing the variability in phytoplankton biomass for the respective season.
3.5. Seasonal Variation in Phytoplankton Species Diversity Indices
The phytoplankton community structure in Poyang Lake, assessed through diversity indices, displayed both stability and seasonal variation. The Shannon-Wiener diversity index (H’) showed moderate seasonal fluctuations, with values ranging from a low of 2.05 ± 0.17 in autumn to a high of 2.21 ± 0.39 in summer, leading to an annual mean of 2.16 ± 0.04 as indicated in Table 3. This indicates a consistently moderate level of species diversity throughout the year, with a slight increase during the summer, which is characterized by peak thermal stratification and productivity.
Table 3.
Seasonal variation in phytoplankton diversity indices in Poyang Lake.
In contrast to the varying diversity, Pielou’s evenness index (J′) exhibited remarkable stability, maintaining a high annual average of 0.85 ± 0.05 with minimal seasonal variation ranging from 0.84 ± 0.05 in winter to 0.86 ± 0.07 in autumn. This consistently high evenness value suggests that despite changes in total abundance and composition, the distribution of individuals among species remained relatively equitable across all seasons, indicating that no single species dominated to the point of destabilizing the community structure.
Margalef’s richness index (R′) displayed the most significant seasonal dynamics, varying notably from 2.39 ± 0.24 in autumn to 3.94 ± 0.27 in winter. This pattern reflects a substantial decline in species richness from winter to autumn, likely due to seasonal succession processes where competitive exclusion limits the number of coexisting species during optimal growth conditions. Together, these metrics create a coherent ecological narrative: while species richness declines markedly from winter to autumn, the equitable distribution of individuals among the remaining species is preserved, resulting in only moderate changes to overall diversity (H′).
3.6. Relationship Between Water Quality Parameters and Phytoplankton Diversity Indices
Figure 4 presents six scatter plots that examine the relationships between TN and TP with phytoplankton diversity metrics: species richness (plots a and d), Pielou’s evenness (plots b and e), and the Shannon index (plots c and f). Each plot features a trend line representing the relationship between the variables, along with correlation coefficients (r) and p-values.
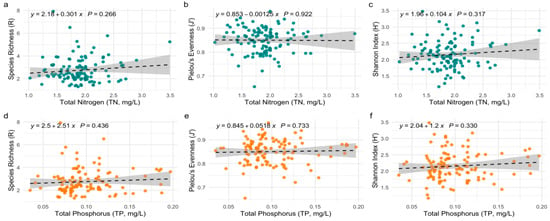
Figure 4.
Linear relationships between phytoplankton diversity indices and nutrient concentrations (TN and TP). Panels (a–c) show the regression of diversity indices against TN; panels (d–f) show the corresponding relationships with TP. Dashed lines indicate fitted linear models with 95% confidence intervals.
In the TN plots (a–c), species richness exhibited no significant relationship with TN (r = 0.301, p = 0.296), indicating that nitrogen concentration did not have a strong impact on the number of phytoplankton species. Similarly, both Pielou’s evenness (r = 0.853, p = 0.922) and the Shannon index (r = 1.96, p = 0.317) showed weak, non-significant correlations with TN.
In contrast, the TP plots (d, e, f) illustrate a different trend. Species richness shows a positive correlation with TP (r = 2.51, p = 0.436), Pielou’s evenness and the Shannon index also demonstrate weak positive correlations with TP (r = 0.846, p = 0.733; r = 2.20, p = 0.143, respectively), which are not statistically significant, suggesting that there is no relationship between nitrogen and phosphorus and the studied indicators of diversity, evenness, and richness.
3.6.1. Impact of Temperature on Phytoplankton Diversity Indices
Results in Figure 5 illustrate the relationship between temperature and phytoplankton diversity indices, including species richness, Pielou’s evenness, and the Shannon index. A clear negative correlation is observed between temperature and these diversity metrics across all subplots. In panel (a), species richness significantly declines with increasing temperature, as indicated by the regression equation y = 4.53 − 0.87x (p < 0.001). This suggests that rising WTs reduce the number of phytoplankton species, likely due to competitive exclusion or physiological stress on less thermotolerant taxa. In panel (b), Pielou’s evenness also decreases with increasing temperature, following the regression equation y = 0.984 − 0.00197x (p = 0.008). This pattern indicates that elevated temperatures favor certain dominant species, resulting in reduced evenness in community composition. In panel (c), the Shannon index, which combines both species richness and evenness, shows a similarly negative relationship with temperature (y = 2.89 − 0.0292x, p < 0.001). This decline underscores that higher temperatures adversely affect overall community diversity, promoting structural shifts toward dominance by a few tolerant taxa.
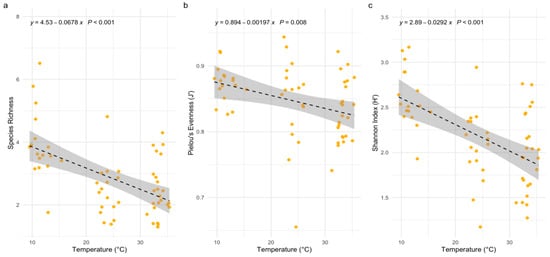
Figure 5.
The relationships between WT and phytoplankton diversity indices (a) Relationship Between Temperature and Species Richness (b) Influence of Temperature on Pielou’s Evenness (c) Effect of Temperature on Shannon Index. Note: The dashed line represents the fitted regression line indicating the relationship between temperature and species richness. The gray shaded area around the line indicates the 95% confidence interval for the predicted values.
3.6.2. Relative Contributions of Environmental Variables to Phytoplankton Diversity
Figure 6 illustrates the relative contributions of various environmental variables to three metrics of phytoplankton diversity: species richness (panel a), the Shannon index (panel b), and Pielou’s evenness (panel c).
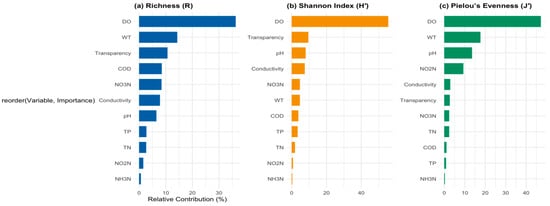
Figure 6.
Relative contributions of environmental variables to phytoplankton diversity indices (a) Relative Contributions to Species Richness (R); (b) Relative Contributions to Shannon Index (H’); (c) Relative Contributions to Pielou’s Evenness (J).
In panel (a), DO is identified as the most influential factor affecting species richness, accounting for a significant portion of the variation. This emphasizes the vital role of oxygen availability in supporting diverse phytoplankton communities. High levels of DO are typically linked to improved conditions for phytoplankton growth and survival, underscoring the importance of maintaining oxygen-rich environments in aquatic ecosystems. Following DO, WT is the second most significant factor, indicating that temperature fluctuations can also notably impact species diversity. The contributions of transparency, pH, and other variables such as TN and TP are comparatively lower, suggesting that while they contribute to species richness, they are less critical than DO and temperature.
In panel (b), the Shannon index, which considers both richness and evenness, similarly identifies DO as the primary contributor to observed variation. This reinforces the notion that oxygen levels significantly affect not only the number of species present but also the evenness of species distribution within the community. The influence of temperature remains significant, highlighting its dual role in affecting both richness and evenness of phytoplankton assemblages.
Panel (c) presents Pielou’s evenness, where DO again emerges as the most significant variable, followed by WT. This consistent pattern across all three metrics underscores the necessity of maintaining adequate DO levels to preserve both the diversity and ecological balance of phytoplankton communities.
3.6.3. RDA of Phytoplankton and Environmental Parameters
The RDA revealed a significant relationship between phytoplankton community structure and environmental variables, accounting for 45.7% of the total variation in the dataset, with an adjusted variation of 3.5%. The first two RDA axes explained 30.97% of the variation, identifying WT, TP, chlorophyll-a (Chl-a), transparency, DO, pH, and TN as the most influential factors.
The RDA biplot (see Figure 7) visually represents these relationships, where the lengths and orientations of the arrows indicate the relative contributions of each environmental variable. Nutrient levels (TN, TP) and Chl-a exhibited strong positive correlations, highlighting their role in driving phytoplankton biomass. Higher concentrations of DO were linked to increased phytoplankton viability and diversity, while nutrient enrichment, although promoting productivity, also raised the risk of harmful algal blooms. Furthermore, WT and transparency emerged as key drivers influencing phytoplankton dynamics. Collectively, the spatial arrangement of the vectors underscores the significance of nutrient availability and oxygen conditions in shaping community structure.
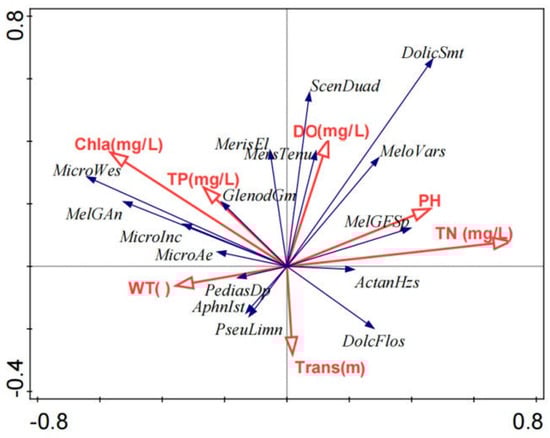
Figure 7.
RDA biplot showing relationships between phytoplankton community and environmental variables in Poyang Lake.
3.6.4. Correlation Analysis of Environmental in Poyang Lake
Figure 8 presents a correlation matrix that illustrates the relationships among various ecological parameters in Poyang Lake, including nitrogen species (NO2−-N, NH4+-N), TN, TP, COD, transparency, pH, DO, and WT. The correlation values range from −1 to 1, where 1 indicates a perfect positive correlation and −1 indicates a perfect negative correlation. WT shows a strong positive correlation with DO (r = 0.80), suggesting that as WT increases, DO levels also tend to rise. Conversely, WT has a negative correlation with NH4+-N (r = −0.72) and NO2-N (r = −0.99), implying that higher temperatures may lead to reduced concentrations of NH4+-N and NO2−-N. DO exhibits a strong positive correlation with transparency (r = 0.68) and a negative correlation with NO2-N (r = −0.90). This indicates that higher oxygen levels are associated with clearer water and lower NO2−-N concentrations. COD negatively correlates with transparency (r = −0.60) and TN (r = −0.63), suggesting that increased organic matter and nutrient levels may contribute to higher turbidity. Additionally, TP shows a moderate negative correlation with NO3-N (r = −0.32) and NH4+-N (r = −0.56), indicating that higher phosphorus levels may be linked to lower NO3−-N and NH4+-N concentrations.
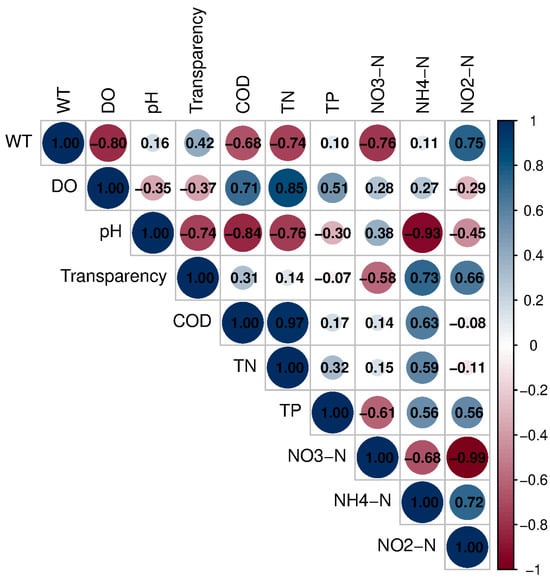
Figure 8.
Correlation relationships among key environmental parameters in Poyang Lake based on Pearson correlation analysis.
4. Discussions
The phytoplankton community in Poyang Lake exhibits a pronounced seasonal succession shaped by hydrological variability, nutrient dynamics, and thermal conditions. A total of 118 species across 7 phyla were identified, with Chlorophyta, Cyanobacteria, and Bacillariophyta showing the highest richness, a pattern consistent with other large, river-connected lakes [6,11]. Seasonal succession was marked by cyanobacterial dominance, particularly Microcystis sp. during warm, stratified periods, reflecting global patterns linking blooms to eutrophication and rising temperatures [8,31]. Biomass and density peaked in summer, while species richness declined in autumn, indicating a seasonal ecological bottleneck. Multivariate analyses identified WT, DO, TN, TP, transparency, and Chl-a as key drivers, explaining 45.7% of the variance. The negative relationship between diversity and increasing temperature supports broader observations of climate-driven biodiversity loss in Chinese aquatic ecosystems [32].
Despite moderate nutrient levels, persistent cyanobacterial dominance suggests localized eutrophication and stratification hotspots, likely intensified by sand mining, aquaculture, and hydrological modifications [2,4]. Although community evenness remained high (J′ ≈ 0.85), the autumn decline in richness highlights potential risks to ecological resilience, similar to trends observed in other subtropical lakes [33]. DO emerged as particularly influential, consistent with its dual role as a product of photosynthesis and regulator of metabolism. Variance partitioning confirmed DO as a central factor shaping seasonal phytoplankton patterns.
These biological patterns coincided with seasonal water quality changes. WT displayed the largest seasonal fluctuation, while COD decreased in winter and autumn, likely reflecting reduced microbial activity [34,35]. Nutrient levels declined in summer and autumn due to intense biological uptake during peak productivity [36]. Minimal variation in pH and transparency reflected the lake’s buffering capacity and suspended sediment load [37]. Correlation analyses showed strong WT–DO coupling (r = 0.80), balancing oxygen solubility with photosynthetic production [38,39]. WT was negatively correlated with NH4+-N and NO2−-N, suggesting enhanced microbial uptake at higher temperatures [40,41,42]. DO correlated positively with transparency and negatively with NO2−-N, indicating that oxygen-rich waters reduce nitrite accumulation [43,44]. COD correlated negatively with transparency and TN, linking elevated organic matter and nutrient loads to turbidity and organic pollution [44,45]. Collectively, RDA confirmed that both physical and nutrient-related parameters strongly influence phytoplankton dynamics [46].
The hydrological connectivity between Poyang Lake and the Yangtze River, including sluice gate operation, also plays a crucial role in regulating phytoplankton communities. Previous studies highlight that fluctuations in water level and backflow shape sediment transport, nutrient fluxes, and biological productivity [5,18]. Although high-resolution hydrological data on sluice operations were unavailable, our results reflect the integrated environmental conditions during sampling. Seasonal shifts in nutrient concentrations and the alternation between diatom and cyanobacterial dominance are consistent with hydrological controls reported previously [6,15]. We therefore acknowledge that sluice gate regulation may indirectly influence phytoplankton through changes in water levels and nutrient exchanges, and we recommend future integration of hydrodynamic modeling with ecological monitoring to explicitly assess these effects.
While this study provides a valuable baseline, several limitations remain. The one-year duration cannot capture interannual variability driven by extreme climate events. Reliance on morphological identification may underestimate cryptic diversity, as molecular approaches such as 18S/16S metabarcoding were not applied [12,14]. The analysis also neglects vertical gradients, which can decouple surface and deeper communities. Thus, future research should prioritize multi-year monitoring, depth-discrete sampling, trait-based and molecular approaches, and coupled hydrodynamic–biogeochemical modeling. Such efforts would refine understanding of hydrological regulation, climate impacts, and cascading effects of phytoplankton shifts on higher trophic levels, thereby supporting more effective ecosystem-based management.
5. Conclusions
This study offers a thorough assessment of seasonal phytoplankton dynamics in Poyang Lake, emphasizing the interactions among hydrological variability, nutrient availability, and physicochemical factors. We identified a total of 118 phytoplankton species across 7 phyla, with Chlorophyta, Cyanobacteria, and Bacillariophyta, showing the greatest species richness. Cyanobacteria demonstrated significant seasonal dominance, with specific species blooming in both cooler winter and warmer summer conditions. This seasonal variation contributed significantly to the total phytoplankton density and biomass, which peaked in summer. Additionally, species richness and diversity were highest during the summer and decreased as autumn approached, illustrating a clear seasonal succession in community structure within Poyang Lake.
Multivariate analyses indicated that WT and DO were the primary drivers of community structure, outweighing the influence of nutrients (TN, and TP). Although nutrient enrichment boosted productivity, it also heightened the risk of cyanobacterial dominance and harmful algal blooms. RDA showed that WT, DO, Chl-a, transparency, and nutrients together accounted for nearly half of the observed variation. The decline in diversity with increasing temperatures highlights the vulnerability of subtropical lakes to climate warming and oxygen depletion.
These findings challenge the traditional nutrient-centric perspective, revealing that physical factors significantly influence phytoplankton dynamics. Effective management strategies should integrate nutrient reduction with oxygen regulation and the maintenance of natural hydrological regimes. We recommend long-term monitoring, molecular and functional approaches, and hydrodynamic–biogeochemical models to enhance predictive capacity and support ecosystem-based management.
Author Contributions
G.S.: Writing (original draft), visualization, software development, methodology, investigation, formal analysis, data curation, conceptualization. L.G.: Data collection, methodology, investigation, formal analysis and data curation. S.L.S. and A.M.K.: Writing—review and editing. H.L.: Visualization and data curation. L.X.: Investigation, conceptualization, writing (review and editing), validation, funding acquisition, project administration, resource management, and supervision. All authors have read and agreed to the published version of the manuscript.
Funding
This research was funded by National Key R&D Program of China (2021YFD1700600, 2024YFE0106400, 2023YFF0807204); National Natural Science Foundation of China (U2240224 U2444221); Jiangxi Provincial Science and Technology Planning Project (20223AEI91008, 20244BCF61001, 20252BAC230006, 20243BBH81035; S20257056), and Science and Technology Plan Project of Jilin Province (2025SYHZ0021). Gnoumasse Sidibe expresses her sincere gratitude to the ANSO Scholarship for supporting her doctoral studies.
Institutional Review Board Statement
Not applicable.
Informed Consent Statement
Not applicable.
Data Availability Statement
The data used in this manuscript are available upon request from the corresponding author. The datasets generated and analyzed during the study on Seasonal dynamics of phytoplankton communities in relation to water quality in Poyang Lake, China: A Comprehensive Assessment are not publicly available due to privacy concerns, ethical restrictions, and institutional policies. For additional information or request access to the datasets, please contact the corresponding author at [lgxu@niglas.ac.cn; assysidibe3@gmail.com].
Acknowledgments
We extend our gratitude to He Liu from the Poyang Laboratory for Wetland Ecosystem Research, Chinese Academy of Sciences, for his assistance with the laboratory measurements of water chemistry indices.
Conflicts of Interest
Author Liang Gan was employed by the company Jiangxi Province Poyang Lake Water Conservancy Hub Construction Office, Nanchang 330009, China. The remaining authors declare that the research was conducted in the absence of any commercial or financial relationships that could be construed as a potential conflict of interest.
References
- Wang, X.; Liu, Z.; Xu, Y.J.; Mao, B.; Jia, S.; Wang, C.; Lv, Q. Revealing nitrate sources seasonal difference between groundwater and surface water in China’s largest fresh water lake (Poyang Lake): Insights from sources proportion, dynamic evolution and driving forces. Sci. Total Environ. 2025, 958, 178134. [Google Scholar] [CrossRef]
- Zhang, C.; Su, G.; Li, X. Changes in nutrient concentrations and limitations of Poyang Lake associated with socioeconomic development in the watershed from 1978 to 2021. Water 2023, 15, 3304. [Google Scholar] [CrossRef]
- Dai, G.; Peng, N.; Zhong, J.; Yang, P.; Zou, B.; Chen, H.; Zhang, W. Effect of metals on microcystin abundance and environmental fate. Environ. Pollut. 2017, 226, 154–162. [Google Scholar] [CrossRef]
- Wu, Z.; He, H.; Cai, Y.; Zhang, L.; Chen, Y. Spatial distribution of chlorophyll a and its relationship with the environment during summer in Lake Poyang: A Yangtze-connected lake. Hydrobiologia 2014, 732, 61–70. [Google Scholar] [CrossRef]
- Guo, H.; Hu, Q.; Zhang, Q.; Feng, S. Effects of the three gorges dam on Yangtze river flow and river interaction with Poyang Lake, China: 2003–2008. J. Hydrol. 2012, 416, 19–27. [Google Scholar] [CrossRef]
- Wu, Z.; Cai, Y.; Liu, X.; Xu, C.P.; Chen, Y.; Zhang, L. Temporal and spatial variability of phytoplankton in Lake Poyang: The largest freshwater lake in China. J. Great Lakes Res. 2013, 39, 476–483. [Google Scholar] [CrossRef]
- Feng, L.; Wang, Y.; Hou, X.; Qin, B.; Kutser, T.; Qu, F.; Zheng, C. Harmful algal blooms in inland waters. Nat. Rev. Earth Environ. 2024, 5, 631–644. [Google Scholar] [CrossRef] [PubMed]
- Ho, J.C.; Michalak, A.M.; Pahlevan, N. Widespread global increase in intense lake phytoplankton blooms since the 1980s. Nature 2019, 574, 667–670. [Google Scholar] [CrossRef] [PubMed]
- Li, C.; Feng, W.; Chen, H.; Li, X.; Song, F.; Guo, W.; Sun, F. Temporal variation in zooplankton and phytoplankton community species composition and the affecting factors in Lake Taihu—A large freshwater lake in China. Environ. Pollut. 2019, 245, 1050–1057. [Google Scholar] [CrossRef]
- Peng, X.; Zhang, L.; Li, Y.; Lin, Q.; He, C.; Huang, S.; Wu, Z. The changing characteristics of phytoplankton community and biomass in subtropical shallow lakes: Coupling effects of land use patterns and lake morphology. Water Res. 2021, 200, 117235. [Google Scholar] [CrossRef]
- Yan, G.; Yin, X.; Huang, M.; Wang, X.; Huang, D.; Li, D. Dynamics of phytoplankton functional groups in river-connected lakes and the major influencing factors: A case study of Dongting Lake, China. Ecol. Indic. 2023, 149, 110177. [Google Scholar] [CrossRef]
- Reynolds, C.S.; Huszar, V.; Kruk, C.; Naselli-Flores, L.; Melo, S. Towards a functional classification of the freshwater phytoplankton. J. Plankton Res. 2002, 24, 417–428. [Google Scholar] [CrossRef]
- Reynolds, C.S. The Ecology of Phytoplankton; Cambridge University Press: Cambridge, UK, 2006. [Google Scholar]
- Kruk, C.; Martínez, A.; de la Escalera, G.M.; Trinchin, R.; Manta, G.; Segura, A.M.; Calliari, D. Rapid freshwater discharge on the coastal ocean as a mean of long distance spreading of an unprecedented toxic cyanobacteria bloom. Sci. Total Environ. 2021, 754, 142362. [Google Scholar] [CrossRef]
- Liu, X.; Teubner, K.; Chen, Y. Water quality characteristics of Poyang Lake, China, in response to changes in the water level. Hydrol. Res. 2016, 47 (Suppl. S1), 238–248. [Google Scholar] [CrossRef]
- Wang, B.; Luo, L.; Mei, L.; Zeng, H. Temporal and spatial distribution of Phytoplankton and role of environment factors in the Shending River backwater in the Danjiangkou reservoir area. Water 2024, 16, 326. [Google Scholar] [CrossRef]
- Liu, J.; Zou, H.; Deng, F.; Liu, Y.; Li, W.; Xu, J.; Chen, Y. Phytoplankton functional groups in Poyang Lake: Succession and driving factors. J. Oceanol. Limnol. 2024, 42, 1764–1776. [Google Scholar] [CrossRef]
- Shankman, D.; Keim, B.D.; Song, J. Flood frequency in China’s Poyang Lake region: Trends and teleconnections. Int. J. Climatol. 2006, 26, 1255–1266. [Google Scholar] [CrossRef]
- Wang, W.; Vinocur, B.; Shoseyov, O.; Altman, A. Role of plant heat-shock proteins and molecular chaperones in the abiotic stress response. Trends Plant Sci. 2004, 9, 244–252. [Google Scholar] [CrossRef] [PubMed]
- Zhao, Z.Q.; Zheng, P.; Xu, S.T.; Wu, X. Object detection with deep learning: A review. IEEE Trans. Neural Netw. Learn. Syst. 2019, 30, 3212–3232. [Google Scholar] [CrossRef] [PubMed]
- Hu, S.M. Effects of ambients on oxygen precipitation in silicon. Appl. Phys. Lett. 1980, 36, 561–564. [Google Scholar] [CrossRef]
- Helbling, E.W.; Villafane, V.; Ferrario, M.; Hansen, O.H. Impact of natural ultraviolet radiation on rates of photosynthesis and on specific marine phytoplankton species. Mar. Ecol. Prog. Ser. 1992, 80, 89–100. [Google Scholar] [CrossRef]
- Hillebrand, H.; Dürselen, C.-D.; Kirschtel, D.; Pollingher, U.; Zohary, T. Biovolume calculation for pelagic and benthic microalgae. J. Phycol. 1999, 35, 403–424. [Google Scholar] [CrossRef]
- Shannon, C.E. A mathematical theory of communication. Bell Syst. Tech. J. 1948, 27, 379–423. [Google Scholar] [CrossRef]
- Pielou, E.C. The measurement of diversity in different types of biological collections. J. Theor. Biol. 1966, 13, 131–144. [Google Scholar] [CrossRef]
- Lampitt, R.S.; Wishner, K.F.; Turley, C.M.; Angel, M.V. Marine snow studies in the Northeast Atlantic Ocean: Distribution, composition and role as a food source for migrating plankton. Mar. Biol. 1993, 116, 689–702. [Google Scholar] [CrossRef]
- Public Health Association. Standard Methods for the Examination of Water and Wastewater, 23rd ed.; American Public Health Association: Washington, DC, USA; American Water Works Association Water Environment Federation: Denver, CO, USA, 2017. [Google Scholar]
- Mgese, S. The Performance of a Field Scale Biofiltration Cells in Reducing Nutrient Rich Surface Runoff from an Informal Settlement in South Africa. Master’s Thesis, University of Cape Town, Cape Town, South Africa, 2024. Available online: http://hdl.handle.net/11427/40399 (accessed on 20 July 2025).
- Šmilauer, P.; Lepš, J. Multivariate Analysis of Ecological Data Using CANOCO 5; Cambridge University Press: Cambridge, UK, 2014. [Google Scholar]
- ter Braak, C.J.; Peres-Neto, P.R.; Dray, S. Simple parametric tests for trait–environment association. J. Veg. Sci. 2018, 29, 801–811. [Google Scholar] [CrossRef]
- Paerl, H.W. Climate change, phytoplankton, and HABs. In Climate Change and Estuaries; CRC Press: Boca Raton, FL, USA, 2023; pp. 315–334. [Google Scholar]
- Wu, Y.; Feng, L.; Liu, X.; Wang, Y.; Zheng, C. Declining Phytoplankton Biomass in Chinese Coastal Oceans Linked to Climate Warming. Environ. Sci. Technol. 2025, 59, 11607–11615. [Google Scholar] [CrossRef]
- Zhang, L.; Xiong, A.; Li, C.; Liu, X.; Zhang, X.; Gong, S.; Jin, L.N. Ecological pattern of microalgal communities and associated risks in coastal ecosystems. ISME Commun. 2025, 5, ycaf109. [Google Scholar] [CrossRef]
- Jia, J.; Chen, Q.; Ren, H.; Lu, R.; He, H.; Gu, P. Phytoplankton composition and their related factors in five Different Lakes in China: Implications for Lake management. Int. J. Environ. Res. Public Health 2022, 19, 3135. [Google Scholar] [CrossRef]
- Zeng, Y.; Chang, F.; Wen, X.; Duan, L.; Zhang, Y.; Liu, Q.; Zhang, H. Seasonal variation in the water quality and eutrophication of Lake Xingyun in Southwestern China. Water 2022, 14, 3677. [Google Scholar] [CrossRef]
- Ögrü, E.; Uzundumlu, S.; Fakıoğlu, Ö. The Effects of Water Quality Parameters on Summer Dynamics of Phytoplankton and Zooplankton in the Tributaries of Murat River (Hınıs, Erzurum). J. Agric. Prod. 2025, 6, 41–52. [Google Scholar] [CrossRef]
- Haddout, S.; Priya, K.L.; Hoguane, A.M.; Casila, J.C.C.; Ljubenkov, I. Relationship of salinity, temperature, pH, and transparency to dissolved oxygen in the Bouregreg estuary (Morocco): First results. Water Pract. Technol. 2022, 17, 2654–2663. [Google Scholar] [CrossRef]
- Andersen, M.R.; Kragh, T.; Sand-Jensen, K. Extreme diel dissolved oxygen and carbon cycles in shallow vegetated lakes. Proc. R. Soc. B Biol. Sci. 2017, 284, 20171427. [Google Scholar] [CrossRef]
- Chapra, S.C.; Camacho, L.A.; McBride, G.B. Impact of global warming on dissolved oxygen and BOD assimilative capacity of the world’s rivers: Modeling analysis. Water 2021, 13, 2408. [Google Scholar] [CrossRef]
- Bista, D.; Heckathorn, S.A.; Bridgeman, T.; Chaffin, J.D.; Mishra, S. Interactive effects of temperature, nitrogen, and zooplankton on growth and protein and carbohydrate content of cyanobacteria from Western Lake Erie. J. Water Resour. Prot. 2014, 6, 1139–1153. [Google Scholar] [CrossRef][Green Version]
- Jargal, N.; Atique, U.; Mamun, M.; An, K.G. Seasonal and long-term connections between trophic status, sestonic chlorophyll, nutrients, organic matter, and monsoon rainfall in a multipurpose reservoir. Water 2021, 13, 1720. [Google Scholar] [CrossRef]
- Karwautz, C.; Zhou, Y.; Kerros, M.-E.; Weinbauer, M.G.; Griebler, C. Bottom-Up Control of the Groundwater Microbial Food-Web in an Alpine Aquifer. Front. Ecol. Evol. 2022, 10, 854228. [Google Scholar] [CrossRef]
- Choudhary, R.; Kumar, A.; Priyadharsini, C.; Naik, M.M.; Choudhury, M.; Khan, N.A. Predicting water quality index using stacked ensemble regression and SHAP based explainable artificial intelligence. Sci. Rep. 2025, 15, 31139. [Google Scholar] [CrossRef]
- Sumana, S.L.; Tarawallie, S.; Osei, S.A.; Kamara, A.M.; Xiaofei, Y.; Mansaray, A.; Zhang, J. Chemical Interactions Between Filter-Feeding Mussels and U. prolifera: The Role of Dissolved Organic Matter and Secondary Metabolites in Growth Promotion and Competition Inhibition of Algal Species. Mar. Environ. Res. 2025, 212, 107529. [Google Scholar] [CrossRef] [PubMed]
- Huser, B.J.; Egemose, S.; Harper, H.; Hupfer, M.; Jensen, H.; Pilgrim, K.M.; Futter, M. Longevity and effectiveness of aluminum addition to reduce sediment phosphorus release and restore lake water quality. Water Res. 2016, 97, 122–132. [Google Scholar] [CrossRef] [PubMed]
- Gong, D.; Guo, Z.; Wei, W.; Bi, J.; Wang, Z.; Ji, X. Phytoplankton community structure and its relationship with environmental factors in Nanhai Lake. Diversity 2022, 14, 927. [Google Scholar] [CrossRef]


Disclaimer/Publisher’s Note: The statements, opinions and data contained in all publications are solely those of the individual author(s) and contributor(s) and not of MDPI and/or the editor(s). MDPI and/or the editor(s) disclaim responsibility for any injury to people or property resulting from any ideas, methods, instructions or products referred to in the content. |
© 2025 by the authors. Licensee MDPI, Basel, Switzerland. This article is an open access article distributed under the terms and conditions of the Creative Commons Attribution (CC BY) license (https://creativecommons.org/licenses/by/4.0/).