Article

Plastics at an Offshore Fish Farm on the South Coast of Madeira Island (Portugal): A Preliminary Evaluation of Their Origin, Type, and Impact on Farmed Fish

1
MARE—Marine and Environmental Sciences Centre, ARNET—Aquatic Research Network, ESTM, Polytechnic Institute of Leiria, 2520-641 Peniche, Portugal
2
MARE—Marine and Environmental Sciences Centre, ARNET—Aquatic Research Network, Regional Agency for the Development of Research, Technology and Innovation (ARDITI), 9020-105 Funchal, Portugal
3
Faculty of Life Sciences, University of Madeira, 9020-105 Funchal, Portugal
*
Author to whom correspondence should be addressed.
Environments 2024, 11(9), 202; https://doi.org/10.3390/environments11090202
Submission received: 19 June 2024 / Revised: 23 August 2024 / Accepted: 7 September 2024 / Published: 14 September 2024
(This article belongs to the Special Issue Plastics Pollution in Aquatic Environments)

Abstract

:
Plastic pollution is a global problem affecting all ecosystems, and it represents most of the marine litter. Offshore aquaculture is a sector particularly vulnerable to this issue. To investigate this concern, the present study employed videography to monitor macroplastics at an offshore fish farm on Madeira Island (Portugal) and analysis of fish gut content to evaluate macroplastic ingestion by farmed sea bream Sparus aurata. Our analysis revealed that the majority of identified plastic debris originated from domestic use (66.66%) and fisheries/aquaculture activities (24.99%). While the number of dead fish suitable for sampling was limited (1.05% of the total mortality), macroplastic debris ingestion was identified in 5.15% of the total mortalities and reported for the first time in species in offshore farming conditions. Fish ingested fragmented plastic sheets, with the amount positively correlated with fish weight (r = 0.621, p = 0.031, n = 12). Notably, the stretched length of these fragments exceeded 50% of the standard length of most fish. Inconsistencies were observed in the number of samples collected per cage and per week. To ensure robust results, these discrepancies should be rectified in future studies. Additionally, extending the sampling period to encompass all seasons would be beneficial for a more comprehensive understanding of seasonal variations in plastic occurrence.

1. Introduction

Marine litter is a worldwide problem, recognized as an environmental issue included in international directives to preserve and maintain the Good Environmental Status [1]. Plastics are synthetic organic polymers that exist a little over a century and, because these materials are relatively inexpensive to produce and very versatile, they represent about 60 to 80% of all marine litter [2]. About 10% of the annual production of plastics ends up in the ocean, where degradation of these objects can take several hundreds of years [3]. Land based sources account for up to 80% of marine debris which is transported to oceans via sewage/drainage systems, rivers, wind, or human neglect [4,5]. The remaining plastics are derived from ocean/waterway sources such as cruise ships, recreational boaters, and commercial fishing vessels, which dump debris directly into the water [6,7].
The dispersal, behavior, and degradation of plastic in the marine environment are influenced by both the inherent characteristics of the plastic item itself (e.g., density) and the environmental conditions it encounters. However, upon entering the vast marine environment, the inherent durability of plastic allows for its persistence over extended periods, making plastic debris removal from the environment a significant challenge [8,9]. The most recognized impacts of plastic debris are related to the loss of esthetic perception and environmental value, economic repercussions in tourism and many ocean-related industries (e.g., fisheries, aquaculture, energy production), and biological concerns related to the entanglement and death of marine birds, mammals, fish, and reptiles [10,11,12,13]. Several studies have documented the ingestion of plastics by marine wild species, such as turtles [14], seabirds [15], cetaceans [16], and fish [17,18].
Various size ranges and types of plastic have been detected in fish farm facilities and aquafeed [19,20]. Offshore fish farms, in addition to being subjected to plastic debris transported by ocean currents, can also be a source of litter harmful not only to the surrounding ecosystem but to its own stock, due to the plastic nature of the several materials that constitute the cages (High Density Polyethylene, HDPE), nets (nylon and HDPE), buoys (HDPE shell, Expanded Polystyrene interior), and feed plastic bags [21,22]. Solar exposure and other climacteric phenomenon, such as wave action, can lead to degradation of fish-farm infrastructure, resulting in fragments easily ingested by the biota [23].
Regarding the farmed fish, the ingestion of plastic can not only cause the immediate death of individuals due to damage and blocking of the gastrointestinal tract, but also the reduction of food intake [24]. When we focus on the impact of microplastics on cultured fish species, it can have other consequences, such as impaired growth and physiological harms to fish (oxidative stress, neurotoxicity, reproductive toxicity, immunotoxicity, embryotoxicity, and histopathology) caused by the release of harmful additives and adsorbed pollutants [25], ultimately resulting in biomass and revenue losses to the fish farmers.
Despite recent works on plastics monitoring on the seabed under fish farms [26,27] and water surface of enclosed bays [28], the literature is still scarce on the nature, size, and seasonal trends of plastics in the water column in fish farms at open sea locations. Without accurate data, it is difficult to manage this issue and develop policies to reduce marine litter.
This study conducted a preliminary assessment of the impact of plastic debris on a fish farm located at an open ocean site on Madeira Island (Portugal), in the northeastern Atlantic Ocean. The objectives of the study were: (1) to evaluate the presence, characteristics, and trends of plastic debris at the fish farm, particularly macroplastics (plastic items over 5 mm in size); (2) to perform gastrointestinal tract analyses of farmed sea bream to investigate the presence and potential ingestion of macroplastics by farmed fish.

2. Materials and Methods

2.1. Sampling Site and Period

The present study was conducted at the Marismar fish farm (Figure 1), located approximately 800 m off the coast of Arco da Calheta (32°42′18.0″ N 17°09′43.2″ W). The coastal area is delimited by a stream at 1.2 km west of the site (Ribeira de Atouguia) and another stream 1.5 km east of the site (Ribeira da Madalena). The farm consists of ten cages arranged in two parallel lines relative to the coastline. The average seafloor depth beneath the cages is 40 m. These cages vary in diameter, with four measuring 12.7 m and six measuring 25.5 m. The monitored farming nets were 10 m deep.

2.2. Monitoring Plastic in Fish Farm Cages: Videography

Visual observation remains the dominant method for monitoring floating marine litter due to its widespread application and established standardization protocols across various regions [1]. A closely related approach utilizes digital camera systems for image acquisition and subsequent analysis via image recognition techniques. This method presents a more practical and cost-effective alternative to traditional diving surveys for monitoring purposes [29,30]. For our study, we adapted methods employing a digital video camera to detect marine litter along transects on the seabed [31]. We utilized a GoPro Hero 7 digital action camera, GoPro Inc., San Mateo, CA, USA (1080 Super View, 60/50 fps, 1920 × 1080, 16:9) mounted on an aluminum telescopic pole (extensible up to 5 m). This setup allowed for visual analysis of the cage nets without the need for divers.
Plastic debris monitoring was conducted from 8 January to 30 May 2019, with the goal of bi-weekly surveys. However, unfavorable weather conditions or logistical constraints occasionally limited our ability to access the cages and adhere to the planned schedule. To ensure crew safety and minimize disruption to farm operations, we prioritized filming the larger cages (5 to 10) during each sampling event. During each visit to the cages, sampling was conducted at a minimum of three cages. Video recordings were captured of the entire perimeter of the uppermost net section. The camera, positioned approximately 2.5 m from the net, captured underwater images with a field of view of 2.5 m high by 4.45 m wide, starting from the water’s surface. Additionally, four specific points within each cage were filmed in more detail: north (N), east (E), south (S), and west (W). To ensure coverage of the full net depth (10 m) at these designated points, the camera angle was adjusted slightly downward. Filming employed a systematic approach, moving around the cage perimeter at a steady pace. The average filming duration for each cage was approximately six minutes.
Prior to initiating the formal sampling program, the methodology was piloted during two separate sampling sessions. Image analysis results were compared against plastic debris collections performed by divers to ensure standardization of procedures. Plastics were classified according to the categories of the JRC Joint List of Litter Category Manual [32]. This pilot testing resulted in a 100% success rate for the identification of macroplastics using the image analysis method.

2.3. Climate and Oceanographic Parameters

Wind speed data were acquired from the Lugar de Baixo station of the Portuguese Institute for Sea and Atmosphere, the closest coastal station, at 7.2 km from the study site. Tidal coefficient values were retrieved from the forecast website www.tabuademares.com (accessed on 17 June 2024). Ocean current direction was evaluated using a 2 m rope attached by a loose loop, 2 m below the surface, to the outer light buoy (about 100 m from the nearest fish farm cage). Rope directions were determined using a compass (Vintage Airguide, Chicago, IL, USA). Current directions were confirmed by net deformation at each quadrant from the video recordings.

2.4. Monitoring of Plastic in Fish Gut

Dead fish were collected from all cages during the sampling period. However, a significant proportion of collected individuals were in an advanced state of decomposition. This resulted in sampling inconsistencies, yielding only 233 individuals from a total recorded mortality of 22,270 during the study period. Morphometric data, including weight and standard length, were recorded for all sampled fish.
When present, ingested macroplastic debris was documented, including the number of items, weight (g), maximum stretched length (cm), color, location within the gastrointestinal tract, and item category according to the Joint List of Litter Category Manual [32]. Additionally, the fish farm company routinely collected live fish for stock assessment purposes. These fish were euthanized (n = 164) using thermal shock conducted under usual operations of the company, and their gastrointestinal tracts were analyzed following the same procedure as for deceased cage fish.
The Fulton condition factor (K) was calculated using the equation:
K = 100 × Wt/L3,
where Wt represents the total weight (g) and L represents the standard length (cm). This body condition index, based on the principle that heavier fish of a given length are in better condition [33], was calculated for all sampled fish. Subsequently, average K values were determined for three groups: dead fish with plastic debris, dead fish without plastic debris, and live fish.

2.5. Statistical Analysis

With the aim of analyzing statistically significant differences in the condition factor, when comparing individuals who died of natural/unknown causes with and without plastic with individuals who were captured alive, an analysis of variance (ANOVA) with one factor was performed. All requirements inherent to the analysis were validated. Whenever these were not met, the Kruskal–Wallis non-parametric test was performed. Whenever applicable, the Tukey HSD multiple comparisons test or the Games–Howell test were performed (meeting the ANOVA requirements or not, respectively). Pearson’s correlation coefficient (r) was used to test the extent to which the size of fish and amount of ingested plastic were linearly correlated. Whenever applicable, the results are presented as mean ± standard deviation (SD). The analysis was performed using IBM SPSS version 26 software. The level of significance was set at p-value < 0.05.

3. Results

3.1. Monitoring of Plastic in Fish-Farm Cages: Videography

The monitoring program involved sampling for 22 weeks (Table 1). During this period, 12 plastic debris items were identified in the video recordings. Overall, plastic debris was present in 11.65% of the video samples analyzed. Due to inconsistencies in the video samples and the limited dataset, establishing a definitive seasonal pattern was not possible. However, a trend towards higher plastic occurrence was observed in January and March. Cage 6 had the highest proportion of plastic debris observed in the video recordings followed by cage 9.
As shown in Table 2, the majority of identified plastic debris items were plastic bags of domestic use (66.66%), belonging to the category of small plastic bags (J4) and plastic shopping/carrier/grocery bags (J3). Fisheries and aquaculture activities were identified as another source (categories J241, J242, J79), contributing 24.99% of the debris. A single plastic item categorized as J241 originated from the cage structure itself. One additional plastic fragment measuring approximately 15 cm was found. However, due to its unidentifiable nature, its source category could not be determined.
Analysis of video recordings revealed plastic bags (regular and small) in three of the six cages studied. These findings are likely attributable to the low density and high buoyancy of plastic bags, making them more susceptible to transport by ocean currents and eventual entrapment within the cage nets (from the water surface to 10 m depth). Interestingly, the two identified plastic items categorized as fisheries/aquaculture debris were found in cages 7 and 10. No other plastic debris was observed in these cages.
Figure 2A illustrates the distribution of plastic debris within each cage quadrant. A visual trend suggests that quadrants parallel to the main current directions were more impacted. Cage 6 appeared to be the first among the studied cages to be affected by currents from both the SE and NE directions, and it also exhibited the highest number of plastic items. The frequency of ocean current directions observed during the study period (Figure 2B) are further correlated with the fish farm cage layout in Figure 2A. As evident from the figures, the dominant current directions were parallel to the coastline, with southeast (SE) and northwest (NW) currents prevailing (51.85% and 37.04% frequency, respectively). A northeast (NE) current with a direction perpendicular to the coast was also observed, though with a much lower frequency (7.41%).
A visual analysis of plastic frequency per cage quadrant and prevailing ocean current directions suggests a potential association, with 75.00% of plastics found in areas directly affected by the southeast (SE) and northwest (NW) currents. A larger and more robust dataset would be necessary to establish more conclusive relationships.

3.2. Monitoring of Plastic in Fish Gut

Due to the poor condition of most dead fish, only 1.05% of the total mortality could be analyzed for plastic ingestion. Among the analyzed fish, 12 individuals (5.15%) contained plastic debris in their gastrointestinal tracts. Only one plastic item was found per fish, and these items were likely the cause of fatal organ obstruction. A total of 19 sampling days yielded eight instances of plastic debris found in deceased fish. A slightly higher prevalence of plastic in fish occurred during March (7.14%) and May (6.85%). It is important to note that the number of sampled fish in April and May was double that of other months. No plastic was observed in February, but this coincides with a significantly lower number of fish sampled during that month.
The average weight (±standard deviation) of dead fish from natural/unknown causes was 222.64 ± 149.92 g, with a standard length of 19.08 ± 4.85 cm (n = 233). Distinctly, fish within this group that contained plastic debris (n = 12) exhibited a lower average weight (158.40 ± 77.91 g) and standard length (17.60 ± 2.91 cm) compared to those fish without plastic. Among the fish captured alive by the company for stock assessment (n = 164), no macroplastics were found in any individual. Their average weight was 107.69 ± 98.33 g, and their standard length was 14.37 ± 5.12 cm, which were both lower than the previously mentioned groups (dead fish, natural/unknown causes).
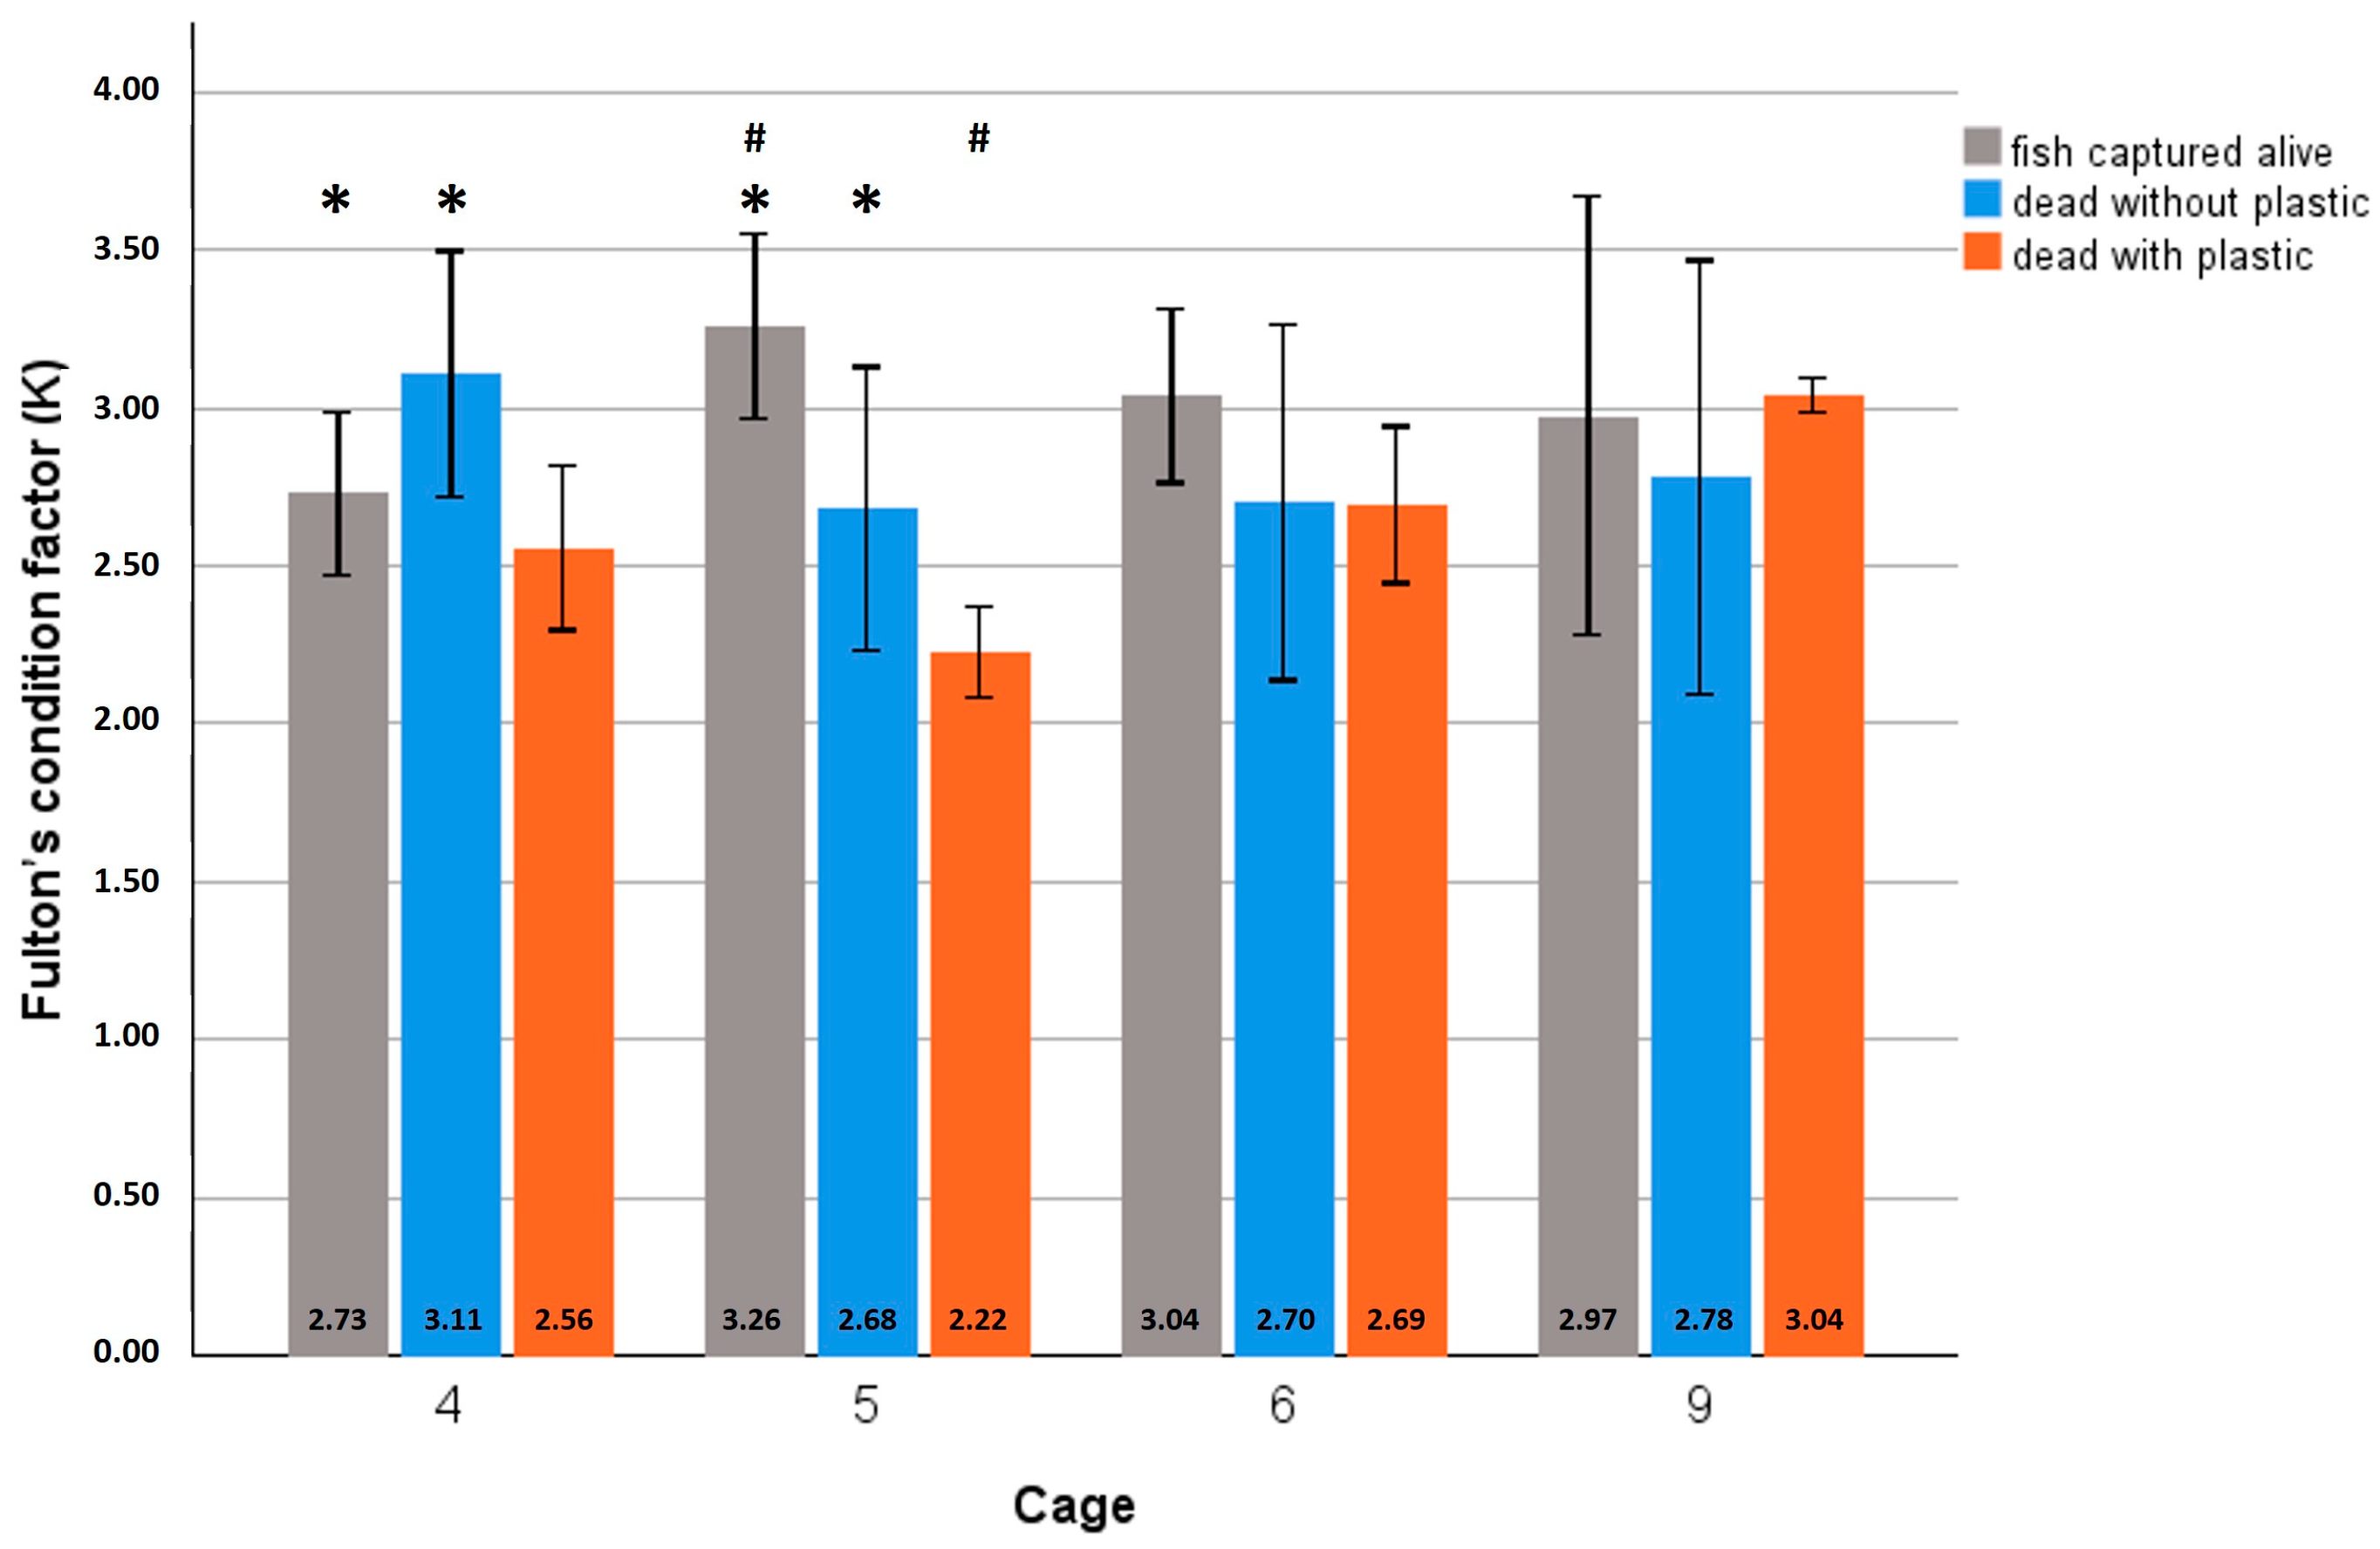
Average Fulton’s condition factor (K) from fish captured alive and dead fish (with and without plastic in digestive system) in different cages is presented in Figure 3. The results obtained show the existence of statistically significant differences when comparing the “K” for individuals that died of natural/unknown causes, with and without plastic, and the individuals sampled monthly (captured alive) for cage 4 (ANOVA, p-value = 0.006). More specifically, these differences were observed when comparing the individuals that died without plastic and the individuals sampled monthly (captured alive) (ANOVA, Tukey HSD, p-value = 0.007). Additionally, for cage 5, there are statistically significant differences when comparing the “K” for individuals that died of natural/unknown causes with and without plastic and the individuals sampled monthly (captured alive) (Kruskal–Wallis, p-value < 0.001). Specifically, these differences are evident when comparing individuals who died of natural/unknown causes with plastic and individuals sampled monthly (captured alive) (Kruskal–Wallis, Games–Howell, p-value= 0.004), as well as individuals who died of natural/unknown causes without plastic and individuals sampled monthly (captured alive) (Kruskal–Wallis, Games–Howell, p-value < 0.001). It is important to acknowledge that the condition factor calculated for dead fish may not be entirely accurate due to inconsistencies and the state of decomposition at the time of sampling.
All plastic debris items collected from the fish gut consisted of “plastic sheets” The majority belonged to category J79 (plastic/polystyrene pieces 2.5–50 cm) with only one fragment classified as J241 (items made of non-foamed artificial polymers that do not fit in any other category of the list), according to the JRC Joint List of Litter Category Manual [32]. Cage 6 again exhibited the highest number of plastic items (n = 5), followed by cage 9 (n = 3) and cages 4 and 5 (n = 2 each). It is important to note, however, that the total number of fish sampled from each cage varied significantly.
While all recovered plastic debris items were translucent plastic sheets, variations in color were observed: nine were white, one was brownish, one was light blue, and one was black. The location of plastic debris within the gastrointestinal tract also differed slightly. Seven plastic pieces were found in the stomach (Figure 4A,B), while five were found in the intestine. In all cases, the plastic debris occupied the entirety of the organ of the digestive tract that it was lodged in. These fish did not present body deformations or external injuries.
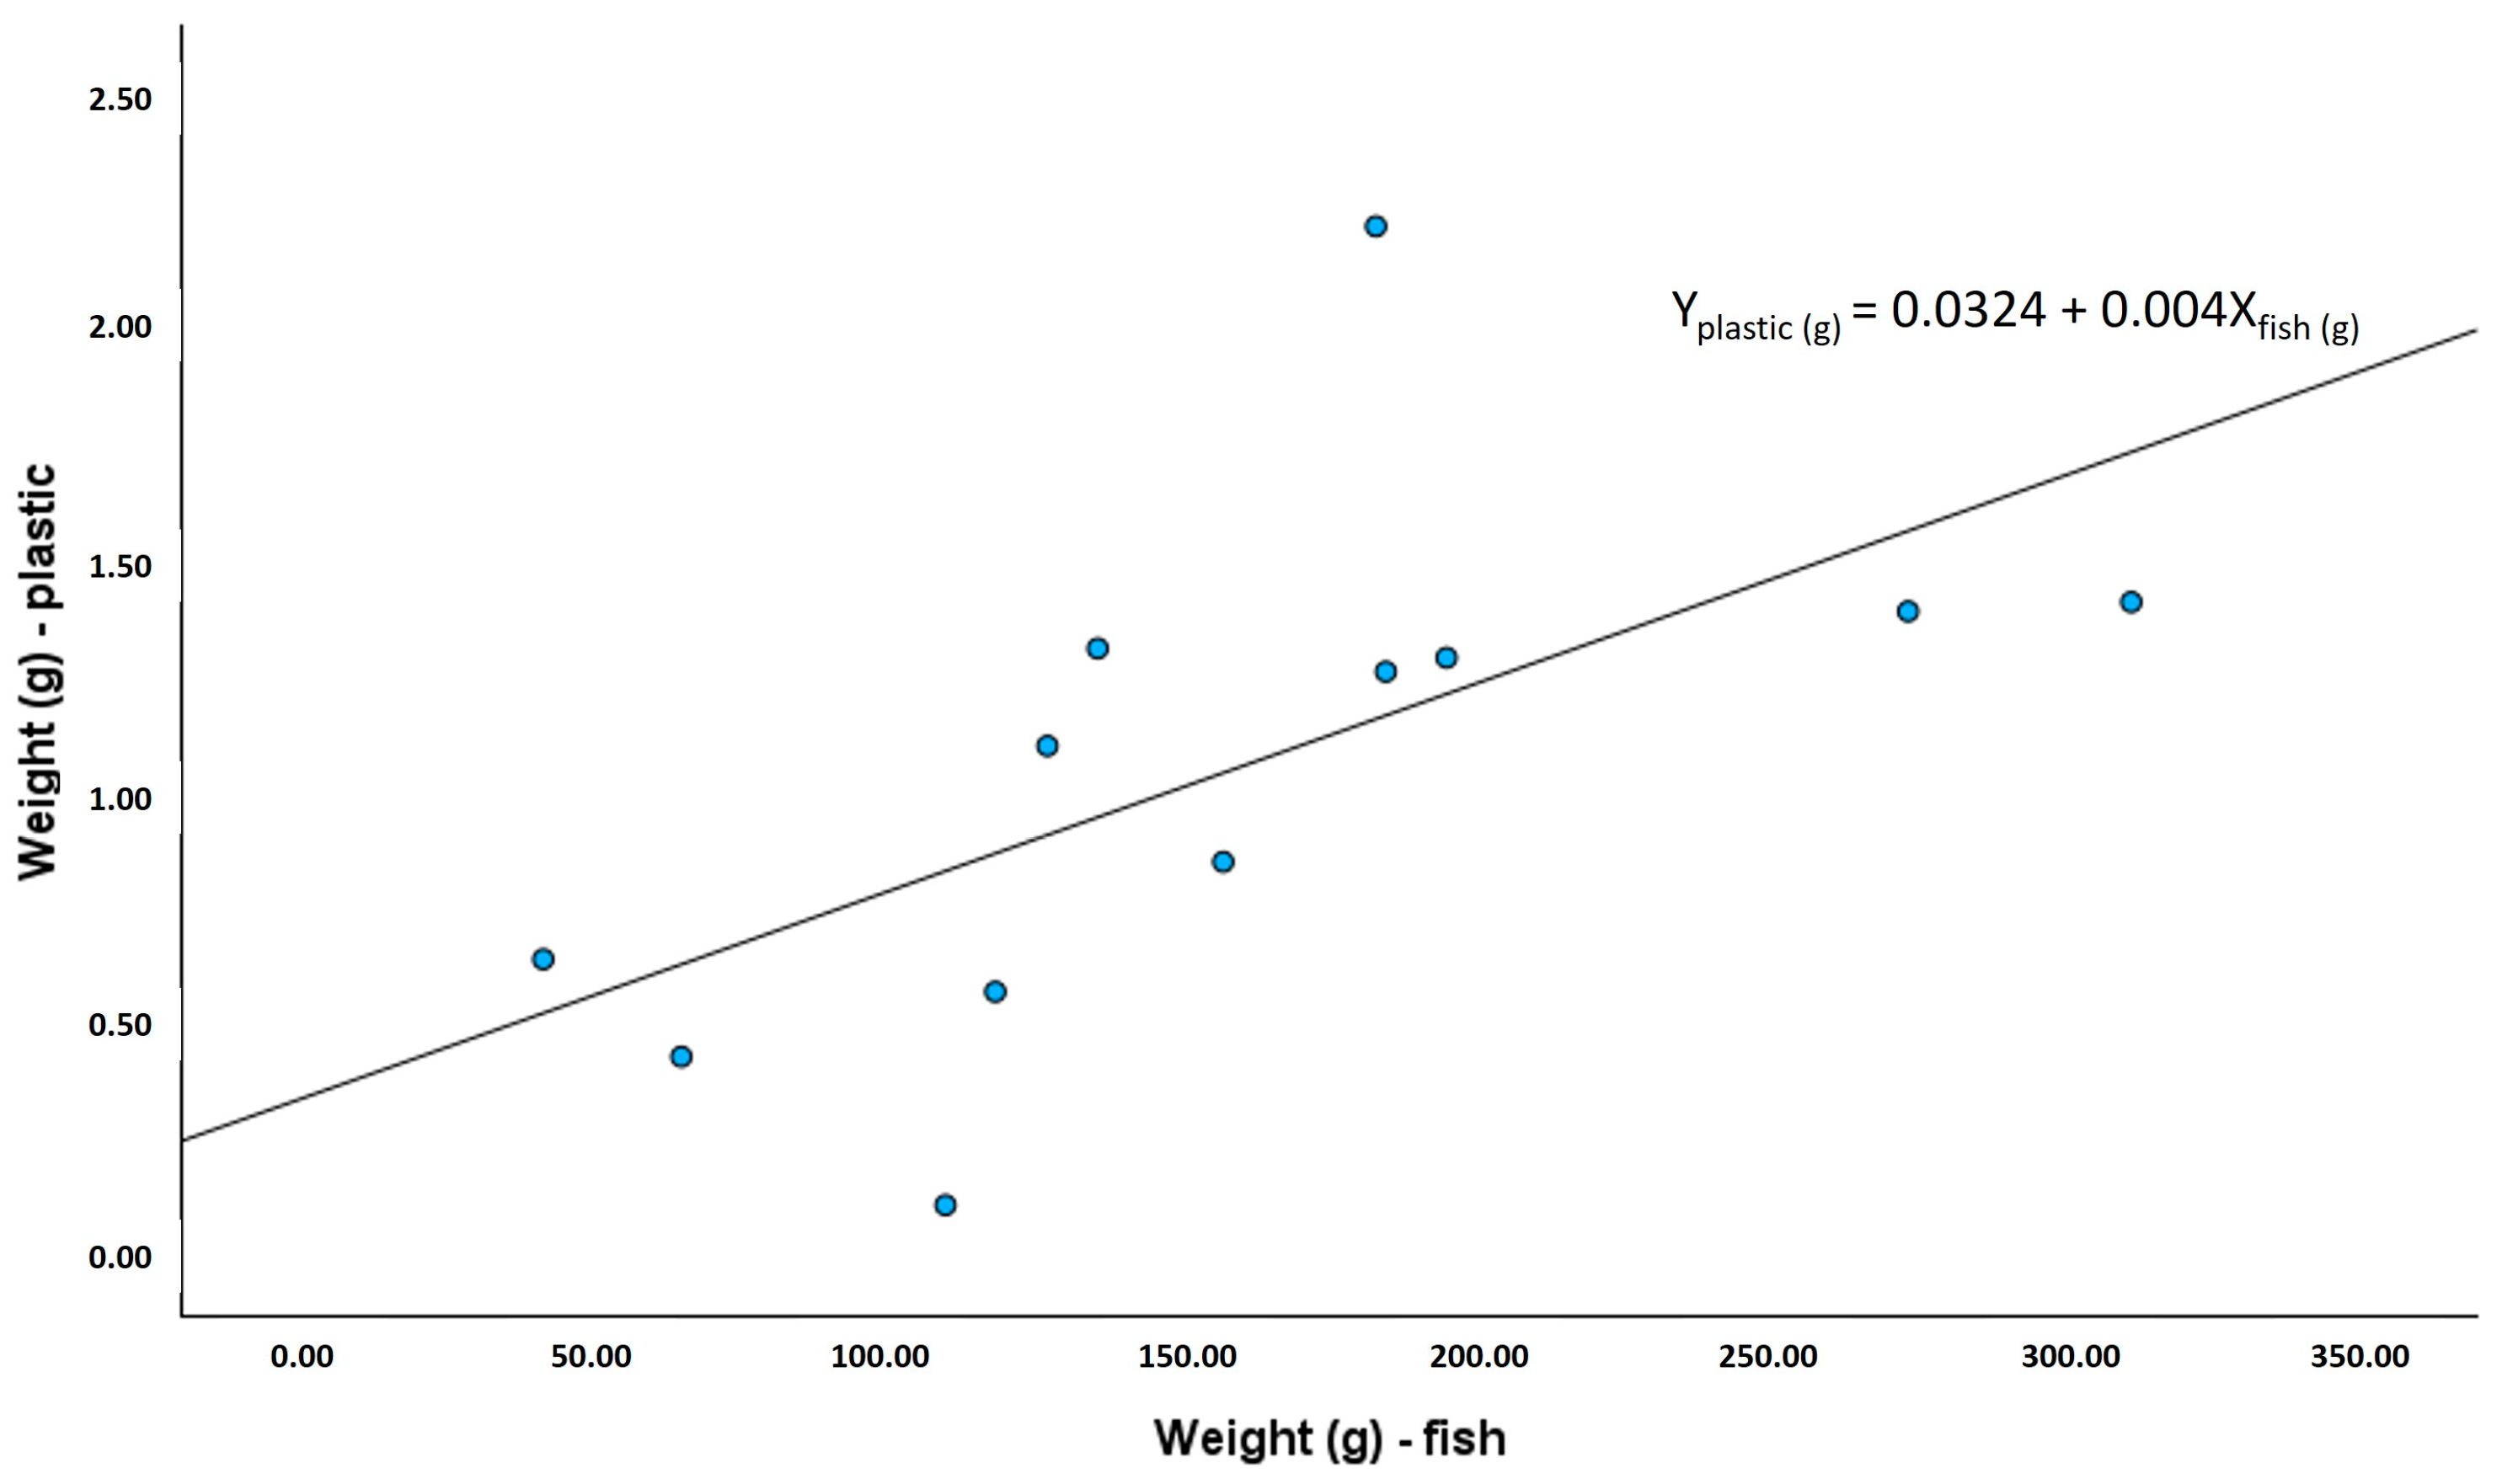
The size of macroplastics (n = 12) in the digestive tract ranged from 1.3 cm to 14.00 cm, with an average of 9.19 ± 3.64 cm. Most fish (75%) presented macroplastic stretched length over 50% of their standard size. A positive correlation was found between the fish weight and the weight of macroplastics in the digestive tract (r = 0.621; p = 0.031) (Figure 5).

4. Discussion

This preliminary study examined the presence and types of macroplastic debris within an offshore fish farm on Madeira Island. While the limited dataset precluded definitive conclusions, the observed higher frequency of plastic debris in the outermost cages and outer sections of the nets compared to the central cages suggests potential influences from prevailing currents and farm design. The prevailing currents along the farm’s main axis may initially transport debris towards the outer cages, while the peripheral fish net pens can act as physical barriers, trapping debris and preventing its movement towards the center. This may suggest that the spatial distribution of macroplastics within the farm is likely influenced by a combination of hydrodynamic factors and farm infrastructure.
The majority of collected plastic debris consisted of plastic sheets (e.g., shopping bags, food wraps). It has been suggested that plastic density affects its bioavailability in the water column [34]. Low-density plastics like sheets are more likely to float, increasing the risk of ingestion by marine fauna. These sheets likely originate from diverse sources due to their widespread use. While we identified supermarket bags, food wraps, banana plantation bags (typically blue), garbage bags, and aquaculture feeding bags, deterioration often prevented definitive origin determination. The dominance of domestic waste, particularly plastic bags, in the collected debris was observed in previous floating marine litter monitoring studies [35,36,37,38]. Given the sampling site’s proximity to a fish farm and harbor with daily fishing vessel traffic, a higher proportion of aquaculture or fishing-related plastic debris was anticipated. Plastic debris associated with fishing and aquaculture activities was less frequent in cage samples (24.99%) and fish samples (0.00% in live fish). Though, fish mortalities due to plastics ingestion accounted for only 5.15% of total mortalities.
While white is a common color for plastic items, the high number of white plastics found in the fish may not solely be due to its abundance. Previous work suggested some fish species might exhibit a preference for white objects [24]. Also, that work found wild fish with primarily white plastic fragments (0.1 to 2 mm) in their digestive tracts, hinting at selective feeding behavior. Additionally, the low density of the white plastics observed in this study makes them highly buoyant and easily transported by ocean currents. This buoyancy, combined with potential mistaken identity as food, could further contribute to their ingestion by fish. This aligns with previous suggestions that many animals mistake marine litter for food [39], but has been previously unreported for farmed S. aurata. Nevertheless, it is surprising that farmed sea bream mistakes macroplastic items for food, as they are usually fed brown pellets with an appealing smell given by fish meal and oil. Sea bream are carnivorous fish that are known to chew and crash food items in response to food hardness and size [40,41]. Also, their teeth number and size are not affected by farming conditions [42]. However, the fish with macroplastics in the digestive system seemed to be unable to process and break long stretched plastic sheets (in most fish corresponding to over 50% their standard length).
This food mistake can lead to problems because, unlike natural food sources, these plastic items cannot be regurgitated and become lodged in the digestive tract. Plastics lodged in the stomach likely create a false sense of satiety, leading to reduced feeding and can lead to eventual starvation. Reduced swimming ability in these fish may also contribute to starvation. The amount of ingested macroplastics is associated with the size of fish as demonstrated by our results.
Interestingly, dead fish in our study with plastic in their digestive tracts exhibited no external signs of deformations or injuries. Additionally, their Fulton condition factor did not differ significantly from live fish, suggesting no apparent starvation. Statistical differences found in K values between dead fish and sampled live fish, both with no plastic in the digestive system, denote the smaller size of fish in these cages (4 and 5) and therefore, populations more susceptible to diseases and other factors with impact in body condition. This finding suggests that internal injuries caused by the ingestion of sharp or jagged plastics may be a more plausible cause of mortality than starvation alone. This potential consequence has been documented in fish and other marine organisms [36]). Further investigation is warranted to determine the prevalence and impact of internal injuries from macroplastic ingestion on mortality rates in farmed fish.
Although limited, our results suggest a land-based source for marine litter at the fish farm, potentially linked to littering in streams. The farm site is located near two seasonal streams, similar to other streams in the southern part of the island that experience a dramatic increase in water flow during winter. The closer a site is to a potential litter source, the higher the chance that litter found there originated from that source [43]. This is aligned with the findings of a two-year litter monitoring program conducted on Funchal beaches, located approximately 30 km west of our study site [44]. Plastic objects were the most frequent litter item on Funchal beaches (31%), alongside cigarette buts.
Moreover, our results on the composition and origin of marine litter from the fish farm are consistent with perceptions of Madeira’s fish farm workers. A local industry survey identified fishing waste, industrial waste, and sewage water as the primary sources of marine litter impacting fish farms [45]. Aquaculture was listed as the least significant source, causing minimal disruption and financial loss. The observed low prevalence of debris originating from aquaculture activities suggests a commendable level of environmental stewardship on the part of the fish farm company and its employees. Moreover, offshore fish farming operates in a very harsh environment, with risks for the workers and high-cost equipment [46]. Regular maintenance by fish farm workers, coupled with inspections from insurance companies, may contribute significantly to maintaining the good state of equipment.
This study employed an efficient low-cost method for macroplastic identification, a combination of an extendable pole and a digital camera. Limitations included the number of cages sampled and occasional adverse weather conditions. With increased sampling days, improved pole design, and standardized camera angles relative to the cages (for size measurement and better identification), this method could be an expeditious tool for monitoring plastics at fish farms of similar high underwater visibility as Madeira. Its advantages include cost-effectiveness, practicality, and minimal training requirements. This method could be used for: (a) monitoring floating marine litter around sea cages and trapped within nets; (b) comparing marine litter occurrence at different depths; and (c) comparing marine litter presence across different fish farms worldwide.
The increasing influx of plastic into the oceans raises concerns regarding environmental, social, economic, and human health impacts. Effective control of plastic pollution in aquaculture requires prioritizing improved monitoring methods through the development and implementation of robust detection systems [47]. Future research should focus on refining the monitoring techniques used in our study for plastic identification and quantification, while also evaluating the impact of all plastic sizes on fish. The dominance of land-based plastic pollution in this preliminary study highlights the need for stricter litter management strategies and policy changes to curb plastic pollution and its detrimental impacts on marine ecosystems and aquaculture activities.

Author Contributions

Conceptualization, M.M. and C.A.P.A.; methodology, M.M. and C.A.P.A.; software, M.M. and S.M.; validation, M.M., S.M., A.P. and C.A.P.A.; formal analysis, M.M.; investigation, M.M.; resources, C.A.P.A.; data curation, M.M.; writing—original draft preparation, M.M.; writing—review and editing, S.M., A.P. and C.A.P.A.; supervision, A.P. and C.A.P.A.; project administration, C.A.P.A.; funding acquisition, C.A.P.A. All authors have read and agreed to the published version of the manuscript.

Funding

Authors would like to thank the Smart Island Hub/ARDITI for supporting the Article Processing Charges.

Data Availability Statement

The data that support the findings of this study are available from the corresponding author upon reasonable request.

Acknowledgments

The authors would like to acknowledge the company Marismar Lda. Funchal, Portugal for the logistical support and for making their sampled fish available for this study. A.P. was supported under the Scientific Employment Stimulus–Institutional Call—CEECINST/00051/2018. Acknowledgements to Marisa Gouveia for assistance with figures.

Conflicts of Interest

The authors declare no conflicts of interest.

References

  1. Ruiz Orejon Sanchez Pastor, L.; Tornero Alvarez, M.V.; Boschetti, S.; Hanke, G. Marine Strategy Framework Directive—Review and analysis of EU Member States’ 2018 Reports—Descriptor 10, Marine Litter; EUR 30665 EN; Publications Office of the European Union: Luxembourg, 2021; Available online: https://publications.jrc.ec.europa.eu/repository/handle/JRC124701 (accessed on 17 June 2024).
  2. Williams, A.T.; Rangel-Buitrago, N. The past, present, and future of plastic pollution. Mar. Poll. Bull. 2022, 176, 113429. [Google Scholar] [CrossRef] [PubMed]
  3. Avio, C.G.; Gorbi, S.; Regoli, F. Plastics and microplastics in the oceans: From emerging pollutants to emerged threat. Mar. Environ. Res. 2017, 128, 2–11. [Google Scholar] [CrossRef] [PubMed]
  4. Derraik, J.G.B. The pollution of the marine environment by plastic debris: Review. Mar. Poll. Bull. 2002, 44, 842–852. [Google Scholar] [CrossRef] [PubMed]
  5. Gregory, M.R.; Andrady, A.L. Plastics in the marine environment. Plast. Environ. 2003, 379, 389–390. [Google Scholar] [CrossRef]
  6. Viejo, J.; Martí, E.; Ignacio, J.; Montero, E.; Arroyo, G.M.; Hanke, G.; Salvo, V.S.; Basurko, O.C.; Mallos, N.; Lebreton, L.; et al. An inshore–offshore sorting system revealed from global classification of ocean litter. Nat. Sustain. 2021, 4, 484–493. [Google Scholar] [CrossRef]
  7. Cooper, D.A.; Corcoran, P.L. Effects of mechanical and chemical processes on the degradation of plastic beach debris on the island of Kauai, Hawaii. Mar. Poll. Bull. 2010, 60, 650–654. [Google Scholar] [CrossRef]
  8. Barnes, D.K.A.; Galgani, F.; Thompson, R.C.; Barlaz, M. Accumulation and fragmentation of plastic debris in global environments. Phil. Trans. R. Soc. B 2009, 364, 1985–1998. [Google Scholar] [CrossRef]
  9. Bråte, I.L.N.; Huwer, B.; Thomas, K.V.; Eidsvoll, D.P.; Halsband, C.; Almroth, B.C.; Lusher, A. Micro-and Macro-Plastics in Marine Species from Nordic Waters; Nordic Council of Ministers: Copenhagen, Denmark, 2017; p. 549. Available online: https://norden.diva-portal.org/smash/record.jsf?pid=diva2%3A1141513&dswid=2343 (accessed on 17 June 2024).
  10. Moore, C.J. Synthetic polymers in the marine environment: A rapidly increasing, long-term threat. Environ. Res. 2008, 108, 131–139. [Google Scholar] [CrossRef]
  11. Gregory, M.R. Environmental implications of plastic debris in marine settings entanglement, ingestion, smothering, hangers-on, hitch-hiking and alien invasions. Philos. Trans. R. Soc. Lond. B Biol. Sci. 2009, 364, 2013–2025. [Google Scholar] [CrossRef]
  12. Marine Litter in the North-East Atlantic Region: Assessment and Priorities for Response; OSPAR: London, UK, 2009; 127p.
  13. Lusher, A. Microplastics in the Marine Environment: Distribution, Interactions and Effects. In Marine Anthropogenic Litter; Bergmann, M., Gutow, L., Klages, M., Eds.; Springer: Cham, Switzerland, 2015; pp. 245–307. [Google Scholar]
  14. Bentivegna, F.; Travaglini, A.; Matiddi, M.; Baini, M.; Camedda, A.; De Lucia, A.; Fossi, M.C.; Giannetti, M.; Mancusi, C.; Marchiori, E.; et al. First data on ingestion of marine litter by loggerhead sea turtles, Caretta caretta in Italian waters (Mediterranean Sea). In Proceedings of the Biology and Ecotoxicology of Large Marine Vertebrates: Potential Sentinels of Good Environmental Status of Marine Environment, Implication on European Marine Strategy Framework Directive, Siena, Italy, 5–6 June 2013. [Google Scholar]
  15. Van Franeker, J.A.; Blaize, C.; Danielsen, J.; Fairclough, K.; Gollan, J.; Guse, N.; Hansen, P.L.; Heubeck, M.; Jensen, J.-K.; Le Guillou, G.; et al. Monitoring plastic ingestion by the northern fulmar Fulmarus glacialis in the North Sea. Environ. Poll. 2011, 159, 2609–2615. [Google Scholar] [CrossRef]
  16. Simmonds, M.P. Cetaceans and marine debris: The great unknown. J. Mar. Biol. 2012, 2012, 684279. [Google Scholar] [CrossRef]
  17. Romeo, T.; Pietro, B.; Pedà, C.; Consoli, P.; Andaloro, F.; Fossi, M.C. First evidence of presence of plastic debris in stomach of large pelagic fish in the Mediterranean Sea. Mar. Poll. Bull. 2015, 95, 358–361. [Google Scholar] [CrossRef] [PubMed]
  18. Wieczorek, A.M.; Morrison, L.; Croot, P.L.; Allcock, A.L.; MacLoughlin, E.; Savard, O.; Brownlow, H.; Doyle, T.K. Frequency of Microplastics in Mesopelagic Fishes from the Northwest Atlantic. Front. Mar. Sci. 2018, 5, 339138. [Google Scholar] [CrossRef]
  19. Hanachi, P.; Karbalaei, S.; Walker, T.R.; Cole, M.; Hosseini, S.V. Abundance and properties of microplastics found in commercial fish meal and cultured common carp (Cyprinus carpio). Environ. Sci. Poll. Res. 2019, 26, 23777–23787. [Google Scholar] [CrossRef]
  20. Thiele, C.J.; Hudson, M.D.; Russell, A.E.; Saluveer, M.; Sidaoui-Haddad, G. Microplastics in fish and fishmeal: An emerging environmental challenge? Sci. Rep. 2021, 11, 2045. [Google Scholar] [CrossRef]
  21. Lusher, A.L.; Hollman, P.C.H.; Mendoza-Hill, J.J. Microplastics in Fisheries and Aquaculture: Status of Knowledge on Their Occurrence and Implications for Aquatic Organisms and Food Safety; FAO Fisheries and Aquaculture Technical Paper; FAO: Rome, Italy, 2017; 125p. [Google Scholar]
  22. Skirtun, M.; Sandra, M.; Strietman, W.J.; van den Burg, S.W.K.; De Raedemaecker, F.; Devriese, L.I. Plastic pollution pathways from marine aquaculture practices and potential solutions for the North-East Atlantic region. Mar. Poll. Bull. 2022, 174, 113178. [Google Scholar] [CrossRef]
  23. GESAMP. Sources, Fate and Effects of Microplastics in the Marine Environment: Part Two of a Global Assessment; Kershaw, P.J., Rochman, C.M., Eds.; IMO/FAO/UNESCO-IOC/UNIDO/WMO/IAEA/UN/UNEP/UNDP Joint Group of Experts on the Scientific Aspects of Marine Environmental Protection; GESAMP: London, UK, 2016; Volume 93, 220p. [Google Scholar]
  24. Carpenter, E.J.; Anderson, S.J.; Harvey, G.R.; Miklas, H.P.; Peck, B.B. Polystyrene Spherules in Coastal Waters. Science 1972, 178, 749–750. [Google Scholar] [CrossRef]
  25. Iheanacho, S.; Ogbu, M.; Bhuyan, M.S.; Ogunji, J. Microplastic pollution: An emerging contaminant in aquaculture. Aqua. Fish. 2023, 8, 603–616. [Google Scholar] [CrossRef]
  26. Krüger, L.; Casado-Coy, N.; Valle, C.; Ramos, M.; Sánchez-Jerez, P.; Gago, J.; Carretero, O.; Beltran-Sanahuja, A.; Sanz-Lazaro, C. Plastic debris accumulation in the seabed derived from coastal fish farming. Environ. Poll. 2020, 257, 113336. [Google Scholar] [CrossRef]
  27. Sanz-Lazaro, C.; Casado-Coy, N.; Calderero, E.M.; Villamar, U.A. The environmental effect on the seabed of an offshore marine fish farm in the tropical Pacific. J. Environ. Manag. 2021, 300, 113712. [Google Scholar] [CrossRef]
  28. Chen, F.; Lao, Q.; Liu, M.; Huang, P.; Chen, B.; Zhou, X.; Chen, P.; Chen, K.; Song, Z.; Cai, M. Impact of intensive mariculture activities on microplastic pollution in a typical semi-enclosed bay: Zhanjiang Bay. Mar. Poll. Bull. 2022, 176, 113402. [Google Scholar] [CrossRef] [PubMed]
  29. Rodríguez, Y.; Pham, C.K. Marine litter on the seafloor of the Faial-Pico Passage, Azores Archipelago. Mar. Poll. Bull. 2017, 116, 448–453. [Google Scholar] [CrossRef] [PubMed]
  30. Goodman, A.J.; Walker, T.R.; Brown, C.J.; Wilson, B.R.; Gazzola, V.; Sameoto, J.A. Benthic marine debris in the Bay of Fundy, eastern Canada: Spatial distribution and categorization using seafloor video footage. Mar. Poll. Bull. 2020, 150, 110722. [Google Scholar] [CrossRef] [PubMed]
  31. Lundqvist, J. Monitoring Marine Debris; Report of University of Gothenburg, Faculty of Sciences: Gothenburg, Sweeden, 2013; 22p. [Google Scholar]
  32. Fleet, D.; Vlachogianni, T.; Hanke, G. A Joint List of Litter Categories for Marine Macrolitter Monitoring; EUR 30348 EN; Publications Office of the European Union: Luxembourg, 2021; ISBN 978-92-76-21445-8. [Google Scholar] [CrossRef]
  33. Ricker, W.E. Computation and interpretation of biological statistics of fish populations. Bull. Fish. Res. Board Can 1975, 191, 1–382. [Google Scholar]
  34. Wright, S.L.; Thompson, R.C.; Galloway, T.S. The physical impacts of microplastics on marine organisms: A review. Environ. Poll. 2013, 178, 483–492. [Google Scholar] [CrossRef] [PubMed]
  35. Morris, R.J. Floating plastic debris in the Mediterranean. Mar. Poll. Bull. 1980, 11, 125. [Google Scholar] [CrossRef]
  36. Aliani, S.; Griffa, A.; Molcard, A. Floating debris in the Ligurian Sea, Northwestern Mediterranean. Mar. Poll. Bull. 2003, 46, 1142–1149. [Google Scholar] [CrossRef]
  37. Hinojosa, I.A.; Thiel, M. Floating marine debris in fjords, gulfs and channels of southern Chile. Mar. Poll. Bull. 2009, 58, 341–350. [Google Scholar] [CrossRef]
  38. Chen, H.; Wang, S.; Guo, H.; Lin, H.; Zhang, Y.; Long, Z.; Huang, H. Study of marine debris around a tourist city in East China: Implication for waste management. Sci. Total Environ. 2019, 676, 278–289. [Google Scholar] [CrossRef]
  39. Sheavly, S.B.; Register, K.M. Marine Debris & Plastics: Environmental Concerns, Sources, Impacts and Solutions. J. Polym. Environ. 2007, 15, 301–305. [Google Scholar] [CrossRef]
  40. Cataldi, E.; Cataudella, S.; Monaco, G.; Rossi, A.; Tancioni, L. A study of the histology and morphology of the digestive tract of the sea-bream, Sparus aurata. J. Fish. Biol. 1987, 30, 135–145. [Google Scholar] [CrossRef]
  41. Andrew, J.E.; Holm, J.; Huntingford, F.A. The effect of pellet texture on the feeding behaviour of gilthead sea bream (Sparus aurata L.). Aquaculture 2004, 232, 471–479. [Google Scholar] [CrossRef]
  42. de Azevedo, A.M.; Fontanillas, R.; Owen, M.A.G.; Busti, S.; Parma, L.; Bonaldo, A.; Witten, P.E.; Huysseune, A. A quantitative analysis of gilthead seabream (Sparus aurata) juvenile dentition as a tool to assess the effect of diet. Can. J. Zool. 2021, 99, 548–556. [Google Scholar] [CrossRef]
  43. Veiga, J.; Fleet, D.; Kinsey, S.; Nilsson, P.; Vlachogianni, T.; Werner, S.; Galgani, F.; Thompson, R.; Dagevos, J.; Gago, J.; et al. Identifying Sources of Marine Litter; MSFD GES TG Marine Litter Thematic Report; Publications Office of the European Union: Luxembourg, 2016. [Google Scholar]
  44. Bettencourt, S.; Lucas, C.; Costa, S.; Caeiro, S. Monitoring marine litter on Funchal beaches (Madeira Island): Insights for litter management. Reg. Stud. Mar. Sci. 2023, 63, 102991. [Google Scholar] [CrossRef]
  45. Parretti, P.; Almeida, S.; Monteiro, J.G.; Canning-Clode. Marine Litter and Offshore Aquaculture: A Survey-Based Case Study in Madeira. Project CleanAtlantic—Tackling Marine Litter in the Atlantic Area (Interreg Atlantic Area). Available online: https://www.cleanatlantic.eu/wp-content/uploads/2021/09/Report_AquacultureSurvey_CleanAtlantic_VersaoFinal.pdf (accessed on 19 February 2021).
  46. Knapp, G. The development of offshore aquaculture: An economic perspective. In Expanding Mariculture Farther Offshore: Technical, Environmental, Spatial and Governance Challenges; Lovatelli, A., Aguilar-Manjarrez, J., Soto, D., Eds.; FAO Technical Workshop; FAO Fisheries and Aquaculture Proceedings; FAO: Rome, Italy, 2013; pp. 201–244. [Google Scholar]
  47. Wu, H.; Hou, J.; Wang, X. A review of microplastic pollution in aquaculture: Sources, effects, removal strategies and prospects. Ecotoxicol. Environ. Saf. 2023, 252, 114567. [Google Scholar] [CrossRef]
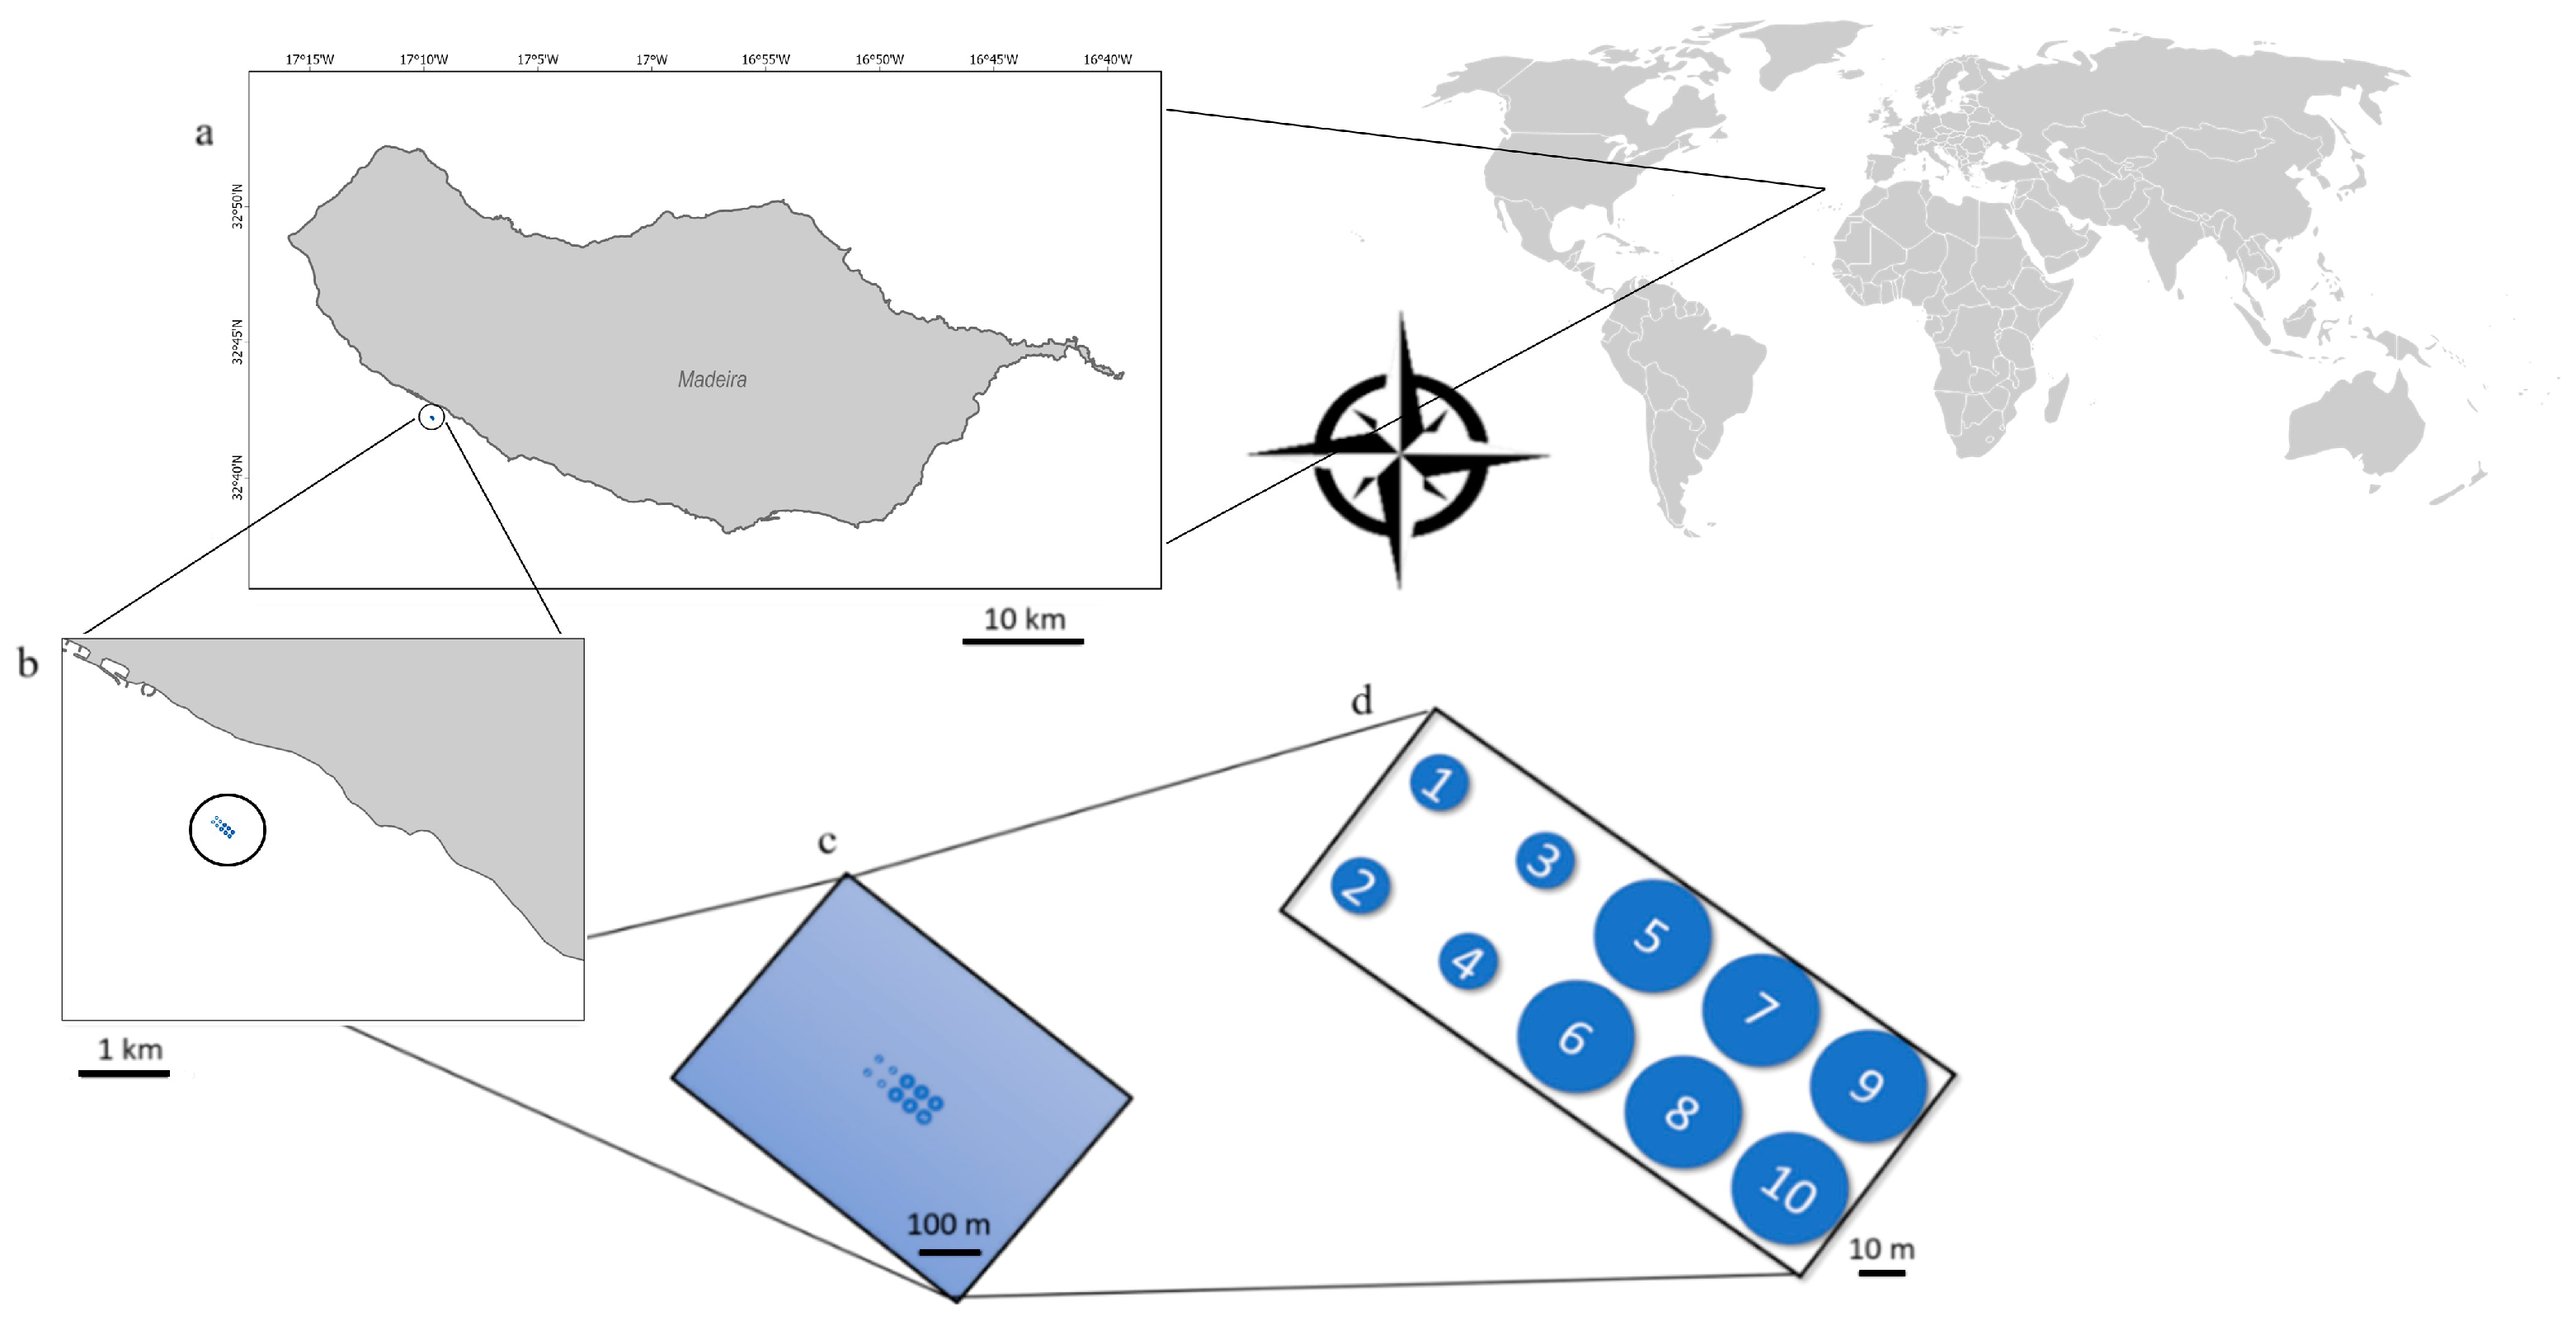
Figure 1. Marismar’s fish farm location and its offshore cages. (a) Madeira Island’s map; (b) location of offshore cages; (c) fish farm concession area; (d) display of fish farm cages.
Environments 11 00202 g001
Figure 2. The main ocean current directions (A) at the fish farm and the number of plastics found at each cage and quadrant (fish farm cages identified from 1 to 10) and (B) Diagram of frequency (%) of ocean current directions observed at the fish farm.
Environments 11 00202 g002
Figure 3. Average (and standard deviation) of the condition factor (K) of individuals that died of natural/unknown causes (dead fish) with and without plastic and of individuals that were sampled monthly (fish captured alive) from cages 4, 5, 6, and 9 of Marismar’s fish farm. Symbols * and # represent significant differences (i.e., whenever p-value < 0.05).
Environments 11 00202 g003
Figure 4. Sea bream Sparus aurata sampled from Marismar’s fish farm, (A,B). In the foreground, plastic removed from the gastrointestinal tract from each fish.
Environments 11 00202 g004
Figure 5. Correlation between weight of fish and amount (weight) of macroplastics found in the digestive tract (n = 12; r = 0.621; p = 0.031).
Environments 11 00202 g005
Table 1. Temporal variation and per cage of number of video samples and number of plastics found at Marismar’s fish farm, from January to May.
Video Samples, nPlastics, n
Month
January306
February161
March195
April150
May230
Cage
5200
6236
771
8151
9213
10171
Table 2. Amount (n) of plastic found at Marismar’s fish farm per category of the JRC Joint List of Litter Category Manual [32] and its likely source.
Type-CodeJ-CodeNamenSource
pl_nn_bag_smbg_J4small plastic bags1Domestic Use
pl_nn_bag_cabg_J3plastic shopping/carrier/grocery bags7Domestic Use
pl_fc_b&c_lids_drnk_J21plastic caps/lids drinks1Domestic Use
pl_nn_idp_idnf_J241other identifiable non-foamed plastic items1Fisheries/Aquaculture
pl_nn_rps_strg_nodr_J242plastic string and cord (diameter less than 1cm) not from dolly ropes or unidentified1Fisheries/Aquaculture
pl_nn_frg_nofp_smal_J79fragments of non-foamed plastic ≥ 2.5cm, ≤50cm1Fisheries/Aquaculture
Disclaimer/Publisher’s Note: The statements, opinions and data contained in all publications are solely those of the individual author(s) and contributor(s) and not of MDPI and/or the editor(s). MDPI and/or the editor(s) disclaim responsibility for any injury to people or property resulting from any ideas, methods, instructions or products referred to in the content.