Article

Ecosystem Services of the Baltic Sea—State and Changes during the Last 150 Years

1
Research Unit—Coastal Seas and Society, Leibniz-Institute for Baltic Sea Research, Seestraße 15, D-18119 Rostock, Germany
2
Marine Research Institute, Klaipeda University, Universiteto Ave. 17, LT-92294 Klaipeda, Lithuania
3
Department of Physical Oceanography, Leibniz-Institute for Baltic Sea Research, Seestraße 15, D-18119 Rostock, Germany
*
Author to whom correspondence should be addressed.
Environments 2024, 11(9), 200; https://doi.org/10.3390/environments11090200
Submission received: 12 July 2024 / Revised: 22 August 2024 / Accepted: 12 September 2024 / Published: 14 September 2024

Abstract

:
We assess the ecosystem services across the entire Baltic Sea using ecosystem model simulations and historical socio-economic data. Our approach covers 150 years, aggregated for the years around 1880, 1960, and 2010. The ecosystem services assessed include commercially usable wild fish biomass and wild plant biomass, water quality regulation (nitrogen and phosphorus retention), carbon storage, biodiversity and habitats, as well as active recreation and landscape aesthetics. In 2010, the commercially usable fish biomass in the entire Baltic Sea was 9.24 million tons. The total retention of nitrogen in the Baltic Sea was 884,135 t/a, phosphorus retention was 32,058 t/a, and carbon storage was 3,668,100 t/a. Between 1880 and 2010, the Baltic Sea-wide average biodiversity index decreased from 73 to 60, the active recreational quality index decreased from 76 to 69, and the observational recreation index declined from 91 to 78. In 2010, the most monetarily significant single ecosystem service in the Baltic Sea was nitrogen retention with EUR 26,822 million/a, followed by cultural ecosystem services. Other relevant services were fish catches (EUR 277 million/a), phosphorus retention (EUR 3854 million/a), and carbon storage (202 million/a). The latter recently showed a steep increase due to rising prices for CO2 certificates.

1. Introduction

With a surface area above 415,266 km2, the Baltic Sea is one of the largest brackish seas worldwide. Its catchment area of 1.7 million km2 is home to over 85 million people [1] and encompasses almost one third of the European Union’s (EU) territory. The Baltic Sea’s outstanding ecological, economic, and cultural role is reflected in the EU Strategy for the Baltic Sea Region [2].
For centuries, the Baltic Sea has been intensively utilized by humans. It is subject to multiple pressures and increasing impacts, such as eutrophication, biodiversity degradation, pollution, land use, and resource extraction, as well as being subject to climate change [3]. These pressures led to substantial changes in the Baltic Sea, especially in the 20th century. Examples include a regime shift from a benthic to pelagic-dominated state in central basins [4], increasing nutrient loads, intensified eutrophication, expanded hypoxic areas and algal blooms [5,6,7], along with a faster warming compared to other seas [8].
Despite existing and largely implemented environmental policies, the recent comprehensive assessment reveals that the state of the Baltic Sea ecosystem is still not good and did not improve in recent years. The assessment concludes that a more holistic approach to management and governance, focusing on the entire ecosystem, is required [3]. In response, a supplementary report was published, addressing economic and social analyses, which includes ecosystem service assessments [9].
In the Millennium Ecosystem Assessment [10], ecosystem services are defined as benefits that humans derive from ecosystems. Ecosystem services play a significant role in European coastal and marine policies today. Most coastal and marine European Union policies explicitly mention ecosystem services and call for their assessment or applications during the implementation process [11]. It is expected that ecosystem service assessments provide a comprehensive understanding of the structures and (inter-)dependencies between humans and the environment, thereby supporting the required ‘Ecosystem Approach to Management’ [12,13]. Further, they can support public information and awareness-rising as well as enable active involvement of stakeholders [14,15].
The Baltic Sea is considered a very suitable case study for ecosystem service assessments for a number of reasons: its structural diversity, the significant ecosystem changes during the last century, its strong reaction to ongoing pressures such as climate change, and last but not least, the comparatively good data availability and accessibility [16]. This motivated many studies. For example, Hasler et al. [17] provide an overview about concepts for ecosystem service assessments and their application in the Baltic Sea region as well as how the results can be used in practice. Armoškaitė et al. [18] suggest an ecosystem service assessment tool that links marine ecosystem components, functions, and services based on the Common International Classification of Ecosystem Services (CICES) [19]. Hyytiäinen et al. [20] assess potential future long-term changes in selected ecosystem services using biogeochemical and ecosystem models. Further, several local ecosystem service applications and reviews exist [21,22].
However, even in the Baltic Sea region, ecosystem service assessments suffer from many known weaknesses: They are based on different methods that show a varying degree of robustness as well as lack availability and/or reliability of data [15,23,24]. Often, the assessments focus on smaller spatial units that do not meet the requirements of policy and management or the ecosystem service classification does not meet the specific requirements of marine and coastal systems and policies [25]. Further, the link between ecosystems providing the service and the human benefit is often not established [21]. The monetary assessment of ecosystem services in general especially remains a challenge [26,27]. Liquete et al. [28] summarize that spatial and/or temporal approaches that assess ecosystem services in seas are still rare. For the Baltic Sea, Inácio et al. [29] support this view and assume that the utilization of hydrodynamic and ecologic models will overcome existing weaknesses and increase the quality of ecosystem service assessments.
In the Baltic Sea, three-dimensional ecosystem models have a long tradition, increased in complexity, and steadily improved over the last decades [30,31]. Today, increasing computational power enables applications on large spatial scales that cover up to centuries [32,33,34,35]. These models became tools that are applied for a wide range of purposes, and it is timely to utilize these models in ecosystem service assessments [28].
Our objectives are to: (a) provide a concept that links marine ecosystem services to the output of a high resolution 3D ecosystem model and data that enable future complementary studies, using different and complementary methods; (b) provide an application that shows the potential of ecosystem service assessments, namely a spatially differentiated, large-scale application covering the entire Baltic Sea and more than a century (1870–2020); and (c) complement monetary ecosystem service assessments that enable direct comparisons between single ecosystem services and visualize the practical relevance of the results and the importance of the Baltic Sea for humans.

2. Study Site and Methods

2.1. The Baltic Sea and the Concept

We aggregated the data for 18 Baltic Sea sub-basins, covering the entire Baltic Sea (Figure 1). These sub-basins are the common assessment units as defined in the monitoring and assessment strategy of the Helsinki Commission [36]. This ensures that the results can be compared to existing assessment data and meet the societal and policy demand.
The assessment periods are the years around 1880, 1960, and 2010. These periods ensure that significant changes in the Baltic Sea took place and that long-term developments become visible. These periods are important for the European Water Framework Directive (WFD, 2000/60/EC), the main law for water protection in Europe. In the Baltic Sea, the years around 1880 can be considered as reference conditions, having a high ecological status. In the 1960s, the Baltic Sea was still in a good ecological status, defined as a slight deviation from reference conditions, while the years around 2010 represent the present state [37,38,39]. The approach is outlined in Figure 1.
The Common International Classification of Ecosystem Services (CICES) is a system for mapping, ecosystem assessment, and natural capital ecosystem accounting [19]. It is the most commonly used and comprehensive international system with close links to European environmental policies. The highest hierarchical level, the three sections, distinguishes provisioning, regulating, and maintenance, as well as cultural ecosystem services. We based our approach on structure and definitions of CICES V5.1 [40]. We focused on the lowest hierarchical level: the classes. Criteria for the selection of ecosystem services was that they can be calculated directly or indirectly from output generated by 3D ecosystem models, complemented by generally available socio-economic and historical data.

2.2. The Modelling Approach

We used the coupled circulation and biogeochemical model as presented in Neumann et al. [31]. The circulation model is the Modular Ocean Model (MOM5.1) [41] adapted for the Baltic Sea. The horizontal resolution is 3 nautical miles. Vertically, the model is resolved into 152 layers with a layer thickness of 0.5 m at the surface and gradually increases with depth up to 2 m.
The circulation model has an integrated sea ice model [42] that accounts for ice formation. The sea ice dynamics are based on [43]. The biogeochemical model called the Ecological ReGional Ocean Model (ERGOM) [31] is coupled with the circulation model via the tracer module, which is part of the MOM5.1 code.
ERGOM describes the nitrogen, phosphorus, carbon, oxygen, and partly sulphur cycles. Primary production, forced by photosynthetically active radiation (PAR), is provided by three functional phytoplankton groups (large cells, small cells, and cyanobacteria). The chlorophyll concentration in the optical model is estimated from the phytoplankton groups [31]. Dead organic matter accumulates in the detritus state variable. Bulk zooplankton grazes on phytoplankton and is the highest trophic level considered in the model. Phytoplankton and detritus can sink into the water column and accumulate in a sediment layer. Detritus is mineralized into dissolved inorganic nitrogen and phosphorus in the water column and the sediment. Mineralization is controlled by water temperature and oxygen concentration. Under oxic conditions, phosphate binds iron oxide and is retained as particles in the sediments. Erosion events can re-suspend these particles, and currents transport them toward the deposition areas. Under anoxic conditions, iron–oxide becomes reduced, and phosphate is liberated and available as dissolved phosphate. A detailed description on how this process is implemented is given in [44]. Oxygen is produced by primary production and consumed due to all other processes, e.g., metabolism and mineralization. Extracellular excretion of dissolved organic matter by phytoplankton can induce non-Redfield carbon uptake. A detailed description and validation of the model is given in Neumann et al. [31]. An overview about state variables and processes is provided in Appendix A.
The High RESolution Atmospheric Forcing Fields (HiResAFF) data set [45] was used for the atmospheric forcing in this study. Reconstructed atmospheric and riverine loads were provided by Gustafsson et al. [5]. In the same study, the HiResAFF and load data were already used and analyzed. The model output is stored as monthly means. From this data set, data for single stations and mean values for the 18 basins were extracted. The simulated data were averaged over 20-year periods: 1870–1889 (called 1880), 1950–1969 (called 1960), and 2000–2019 (called 2010). This ensured that the data are stable, really represent these periods, and are not affected by inter-annual variability. The used model simulation data for all periods and all basins are provided in Appendix B.

2.3. Data Compilation—Historical Data

We compiled data on population and tourist density for assessing the cultural ecosystem services. The ESPON Fuore webtool (2024) provides population data for the coastal areas at the NUTS 2 level and from there we extracted the coastal population for the Baltic Sea in 2010. For 1960, we resorted to EUROSTAT data at the NUTS 1 level and recalculated them based on the coastal area share of the population from 2010. To estimate the coastal population of 1880, we resorted to different sources. We derived data for the entire formerly German territory along the Baltic Sea coast from Rademacher [46]. Since the state territories were different in the past, we first calculated the population density based on the numbers from 1880 (population and area of the territories) and then extrapolated it to the area of the respective coastal NUTS 2 region. The first general census of the Russian Empire was carried out in 1897, which we took as basis for estimating the coastal population data for Latvia in 1880. For the Estonian data, we refer to the Estonian statistical office, which has published 1881 data. For Finland, Sweden, and Denmark, we recalculated the population density from data for the entire country as their territories have not changed much since 1880, based on Statistics Finland, the Swedish Statistical Database, and Statistics Denmark.
Tourism in the Baltic Sea developed in the early 19th century [47]. The first coastal resort that opened in the Baltic Sea was Heiligendamm at the German coast in 1794. In the course of the 19th century, more and more coastal resorts opened along the German coast and spread eastward to the formerly East Prussian and Russian Baltic provinces [47]. Based on the development of the coastal resorts, we can assume that Baltic Sea tourism was concentrated along the south-west and south-eastern coastal areas, from Germany to Estonia. Recorded numbers of tourists in 1880 exist for the Prussian coastal resorts (20,024 annual guests) and Jurmala (“Rigascher Strand”, 30,000 guests). For the Estonian, and for a few of the Prussian coastal resorts, recorded numbers exist from the mid-19th century, 1860, and 1880s. We took these data as basis for calculating tourist numbers in 1880. After the Second World War, the southern and eastern countries of the Baltic Sea were reorganized. In eastern Germany and Poland, the Baltic Sea became the most important, and in the Soviet Union, an important destination for mass tourism [48]. Tourism statistics from the 1960s are rare; we could only find official numbers for both German countries from official statistical books. To show the distribution of tourism around the Baltic Sea, we took the number of bed places as an indicator to be able to compare it to data from the 2010s. We used recalculation methods and literature data to arrive at numbers for 1960; the methodology is described in detail in Appendix D. For data from the 2010s, we can rely on EUROSTAT data for each NUTS2 coastal region, using the same indicator: number of bed places.
The historic riverine phosphorus loads, as well as other nutrient loads, are documented in Gustafsson et al. [5] for the years 1850–2006 and, extended in time, serve as official HELCOM data. The full historical data are provided in Appendix C. Further methodological information on population data is provided in Appendix D and on tourism data in Appendix E.

2.4. Calculations and Quantifications—Provisioning Ecosystem Services

Wild animal food and products: This service includes edible fish, seafood, fish meal, and fish oil. In the Baltic Sea, only edible fish plays a role. According to the official European Union data provided by the Scientific, Technical and Economic Committee for Fisheries, the average (2008–2012) total fish catch by EU countries in the Baltic Sea was 650,000 t/a. Including Russia, a total of 720,000 was assumed. The catch composition was sprat (52%), herring (32%), cod (9%), and others (6%) [49]. We assumed that the potential total commercially usable fish biomass directly depends on productivity, specifically the trophic level of the sea. Our calculations for total usable fish biomass are based on modelled phytoplankton concentrations. Scheffold and Hense [50] provide a phytoplankton/commercially wild fish biomass (gC/m2) ratio of 2.2. To obtain the fish wet weight, we used a carbon/dry weight ratio of 0.43 and a fish dry weight/wet weight ratio of 0.2 [51,52]. The plausibility of the ratio between total fish biomass versus the annual catch was verified against data in Thurow [53].
Wild plants and products: We focused on common reed (Phragmites australis) as the Baltic-wide distributed macrophyte species, which is mainly commercially utilized as a material for roof thatching [54]. The spatial distribution of common reed in the Baltic Sea coastal waters in 2012 was derived from the COPERNICUS database [55], where it mostly corresponded to the inland marches (code no. 71100). For each area in the sub-basins, the reed biomass was determined assuming the mean dry biomass density of 993 g/m2 in the Russian part of the Curonian Lagoon [56]. In order to hindcast reed biomass in 1860, 1980, and 2010, we assessed empirical relationships between the reed biomass in 2012 and the modelled environmental variables in 2010. The machine learning modelling approach was applied due to the relatively low sample size (18) and high number of environmental variables (15). The extreme gradient boosting was used with the “Xgboost” package in R [57]. Before the modelling, the multi-collinearity (the Spearman rank correlation—rS) among environmental variables was inspected, and several variables with high correlation (rS > 0.7) were removed, leaving in total two environmental variables for the model calibration: the amount of carbon-burial and the near-bottom water salinity. As the reed depth distribution is usually restricted to <2 m, the area of such depth was included as the additional environmental variable, which was derived from the General Bathymetric Chart of the Oceans [58] for each sub-basin using QGIS (QGIS.org 2024). The data of four sub-basins were randomly selected along the salinity gradient for the external validation of the model, while the rest sub-basins were used for the calibration of the model. The best parameters (max_depth = 2, learning rate = 0.27, nrounds = 1000, early_stopping_rounds = 3, objective = reg:squarederror, and other parameters set to their default values) of the model were assessed by the tuning of hyper-parameters (the learning rate and the maximum depth of a tree) based on the coefficient of determination (r2) and the mean absolute error (MAE). The external validation showed that the predictions of the model are in agreement (r2 = 0.51) with the estimated biomass based on the reed areas in the sub-basins but with a relatively high variance of the accuracy (MAE = ±3035 t). This model was used for the prediction of reed biomass in different years based on the environmental data from 1860 and 1980.

2.5. Calculations and Quantifications—Regulating Ecosystem Services

Water quality regulation and purification: Instead of calculating water quality regulation separately for the waterbody and the sediments, we calculated it for the two elements nitrogen and phosphorus, to ensure more reliable monetary valuations. For nitrogen, we considered the processes of nitrogen fixation, denitrification, and nitrogen burial in sediments. For phosphorus we exclusively included phosphorus burial in sediments. All data were directly extracted from the model simulation data for the individual basins.
Carbon sequestration/storage (climate regulation): This involves the carbon burial in sediments. The data were directly extracted from the model simulation data for the individual basins.
Biodiversity: We took into account the salinity dependent biodiversity after Remane [59], water transparency (Secchi depth in summer) and phytoplankton concentrations (chl.a concentrations). For salinities between 0 and 10 PSU, the Remane biodiversity (RDiv) was calculated using RDiv = 8.6607 sal2 − 130.74 sal + 571.58 and for salinities above 10 PSU the function RDiv = 8 sal + 50 was used. The Remane index between 0 and 100 was obtained using 100/330*RDiv. Chl.a concentrations indicate the state of eutrophication. For water transparency (WT) and phytoplankton concentrations (PC), it was assumed that every reduction compared to the pre-industrial environmental state (10 m Secchi depth (SD) and 1 µg/l chl.a) has negative impacts (IWT = SD*10 resp. IPC = −10*chl.a + 110). The phytoplankton concentration index between 0 and 100 was obtained by assuming that chl.a concentrations below 1 µg/L represent 100. For higher values the function IPC = −10*chl.a + 110 was used. The water transparency index (IWT) was calculated IWT = SD*10 for water transparencies below 10 m. The three indices were, equally weighted, averaged into the biodiversity index (I-Bio).
Habitats: The distribution data of the main habitat-forming macro-vegetation species (Zostera marina, Fucus vesiculosus, Furcellaria lumbricalis, and charophytes) in the Baltic Sea for the period of 2011–2016 were obtained from the HELCOM Map and data service. The same modelling approach as for the reeds was used, whereas the environmental factors included the chlorophyll-a concentration, near-bottom water salinity, and the area of <22 m depth (maximum depth limit of the species). The best parameters of the model were determined, respectively, as max_depth = 2 and learning rate = 0.26. The external validation showed that the predictions of the model are in good agreement (r2 = 0.99) with the derived area of the habitat-forming species in the sub-basins but with a relatively high variance of the accuracy (MAE = ±459 km2). This model was used for the prediction of the area of the habitat-forming species in different years based on the environmental data from 1860 and 1980.

2.6. Calculations and Quantifications—Cultural Ecosystem Services

Active recreation: According to CICES, this service encompasses outdoor activities and tourism relating to the local environment or landscape, including sports, leisure, and outdoor pursuit. Coastal tourism in the Baltic Sea is strongly influenced by summer water temperature and water quality. We assumed that tourists perceive water quality as good if water transparency is high, bathing water quality meets official requirements, and there is no visual pollution (e.g., oil or litter) or nuisances (e.g., algae or jellyfish accumulations) [60,61,62]. We calculated the modelled average summer water temperature, water transparency, recurrence intervals of cyanobacteria blooms, and riverine P-emissions (indicator for sewage) separately. The resulting indices (I) have a minimum of 0 and a maximum of 100. The indices were, equally weighted, averaged into the active recreational quality index (I-ARQ). It is assumed that only water temperatures (T) above 15 °C have relevance for bathing tourism and that the value increases linearly with increasing temperature (IT = 14.286*WT − 214). A water transparency (Secchi depth, SD) above 2 m is considered as optimal; below, a linear relationship is assumed (ISD = 50*SD). With respect to bathing water quality (BWQ), we assumed that P emissions below 1 ton per km coastline and year have no negative effects. For higher P emissions, (PE) we used IBWQ = −20*PE + 120. Cyanobacteria blooms are considered as a nuisance and problem for bathing water quality. We assumed that only algae blooms (AB) with a recurrence time (RT) of less than 10 years affect tourism and applied IAB = 43.4 ln (RT) + 0.7.
Landscape aesthetics (observational recreation): This service covers the visual quality of landscapes and ecosystems, which positively affects human well-being. The calculation of the landscape aesthetics index followed the same approach as the active recreational quality index. Parameters considered included water transparency (Secchi depth in summer) and phytoplankton concentrations (chl.a concentrations). These calculations were similar to those used for the ecosystem service biodiversity and habitats. Additionally, coastal population density (PD, habitants per km) and tourism density along the coast (TB, no. of tourist beds per km) were included to indicate the negative impacts of human activities on the environment. The calculations for the tourism index are IT = −0.1*TB + 100, and for the population index are IP = −0.01*PD + 100. The four indices were, equally weighted, averaged into the landscape aesthetics quality index (I-LAQ).

2.7. Monetarization Methods of Ecosystem Services

Wild animal food and products (commercial wild fish catches): According to official European Union data [63], the average value of fish catches in the Baltic Sea was 385/t. Different market prices in the countries around the Baltic Sea were not taken into account. Our calculations took into account the total reported catches of the Baltic Sea fleet between 2008 and 2012 of 650,000 t/a [63]. Additionally, estimated fish catches of 70,000 t/a for the Russian fleet were considered.
Water quality regulation and purification: Numerous approaches exist for calculating the monetary value of nutrient removal by natural processes in the sea. The values depend on environment targets, whether the sea or rivers are in focus, and vary significantly between different measures and calculation methods [64]. To avoid the intransparency associated with complex calculations, we decided to use the average costs for reducing one kilogram of nitrogen (EUR 30/kg N) and phosphorus (EUR 120/kg N) from sewage water according to Gren et al. [65]. Different costs in various countries and Baltic Sea basins were not considered.
Wild plants and products: The monetary value for the predicted reed biomass was defined based on roof thatching (for all house types), where the mean cost of reed stems packed in uniform-length bundles (1 m2 = 1 t) is 51 Euros [54]. It was assumed that 10% of the total biomass can be annually harvested.
Carbon sequestration/storage (climate regulation): The monetary valuation is based on the prices of the CO2 emission rights in the European Emissions Trading System (EU-ETS) [66]. The costs of a CO2-certificate per ton were EUR 15 (EUR 0.055/kg C) in 2010 and already EUR 90 (EUR 0.33/kg C) in 2023.
Active recreation: HELCOM [9] provides a Baltic Sea-wide monetary value of tourism at EUR 14,790 million per year, based on recreational trips from 2010 [67]. The value added at factor costs from coastal tourism accommodation of 2015 according to [9] is EUR 4797 million per year. For 2010, we assumed a total sum of EUR 18990 million per year. To obtain spatially differentiated data for the basins, we allocated this value to the number of tourist beds per km coastline in the periods 1880, 1960, and 2010. Regional economic differences were not taken into account due to a lack of data. The monetary value of recreational fisheries was calculated separately. For Sweden, Hakanson et al. [68] provide a rough monetary value of recreational fisheries at EUR 250 million per year. The Coalition Clean Baltic [69] provides an overview of recreational anglers in the Baltic Sea region. Based on this data, we assumed a total value of recreational fisheries of EUR 1000 million per year for the entire Baltic Sea region. To obtain spatially differentiated data for the basins, we used the total population per km of coastline in the periods 1880, 1960, and 2010 and calculated a value per habitant.
Landscape aesthetics (observational recreation): Czajkowski et al. [67] provide an updated calculation of the recreational benefits of the Baltic Sea and its coasts using a modified method but still related to the survey carried out in 2010. We assumed that the difference between the new value of EUR 27,500 million per year and the earlier value of EUR 14,790 million per year indicates the total value of landscape aesthetics and observational recreation in the Baltic Sea region. This ensures that the total value of active and observational recreational services is in agreement with the present state of art in literature.

3. Results

3.1. Model Simulations

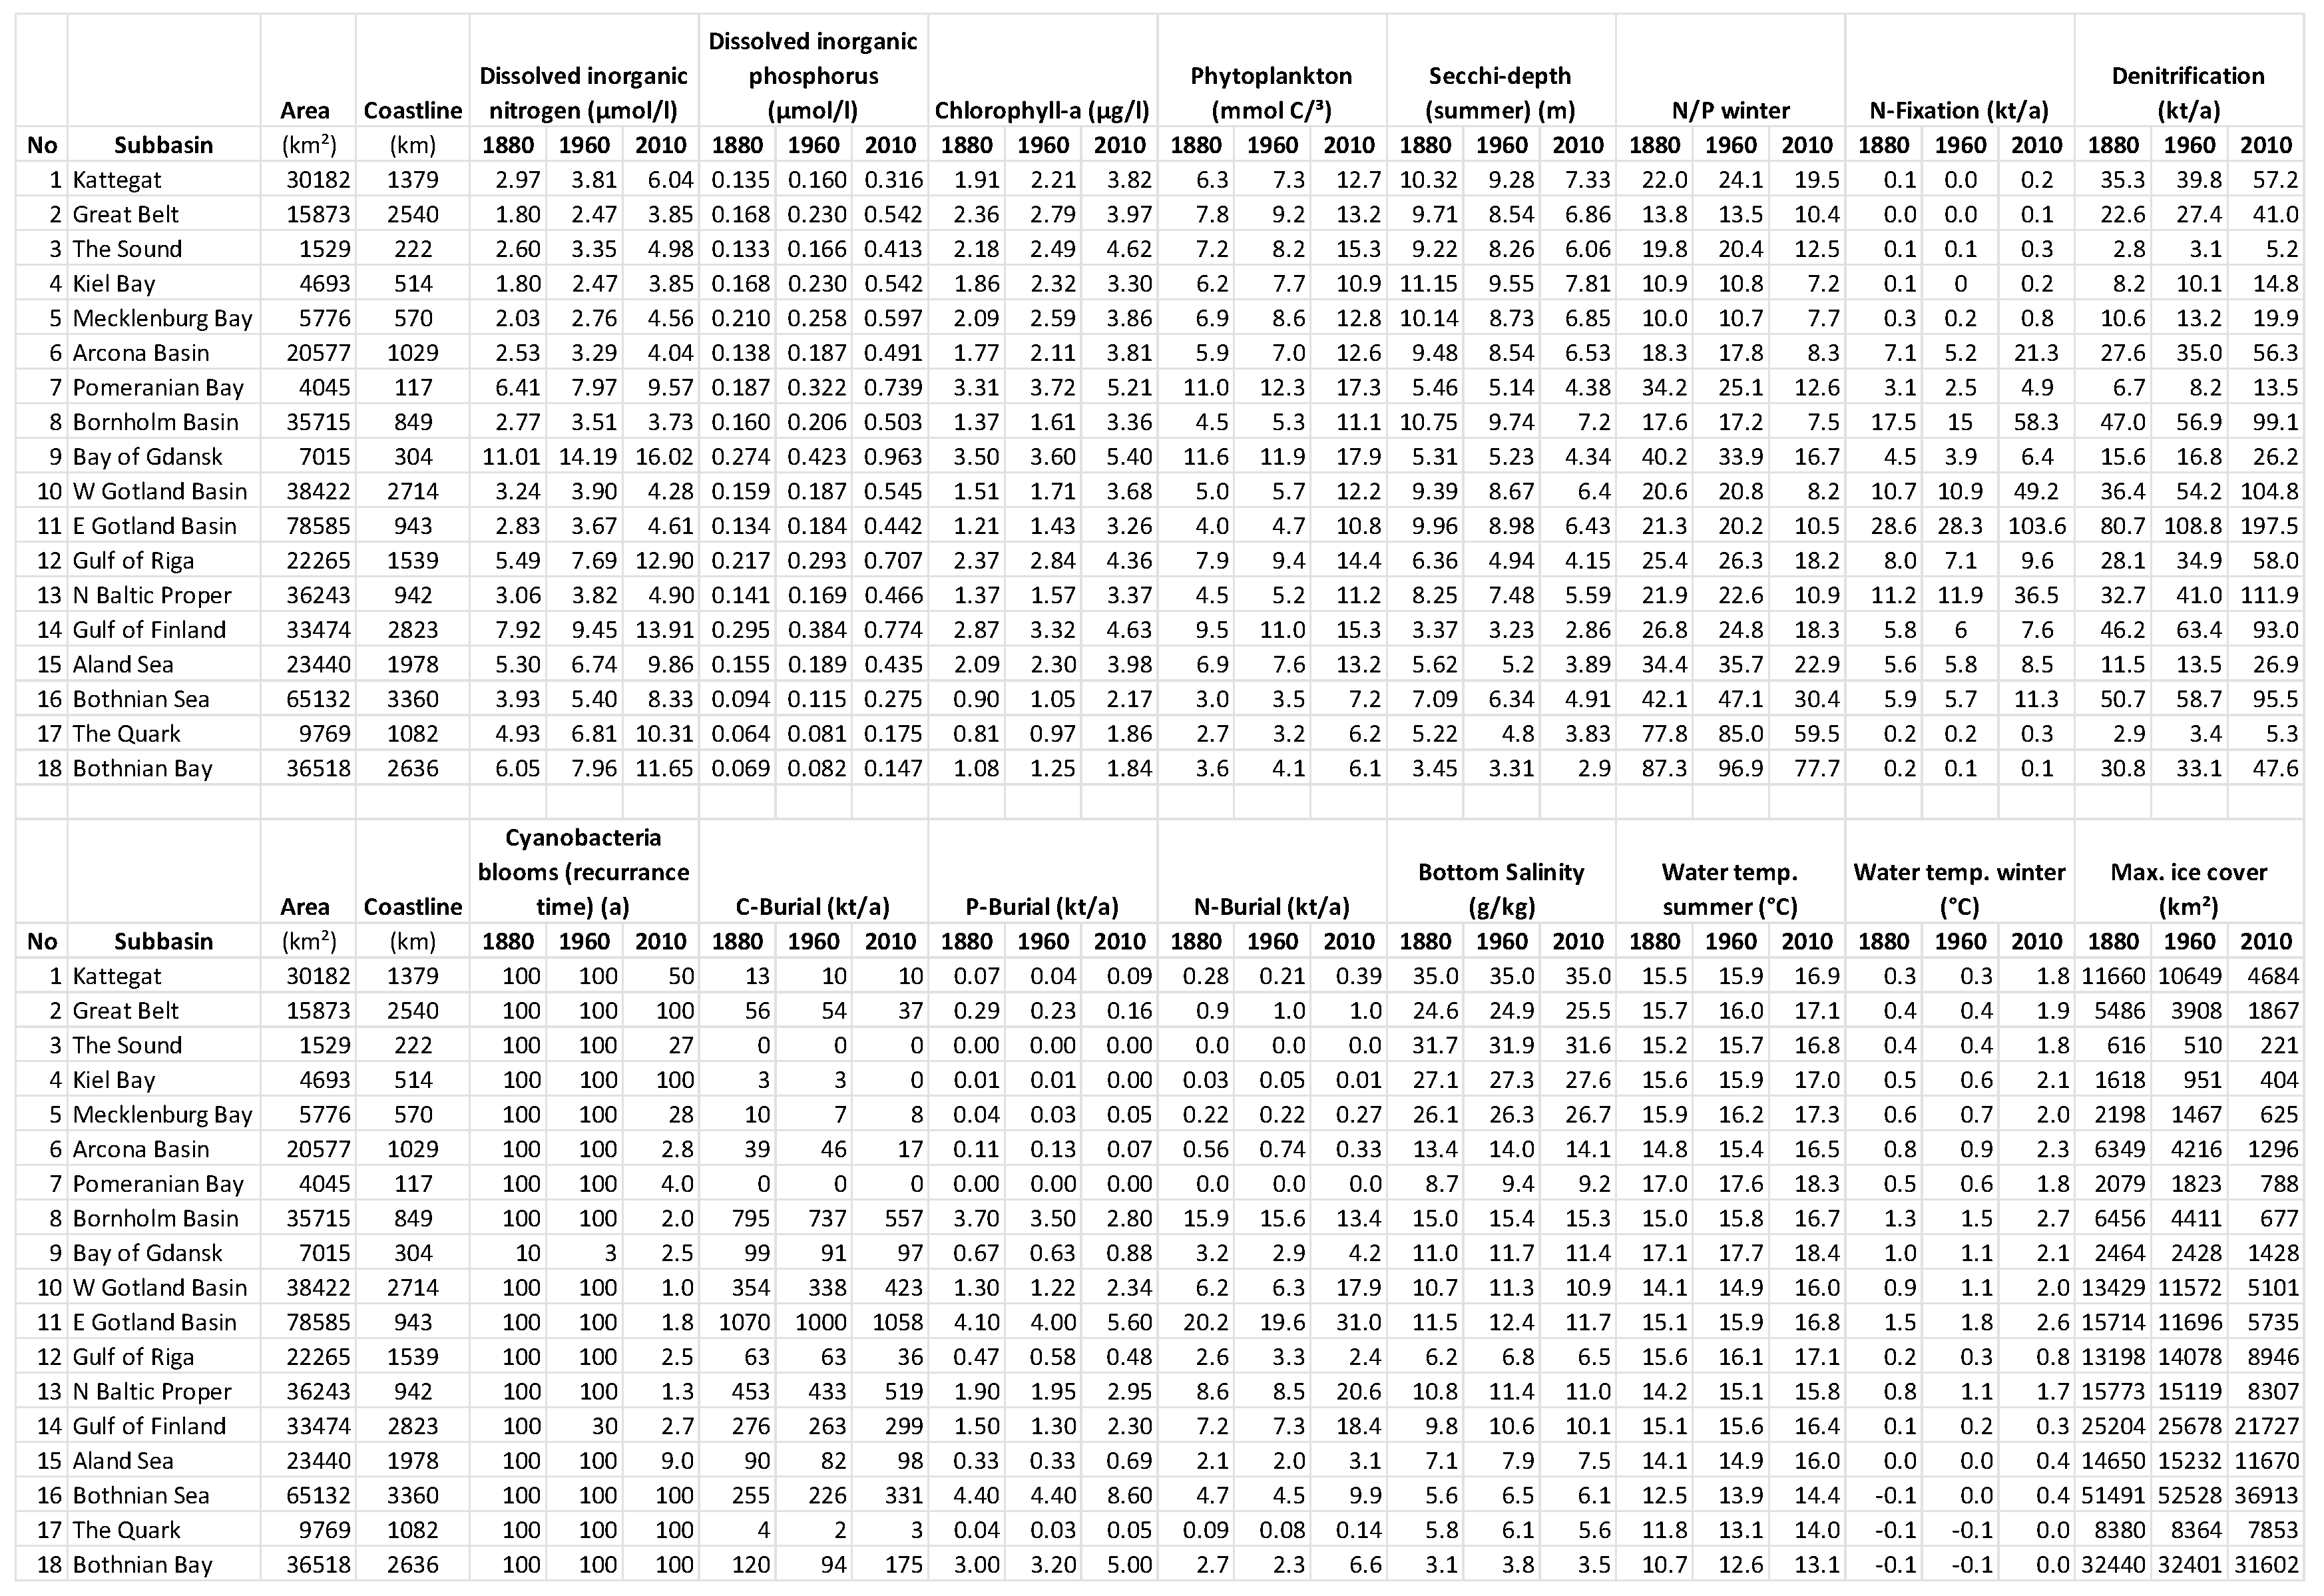
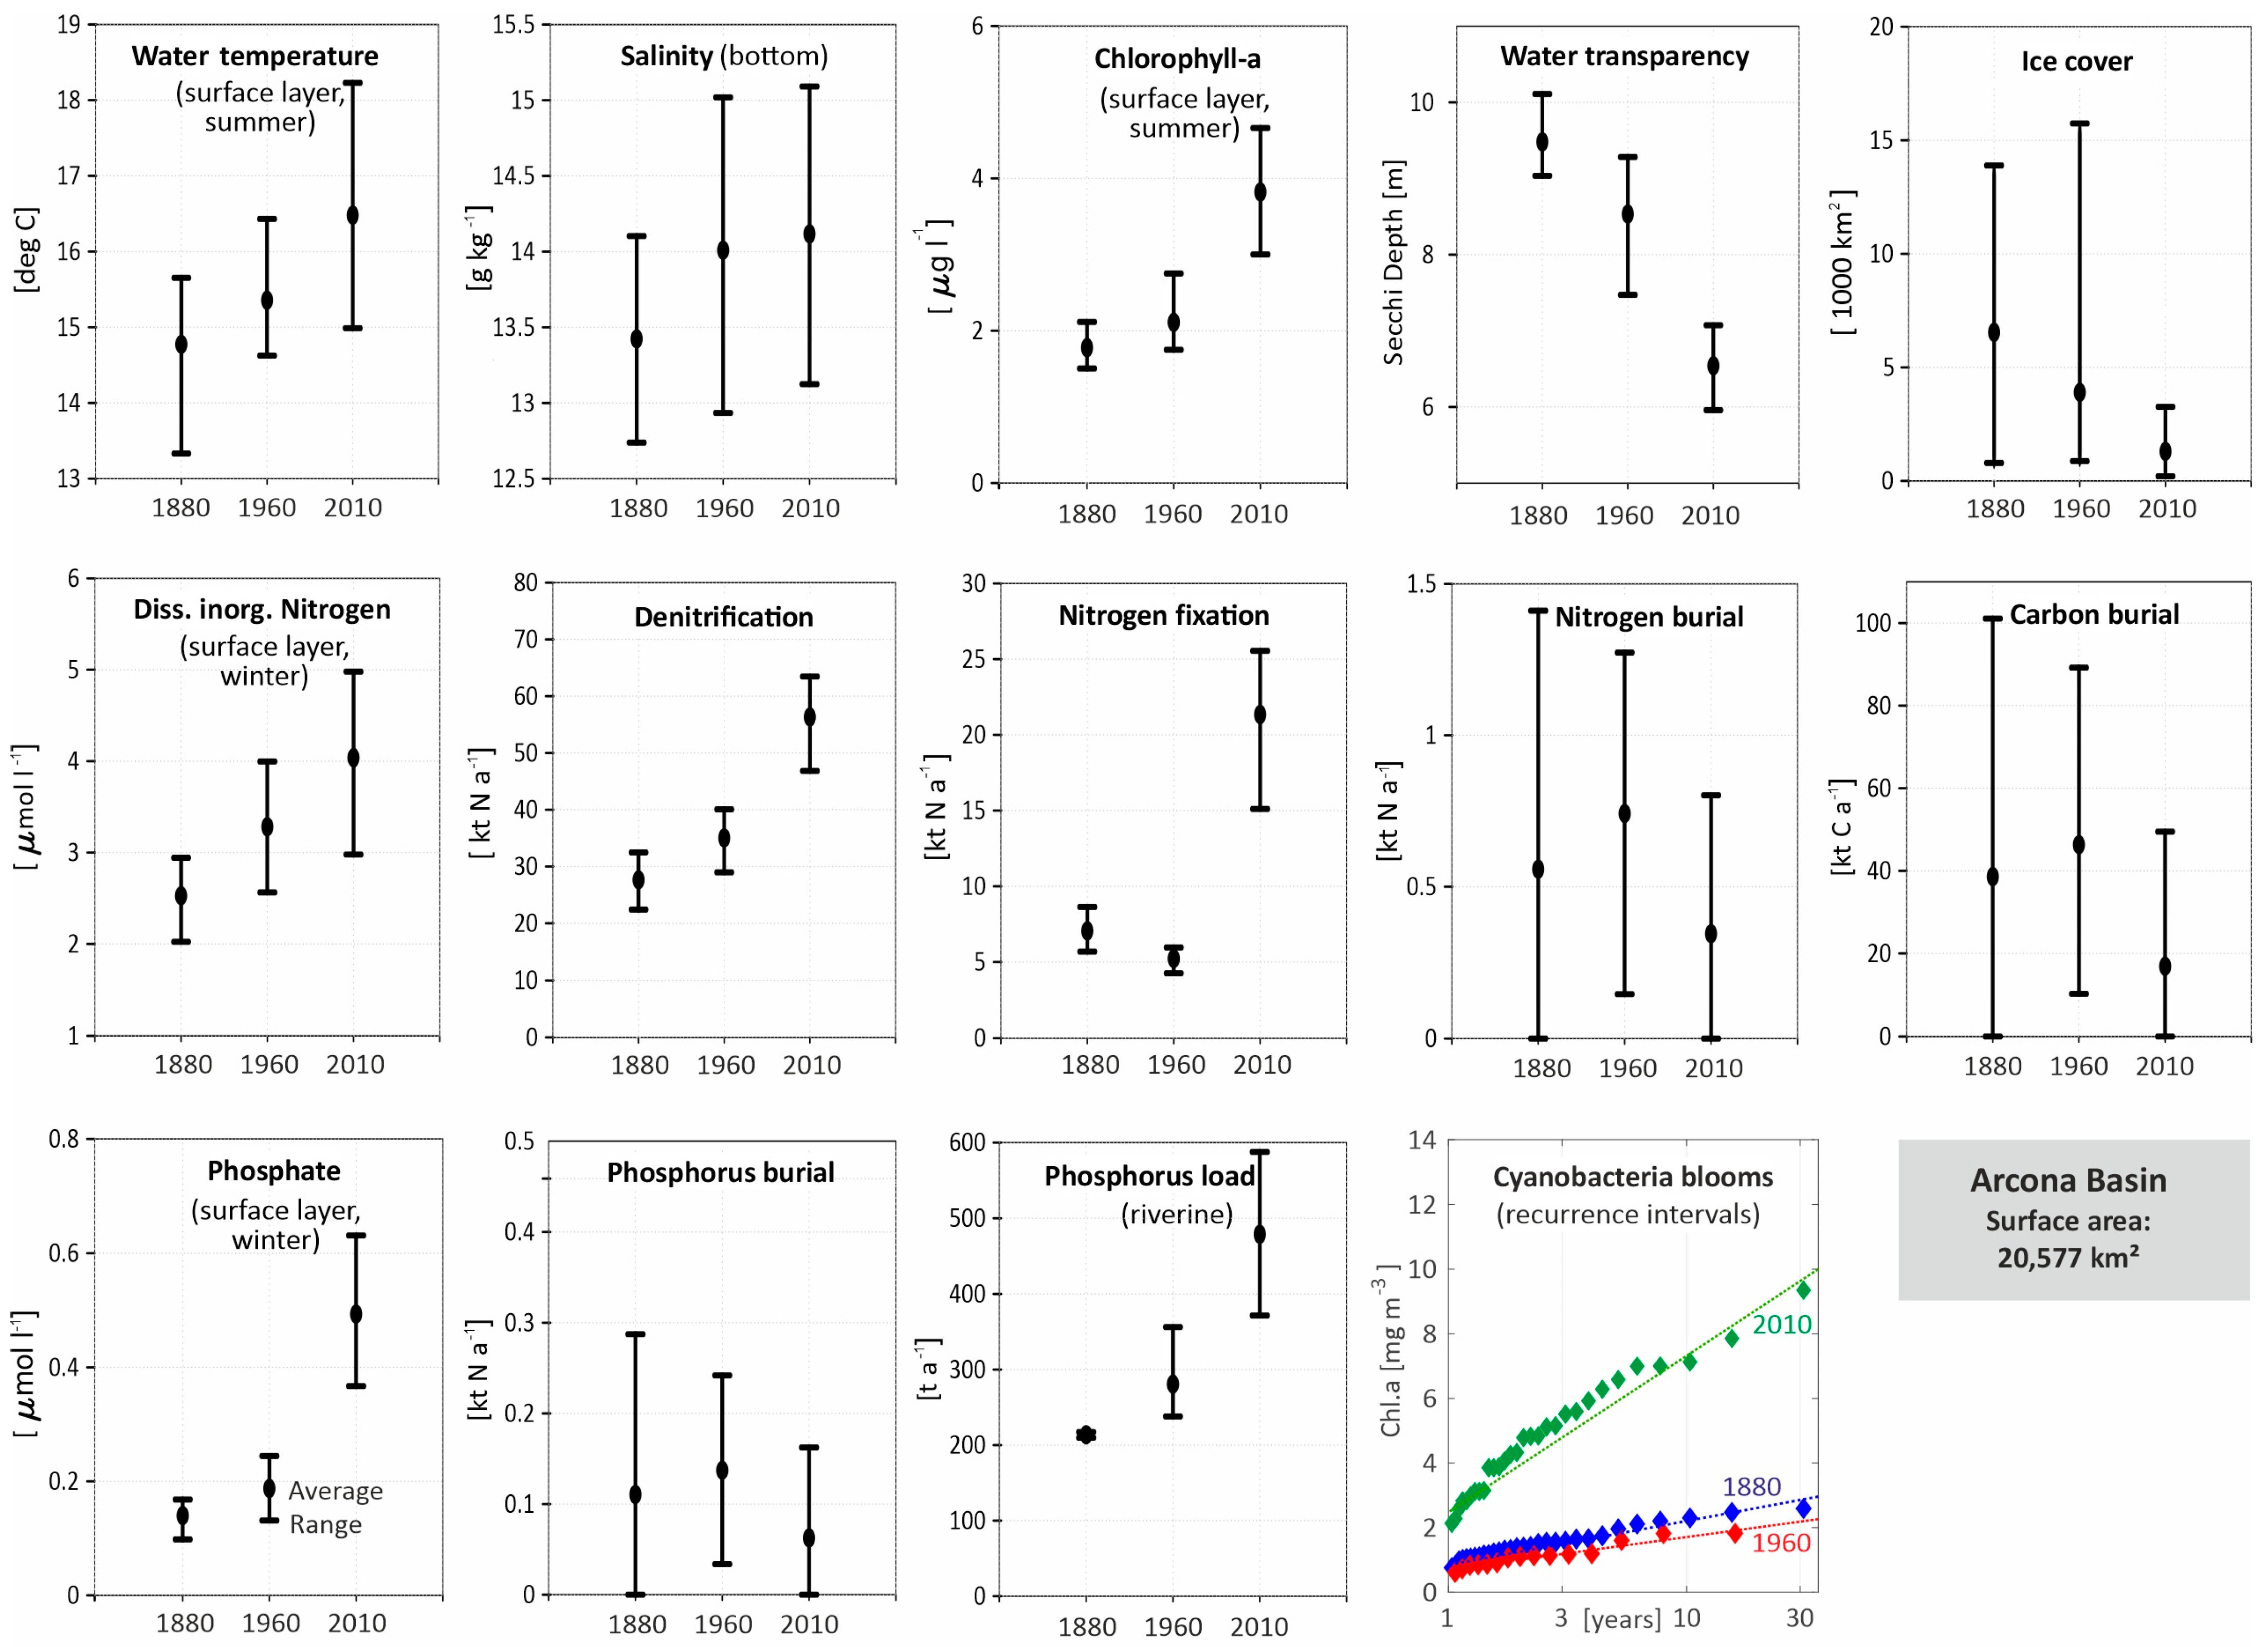
The general model performance and results are reported in Neumann et al. [31]. The aggregated model simulation data for the 18 Baltic basins and the 20-year time periods representing 1880, 1960, and 2010 are fully documented in Appendix B. Data of the most important model output parameters, including the range of the average annual data, are exemplary shown for the Arcona Basin (Figure 2). The general trends are comparable in the other basins. The average values over the entire Baltic Sea surface area clearly indicate an increased eutrophication during the century. The winter surface layer concentrations of dissolved inorganic nitrogen (phosphorus) increased from 4.0 (0.15) µmol/L in 1880 to 7.3 (0.45) µmol/L in 2010. This caused an increase in summer phytoplankton concentrations, indicated by increased chlorophyll concentrations from 1.6 to 3.35 µg/L and a decreased summerly water transparency from 7.9 m to 5.44 m. Nitrogen became less abundant in the sea and the winter N/P ratio that dropped from 31 in 1880 to 21 in 2010.
Climate change is well visible in the model data. The average surface water temperatures in summer and winter increased and the average annual maximum ice cover decreased from 19,757 km2 (49% of the surface area) in 1880 to 12,837 km2 (32% of the surface area) in 2010. The bottom salinity was largely stable with 11.9 g/kg in 1880, 12.5 g/kg in 1960, and 12.2 g/kg in 2010.

3.2. Historical Data

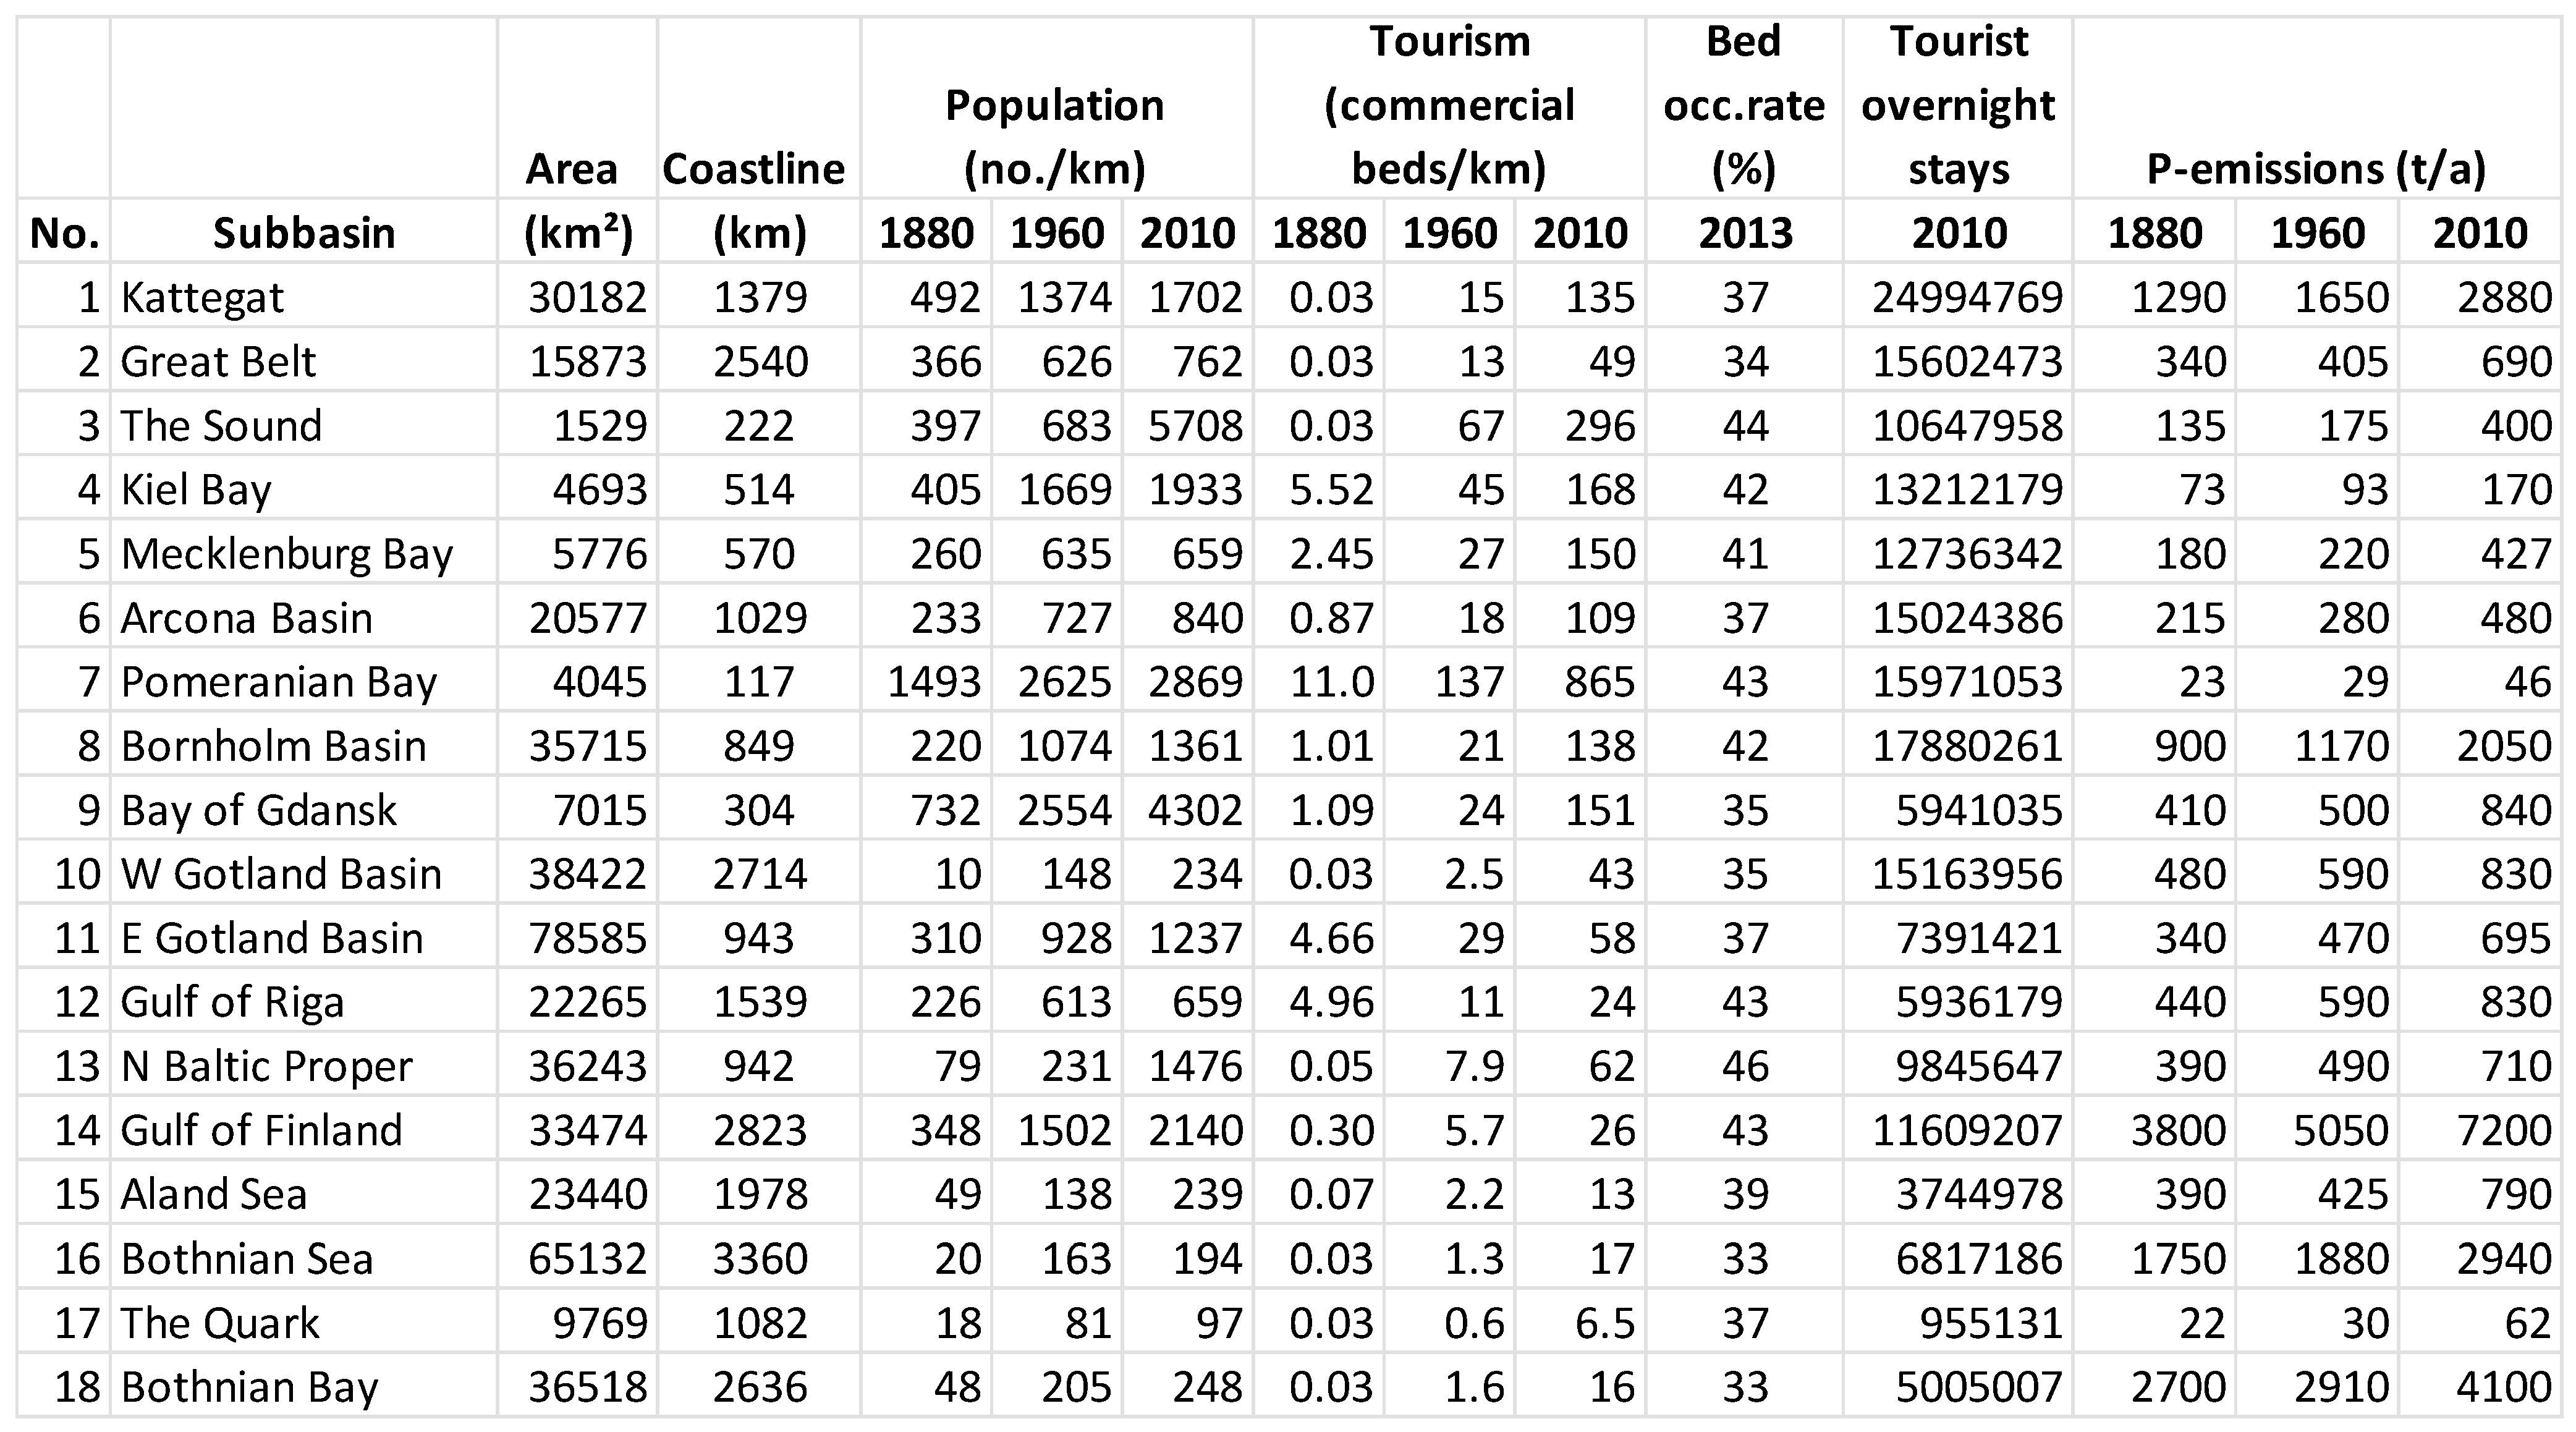
Socio-economic data, including coastal population and tourism numbers for the years 1880, 1960, and 2010, were compiled from various sources. According to these sources, the coastal population in the Baltic Sea region increased from 4.9 million in 1880 to 15.7 million in 1960, reaching 22.7 million in 2010. The number of tourist beds rose from approximately 21,000 in 1880 to 256,000 in 1960, and 1.4 million in 2010. In 2013, bed occupancy rates varied among the Baltic Sea basins, with rates as low as 33% in the Bothnia Sea and Bay due to short summers, and above 40% in basins dominated by major cities. Applying these occupancy rates to the number of tourist beds in 2010 results in nearly 200 million annual tourist overnight stays in the entire Baltic Sea region. While the Baltic coastal population increased by a factor of 4.6 between 1880 and 2010, tourism grew by a factor of 66, underscoring the rising importance of tourism in the Baltic Sea region.
Phosphorus emissions are used as an indicator of the wastewater pollution in the Baltic Sea, which significantly affects hygienic water quality. These data are documented in Appendix C. Between 1880 and 2010, phosphorus emissions doubled from 13,878 t/a to 26,140 t/a. The relative increase in emissions is much lower than the population growth, reflecting the steady improvement in both the quantity and quality of water treatment over the past decades. Additionally, the data reflect changes in agricultural fertilization intensity and practice.

3.3. Provisioning Ecosystem Services

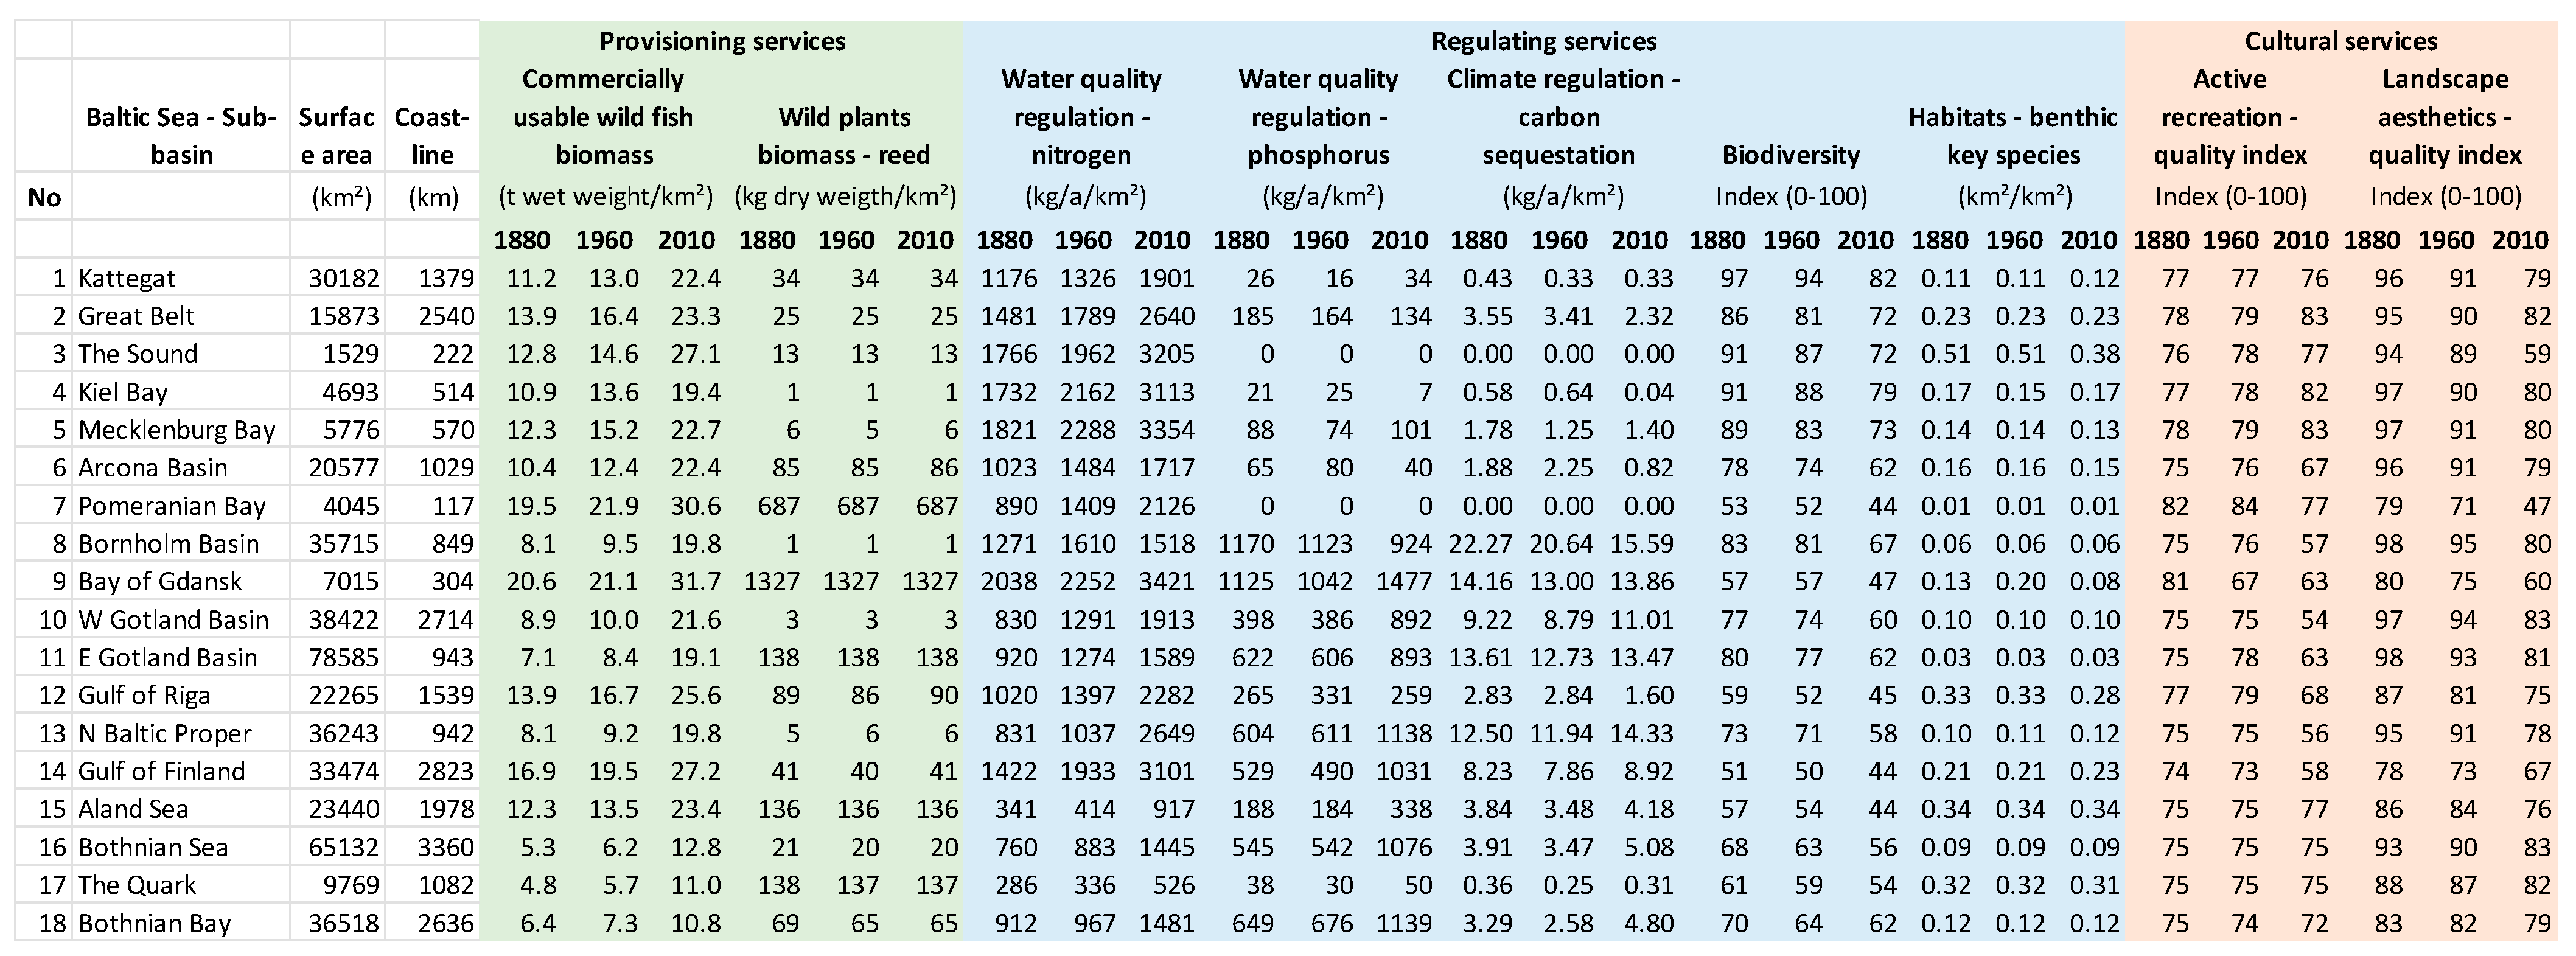
Wild animals (commercially usable wild fish stock biomass): Around 2010, the total commercially usable fish biomass in the entire Baltic Sea was about 19.7 t wet weight/km2, amounting to a total biomass of 9.24 million tons (Figure 3). In 2010, the highest biomass value was calculated for the Bay of Gdansk (31.7 t wet weight/km2), while the lowest value was in the Bothnian Bay (10.8 t wet weight/km2). These figures reflect the productivity levels of the basins and their proximity to major nutrient inputs. For 1960 and 1880, the values were lower, at 10.9 resp. 9.4 t wet weight/km2 for the entire Baltic Sea. In 1880, the highest value was again in the Bay of Gdansk (20.6 t wet weight/km2), while the lowest was in the Quarks (4.8 t wet weight/km2).
Wild plants (commercially usable reed biomass): For 2012, we obtained a total commercially usable reed biomass of about 38.1 thousand tons for the entire Baltic Sea. The predicted biomass in the Curonian Lagoon (9.9 thousand t) corresponded to the estimates (8.3 thousand t) by Senasis [70]. For 1880 and 1960, the predicted biomass values were lower, respectively, 38.2 and 37.9 thousand tons for the entire Baltic Sea. In the Curonian Lagoon, this could be explained by more than twice the lower reed extent in 1986 than in 1949 [70]. For several sub-basins, the biomass predictions were significantly (several times) underestimated (Bornholm Basin and Bay of Gdansk) or overestimated (Kattegat, Kiel Bay, Gulf of Finland, and Bothnian Bay). These predictions were proportionally corrected by the surrounding sub-basins.

3.4. Regulating Ecosystem Services

Water quality regulation—nitrogen (N): Our model results indicate that nitrogen fixation in the entire Baltic Sea was 109,000 t N/a in 1880, decreased to 102,900 N t/a in 1960 and increased to 319,200 N t/a in 2010 (Figure 3). The average N-fixation rate in 2010 was 680 kg N km−2 a−1. The winter N/P ratio in the surface water of the entire Baltic Sea decreased from 31 in 1880 to 21 in 2010. During eutrophication, the relative abundance of phosphorus increased, which favored summerly nitrogen shortages in the open sea, leading to increased compensatory N-fixation.
Denitrification in the Baltic Sea increased from 496,400 t N/a in 1880, to 621,500 t N/a in 1960 and reached 1,073,700 t N/a in 2010. The average denitrification rate in 2010 was 2288 kg N km−2 a−1. The nitrogen loss via denitrification over-compensated for the increased N inputs via N-fixation. Nitrogen burial in sediments, the third process that affects the total N-balance in the Baltic Sea, was 75,483 t N/a in 1880, slightly decreased to 74,590 t N/a in 1960, and increased strongly to 129,635 t N/a in 2010 with the sea’s increased productivity. The average burial rate in 2010 was 276 kg N km−2 a−1. The total N-balance of all three processes was 462,882 t N/a in 1880, 593,190 t N/a in 1960, and increased to 884,135 t N/a in 2010. The Baltic Sea’s function as a nitrogen sink increased, with the average total cleaning rate in 2010 being 1884 kg N km−2 a−1. The contributions of different basins vary strongly. While the Quark and the Åland Sea show relatively low total N-purification rates of 526 kg N km−2 a−1 and 917 kg N km−2 a−1, respectively, coastal bays such as the Bay of Gdansk or the Mecklenburg Bay reached values of 3421 kg N km−2 a−1 and 3354 kg km−2 a−1, respectively. These numbers clearly indicate the high self-cleaning purification ability of the Baltic Sea from excessive inputs of eutrophication active nutrients, such as nitrogen.
Water quality regulation—phosphorus (P): Burial in sediments is the only retention process for phosphorus in the sea. The burial rate was 21,931 t P/a in 1880, 21,580 t P/a in 1960, and increased to 32,058 t P/a in 2010 (Figure 3). In 2010, no phosphorus burial took place in the Sound and the Pomeranian Bay, while the highest values were calculated in the Bothnian Bay and Bothnian Sea with 140 kg P km−2 a−1 and 132 kg P km−2 a−1, respectively. The average burial rate in the entire Baltic Sea was 68 kg P km−2 a−1. In the western Baltic basins, the rates remained largely stable over time and even decreased in some basins such as the Great Belt or the Bornholm Basin over the last 130 years. The N/P-ratio in buried sediments increased from 3.8 to 4.7 during the last 130 years. Compared to the N/P Redfield weight ratio of 7, relatively more phosphorus is stored in sediments. As the ratio increased over time, the share of nitrogen slightly increased.
Carbon (C) sequestration (carbon burial in sediments): The total burial of carbon in Baltic sediments remained relatively stable over the last century. It was 3,698,900 t/a C in 1880, slightly decreased to 3,450,400 t/a C in 1960, and increased again to 3,668,100 t C in 2010 (Figure 3). The differences between the basins are very large. For instance, the Sound showed no carbon burial as well as in the Kattegat, close to the North Sea, and in the shallow Quark, the values were below 0.4 t C km−2 a−1. In contrast, deep central basins consistently showed values above 10 t C km−2 a−1. For example, in 2010, the Northern Baltic Proper had a value of 14.3 t C km−2 a−1, and the Eastern Gotland Basin had 13.5 t C km−2 a−1. The Bornholm Basin showed the highest value in 2010, with 15.6 t C km−2 a−1, although it was even higher in 1880 at 22.3 t C km−2 a−1. These changes likely result from spatio-temporal shifts of nutrient inputs between the basins.
Biodiversity: The Baltic Sea-wide average biodiversity index decreased from 73 in 1880 to 70 in 1960 and 60 in 2010 (Figure 3). The main reasons for this decline are increasing eutrophication and decreasing water transparency. Salinity did not show Baltic-wide changes, so the Remane index remained between 52 and 53. However, the Bothnian Bay’s Remane index showed a strong decrease over time, from 76 in 1880 to 61 in 1960 and slightly increased to 67 in 2010. Significant changes were also observed in other northern basins, namely the Bothnian Sea and the Quark.
The highest biodiversity index value (aggregated eutrophication and Remane indices) was calculated for the Kattegat, with 97 in 1880 and 83 in 2010, due to its high salinity and water exchange with the North Sea. In 2010, the lowest values were found in the shallow coastal basins (Pomeranian Bay, Åland Sea, Gulf of Gdansk) and in the Gulf of Finland, ranging from 44 to 45 units. The Sound and the deep central basins, such as the Western and Eastern Gotland Basins showed the strongest decrease in the biodiversity index (16–17 units). In contrast, the northern basins, including the Bothnian Bay, the Quark, and the Gulf of Finland, showed the smallest decrease of seven units.
Habitats: For 2011–2016, we obtained a total area of submerged habitat-forming species of about 60,800 km2 for the entire Baltic Sea. For 1880 and 1960, the predicted areas were, respectively, 62,000 km2 and 62,400 km2 for the entire Baltic Sea. The higher habitat area than during 2011–2016 could be explained by a lower level of eutrophication and higher transparency of water for macro-vegetation distribution [71]. Appendix F shows the full data that served as the source for the figures.

3.5. Cultural Ecosystem Services

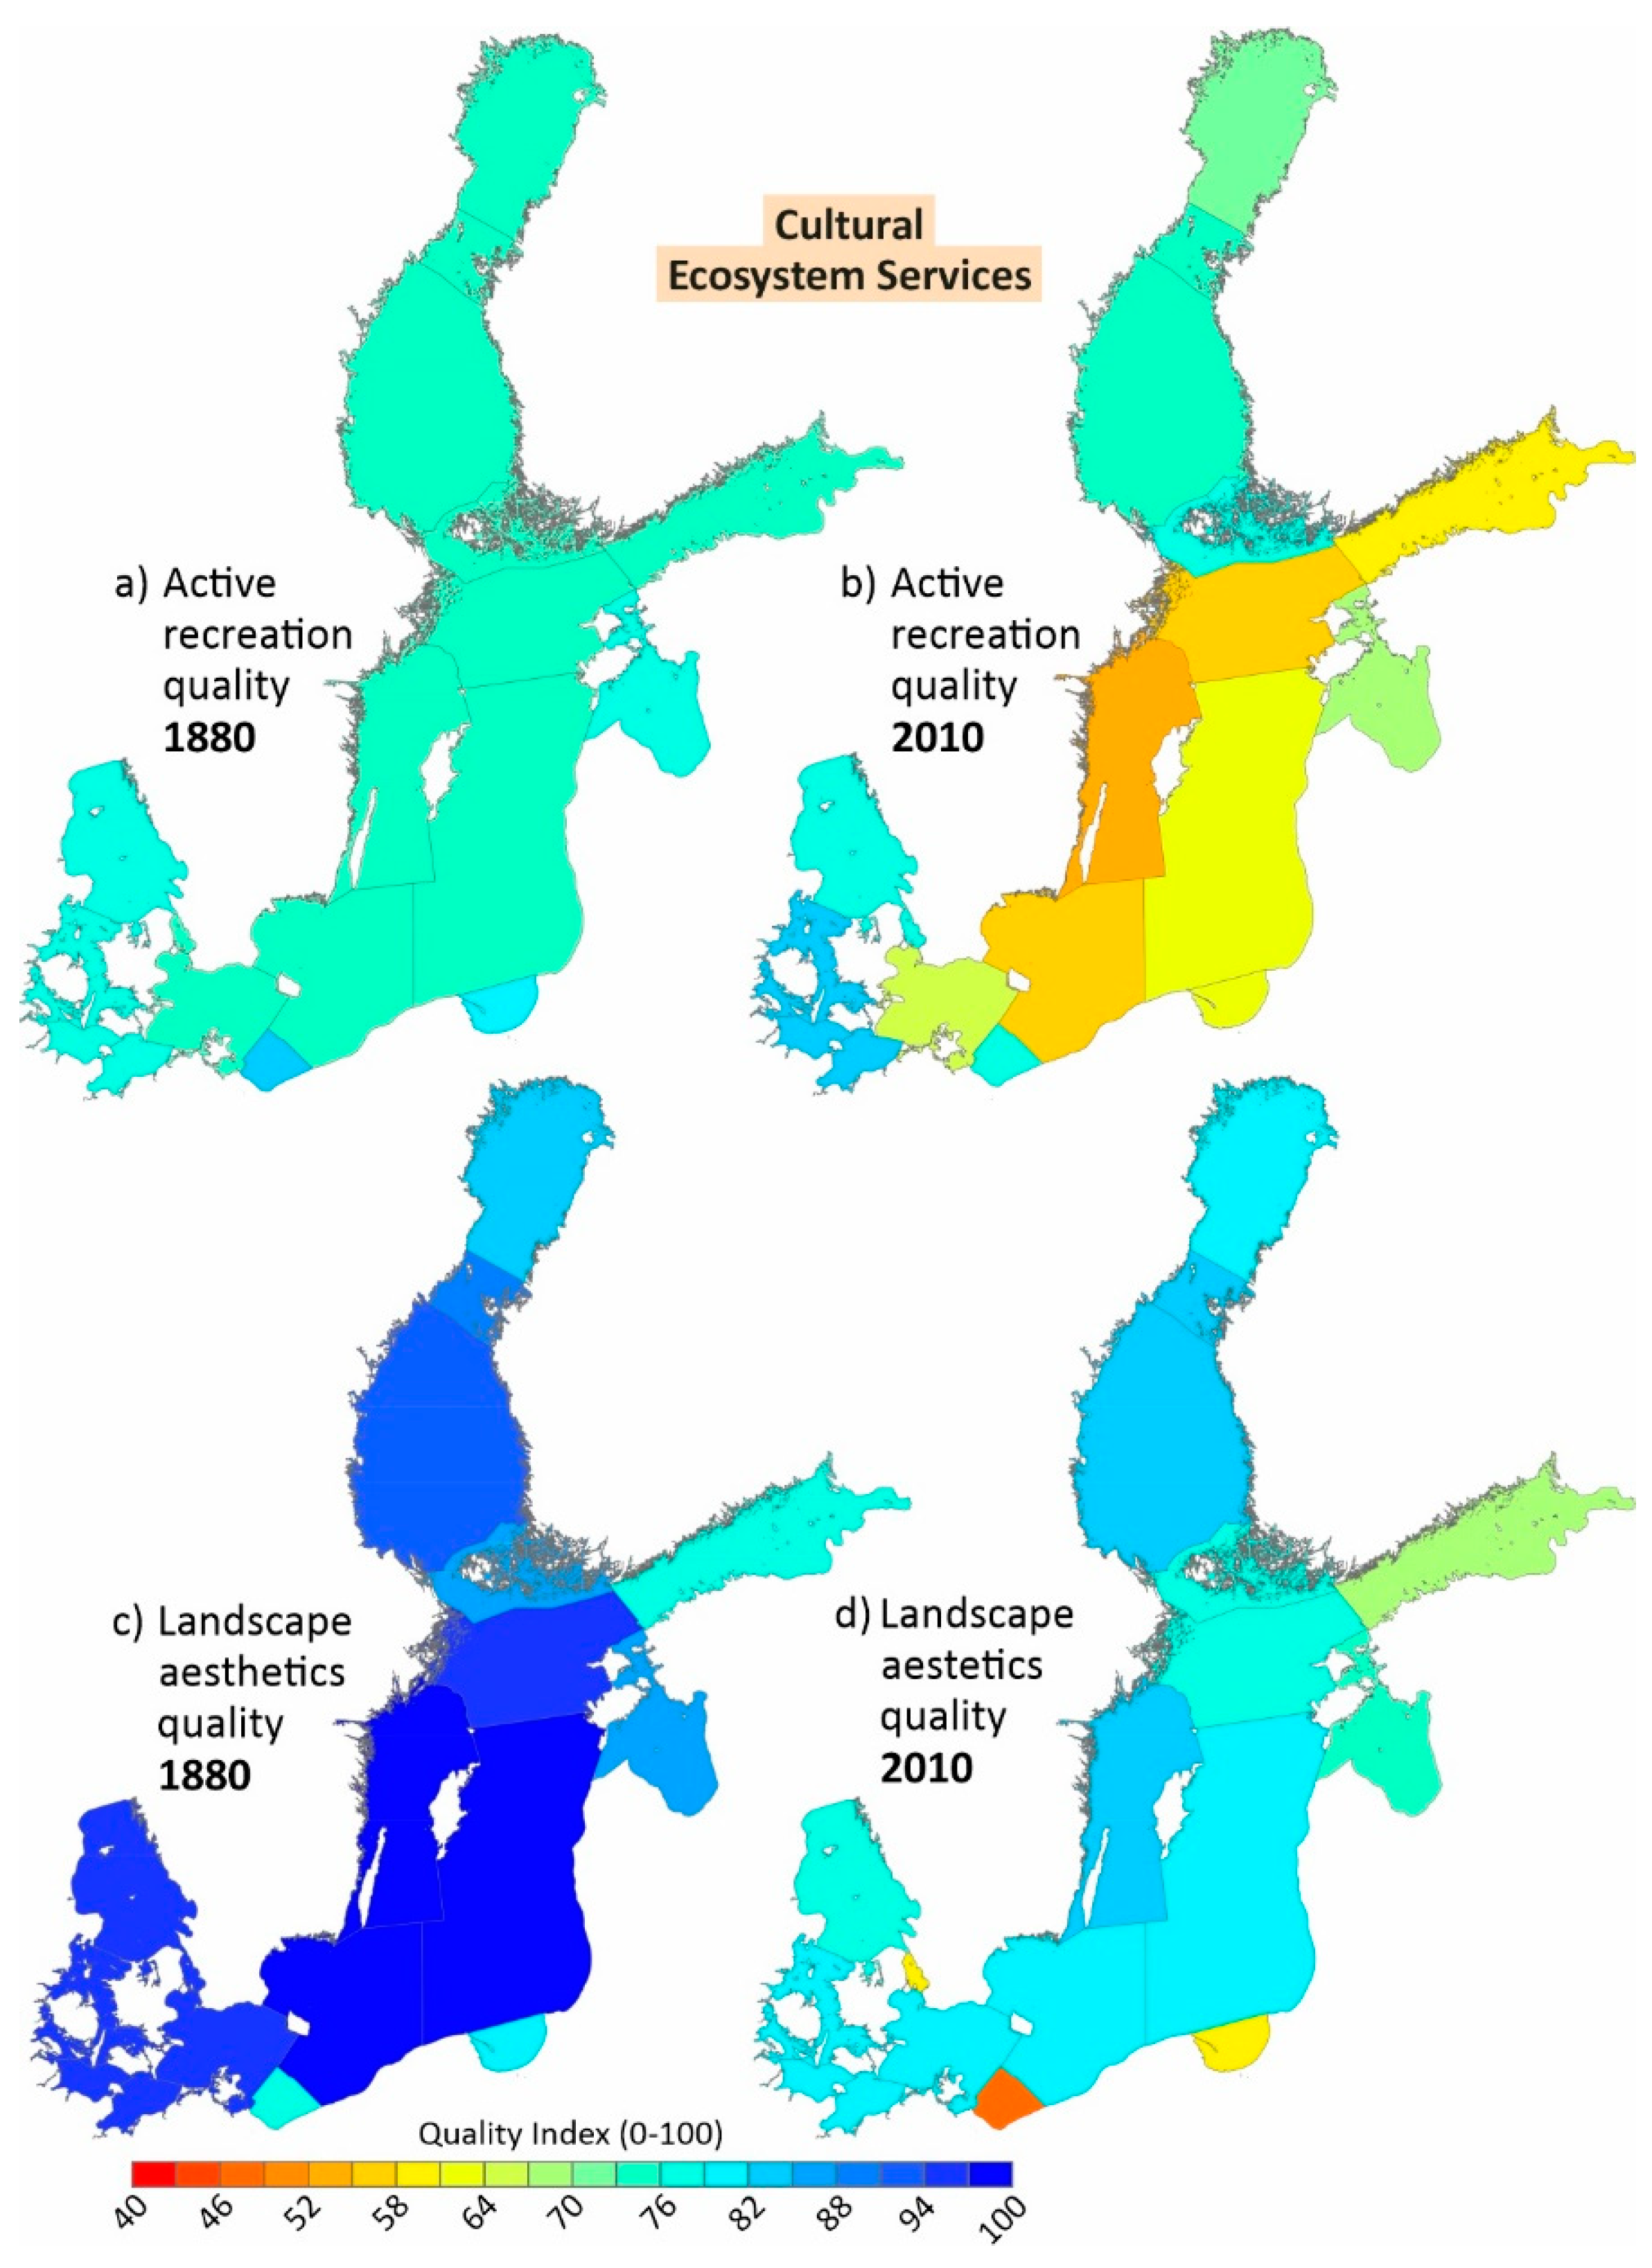
Active recreation: In 1880, the active recreational quality index within the Baltic Sea ranged between 75 and 82 (Figure 4). The values were significantly influenced by summer surface water temperatures, which were not conducive to bathing in the northern Baltic basins. Water transparency, algae blooms, and microbial pollution, indicated by external P-emissions, reached values of 100 or close to it, thereby not diminishing the recreational value of the waters. By 2010, the values in the Baltic Sea exhibited a wider range, from 54 to 83. The primary reason for the increased index values was the rise in summer surface water temperatures across all basins. The Baltic-wide average increased from 14.2 °C in 1880 to 15.1 °C in 1960 and reached 16 °C in 2010. The highest temperatures were calculated in the Bay of Gdansk (18.4 °C) and the Pomeranian Bay (18.3 °C) and the lowest in the Bothnian Bay (13.1 °C). Conversely, increased algal blooms and decreased microbial bathing water quality reduced the index in 2010. In the Western Gotland Basin, the index dropped from 75 in 1880 to 54 in 2010, primarily due to annual algae blooms. In the Bay of Gdansk, despite the highest water temperatures, the index fell from 81 in 1880 to 63 in 2010 because of algae blooms and declining microbial bathing water quality. The Baltic Sea-wide average of the recreational quality index remained stable at 76 between 1880 and 1960, but declined to 69 by 2010. However, some basins, such as the Kiel Bay, the Mecklenburg Bay, and the Great Belt, demonstrated increases of 5 units, reaching values between 82 and 83.
Landscape aesthetics (observational recreation): The landscape aesthetics index combines environmental parameters such as water transparency and eutrophication with anthropogenic coastal pressure parameters such as coastal tourism and population density. Baltic Sea-wide, this index declined from 91 in 1880, to 87 in 1960, and to 78 in 2010 (Figure 4). In 1880, index values ranged from 78 in the Gulf of Finland to 98 in the Eastern Gotland Deep. By 2010, the range widened, with values between 47 in the Pomeranian Bay and 83 in the Bothnian Sea and the Western Gotland Deep. The Sound experienced the most significant decline, dropping 35 points from 94 in 1880 to 59 in 2010, mainly due to a substantial increase in coastal population. The landscape aesthetics index in the Sound decreased by 53 points from 96 in 1880 to 43 in 2010. The Pomeranian Bay also demonstrated a significant decline of 32 points, largely due to increased tourism. In contrast, the Bothnian Bay experienced the smallest decline, from 83 in 1880 to 79 in 2010. The relatively poor water transparency in this remote northern basin, with a transparency index ranging between 35 and 29, limited higher values for the landscape aesthetics index.

3.6. Monetarization Results of Ecosystem Services

Wild animals (commercial wild fish catches): In 2010, the average annual monetary value of the commercial wild fish catches in the Baltic Sea was EUR 590 km2 a−1, with the highest value recorded for the Bay of Gdansk (EUR 952 km2 a−1) and the lowest for the Bothnian Bay (EUR 323 km2 a−1) (Figure 5). Historical data for 1880 and 1960 adjusted to 2010 market prices by STECF [63] are provided in Appendix G. The total monetary value of commercial fish catches in the entire Baltic Sea increased from EUR 132 million in 1880 to EUR 277 million in 2010. This increase is attributed to eutrophication, which led to higher nutrient inputs and, consequently, increased sea productivity.
The monetary value of the harvestable reed biomass is about EUR 5000 km2 a−1. Related to the surface area of the basins, the values are below EUR 1 km2 a−1. Exceptions are the Bay of Gdansk (EUR 6.8 km2 a−1) and Pomeranian Bay (EUR 3.5 km2 a−1).
Water quality regulation—nitrogen (N): In 2010, the total monetary value of the nitrogen purification in the Baltic Sea, resulting from the balance between N-fixation, denitrification, and N-burial in sediment, was EUR 26,882 million/a (Figure 5). Using the recent average sewage treatment cleaning costs of EUR 30/kg N for 2010, the estimated values for previous years are EUR 17,996 million/a for 1960 and EUR 14,042 million/a for 1880. Over the last 130 years, increasing eutrophication raised the monetary value of self-cleaning to EUR 12,780 million/a. The 2010 values vary significantly between basins, exceeding EUR 100,000 km−2 a−1 in the Bay of Gdansk, the Bothnian Sea, and the Bothnian Bay. The average value for the entire Baltic Sea is EUR 57,159 km−2 a−1.
Water quality regulation—phosphorus (P): In 2010, the total monetary value of the phosphorus purification of the Baltic Sea, achieved through burial in sediment, was EUR 3854 million/a (Figure 5). Using the cleaning costs of EUR 120/kg P for 2010, the estimated values are EUR 2594 million/a for 1960 and EUR 2,637 million/a for 1880. These values also differ significantly between basins, exceeding EUR 15,000 km−2 a−1 in the Bay of Gdansk and the Mecklenburg Bay. The average value for the entire Baltic Sea is EUR 8213 km−2 a−1.
The monetary value of N and P water quality regulation across the Baltic Sea is EUR 65,372 km−2 a−1, with 87% of this amount attributed to nitrogen retention. This highlights the monetary importance of the Baltic Sea as a sink and purification system, particularly for nitrogen. This function is crucial for nutrient loads to and eutrophication of the North Sea.
Carbon sequestration (carbon burial in sediments): The monetary value of carbon burial is highly dependent on political frameworks. For 2010, CO2-certificates costs were set at EUR 15/t CO2 (or EUR 55/t C). In 2010, the total monetary value of carbon burial for the entire Baltic Sea was EUR 202 million/a (Figure 5). Due to an increase in CO2, certificates costs to EUR 90/t CO2 (or EUR 330/t C) by 2023, the monetary value of carbon burial in 2023 would be EUR 1,210 million.
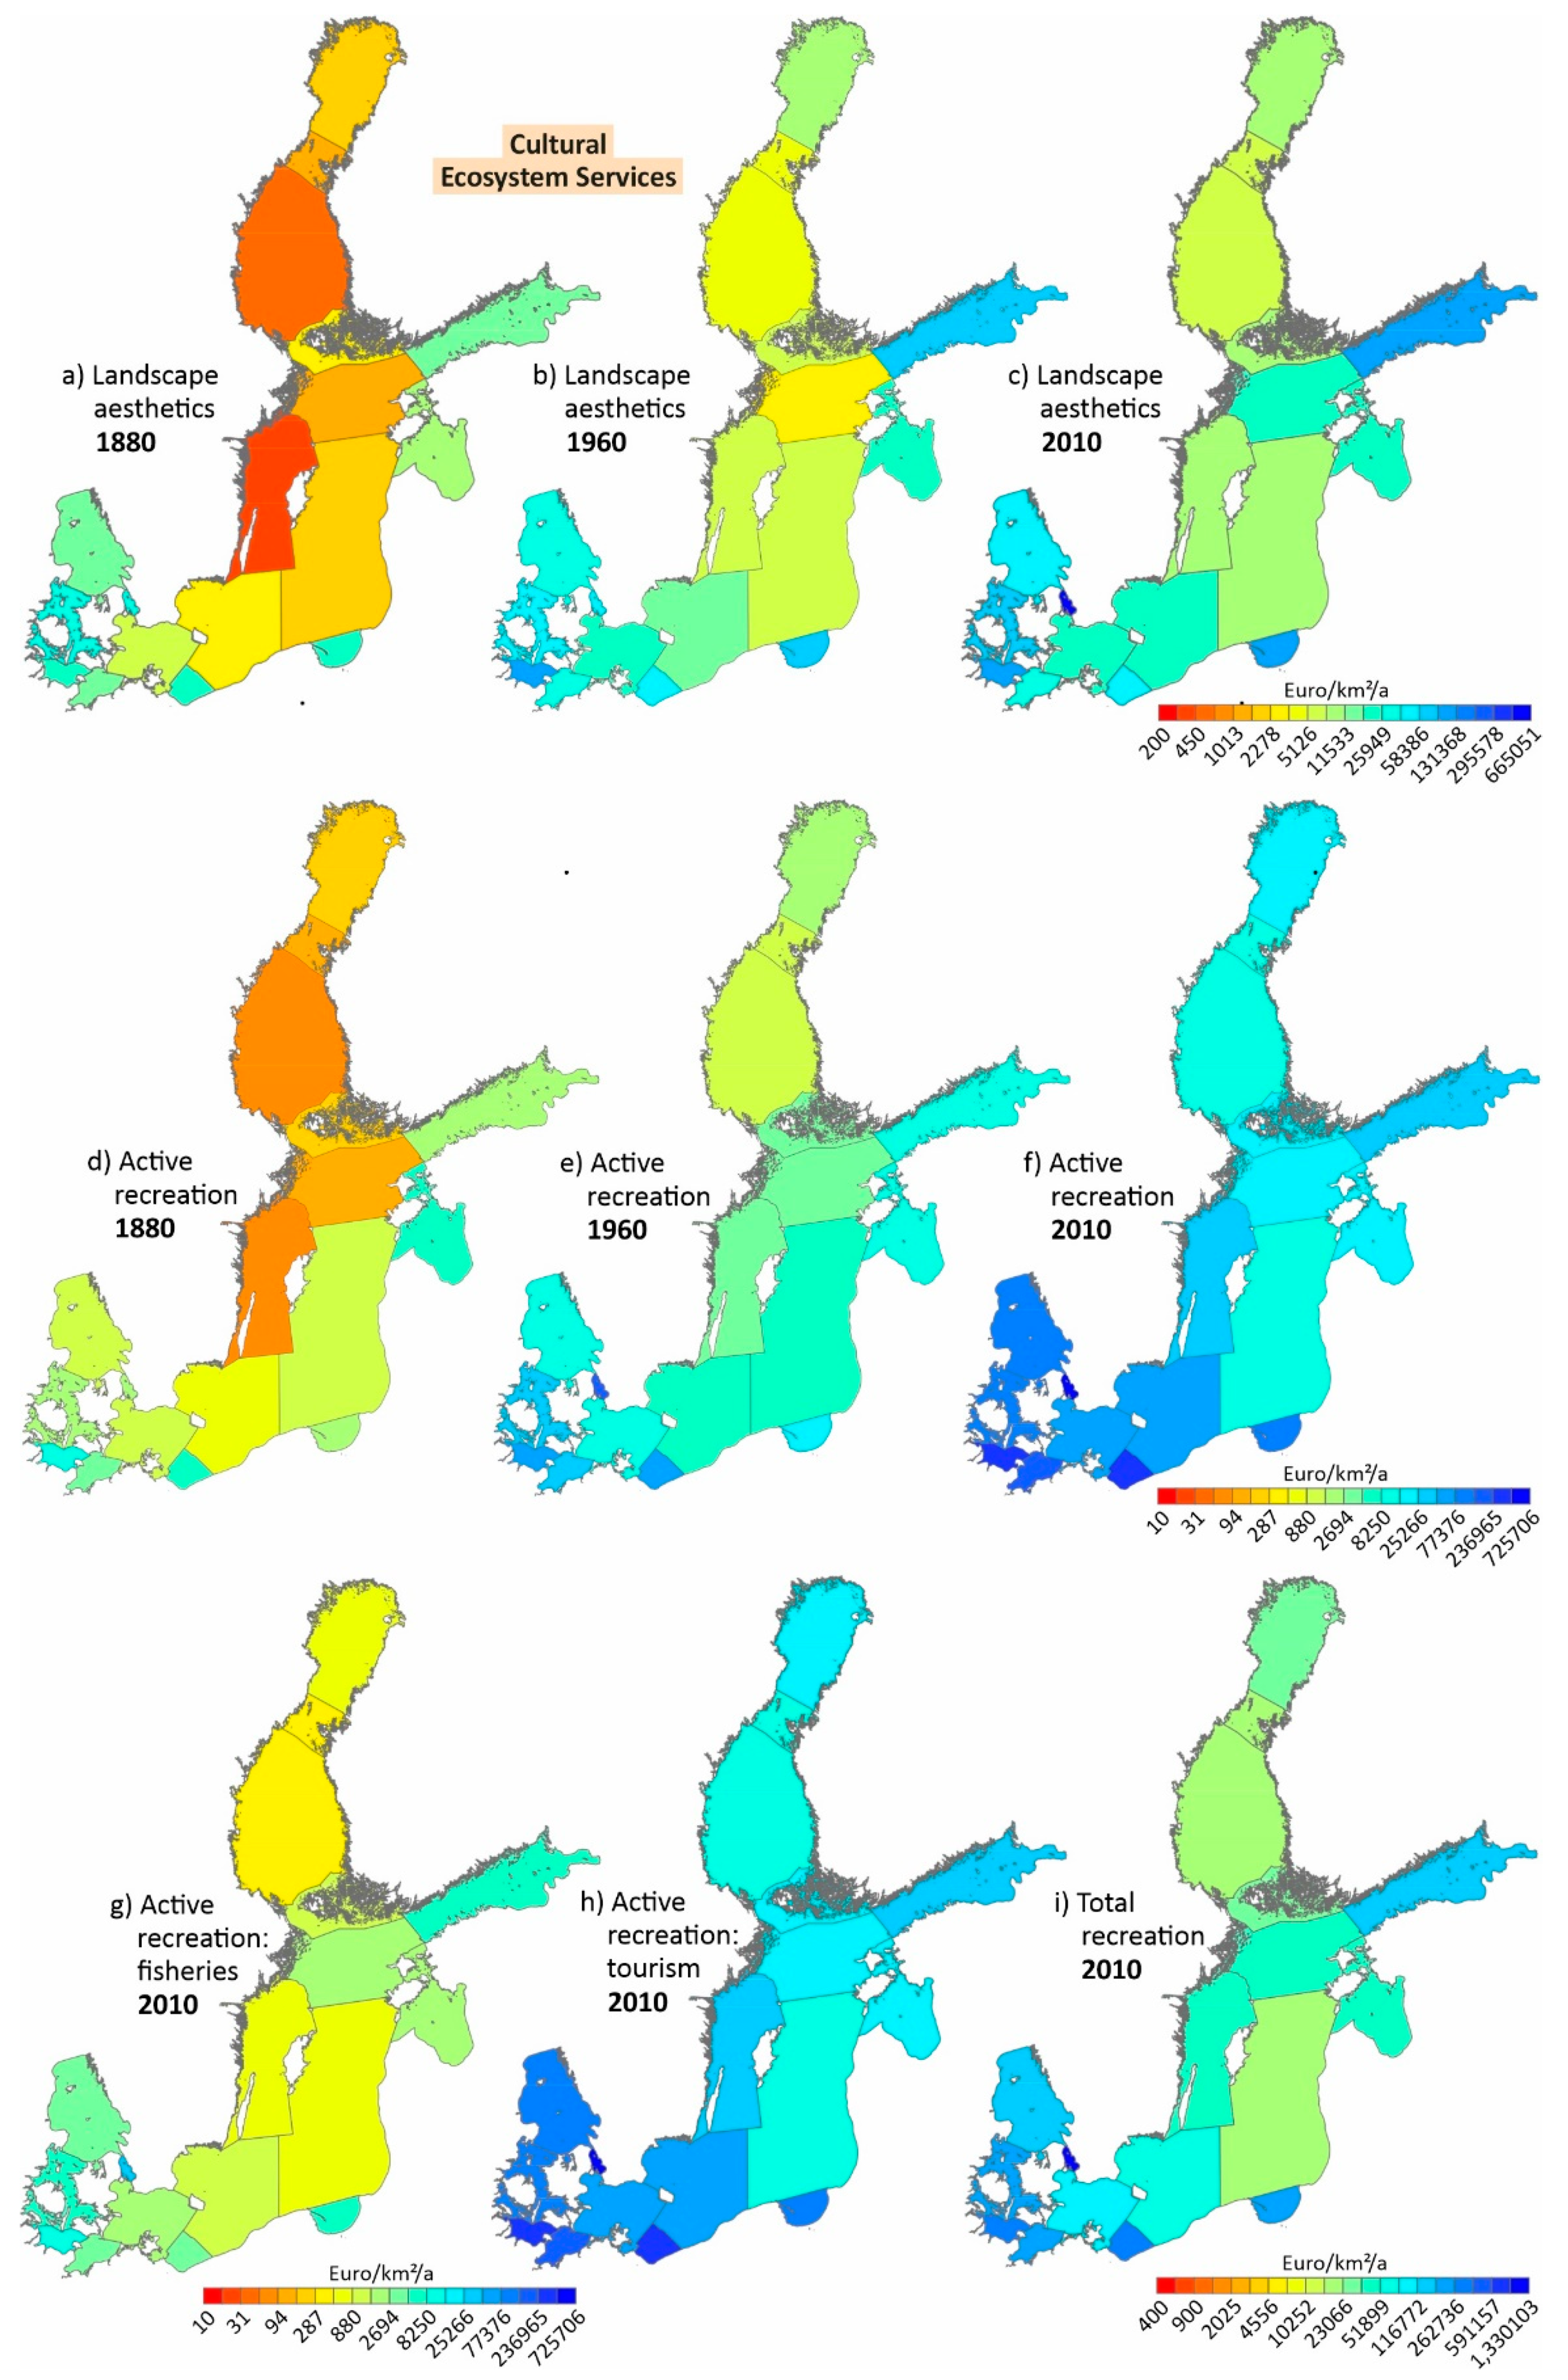
Active recreation: The total value for active recreation combines active recreation resulting from tourism and from recreational fisheries. The overall annual monetary total active recreation value in the entire Baltic Sea and its coasts increased from EUR 287 million/a in 1880 to EUR 18,990 million/a in 2010, an increase from 100% (1880) to 6626% (2010) (Figure 6). The total value in 2010 results from calculations in [67] and the values of 1880 consider today’s prices. The highest absolute annual monetary recreational value in 1880 was in the Gulf of Riga (EUR 104 million/a). The highest value per square-kilometre was calculated for the Kiel Bay (EUR 8203 km−2 a−1), The Gulf of Riga (EUR 4650 km−2 a−1), the Pomeranian Bay (EUR 4307 km−2 a−1), and Mecklenburg Bay (EUR 3287 km−2 a−1), a smaller basin in the southern Baltic Sea with early tourism. The lowest absolute value was calculated for the Sound (EUR 100,000/a), but per square-kilometer, the northern Baltic basins such as the Northern Baltic Proper (EUR 18 km−2 a−1), the Bothnian Sea (EUR 23 km−2 a−1), and the Bothnian Bay (EUR 33 km−2 a−1), as well as the Kattegat (EUR 21 km−2 a−1) showed the lowest values. In 2010, the Sound showed the highest value of EUR 582,728 km−2 a−1 (a total of EUR 890 million/a) and had the highest relative increase of all Baltic basins between 1880 and 2010. Other basins with high values are the Pomeranian Bay (EUR 338,742 km−2 a−1), the Kiel Bay (EUR 249,200 km−2 a−1), and the Mecklenburg Bay (EUR 200,941 km−2 a−1). The results clearly indicate the enormous increase in tourism in the Baltic Sea region.
While the recreational quality index slightly declined during the 150 years, the annual monetary recreational value strongly increased. The recreational monetary values reflect the present consumers demand and perception of an ecosystem and is independent of historical changes. Therefore, a combination of the recreational quality index with the monetary recreational value does not make sense.
The monetary value of active recreation from recreational fisheries in the entire Baltic Sea increased from EUR 216 million/a in 1880 to EUR 692 million/a in 1960 to a total value of EUR 1000 million/a in 2010. The upper limit for the value was estimated based on literature. The increase reflects the increase in the total population concentration at the coast. In 1880, the monetary value of recreational fisheries ranged between EUR 31 km−2 a−1 with a minimum in large and northern basins such as the Bothnian Sea and Western Gotland Basin. The maximum of EUR 2575 km−2 a−1 was calculated for the Great Belt, followed by the Sound. In 2010, the Sound showed the maximum value of EUR 36,461 km−2 a−1 and the lowest values are found in the Bothnian Sea (EUR 441 km−2 a−1). In 1880, the monetary recreational value from tourism and the monetary value of recreational fisheries were about the same, while in 2010, monetary recreational value from tourism was 19 times higher.
Landscape aesthetics (observational recreation): The overall annual monetary observational recreation value throughout the entire Baltic Sea, including its coasts, increased significantly from EUR 2747 million/a in 1880 to EUR 12,710 million/a in 2010 (Figure 6), reflecting an increase from 100% (1880) to 463% (2010). Similar to the monetary active recreation value, the 2010 values are based on previous calculations [67] and the values of 1880 consider today’s prices. In 1880, the highest annual monetary observational recreation value per square-kilometer was calculated for Great Belt (EUR 32,732 km−2 a−1) and the Sound (EUR a32,235 km−2 a−1). By 2010, the Sound had the highest value of all basins (EUR 463,431 km−2 a−1), driven by a significant increase in coastal population. In 1880, the lowest values per square-kilometer were obtained in the northern and central Baltic basins, namely the Western Gotland Basin (EUR 396 km−2 a−1) and the Bothnian Sea (EUR 581 km−2 a−1). In 2010, the Bothnian Sea (EUR 5600 km−2 a−1) and the Quark (EUR 5993 km−2 a−1) had the lowest values. These differences highlight the spatially varied increase in coastal population.
There is an overlap between active recreation and landscape aesthetics and observational recreation, and their monetary values depend on the approach and assumptions used. Therefore, a detailed comparison of the data is problematic. However, what can be stated is that in 1880, only the local coastal population benefited from the sea, whereas in 2010, tourism became the main economic driver and beneficiary.
The total monetary value of cultural services increased tenfold between 1880 and 2010, from about EUR 3250 million/a in 1880 to EUR 32,700 million/a in 2010. This increase underscores the growing monetary importance of cultural services and their increasing societal relevance for managing and preserving the Baltic Sea. Appendix G shows the full data that served as the source for the figures.
Figure 7 provides an overview about all calculated monetary ecosystem services for the entire Baltic Sea. The ES wild fish exclusively reflects the commercially usable fish, without considering fishery-related employment and industries. Therefore, comparing this value with the monetary values of cultural services is challenging. Nevertheless, in 1880, the total value of recreational services was about twice the total value of fish, while in 2010, it was nine times higher. Despite an absolute increase in the value of fish, its relative importance compared to the monetary value of cultural services decreased sharply. These monetary values illustrate the declining role of fish and fisheries in society over the past 150 years. Parallel the importance of recreational fisheries increased and today generates about EUR 1000 million/a, the same order of magnitude compared to the value of commercially usable fish of EUR 3553 million/a.

4. Discussion

4.1. Assessment of Methods and the Model

Our approach and the provided data are subject to several uncertainties: they rely on 3D ecosystem model results, incorporate historical data from various sources with uncertain reliability, involve diverse and partly subjective ecosystem calculation methods, and the monetary valuations are based on generalized market prices.
The 3D ecosystem model of the Baltic Sea (ERGOM) has been applied for various purposes, is well adapted to the specific needs of the Baltic Sea, and has been calibrated, validated, and continuously developed [6,32]. According to an assessment by the European Commission [30], ERGOM is among the top two European models in the category of ‘biogeochemical and lower trophic level models’ and is considered the best choice for 3D applications in the Baltic Sea.
However, the model represents only a portion of the Baltic Sea ecosystem, has a limited number of state variables, and describes only major processes (see Appendix A). Comparisons between field data and model simulations show certain deviations that vary slightly between parameters and locations.
However, the model provides the only means to gain insight into the Baltic Sea from a century ago, a period for which no field data exist. It is the sole method to obtain a comprehensive spatio-temporal understanding of the state and changes in the Baltic Sea, as data are unavailable for all locations in the necessary spatial and temporal resolution, coverage, and quality. Additionally, the use of a 3D model allows for the calculation of data for any spatial units and time slices, ensuring that the results meet policy and practical demands. In our study, we focused on the 18 official HELCOM sub-basins, which are used for biogeochemical assessments as required by major European marine policies, such as the Marine Strategy Framework Directive [9,36].
Ecosystem service assessments do not necessarily require absolute accuracy; consistency in time and space and proper representation of relative changes are, in many cases, more important. Previous studies showed that ERGOM meets these criteria [72]. The utilization of a 3D ecosystem model addresses a major weakness in current ecosystem service assessments, namely the lack, insufficient reliability, inconsistency, incompatibility, and subjectivity of the data used [23,29]. For example, inter-annual data variability is high, even when model data are aggregated over months and larger spatial units. To mitigate negative effects on our ecosystem service calculations, we averaged the annual data over 20 years and assigned it to a specific time slice, such as 1880. The use of 3D models appears to be the only viable option for long-term and/or large-scale ecosystem service assessments, although model quality and complexity impose limitations.
Ecosystem service assessments require complementary socio-economic data that cannot be provided by ecosystem models, particularly for monetary assessments. We exclusively used coastal population and tourism data, which was compiled from various regional sources with uncertain quality. To ensure full transparency, additional methodological information is available in Appendix C, Appendix D and Appendix E. However, the Baltic Sea has been intensively utilized for centuries, and the surrounding countries are highly developed, with long-term statistical data records. Consequently, the amount, availability, and quality of the historical data used can be considered comparatively good.

4.2. Quantification of Ecosystem Services

The methods for calculating ecosystem services vary depending on the service, and in the following sections, we discuss each ecosystem service individually. Provisioning services include commercially usable wild fish biomass and wild plant biomass. Due to its economic significance, data on fish catches are available for various basins in the Baltic Sea [63]. Our ratio between total fish biomass and annual catches data of 0.08 aligns well with data from Thurow [53], who reported ratios between 0.05 and 0.14 for the years 1988–1992. Scheffold and Hense [50] provide reliable data on the phytoplankton/commercial wild fish biomass ratio of 2.2 (gC/m2) for the entire Baltic Sea. Consequently, our calculations of commercially usable wild fish biomass are well-supported by existing literature and can be considered relatively reliable. However, the complexity and significant inter-annual variability of these calculations highlight a high degree of uncertainty [53]. Differentiating between fish species could improve calculations for individual basins.
In the Baltic Sea, the use of wild plant biomass has been historically and remains very limited, with no significant tradition. Only common reed (Phragmites australis) was commercially utilized, primarily for roof thatching [54]. Our calculated quantities reflect the annual biomass. As a potentially harvestable amount, we assume only 10% of it. Additionally, the calculations face the challenge of distinguishing between reed growing in water and reed growing on land. Despite efforts to promote multiple uses of reed in the Baltic Sea region, such as through the Coastal Reed Project [73], its quantitative role as a material remains low and localized [54].
Some regulating services, such as nitrogen and phosphorus retention and carbon burial, can be directly derived from model data, with their reliability dependent on model quality. According to our model, the total nitrogen balance of all three processes (burial in sediments, denitrification, and counteracting nitrogen fixation) was 462,882 t N/a in 1880, and this loss increased to 884,135 t N/a by 2010. A recent comprehensive data-based nitrogen balance for the Baltic Sea [74] estimates a loss of 763,000 t N/a for the years 2005–2018, which is consistent with our model calculations, considering the different time periods. When examining individual processes, our model suggests a higher nitrogen fixation of 319,200 t N/a (2010) compared to 223,000 t/a (2005–2018), higher denitrification of 1,073,700 t N/a (2010) compared to 668,000 t N/a (2005–2018), and lower burial in sediments of 129,635 t N/a (2010) compared to 318,000 t N/a (2005–2018) [74].
Regarding phosphorus, comparing model results with data is more straightforward because phosphorus removal from the water body occurs through only one process: burial in sediments. The winter phosphorus concentrations in the water body, as predicted by the model, align well with observed data. For instance, in the Arkona Sea in 2010 (Figure 2), the model predicts a winter concentration of dissolved inorganic phosphorus of approximately 0.5 µmol/L, which is comparable to the 0.6 µmol/L concentration reported in the recent official HELCOM assessment [9] for the years 2016–2021. Since both data-based and model-based calculations rely on the same long-term external phosphorus input data, the annual phosphorus burial should be comparable, making our results reliable.
For 2010, our model calculates a burial of 3.7 million t C/a in Baltic Sea sediments. In comparison, Kulinski and Pempkowiak [75] estimate a burial of 2.7 million t C/a. Considering the uncertainties and different time periods, these numbers can be regarded as comparable.
Our Biodiversity Index combines the Eutrophication Index (based on water transparency and chlorophyll-a) with the Remane Index, which is based on salinity. The Biodiversity Index incorporates a significant degree of subjectivity due to the combination of different parameters, scales, and units. The Eutrophication Index uses common and officially recognized eutrophication indicators, such as reduced water transparency and increased phytoplankton primary production and biomass [76]. However, the use of water transparency as an indicator has some challenges. Apart from phytoplankton biomass, water transparency is also influenced by the water’s optical properties. In the northern Baltic Sea, river water contains large amounts of particulate matter and organic material, which can color the water brown. This leads to reduced water transparency independent of eutrophication [77], thereby negatively impacting our index. The Remane Index, which links biodiversity in brackish systems to salinity levels [60], is conceptually sound but was criticized for oversimplification [78,79]. We combined these indices and parameters into the Biodiversity Index without applying any weighting to ensure maximum transparency of the results. Nevertheless, the calculation method significantly influences the results, and alternative or more detailed approaches could be considered in the future. While these limitations mainly affect spatial comparisons between basins, the index is still suitable for our primary focus: visualizing temporal changes.
One provisioning service we did not account for is the use of marine space. For example, offshore wind turbines generate electricity worth an estimated 878 million euros per year [9]. Additionally, transportation plays a significant role in the Baltic Sea region. In 2015, 613 million tons of goods were handled, and 97 million passengers were recorded at all Baltic Sea harbors [80]. As the utilization of marine space and competition for it increases [81], this aspect could be included and analyzed with respect to spatio-temporal changes in future assessments.
For the calculation of the regulating ecosystem service ‘Habitats,’ we utilized the official HELCOM distribution data for the main habitat-forming macro-vegetation species, including Zostera marina, Fucus vesiculosus, Furcellaria lumbricalis, and charophytes. The challenges and uncertainties associated with selecting these species are discussed in HELCOM [82]. To estimate historical changes, we employed a machine learning modeling approach. Although this approach was based on a relatively small sample size of 18, it incorporated a large number of environmental variables (15 in total) provided by the model. However, the results are not entirely satisfactory and, for certain basins, require manual correction using analogies with comparable basins. To support alternative calculations, we included the complete data in Appendix B and Appendix C. Smaller regional studies with similar sediment substrates and available historical literature could provide better insights into long-term habitat developments.
One of our major innovations is the inclusion of cultural ecosystem services and the integration of socio-economic factors with model-based natural scientific aspects. In the Baltic Sea region, this approach responds to the growing demand for management strategies that increasingly consider economic and social factors [3,78]. The degraded environmental conditions in the Baltic Sea are estimated to cost 9 billion euros annually in forgone recreational benefits [9]. Additionally, European Union environmental directives, which largely guide activities in the Baltic Sea, mandate the consideration of economic, social, and cultural aspects [83].
Our Active Recreation Quality Index encompasses outdoor activities and tourism, calculated using average summer water temperature, water transparency, recurrence intervals of cyanobacteria blooms, and riverine phosphorus emissions (an indicator for sewage). The selection, combination, and scaling of these parameters involve a degree of subjectivity. The resulting index offers insights into the potential for recreation and tourism, highlights spatial differences between basins, and tracks long-term changes, serving as a basis for monetary evaluations.
The Landscape Aesthetics Quality Index (observational recreation) assesses the visual quality of landscapes and ecosystems, which positively impacts human well-being. This index combines parameters such as water transparency and phytoplankton concentrations with coastal population density and tourism activity along the coast to account for the negative environmental impacts of human activities. There is some overlap between the two cultural indices. The distinction was made to differentiate the benefits for tourists from those for the local population, recognizing the high significance of cultural services in the Baltic Sea region.

4.3. Monetarization of Ecosystem Services

The challenges of assessing the monetary value of ecosystem services are well known and frequently documented [26,27,67]. In our calculations, we used common market prices for the Baltic Sea in 2010. The calculated monetary values are highly dependent on human demand (e.g., cultural services), policy frameworks (e.g., carbon sequestration), and exhibit significant changes over time due to currency fluctuations and inflation rates. Despite their limitations, monetary values of ecosystem services are widely understandable and facilitate comparisons between different services. We consistently used Baltic-wide monetary values in our calculations, without accounting for socio-economic differences between countries, such as varying market prices, purchasing power, and incomes. In more regional studies, this could be taken into account.
According to [9], the estimated value of nutrition benefits from wild-caught fish and aquaculture ranges between 1.4 and 3.6 billion euros per year, based on total catches and end-consumer market prices for the years around 2020. The EU’s annual economic report on fisheries by STECF [63] estimated the income from landings and other income generated by the Baltic Sea fleet at only 267.5 million euros in 2013. This lower value reflects the lower landing prices for fish species, which averaged EUR 385/t. For example, herring has a consumer price that is 20–30 times higher than its landing price [9]. Our calculation of EUR 277 million/a aligns with [63] but includes an estimate of Russian catches.
The monetary value of reed for roof thatching assumes market prices and that 10% of the total reed biomass is suitable for harvesting. The total value of approximately EUR 195,000 is negligible in economic terms and primarily reflects cultural heritage rather than economic value [54].
Our calculated total value of nitrogen and phosphorus retention exceeds 30 billion euros, with 87% attributed to nitrogen retention. HELCOM [9] estimates the value of nutrient sequestration alone at nearly 10.5 billion euros per year, though details on the calculation method are not provided. Our higher values may partly result from our assumed avoidance costs of EUR 30/kg N [65], but the differences cannot be fully assessed.
Previous studies estimate the monetary benefits of carbon sequestration in the Baltic Sea to range from 622 to 1554 million euros per year [9], which aligns well with our 2023 estimate of 1210 million euros. The monetary values depend on the price of CO2 emission rights in the European Emissions Trading System (EU-ETS), which sharply increased from EUR 15/t CO2 in 2010 to EUR 90/t CO2 in 2023 [66]. Consequently, the value of carbon sequestration in the Baltic Sea is highly variable and depends on the year considered. If CO2 certificate prices rise to EUR 140/t [84], the monetary value of this ecosystem service could increase to nearly 1900 million euros per year, enhancing its quantitative significance compared to other ecosystem services.
We adjusted the total value of cultural services to align with values reported by Czajkowski et al. [67] and HELCOM [9]. According to these sources, the benefits from cultural ecosystem services are estimated at 33.7 billion euros per year, though with indicated low to moderate confidence. This aggregated Baltic-wide data served as the basis for our spatial separations into basins and all calculations for historical periods. The significant quantitative importance of cultural services suggested separating active recreation from landscape aesthetics, but this approach carries the risk of double counting and requires careful definition.
The Landscape Aesthetics Quality Index accounts for the local population size and the annual monetary benefit of living near the sea. In contrast, the Active Recreation Quality Index reflects tourism, based on the number of tourist beds, overnight stays, and daily expenditures. This approach builds on existing socio-economic statistics and monetary tourism data [67]. Recreational fisheries play an important role in the Baltic Sea region, and therefore, they were calculated separately but included as part of the Active Recreation service. However, in fact, they impact both local populations and tourists. The upper total value of 1000 million euros per year in 2010 was estimated based on literature [68,69]. The calculations in the literature were not fully transparent, and it remains uncertain which types of costs were included (e.g., overnight stays, costs of angling trips). Thus, this value reflects little more than an order of magnitude and requires further studies. Other important ecosystem services, such as Cultural Heritage [85], were not included due to a lack of data.

5. Conclusions

We present a long-term assessment of ecosystem services in the Baltic Sea, covering a span of 150 years and encompassing the entire sea, subdivided into 18 sub-basins. Our assessment, based on a 3D ecosystem model simulation and supplemented by historical data, offers consistent data for nine provisioning, regulating, and cultural ecosystem services, along with corresponding monetary evaluations for the sea and all sub-basins. All calculations focus on the 18 official HELCOM Baltic Sea sub-basins [3], which are widely used in most Baltic Sea assessments. The scope of ecosystem services that can be evaluated is determined by the model’s quality and complexity.
The integration of 3D models with socio-economic data enables long-term and large-scale assessments of ecosystem services. Analyzing and visualizing long-term changes within and between Baltic Sea basins helps to identify the drivers behind these changes, which can inform policy development and implementation.
In the latest comprehensive Baltic Sea assessment by HELCOM [3], socio-economic aspects and ecosystem services still receive limited attention, leading to the publication of a separate report on economic and social analyses [9]. This complementary HELCOM report includes important economic calculations and spatial visualizations, but it is clear that a unified assessment framework is still under development [9]. Our approach contributes to this ongoing work by providing and applying an ecosystem service framework as a basis for economic and social analyses. Our methodology explores the current possibilities and limitations of using 3D ecosystem models, offers compiled historical data, and provides new insights into the quantitative significance of individual ecosystem services and spatial differences. While partly conceptual, our approach delivers data that support other applications and ecosystem service calculation methods.

Author Contributions

Conceptualization, G.S.; methodology, G.S., T.N., M.v.T., M.B.; formal analysis, G.S., T.N., M.v.T., M.B.; investigation, G.S., T.N., M.v.T., M.B.; writing—original draft preparation, G.S.; writing—review and editing, T.N., M.v.T., M.B.; visualization, G.S., T.N., M.v.T.; project administration and funding acquisition, G.S., M.v.T. All authors have read and agreed to the published version of the manuscript.

Funding

This work was financially supported by the German Federal Ministry of Education and Research, projects “Coastal Futures II” (grant number 03F0980B) and “PrimePrevention” (grant number 03F0911B).

Data Availability Statement

The data is documented in the appendices. Additional data can be obtained upon request.

Acknowledgments

Computational power was provided by the North-German Supercomputing Alliance (HLRN).

Conflicts of Interest

The authors declare no conflicts of interest.

Appendix A

Overview about state variables and processes in the 3-D ecosystem model (ERGOM) of the Baltic Sea.
Table A1. State variables.
State VariableUnit
Nitratemol/kg
Phosphatemol/kg
Dissolved inorganic carbonmol/kg
Alkalinitymol/kg
Dissolved organic carbonmol/kg
Dissolved organic nitrogenmol/kg
Dissolved organic phosphorusmol/kg
Non-living particulate organic carbon (4 groups)mol/kg
Phytoplankton (3 groups)mol/kg
Cyanobacteriamol/kg
Zooplanktonmol/kg
Colored dissolved organic mattermol/kg
Dissolved oxygenmol/kg
Hydrogen sulfidemol/kg
Sulfurmol/kg
Dissolved nitrogenous gasmol/kg
Iron bound phosphorus particlesmol/kg
Sediment/fluffy layer variables (5)mol/m2
Each state variable consists of one or more elements.
Nitrogen
Phosphorus
Carbon
Oxygen
Sulfur
The elemental ratios are not fixed for all variables and thus allow for a flexible P:N:C ratio in organic matter. In addition to the prognostic variables, some diagnostic variables are in the model. These are e.g., the ambient light and variables from the carbonate system such as CO2 partial pressure or pH.
Table A2. Selected processes.
ProcessUnit
Primary productionmol/kg/s
Nitrogen fixationmol/kg/s
Zooplankton grazingmol/kg/s
Mortality (phytoplankton, zooplankton)mol/kg/s
Respiration (phytoplankton, zooplankton)mol/kg/s
Mineralization of POC and DOC, O2 as electron acceptormol/kg/s
Mineralization of POC and DOC, NO3 as electron acceptor, denitrificationmol/kg/s
Mineralization of POC and DOC, SO4 as electron acceptormol/kg/s
Oxidation of sulfur and hydrogen sulfidemol/kg/s
Nitrificationmol/kg/s
Flocculation DOC to POCmol/kg/s
Sedimentation and erosion of particlesmol/kg/s; mol/m2/s
Sinking of particlesmol/m2/s
Sedimentary mineralization similar to water column processesmol/m2/s
Liberation of phosphate from iron bound complexes under low oxic conditionsmol/m2/s
All processes transfer one or more state variables into another one or more state variable. For example, primary production transfers nitrate, phosphate, and carbon dioxide into phytoplankton and oxygen.

Appendix B

Figure A1. Documentation of the aggregated 3-D ecosystem model (ERGOM) results used as the basis for the calculation of ecosystem services.
Environments 11 00200 g0a1

Appendix C

Figure A2. Documentation of the historical data used for the calculation of ecosystem services.
Environments 11 00200 g0a2

Appendix D

Additional methodological information on population data.
2010: We derived the population data for the coastal areas around the Baltic Sea from the ESPON Fuore webtool.
1960: We used data from the highest available NUTS region level (EUROSTAT) and recalculated it based on the coastal area share of the population from 2010.
1880: To estimate the coastal population of 1880, we resorted to different sources. We derived data for the entire formerly German territory along the Baltic Sea coast from Rademacher [46]. Since the state territories were different in the past, we first calculated the population density based on the numbers from 1880 (population and area of the territories) and then extrapolated it to the area of the respective coastal NUTS2 region. For the NUTS2 region “Kaliningrad Oblast“, we could directly use the population numbers from Rademacher [46] for the corresponding Prussian district of Königsberg. Latvia and Estonia were part of the Russian Empire in 1880. The first general census of the Russian Empire was carried out in 1897 and can be accessed via the website demoscope.ru, which we took as basis for estimating the coastal population data for Latvia in 1880. We took into account the coastal areas of Courland Governate (Grobin, Hasenpoth, Windau, Talsen, and Tuckum) and Livonia Governate (Riga and Wolmar). For the Estonian data, we refer to the Estonian statistical office, which has published 1881 data (stat.ee). The Estonian Governate of that time consisted of the counties Harju, Järva, Lääne, and Viru. For Finland, Sweden, and Denmark, we simply calculated the population density from numbers (population, area) for the entire country as their territories have not changed much since 1880, based on Statistics Finland, the Swedish Statistical Database, and Statistics Denmark.
Table A3. Additional methodological information on population data.
NUTS 2 Region (Coastal Area in km2)1880 Territory (Area in km2)1880 Population (n)1880 Population Density (n km−2)1880 Population in Coastal Area
Schleswig-Holstein (4009)Province of Schleswig-Holstein (19,005)1,127,1496244,549
Hanseatic city of Lübeck
(289)
51,055
Grand Duchy of Oldenburg (5379)337,478
Area: 24,673N: 1,515,682
Mecklenburg-Vorpommern (6506)Grand Duchy of Mecklenburg-Schwerin (13,127) 560,66849318,794
Province of Pomerania (30,110)1,540,034
Area: 43,237N: 2,100,702
Zachodniopomorskie (3853)Province of Pomerania (30,110)1,540,03451196,503
Pomorskie (3743)Province of West Prussia (25,516)1,405,89855205,865
Kaliningrad OblastPrussian administrative district of Königsberg171,116 171,116
Lietuvia (1159)Province of East Prussia (36,981)1,933,9365260,268
Latvija (9428)Russian Empire—Courland and Livonia Governates (26,924)817,87230282,840
Eesti (14,996)Russian Empire—Governate Estonia (20,451)368,43418269,928
Länsi-Suomi (11,139) Grand Duchy of Finland (336,892) 2,060,800666,834
Helsinki-Uusimaa (6069)36,414
Etelä-Suomi (12,701)76,206
Pjhois-ja ltä-Suomi (16,035)96,210
Åland (3887)23,322
Stockholm (5896)Sweden (449,209)4,565,6681085,960
Östra Mellansverige (10,713)10,713
Småland med öarna (11,864)11,864
Sydsverige (8112)8112
Västsverige (10,782)10,782
Norra Mellansverige (8407)8407
Mellersta Norrland (13,641)13,641
Övre Norrland (23,831)23,831
Hovedstaden (2807)Denmark (4441)1,969,03944123,508
Sjælland (8612)378,928
Syddanmark (12,004)528,167
Midtjylland (10,231)450,164
Nordjylland (8004)352,176

Appendix E

Additional methodological information on tourism data.
1880: Tourism in the Baltic Sea developed in the early 19th century (Antons, 2021). The first coastal resort that opened in the Baltic Sea was Heiligendamm at the German coast in 1794. In the course of the 19th century, more and more coastal resorts opened along the German coast and spread eastward to the formerly East Prussian and Russian Baltic provinces (Antons, 2021). Coastal resorts also started to develop in Finland (Hanko, Mariehamn), Sweden (Saltsjöbaden, Mölle), and Denmark (Hornbæk). However, they only gained touristic importance towards the end of the century (Antons, 2021, Zhikhareva et al. 2008). Based on the development of the coastal resorts, we can assume that Baltic Sea tourism was concentrated along the south-west and south-eastern coastal areas, from Germany to Estonia. Recorded numbers of tourists in 1880 exist for the Prussian coastal resorts (20,024 annual guests) and Jurmala (“Rigascher Strand”, 30,000 guests) (Kolbe, 2011; Noack, 2011). For the Estonian, and for a few of the Prussian coastal resorts, recorded numbers exist from the mid-19th century, 1860 and 1880s (Table A4). To distribute the ca. 20,000 tourists of the Prussian coastal resorts among the now existing NUTS 2 regions, we divided this number by the existing Prussian coastal resorts to arrive at a mean number of guests (770) and multiplied it by the number of resorts in each NUTS 2 region. For Sopot, we assumed a higher number of guests (1300) based on Bal and Czalczynska-Podolska (2020) and for Selenogradsk and Palanga, we assumed a lower number (500). For the coastal resorts for the Grand Duchy of Mecklenburg-Schwerin, we assumed the same mean number of guests as for the Prussian coastal resorts. To arrive at an estimate for the Estonian tourists In 1880, we assumed the same number for Kadriorg and Haapsalu (3000), 1000 tourists for Kurressaare, and 200 tourists for both Pärnu and Narva-Jõesuu.
Table A4. Additional methodological information on tourism data.
NUTS 2 Region1880 TerritoryCoastal Resorts (Name and Founding Year as Resort)Number of Tourists (Year; Reference)
Schleswig-Holstein *PrussiaGlücksburg (1872); Eckernförde (1830); Laboe (1875); Heiligenhafen (1871); Dahme (1855); Grömitz (1813); Neustadt i.H. (1827); Sierksdorf (1856); Haffkrug (1810); Scharbeutz (1830); Timmendorfer Strand (1865); Niendorf (1854)
Travemünde (1802)1304 (1860; Antons, 2021)
Mecklenburg-VorpommernGrand Duchy of Mecklenburg-Schwerin and Province Pommern (Prussia)Boltenhagen i.M. (1803); Kühlungsborn (1880)
Doberan-Heiligendamm (1794) 1683 (1860; Antons, 2021)
Warnemünde (1805); Graal-Müritz (1820); Binz (1825); Putbus (1816)
Lubmin (1886); Heringsdorf (1824); Ahlbeck (1853)
ZachodniopomorskiePrussiaSwinoujscie (1824); Miedzyzdroje (1832); Dziwnów (1828); Niechorze (1870); Kołobrzeg (1830)
PomorskiePrussiaSopot (1819)800–1200 (1850s, Bal and Czalczynska-Podolska, 2020)
Kaliningrad OblastPrussiaSelenogradsk (1816)
LietuviaPrussiaPalanga (1840s)
LatvijaRussian EmpireJurmala30000 (Noack, 2012)
EestiRussian EmpireTallinn/Kadriorg (1813)
Haapsalu (1825)3000 (1881, Kask and Hinsberg, 2012)
Kuressaare (1840)1100 (1885, Kask and Hinsberg, 2012)
Pärnu (1838)154 (1844, Kask and Hinsberg, 2012)
Narva-Jõesuu (1874)
* Today’s Schleswig-Holstein consisted mainly of the Prussian province Schleswig-Holstein in 1880 but also the Grand Duchy of Oldenburg, the Hanseatic City of Lübeck, and a small part of the Grand Duchy of Mecklenburg-Strelitz. For the sake of simplicity, we considered all of those coastal resorts as part of Prussian territory.
1960: Tourism statistics from the 1960s are rare; we could only find official numbers for both German countries from official statistical books. To show the distribution of tourism around the Baltic Sea, we take number of bed places as an indicator. The numbers of both Schleswig-Holstein and Mecklenburg-Vorpommern had to be corrected to account for only those that are located at the German Baltic Sea coast. For the Schleswig-Holstein numbers, we divided the number of bed places by two, based on statistics from 2010 that show a near equal number for both the North Sea and Baltic Sea coasts (Statistikamt Nord, 2011). The share of bed places in the eastern German district of Rostock (which covered the area of the coastal part of Mecklenburg-Vorpommern) was derived from Statistisches Bundesamt (1991). By comparing the numbers of bed places in 1960 to those in 2012 (see below), we can calculate the percentage increase between these years. In Schleswig-Holstein, the number of bed places increased by 276%. We assumed that the tourism in Schleswig-Holstein developed in a similar rate as in Denmark and therefore applied the same percentage increase to derive the number of bed places for 1960 from the data of 2012. For the Finnish estimates, we applied the same procedure. To estimate the number of bed places in Sweden, we can resort to data from 1987 (Swedish Agency for Economic and Regional Growth, Statistics Sweden), which we corrected for coastal areas (based on EUROSTAT data) and re-projected to 1960, assuming a percentage decrease between 2% and 4% per year, depending on the region. For estimates for Poland, we assumed a similar development as in Mecklenburg-Vorpommern. In 2012, the number of bed places in Zachodniopomorskie was half the number of bed places as in MV and so we assumed the same share to derive an estimate for 1960 and assumed the same distribution of bed places between Zachodniopomorskie and Pomorskie between 2012 and 1960 to derive estimates for Pomorskie. In the Soviet Baltic states (now Lithuania, Latvia, and Estonia), the development of three coastal resorts was pushed: Palanga, Jurmala, and Pärnu (Noack 2011). Based on Noack (2011), we can assume 14000 bed places in Palanga in 1960 and we know that there were plans to increase the number of bed places until 1970 to 5220 in Latvia, 3200 in Lithuania, and 1400 in Estonia. We take the share of bed places to arrive at numbers for Latvia and Estonia.
2012: For data from 2012, we can rely on EUROSTAT data for each NUTS2 coastal region, showing the number of bed places.
Zhikhareva, E., Brajovic, J., Nilsson, J., 2008. En studie om svensk turismhistoria genom fallstudier på Åre och Mölle. Södertörns högskola.
Kolbe, W., 2011. “Capri von Pommern” und “nordisches Sorrent”. Konkurrenzen und Kooperationen deutscher Ostseebäder im Kaiserreich und in der Weimarer Republik. Nord.—Zeitschrift für Reg. 20, 35–52.
Noack, C., 2011. “You have probably heard about all this ...”. Baltic Seaside Resorts as Soviet Tourist Destinations. Nord.—Zeitschrift für Reg. 20, 199–221.
Bal, W., Czalczynska-Podolska, M., 2020. The Stages of the Cultural Landscape Transformation of Seaside Resorts in Poland against the Background of the Evolving Nature of Tourism. Land. https://doi.org/10.3390/land9020055.
Kask, T., Hinsberg, A., 2012. Estonian Tourism Regions in the 19th and 20th Century, in: XIII International Scientific Conference—Sustainable Business under Changing Economic Conditions. pp. 53–62.
Statistikamt Nord, 2011. Beherbergungskapazität für den Fremdenverkehr in Schleswig-Holstein am 1. Juli 2010. Hamburg.
Statistisches Bundesamt, 1991. Tourismus in Zahlen. Wiesbaden.
Antons, J.-H. (2021). Historisch-Geografische Informationssysteme (HGIS) in der Tourismusgeschichte: Transnationale Besucher-ströme des Ostseetourismus im 19. Jahrhundert. J. East Cent. Eur. Stud. 7, 357–388. https://doi.org/10.25627/202170311016.

Appendix F

Figure A3. Full overview of the calculated ecosystem service data.
Environments 11 00200 g0a3

Appendix G

Figure A4. Full overview of the calculated monetary ecosystem service data.
Environments 11 00200 g0a4

References

  1. HELCOM. Baltic Facts and Figures. Available online: https://archive.iwlearn.net/helcom.fi/environment2/nature/en_GB/facts/index.html (accessed on 25 May 2024).
  2. European Parliament. An EU Strategy for the Baltic Sea Region (EUSBSR). Available online: https://www.europarl.europa.eu/RegData/etudes/BRIE/2022/733703/EPRS_BRI(2022)733703_EN.pdf (accessed on 20 August 2024).
  3. HELCOM. State of the Baltic Sea. Third HELCOM Holistic Assessment 2016–2021. Baltic Sea Environment Proceedings n°194. 2023. Available online: https://stateofthebalticsea.helcom.fi/ (accessed on 25 May 2024).
  4. Tomczak, M.T.; Müller-Karulis, B.; Blenckner, T.; Ehrnsten, E.; Eero, M.; Gustafsson, B.; Norkko, A.; Otto, S.A.; Timmermann, K.; Humborg, C. Reference state, structure, regime shifts, and regulatory drivers in a coastal sea over the last century: The Central Baltic Sea case. Limnol. Oceanogr. 2022, 67, S266–S284. [Google Scholar] [CrossRef]
  5. Gustafsson, B.G.; Schenk, F.; Blenckner, T.; Eilola, K.; Meier, H.E.M.; Müller-Karulis, B.; Neumann, T.; Ruoho-Airola, T.; Savchuk, O.P.; Zorita, E. Reconstructing the Development of Baltic Sea Eutrophication 1850–2006. AMBIO 2012, 41, 534–548. [Google Scholar] [CrossRef]
  6. Neumann, T.; Eilola, K.; Gustafsson, B.; Müller-Karulis, B.; Kuznetsov, I.; Meier, H.E.M.; Savchuk, O.P. Extremes of Temperature, Oxygen and Blooms in the Baltic Sea in a Changing Climate. AMBIO 2012, 41, 574–585. [Google Scholar] [CrossRef] [PubMed]
  7. Meier, H.E.M.; Eilola, K.; Almroth-Rosell, E.; Schimanke, S.; Kniebusch, M.; Höglund, A.; Pemberton, P.; Liu, Y.; Väli, G.; Saraiva, S. Disentangling the impact of nutrient load and climate changes on Baltic Sea hypoxia and eutrophication since 1850. Clim. Dyn. 2019, 53, 1145–1166. [Google Scholar] [CrossRef]
  8. Dutheil, C.; Meier, H.E.M.; Gröger, M.; Börgel, F. Understanding past and future sea surface temperature trends in the Baltic Sea. Clim. Dyn. 2022, 58, 3021–3039. [Google Scholar] [CrossRef]
  9. HELCOM. Thematic Assessment of Economic and Social Analyses 2016–2021. Baltic Sea Environment Proceedings 188. Available online: https://helcom.fi/wp-content/uploads/2023/03/HELCOM-Thematic-assessment-of-economic-and-social-analyses-2016-2021.pdf (accessed on 25 May 2024).
  10. World Resources Institute. Millennium Ecosystem Assessment. Ecosystems and Human Well-Being: Synthesis; Island Press: Washington, DC, USA, 2005; Available online: https://www.millenniumassessment.org/documents/document.356.aspx.pdf (accessed on 20 August 2024).
  11. Bouwma, I.; Schleyer, C.; Primmer, E.; Winkler, K.J.; Berry, P.; Young, J.; Preda, E. Adoption of the ecosystem services concept in EU policies. Ecosyst. Serv. 2018, 29, 213–222. [Google Scholar] [CrossRef]
  12. Baker, J.; Sheate, W.R.; Phillips, P.; Eales, R. Ecosystem services in environmental assessment—Help or hindrance? Environ. Impact Assess. Rev. 2013, 40, 3–13. [Google Scholar] [CrossRef]
  13. European Commission. Commission Staff Working Document. EU Guidance on Integrating Ecosystems and Their Services into Decision-Making. SWD (2019) 305 Final. Part 2/3. Available online: https://data.consilium.europa.eu/doc/document/ST-11395-2019-ADD-1/en/pdf (accessed on 20 August 2024).
  14. Sattler, C.; Loft, L.; Mann, C.; Meyer, C. Methods in ecosystem services governance analysis: An introduction. Ecosyst. Serv. 2018, 34, 155–168. [Google Scholar] [CrossRef]
  15. Schernewski, G.; Konrad, A.; Roskothen, J.; von Thenen, M. Coastal Adaptation to Climate Change and Sea Level Rise: Ecosystem Service Assessments in Spatial and Sectoral Planning. Appl. Sci. 2023, 13, 2623. [Google Scholar] [CrossRef]
  16. Reusch, T.B.H.; Dierking, J.; Andersson, H.C.; Bonsdorff, E.; Carstensen, J.; Casini, M.; Czajkowski, M.; Hasler, B.; Hinsby, K.; Hyytiäinen, K.; et al. The Baltic Sea as a time machine for the future coastal ocean. Sci. Adv. 2018, 4, aar8195. [Google Scholar] [CrossRef]
  17. Hasler, B.; Ahtiainen, H.; Hasselström, L.; Heiskanen, A.-S.; Soutukorva, Å.; Martinsen, L. Marine Ecosystem Services: Marine Ecosystem Services in Nordic Marine Waters and the Baltic Sea-Possibilities for Valuation. Nordic Council of Ministers, 2016. Available online: https://norden.diva-portal.org/smash/get/diva2:920382/FULLTEXT01.pdf (accessed on 20 August 2024).
  18. Armoškaitė, A.; Puriņa, I.; Aigars, J.; Strāķe, S.; Pakalniete, K.; Frederiksen, P.; Schrøder, L.; Sten Hansen, H. Establishing the links between marine ecosystem components, functions and services: An ecosystem service assessment tool. Ocean Coast. Manag. 2020, 193, 105229. [Google Scholar] [CrossRef]
  19. Haines-Young, R.; Potschin-Young, M. Revision of the Common International Classification for Ecosystem Services (CICES V5.1): A Policy Brief. One Ecosyst. 2018, 3, e27108. [Google Scholar] [CrossRef]
  20. Hyytiäinen, K.; Bauer, B.; Bly, J.K.; Ehrnsten, E.; Eilola, K.; Gustafsson, B.G.; Meier, H.E.M.; Norkko, A.; Saraiva, S.; Tomczak, M.; et al. Provision of aquatic ecosystem services as a consequence of societal changes: The case of the Baltic Sea. Popul. Ecol. 2021, 63, 61–74. [Google Scholar] [CrossRef]
  21. Heckwolf, M.J.; Peterson, A.; Jänes, H.; Horne, P.; Künne, J.; Liversage, K.; Sajeva, M.; Reusch, T.B.H.; Kotta, J. From ecosystems to socio-economic benefits: A systematic review of coastal ecosystem services in the Baltic Sea. Sci. Total Environ. 2020, 755, 2–142565. [Google Scholar] [CrossRef]
  22. Schumacher, J.; Lange, S.; Müller, F.; Schernewski, G. Assessment of Ecosystem Services across the Land–Sea Interface in Baltic Case Studies. Appl. Sci. 2021, 11, 11799. [Google Scholar] [CrossRef]
  23. Seppelt, R.; Fath, B.; Burkhard, B.; Fisher, J.L.; Grêt-Regamey, A.; Lautenbach, S.; Pert, P.; Hotes, S.; Spangenberg, J.; Verburg, P.H.; et al. Form follows function? Proposing a blueprint for ecosystem service assessments based on reviews and case studies. Ecol. Indic. 2012, 21, 145–154. [Google Scholar] [CrossRef]
  24. Schernewski, G.; Robbe, E. Ecosystem Service Assessment in European Coastal and Marine Policies. In Southern Baltic Coastal Systems Analysis; Schubert, H., Müller, F., Eds.; Ecological Studies; Springer: Cham, Switzerland, 2023; Volume 246, pp. 347–366. [Google Scholar] [CrossRef]
  25. Liquete, C.; Piroddi, C.; Drakou, E.G.; Gurney, L.; Katsanevakis, S.; Charef, A.; Egoh, B. Current Status and Future Prospects for the Assessment of Marine and Coastal Ecosystem Services: A Systematic Review. PLoS ONE 2013, 8, e67737. [Google Scholar] [CrossRef]
  26. Mehvar, S.; Filatova, T.; Dastgheib, A.; De Ruyter van Steveninck, E.; Ranasinghe, R. Quantifying Economic Value of Coastal Ecosystem Services: A Review. J. Mar. Sci. Eng. 2018, 6, 5. [Google Scholar] [CrossRef]
  27. Sagebiel, J.; Schwartz, C.; Rhozyel, M.; Rajmis, S.; Hirschfeld, J. Economic valuation of Baltic marine ecosystem services: Blind spots and limited consistency. ICES J. Mar. Sci. 2016, 73, 991–1003. [Google Scholar] [CrossRef]
  28. Liquete, C.; Piroddi, C.; Macías, D.; Druon, J.-N.; Zulian, G. Ecosystem services sustainability in the Mediterranean Sea: Assessment of status and trends using multiple modelling approaches. Sci. Rep. 2016, 6, 34162. [Google Scholar] [CrossRef]
  29. Inacio, M.; Karnauskaitė, D.; Baltranaitė, E.; Kalinauskas, M.; Bogdzevič, K.; Gomes, E.; Pereira, P. Ecosystem services of the Baltic Sea: An assessment and mapping perspective. Geogr. Sustain. 2020, 1, 256–265. [Google Scholar] [CrossRef]
  30. European Commission. Marine Biodiversity Modelling Study; Publications Office of the European Union: Luxembourg, 2022; Available online: https://op.europa.eu/en/publication-detail/-/publication/717cff6a-7f4d-11ed-9887-01aa75ed71a1/language-en (accessed on 20 August 2024).
  31. Neumann, T.; Radtke, H.; Cahill, B.; Schmidt, M.; Rehder, G. Non-Redfieldian carbon model for the Baltic Sea (ERGOM version 1.2)—Implementation and budget estimates. Geosci. Model Dev. 2022, 15, 8473–8540. [Google Scholar] [CrossRef]
  32. Friedland, R.; Neumann, T.; Schernewski, G. Climate change and the Baltic Sea action plan: Model simulations on the future of the western Baltic Sea. J. Mar. Syst. 2012, 105–108, 175–186. [Google Scholar] [CrossRef]
  33. Kabel, K.; Moros, M.; Porsche, C.; Neumann, T.; Adolphi, F.; Andersen, T.J.; Siegel, H.; Gerth, M.; Leipe, T.; Jansen, E.; et al. Impact of climate change on the Baltic Sea ecosystem over the past 1000 years. Nat. Clim. Change 2012, 2, 871–874. [Google Scholar] [CrossRef]
  34. Saraiva, S.; Meier, H.E.M.; Andersson, H.; Höglund, A.; Dieterich, C.; Gröger, M.; Hordoir, R.; Eilola, K. Baltic Sea ecosystem response to various nutrient load scenarios in present and future climates. Clim. Dyn. 2019, 52, 3369–3387. [Google Scholar] [CrossRef]
  35. Meier, H.E.M.; Dieterich, C.; Gröger, M. Natural variability is a large source of uncertainty in future projections of hypoxia in the Baltic Sea. Commun. Earth Environ. 2021, 2, 50. [Google Scholar] [CrossRef]
  36. HELCOM. HELCOM Monitoring and Assessment Strategy. Available online: https://helcom.fi/wp-content/uploads/2020/02/Monitoring-and-assessment-strategy.pdf (accessed on 20 August 2024).
  37. Inácio, M.; Schernewski, G.; Nazemtseva, Y.; Baltranaitė, E.; Friedland, R.; Benz, J. Ecosystem services provision today and in the past: A comparative study in two Baltic lagoons. Ecol. Res. 2018, 33, 1255–1274. [Google Scholar] [CrossRef]
  38. Heiskanen, A.-S.; Bonsdorff, E.; Joas, M. Baltic Sea: A Recovering Future From Decades of Eutrophication. Coasts Estuaries 2019, 343–362. [Google Scholar] [CrossRef]
  39. Schernewski, G.; Paysen, P.; Robbe, E.; Inacio, M.; Schumacher, J. Ecosystem services and the EU Water Framework Directive: Comparative assessments in urban and rural estuarine water bodies. Front. Mar. Sci. 2019, 6, 183. [Google Scholar] [CrossRef]
  40. Haines-Young, R.; Potschin, M. Common International Classification of Ecosystem Services (CICES) V5.1 and Guidance on the Application of the Revised Structure. 2018. Available online: www.cices.eu (accessed on 25 May 2024).
  41. Griffies, S.M. Fundamentals of Ocean Climate Models; Princeton University Press: Princeton, NJ, USA, 2004; ISBN 9780691118925. [Google Scholar]
  42. Winton, M. A Reformulated Three-Layer Sea Ice Model. J. Atmos. Ocean. Tech. 2000, 17, 525–531. [Google Scholar] [CrossRef]
  43. Hunke, E.C.; Dukowicz, J.K. An elastic-viscous-plastic model for sea 871 ice dynamics. J. Phys. Oceanogr. 1997, 27, 1849–1867. [Google Scholar] [CrossRef]
  44. Neumann, T. Model code and boundary data for “Non-Redfield carbon model for the Baltic Sea (ERGOM version 1.2)—Implementation and Budget estimates”. Geosci. Model Dev. 2022, 15, 8473–8540. [Google Scholar] [CrossRef]
  45. The Long-Term Dataset of High Resolution Atmospheric Forcing Fields (HiResAFF) for Northern Europe Since 1850. Available online: https://gdk.gdi-de.org/geonetwork/srv/api/records/wdc-climate.de:3535037 (accessed on 25 July 2024).
  46. Rademacher, M.; Deutsche Verwaltungsgeschichte—Von der Reichseinigung 1871 bis zur Wiedervereinigung 1990. Dissertation Universität Osnabrück. 2006. Available online: https://www.eirenicon.com/rademacher/www.verwaltungsgeschichte.de/index.html (accessed on 25 May 2024).
  47. Antons, J.-H. Historisch-Geografische Informationssysteme (HGIS) in der Tourismusgeschichte: Transnationale Besucherströme des Ostseetourismus im 19. Jahrhundert. J. East Cent. Eur. Stud. 2021, 7, 357–388. [Google Scholar] [CrossRef]
  48. Pagenstecher, C.; Von der Strandburg zur Bettenburg. Zur Visual History des Bundesdeutschen Ostsee-Tourismus. In Tourism in the Baltic Region. Nordost-Archiv. Zeitschrift für Regionalgeschichte. 2012. Available online: https://docplayer.org/75710645-Nordost-archiv-zeitschrift-fuer-regionalgeschichte.html (accessed on 25 May 2024).
  49. HELCOM. Available online: https://helcom.fi/action-areas/fisheries/ (accessed on 25 May 2024).
  50. Scheffold, M.; Hense, I. Quantifying Contemporary Organic Carbon Stocks of the Baltic Sea Ecosystem. Front. Mar. Sci. 2020, 7, 571956. [Google Scholar] [CrossRef]
  51. CRESP. Wet to Dry Weight Conversations for Biota from Amchitka to Kiska. 2006. Available online: https://www.cresp.org/Amchitka/Final_WW_DW_3_13_06.pdf (accessed on 25 May 2024).
  52. Czamanski, M.; Nugraha, A.; Pondaven, P.; Lasbleiz, M.; Masson, A.; Caroff, N.; Bellail, R.; Treguer, P. Carbon, nitrogen and phosphorus elemental stoichiometry in aquacultured and wild-caught fish and consequences for pelagic nutrient dynamics. Mar. Biol. 2011, 158, 2847–2862. [Google Scholar] [CrossRef]
  53. Thurow, F. Estimation of the total fish biomass in the Baltic Sea during the 20th century. ICES J. Mar. Sci. 1997, 54, 444–461. [Google Scholar] [CrossRef]
  54. Köbbing, J.F.; Thevs, N.; Zerbe, S. The utilisation of reed (Phragmites australis): A review. Mires Peat 2013, 13, 1–14. Available online: http://mires-and-peat.net/media/map13/map_13_01.pdf (accessed on 20 August 2024).
  55. COPERNICUS Database. Available online: https://doi.org/10.2909/fe8d5d51-36ab-46d4-be61-dcfad7c308f1 (accessed on 24 May 2024).
  56. Feldman, M.V. Assessment of macrophyte store and accumulation of nutrients by aquatic vegetation in the Curonian Lagoon of the Baltic Sea. In Proceedings of the IEEE US/EU Baltic International Symposium, Klaipeda, Lithuania, 23–26 May 2006. [Google Scholar] [CrossRef]
  57. Chen, T.; He, T.; Benesty, M.; Khotilovich, V.; Tang, Y.; Cho, H.; Chen, K.; Mitchell, R.; Cano, I.; Zhou, T.; et al. Xgboost: Extreme Gradient Boosting. 2021. Available online: https://CRAN.R-project.org/package=xgboost (accessed on 25 May 2024).
  58. Wölfl, A.C.; Snaith, H.; Amirebrahimi, S.; Devey, C.W.; Dorschel, B.; Ferrini, V.; Huvenne, V.A.I.; Jakobsson, M.; Jencks, J.; Wigley, R. Seafloor Mapping—The Challenge of a Truly Global Ocean Bathymetry. Front. Mar. Sci. 2019, 6, 283. [Google Scholar] [CrossRef]
  59. Remane, A. Die Brackwasserfauna. Zool. Anz. 1934, 7, 34–74. [Google Scholar]
  60. Dolch, T.; Schernewski, G. Hat Wasserqualität eine Bedeutung für Touristen? Eine Studie am Beispiel des Oderästuars. In Aktuelle Ergebnisse der Küstenforschung. Berichte aus dem Forschung—Und Technologiezentrum Westküste der Universität Kiel; Daschkeit, A., Sterr, H., Eds.; Universität Kiel: Büsum, Germany, 2003; Volume 28, pp. 197–205. [Google Scholar]
  61. Preißler, S. Wasserqualität an Europäischen Küsten und ihre Bewertung Durch TOURISTEN—Eine Wahrnehmungsgeographische Untersuchung in Hamburg und auf Sylt. In IKZM-Oder Berichte; Universität Hamburg: Hamburg, Germany, 2008; Volume 54, p. 134. ISSN 1614-5968. Available online: https://databases.eucc-d.de/files/documents/00000738_IKZM-Oder_Berichte54.pdf (accessed on 20 August 2024).
  62. Bertram, C.; Ahtiainen, H.; Meyerhoff, J.; Pakalniete, K.; Pouta, E.; Rehdanz, K. Contingent Behavior and Asymmetric Preferences for Baltic Sea Coastal Recreation. Environ. Resour. Econ. 2020, 75, 49–78. [Google Scholar] [CrossRef]
  63. STECF (Scientific, Technical and Economic Committee for Fisheries). The 2015 Annual Economic Report on the EU Fishing Fleet (STECF-15-07); Publications Office of the European Union: Luxembourg, 2015; Available online: https://op.europa.eu/en/publication-detail/-/publication/d70ae979-7273-11e5-9317-01aa75ed71a1/language-en (accessed on 20 August 2024).
  64. Elofsson, K. Cost-effectiveness of the Baltic Sea Action Plan. Mar. Policy 2010, 34, 1043–1050. [Google Scholar] [CrossRef]
  65. Gren, I.-M.; Jonzon, Y.; Lindqvist, M. Costs of Nutrient Reductions to the Baltic Sea: Technical Report (No. 2008:1). Department of Economics, Swedish University of Agricultural Sciences, Working Paper. Available online: https://core.ac.uk/download/pdf/11695675.pdf (accessed on 25 May 2024).
  66. UBA (Umweltbundesamt). Preisentwicklung für Emissionsberechtigungen (EUA) Seit 2008. Available online: https://www.umweltbundesamt.de/daten/klima/der-europaeische-emissionshandel#teilnehmer-prinzip-und-umsetzung-des-europaischen-emissionshandels (accessed on 25 May 2024).
  67. Czajkowski, M.; Budziński, W.; Zandersen, M.; Zawadzki, W.; Aslam, U.; Angelidis, I.; Zagórska, K. The Recreational Value of the Baltic Sea Coast: A Spatially Explicit Site Choice Model Accounting for Environmental Conditions. Environ. Resour. Econ. 2024, 87, 135–166. [Google Scholar] [CrossRef]
  68. Hakanson, L.H.; Stabo, R.; Bryhn, A. Strategies for Remediation, Cost-Benefit Analyses and a Holistic Management Plan for the Baltic Sea. In The Fish Production Potential of the Baltic Sea; Environmental Science and Engineering; Springer: Berlin/Heidelberg, Germany, 2010; pp. 273–341. [Google Scholar] [CrossRef]
  69. Coalition Clean Baltic. Recreational Fishing in the Baltic Sea Region-A Summary. 2017. Available online: https://irp.cdn-website.com/53007095/files/uploaded/ccb-recreational-fishing-report-short-version-2018-02-27.pdf (accessed on 25 May 2024).
  70. Senasis, E. Cutting the coastal vegetation of the Curonian Lagoon to remove part of the biogenic materials from the lagoon. Feasibility Study. Vilnius 2007, 73. (In Lithuanian) [Google Scholar]
  71. Bučas, M. Distribution Patterns and Ecological Role of the Red Alga Furcellaria Lumbricalis (Hudson) JV Lamouroux Off the Exposed Baltic Sea Coast of Lithuania. Ph.D. Thesis, Klaipeda University, Klaipeda, Lithuania, 2009; 124p. Available online: https://www.ku.lt/uploads/documents/files/jti/studijos/MBucas2004-2009.pdf (accessed on 25 July 2024).
  72. Schernewski, G.; Friedland, R.; Carstens, M.; Hirt, U.; Leujak, W.; Nausch, G.; Neumann, T.; Petenati, T.; Sagert, S.; Wasmund, N.; et al. Implementation of European marine policy: New water quality targets for German Baltic waters. Mar. Policy 2015, 51, 305–321. [Google Scholar] [CrossRef]
  73. Coastal Reed Project. Available online: https://johnnurmisensaatio.fi/en/our-work/projects/coastal-reed-project/ (accessed on 25 July 2024).
  74. HELCOM ACTION. Analysis of Total Nitrogen in the Baltic Sea and Implications for Time Lag in Achieving Good Environmental Status (GES). 2021. Available online: https://helcom.fi/helcom-at-work/projects/action/ (accessed on 20 August 2024).
  75. Kulinski, K.; Pempkowiak, J. The carbon budget of the Baltic Sea. Biogeosciences 2011, 8, 3219–3230. [Google Scholar] [CrossRef]
  76. HELCOM Eutrophication in the Baltic Sea—An Integrated Thematic Assessment of the Effects of Nutrient Enrichment. 2009. Available online: https://www.helcom.fi/wp-content/uploads/2019/08/BSEP115B-1.pdf (accessed on 20 August 2024).
  77. Harvey, E.T.; Walve, J.; Andersson, A.; Karlson, B.; Kratzer, S. Effect of Optical Properties on Secchi Depth and Implications for Eutrophication Management. Front. Mar. Sci. 2019, 5, 496. [Google Scholar] [CrossRef]
  78. Zettler, M.L.; Karlsson, A.; Kontula, T.; Gruszka, P.; Laine, A.O.; Herkül, K.; Schiele, K.S.; Maximov, A.; Haldin, J. Biodiversity gradient in the Baltic Sea: A comprehensive inventory of macrozoobenthos data. Helgol. Mar. Res. 2014, 68, 49–57. [Google Scholar] [CrossRef]
  79. Telesh, I.V.; Schubert, H.; Skarlato, S.O. Revisiting Remane’s concept: Evidence for high plankton diversity and a protistan species maximum in the horohalinicum of the Baltic Sea. Mar. Ecol. Prog. Ser. 2011, 421, 1–11. [Google Scholar] [CrossRef]
  80. HELCOM. Economic and Social Analyses in the Baltic Sea Region—HELCOM Thematic Assessment 2011–2016. Baltic Sea Environment Proceedings 160. 2018. Available online: https://helcom.fi/wp-content/uploads/2019/12/BSEP160.pdf (accessed on 20 August 2024).
  81. TGS. Wind Data and Insights to Explore Opportunities. Available online: https://map.4coffshore.com/offshorewind/ (accessed on 20 August 2024).
  82. HELCOM. Checklist of Baltic Sea Macro-Species. Baltic Sea Environment Proceedings No. 130. 2012. Available online: https://www.helcom.fi/wp-content/uploads/2019/08/BSEP130-1.pdf (accessed on 20 August 2024).
  83. de Jonge, V.N.; Pinto, R.; Turner, R.K. Integrating ecological, economic and social aspects to generate useful management information under the EU Directives’ ‘ecosystem approach’. Ocean Coast. Manag. 2012, 68, 169–188. [Google Scholar] [CrossRef]
  84. Homaio. 2030 EUA Price Predictions: Expert Analysis of 3 Scenarios. Available online: https://www.homaio.com/post/2030-eua-price-predictions-expert-analysis-of-3-scenarios (accessed on 20 August 2024).
  85. BalticRIM. Integrating Cultural Heritage into Maritime Spatial Planning in the BSR. Available online: https://interreg-baltic.eu/wp-content/uploads/2021/08/124.pdf (accessed on 20 August 2024).
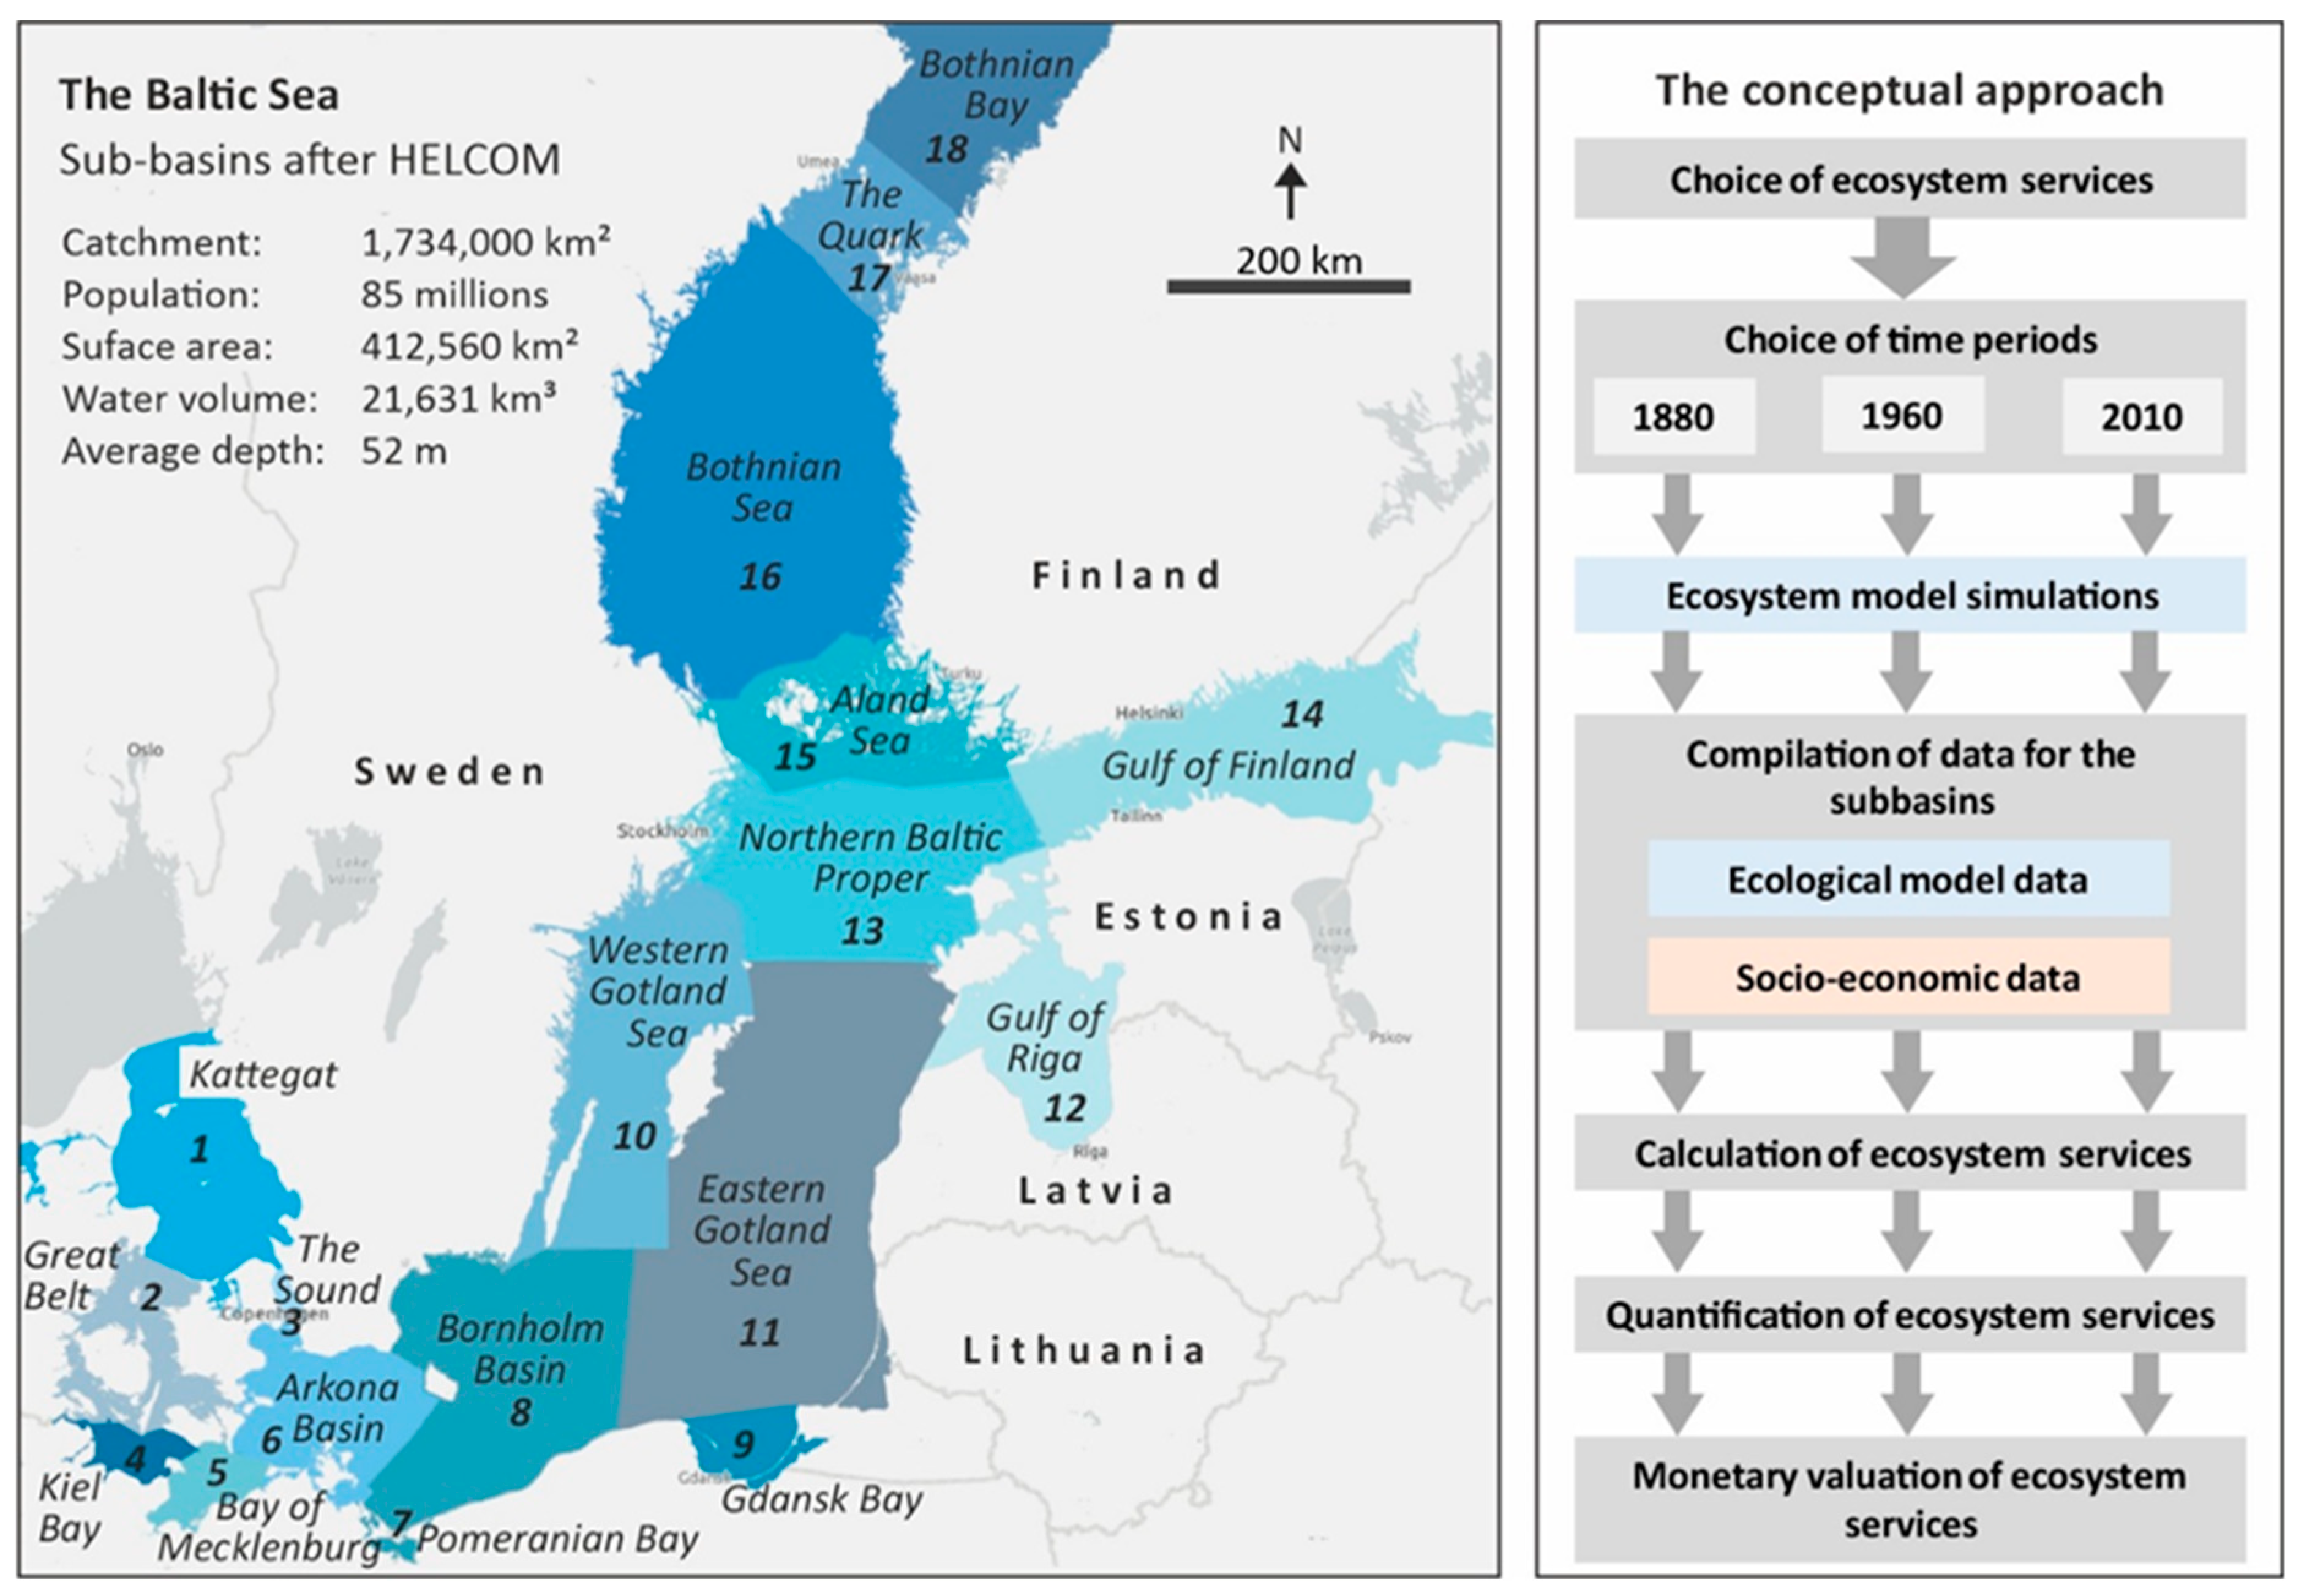
Figure 1. The Baltic Sea and its subdivision into the official assessment sea areas (sub-basins) according to HELCOM (Helsinki Commission) as well as a basic data about the Baltic Sea after HELCOM. The numbers merely indicate the basins. The diagram visualizes our conceptual approach.
Environments 11 00200 g001
Figure 2. Exemplary model results for the Arcona Basin. The data are spatially integrated results over the sub-basin. Shown are averages and ranges over 20 years covering the periods around 1880 (pre-industrial reference conditions), 1960 (good ecological state of the Baltic Sea), and 2010. The parameters and the data served as the basis for the calculation of ecosystem services.
Environments 11 00200 g002
Figure 3. Provisioning and regulating ecosystem services in the Baltic Sea. Shown are data averaged over 20 years, covering the periods around 1880, 1960, and 2010. The data are spatially averaged over the 18 HELCOM (Helsinki Commission) assessment areas (sub-basins). The data are based on 3D-ERGOM model simulations.
Environments 11 00200 g003
Figure 4. Cultural ecosystem services in the Baltic Sea. Shown are data averaged over 20 years, covering the periods around 1880, 1960, and 2010. The data are spatially averaged over the 18 HELCOM (Helsinki Commission) assessment areas (sub-basins). The data are based on 3D-ERGOM model simulations and historic socio-economic data.
Environments 11 00200 g004
Figure 5. Monetary provisioning and regulating ecosystem services in the Baltic Sea. Shown are data averaged over 20 years, covering the periods around 1880, 1960 and 2010. The data are spatially averaged over the 18 HELCOM (Helsinki Commission) assessment areas (sub-basins). The data are based on 3D-ERGOM model simulations.
Environments 11 00200 g005
Figure 6. Monetary cultural ecosystem services in the Baltic Sea. Shown are data averaged over 20 years, covering the periods around 1880, 1960, and 2010. The data are spatially averaged over the 18 HELCOM (Helsinki Commission) assessment areas (sub-basins). The data are based on 3D-ERGOM model simulations and historical socio-economic data.
Environments 11 00200 g006
Figure 7. Summarized monetary ecosystem services flows in the Baltic Sea. Carbon storage (sequestration) shows value calculated based on market prices in 2010 and in 2023.
Environments 11 00200 g007
Disclaimer/Publisher’s Note: The statements, opinions and data contained in all publications are solely those of the individual author(s) and contributor(s) and not of MDPI and/or the editor(s). MDPI and/or the editor(s) disclaim responsibility for any injury to people or property resulting from any ideas, methods, instructions or products referred to in the content.