Abstract
Decentralized electricity production at household scale, particularly by solar panels, has recently grown due to increased technology feasibility and financial support programs. Further development in this field requires the introduction and efficient use of energy storage technologies. This research aims to evaluate the benefits and economic justification of implementing energy storage systems in private households by using system dynamics modelling. Household electricity consumption is a dynamic problem; therefore, the system dynamics approach allows the development of an exploratory model that accounts for the causal relationships and feedback loops in the system. Specifically, an hourly consumption model is developed to analyze the electricity costs in four scenarios: (1) a standard grid-connected system, (2) a PV system with net metering, (3) a grid-connected system with a connected battery, and (4) a grid-connected system with a combined PV and battery storage system. The structure of the build system dynamics model is described with a Latvian context case. It is found that in Latvian climate-specific conditions, the profitability of installing PV and PV and battery systems in private households in Latvia is justified by both summer and winter conditions. The developed model can be used to analyze the real electricity profiles of specific households, determining the profitability of installing energy-efficient solutions, and is adaptable for analyzing the situations of other countries or accumulation systems.
1. Introduction
The growth of renewable energy sources is part of a global trend in the energy sector. New solar, wind, and other renewable energy production facilities are being built and regularly put into operation []. In 2022, the share of renewable sources in the global electricity generation reached 39% of the total volume, and it is expected to increase in the near future []. The main factors driving this trend are the practically zero emissions produced and the abundance of primary energy sources. However, the intermittency of the supplied energy due to weather conditions [,] and supply-demand displacement in time [] significantly limits the direct utilization of renewable sources in power systems. Additionally, the operation of power systems, whether on a broader or smaller scale, is characterized by an uneven energy demand, which necessitates conditions for load balancing [].
One of the most promising directions to address the challenges of utilizing the potential of renewable sources in energy supply is the implementation of energy storage systems. These systems can capture excess energy during periods of low consumption and provide it during peak load periods, ensuring flexibility on different time scales []. Moreover, for individual consumers, i.e., households, this creates an opportunity to increase the self-consumption of solar energy [] and achieve grid independence, as well as gain economic benefits by storing energy during low-price periods []. Battery energy storage has been identified as the dominant type used at household scale [,], although the high battery price limits their outspread in households [].
The demand for batteries worldwide is experiencing rapid growth due to their potential to incorporate additional renewable energy sources into our power systems. Additionally, batteries have the capability of making the industrial and transportation sectors more environmentally friendly, which, in turn, positively impacts the electrification of other sectors []. By 2030, the worldwide need for batteries is projected to surpass 2000 GWh []. Although consumer electronics were widely used in 2020, their low energy capacities, such as those found in phones, resulted in a comparatively low demand in terms of gigawatts. However, the substantial growth in demand can be primarily attributed to the shift toward electric transportation, which will account for most of the battery demand in 2030, particularly in terms of total energy storage capacity []. The predicted global demand for batteries until 2030 is shown in Figure 1.
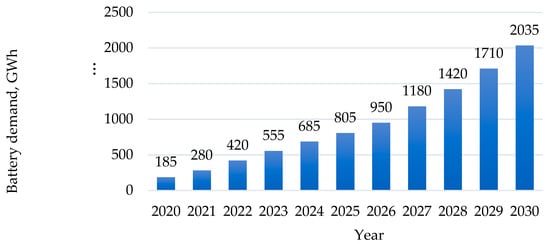
Figure 1.
Global battery demand prediction, GWh [].
Due to the global pandemic and war crisis, residential consumers have experienced a rise in energy consumption costs. In accordance with the Paris Climate Agreement, the adoption of zero-energy designs in residential buildings can significantly contribute to addressing climate change. This agreement urges countries to enhance the utilization of clean energy sources to reduce carbon dioxide emissions. Consequently, numerous homeowners are actively seeking out renewable energy options, such as solar energy and wind energy, in order to minimize their carbon footprint and achieve cost savings []. These factors also explain the need to analyze and implement accumulation to ensure effective solutions and greater benefits.
The use of renewable resources, optimization possibilities for household electricity consumption, and the benefits of implementing energy storage systems have been analyzed in previous articles. For instance, in Wang et al. [], an analysis of energy storage capacity optimization has been conducted, incorporating economic benefit indicators and environmental impact assessment methods. As a result of optimization, a 40% reduction in the volume of electricity obtained from the grid is achieved, significantly shortening the payback period of investments []. In Miletic et al. [], a mixed-integer linear programming (MILP) model is applied to analyze different scenarios of household automation and dynamic electricity pricing, leading to the conclusion that battery-owning households protect the suppliers from revenue and profit drops. It also shows that batteries are not only beneficial for the power system and the end-users, but they also facilitate the transition towards new business models for traditional suppliers []. However, the majority of other software applications used in the field of energy are black box models. Reiterating these models in a white box framework allows a more in-depth investigation of their underlying structures and factor interactions. In the long term, this allows the development of a comprehensive system dynamics model, which can help understand the behavior of the system and aid in making the most optimal decisions.
A dedicated approach for analysis and simulation of dynamic problems with a white box model is the system dynamics (SD) modelling. The SD approach is unique in that it is based on the theory of system dynamics, which focuses on understanding and uncovering the relationships between the behavior of a system’s structure and its existing structure. Graces et al. [] have employed an SD approach to study the possibilities of sustainable electricity supply for small off-grid communities in Colombia. However, the scale of the analysis of their research is regional and the energy storage system is not directly included within the SD model []. Kubli and Ulli-Beer [] have used SD for system-wide modelling of the decentralization of energy networks, and Zapata Riveros et al. [] have elaborated on this by SD modelling the diffusion of prosumer communities. They include a battery adoption feedback loop in their model; however, their main focus is the user (household) transition from consumer to prosumer status. The existing body of literature still lacks studies that particularly consider the hybrid energy accumulation system’s feasibility at the household scale especially with white box models.
As electric energy storage technologies advance, the moment has come when it is possible to carry out extensive commercialization and integration of storage technologies both in the public and private sectors. Therefore, the aim of this article is to analyze and evaluate the benefits and economic justification of implementing energy storage systems in private households using the SD modelling that allows to directly investigate the linkages between system components and their behavior. The analysis considers particular climatic conditions (Latvia is used for the case study) and the current level of development in the field of energy storage. The evaluated scenarios include solar panel (PV) use for renewable energy generation in households, as they are the most widely available technology, and lithium-ion batteries for energy storage, as they are the most widespread technology [,], and they are a technology with high potential to be an optimal solution for energy storage. Overall, the system’s profitability is assessed for four configuration scenarios and considering varied electricity prices.
In the next section, the structure of the system dynamics model is described in the context of the Latvian electricity system. Model components, functions, and parameters are presented in detail, illustrating different configurations under evaluation, namely, PV or battery with net metering in the system as well as PV with battery energy storage. In Section 3, daily energy flows and monthly profiles are presented for the different configurations. The resulting outcome of the simulations for four consecutive years are provided in aggregates concerning annual cost savings, i.e., electricity consumed from the grid and payback period for the investments. Comments on simulation results driven by various price levels (from low in 2019 to very high prices in 2022) and discussion conclude the paper.
Importantly, the described approach to SD modelling in Latvia is a case study; hence, the locally relevant assumptions are taken. Of course, for household level research, such assumptions that are related to economic, political, and even geographic placement conditions vary across countries and even counties (i.e., solar irradiation in northern or southern counties in central Europe). Hence, this exploratory model is a demonstration of the accumulation feasibility assessment and a prior step for more extended forecasting models. The approach can be used in other countries with minimal adjustments to the assumptions described in the methodology. To facilitate the replication of the process in any context, it is advisable to perceive the description of the methodology at a theoretical level, considering differences between countries that may affect the initial assumptions.
2. Materials and Methods
2.1. Electricity Sector in Latvia
In recent years in Latvia, structural changes in the total consumption of energy resources have been observed, i.e., as the share of natural gas consumption decreases, the share of RES in the total consumption of energy resources has increased []. In 2020, the share of natural gas in total energy production was 20.6%, while RES was 37.5%. With the increasing RES share, Latvia is coming closer to achieving its RES promotion target, which is to ensure that 50% of the gross final consumption is produced from RES by 2030 []. Latvia has the third highest share of RES in the final energy consumption in the European Union; in 2020 it was 42.13%, while the EU average was 22.09% [].
The installation of solar panels in Latvian households has also flourished in recent years. According to the latest data from systems operator “Sadales tīkls” LLC, which is the leading electricity network maintainer and developer in Latvia, in the first quarter of 2022 (from January to March) 495 solar PV panel systems with a total capacity of 678 kilowatts (kW) were connected to the distribution grid, of which 488 were solar panels for the production of electricity for self-consumption with a capacity of up to 11.1 kW, and 7 were solar power plants. This is approximately six times more than in the first quarter of 2021 when a total of 90 microgenerators and solar power plants with a total capacity of 265 kW were connected to the system []. This pronounced progress can be explained by an unprecedentedly large increase in the price of electricity on the exchange, as well as the influence of various state support measures for the installation of solar panels, as well as Russia’s war in Ukraine, highlighting the need to strengthen the country’s energy independence and the transition from fossil to renewable energy resources.
Latvia participates in NordPool, Europe’s leading electricity market, which offers trading and associated services in both day-ahead and intraday markets across 16 European countries. NordPool comprises a commercial electricity exchange function and a market interconnection operator function. The electricity price of the system is calculated based on sales and purchase volumes, taking into account the available transmission capacity in the Nordic market. The system price is the Nordic reference price for electricity trading, which varies in different NordPool market areas [].
Additionally, a net electricity accounting (metering) system operates in Latvia, which regulates the order in which payments are made for electricity received from the system, and in which the distribution system operator accounts for the electricity that the household user transfers to and receives from the system. The settlement period of the electricity net accounting system is one calendar month. If more electricity is transferred in the system than received, the corresponding amount of electricity is credited in the next electricity billing period [].
However, the situation with the implementation of storage systems in Latvian households is not so bright. In fact, so far, the integration of storage technologies in households in Latvia is close to zero. There is a lack of aggregated data on the implemented energy storage projects. Hence, there is a need to analyze the profitability of the introduction of electricity storage in Latvian households in order to promote a clean and fair energy restructuring and lower carbon emissions [].
2.2. The Structure of the Exploratory Model
Essentially, household electricity consumption is a dynamic problem. Hence, to evaluate the profitability of installing energy storage systems in private households in Latvia, a system dynamics (SD) modelling method was used. SD is a versatile tool that allows for investigating the causal relationships between factors that are interlinked in complex technological and socioeconomic systems and uncovering their underlying structures []. SD modelling is a computer-based simulation method appropriate for analyzing a system’s changes over time, e.g., dynamic tendencies [].
The SD method is based on system dynamics theory, which involves studying the relationships between the behavior of a system and its underlying structure. System dynamics relies on three main concepts, stocks, flows, and feedback loops, along with well-defined system boundaries and causal relationships. By appropriately utilizing these concepts, it is possible to obtain explanatory results []. In general, the process of developing a system dynamics model consists of several sequential steps. These steps include problem formulation, which is the identification of dynamic hypotheses that explain the causes of the problem, model formulation and simulation, which means model testing to assess its correspondence to the real situation, as well as policy formulation and drawing conclusions [,].
In the current study, an hourly consumption model was developed to analyze the electricity costs for (1) a standard grid-connected system, (2) a PV system with net metering, (3) a grid-connected system with a connected battery, as well as a (4) a grid-connected system with a combined PV and battery storage system. The modelling was conducted using the Stella Architect software.
The aim of the model is to determine the profitability of installing a battery storage system considering a household’s overall electricity consumption profile. Figure 2 depicts the primary algorithm for a household solar panel (PV) system with net metering, while Figure 3 explains the case with an additional battery connected to the solar panel system.
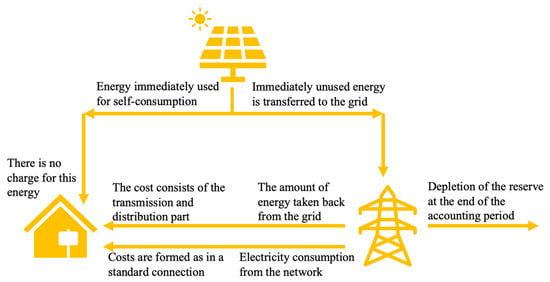
Figure 2.
Algorithm for the PV system with net metering for the household.
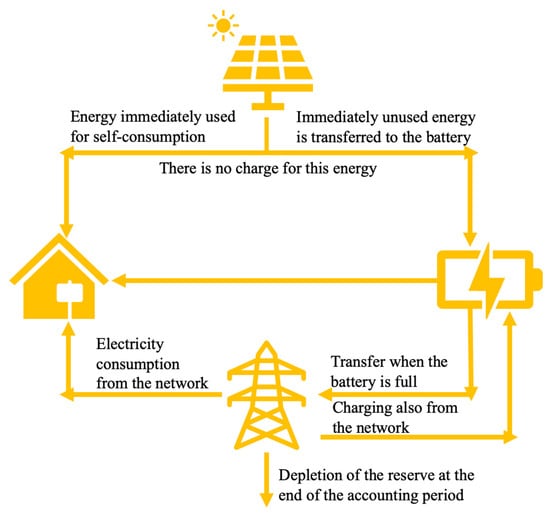
Figure 3.
Algorithm for the system with PV panels and battery energy storage.
In a net metering system, when the solar panels generate more energy than the household appliances can immediately consume at any given moment, the excess electricity is automatically fed into the utility grid. The amount of electricity fed into the grid can be credited and used to offset consumption at a later time during the accounting year. However, at the end of the net metering accounting period, any accumulated electricity surplus is reset, and a new accounting balance is started. If, at any given time, the combined amount of energy generated by the PV system and stored in the grid is insufficient to meet the household’s demand, the electricity is consumed from the grid as if there were no PV panels installed.
By adding a battery for the accumulation of generated energy to the aforementioned system, it is possible to provide greater independence from the grid connection, as well as gain economic benefits by efficiently utilizing the capabilities of the battery. In this system, when more energy is generated than the household can consume at any given moment, the excess electricity is primarily stored in the battery, which happens automatically within the system. In this case, an electricity purchase from the grid is only required for the moments when there is insufficient energy production from the PV system and insufficient battery supply to cover the load. Similarly, the model includes that for a more cost-effective use of the battery, it may be charged from the grid during times when this is economically justified.
2.3. Model Components and Parameters
The main factors that influence the cost of electricity and household consumption profiles for different systems are represented in the SD model as various elements: stocks, flows, and feedback loops. The values for these elements are defined through mathematical equations and constants. In the hourly model of the dynamic system, the household consumption profile is assumed based on input data obtained from a system dynamics model developed in 2021 for studying the potential of aggregators to reduce renewable energy surplus in Latvia []. The model assumes hourly electricity prices based on historical indicators from the 2021 NordPool electricity market [], considering them as indicative of electricity price trends for the next decade. Although the prices of electricity and gas have fallen at the moment, in comparison to 2022, these assumptions are ever so relevant because changes are expected in distribution system service tariffs—the tariff fee for customers will increase due to inflation, the transmission tariff will also increase, and the geopolitical conditions and long-term future forecasts have to be considered. Additionally, to determine the sensitivity of the model’s results from the input data, the development process includes a comparison with hourly electricity price data from 2019 and 2022.
In the model, separate system dynamics structures are created for all analyzed variants of the household electricity system: (1) the standard grid-connected system, (2) the PV system with net metering, (3) a grid-connected system with an integrated battery energy storage, and (4) a grid-connected system with PV and an integrated battery energy storage. As these variants are based on similar basic structures, only the fourth system (as the most comprehensive one, which considers all possible subsystems) is discussed in detail in the methodology section.
The hourly amount of PV produced electricity, based on Latvian climatic conditions, is determined in the sub-model: PV installed capacity and production (see Figure 4). Solar electricity production capacity is based on average solar irradiation data [] and assumptions about the average efficiency of PV panels []; these data are obtained from a system dynamics model developed in 2021 []. The installed PV capacity is calculated taking into account the considered household’s annual electricity consumption, which is assumed to be 7800 kWh/year. It is also assumed that the PV panels are installed on a roof with 45° inclination on the south side of the house. Therefore, the estimated PV power included in the model is 8 kW [].
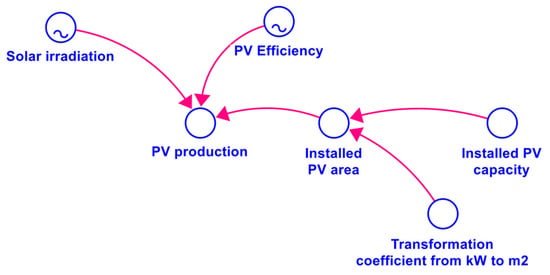
Figure 4.
PV installed capacity and production sub-model.
The transformation coefficient from kW to m2 is set as 0.75 kW/m2; thus, the PV area is calculated according to Formula (1).
where
—installed PV area for a PV system, m2.
—installed PV capacity for a PV system, kW.
transformation coefficient from kW to m2, kW/m2.
The production volume of the solar panel system is determined by Formula (2).
where
—solar irradiation, W/m2.
PV efficiency, %.
—required PV area for a PV system, m2.
To determine the electricity costs incurred for the specific household profile, for electricity procured from grid connection, the NordPool hourly price tariff for 2021 is used. The fixed electricity connection fee is also considered, which is 3.87 EUR/month for the considered household profile, according to the distribution operator’s data []. The model also includes the electricity sales fee (2.68 EUR/MWh), the electricity transmission fee (40.76 EUR/MWh), and the VAT for electricity (21%). These values are assumed based on the costs for equivalent household profiles in Latvia in the given period according to the market offers of electricity merchants such as Elektrum, Enefit, and others [].
The sizing of the battery is a crucial parameter of the system. As emphasized by [], too frequent discharge at low level or, on the contrary, too rare full charge in both cases lead to a shorting of the lifetime of the system. For the battery capacity sizing, an additional model optimization is performed. By evaluating the quantity and power of the installed PV panels according to the obtained optimization results, it is concluded that the optimum for the particular household is to install a battery with a 5 kWh electricity capacity to cover the nighttime load. The daily amount of electricity transferred to the network is also considered. Based on previous research [] developed by the authors, where different accumulation alternatives were compared, the model includes a lithium-ion battery as the best solution for storing electricity in households. Technological parameters of this type of battery, such as charge/discharge efficiency, average lifetime, and energy storage duration, are included in the model. Additional considerations that are added to the model include the conditions for battery charging from the grid based on solar energy sufficiency, as well as accounting for the daily surplus of solar energy, which is affected by both the hourly surplus and the household consumption profile. To increase the added value of connecting a battery to the system, the additional charging of the battery from the grid is implemented based on the lowest electricity tariff per MWh in the NordPool market. Typically, when installing the battery, it is necessary to account for additional installation and replacement investments; however, in this hourly model, these costs are not taken into account since the overall costs for energy taken from the network in each case are compared during the whole year.
In the SD model structure, the overall electricity costs for a household PV panel and lithium-ion battery system are described by the stock: the electricity costs with PV and battery (see Figure 5). These costs are affected by the incoming flow, i.e., the hourly cost of electricity with PV and battery, which depends on the electricity tariff, the fixed electricity connection fee, the delivery (transmission) costs of solar energy, which is taken back from the grid, and the amounts of electricity used from the grid to charge the battery and cover consumption.
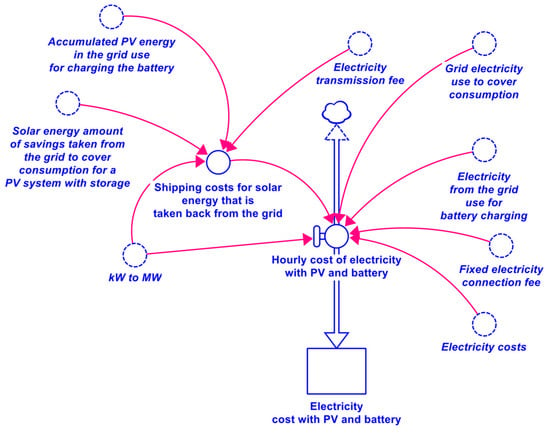
Figure 5.
Electricity cost sub-model for a system with PV and battery.
The hourly cost of electricity for a system with PV and battery is determined by Formula (3).
where
—hourly cost of electricity with PV and battery, EUR/h.
—fixed electricity connection fee, EUR/h.
—use of grid electricity to cover consumption, kW.
—using electricity from the grid to charge the battery, kW.
—electricity tariff, EUR/MWh.
transformation coefficient from kW to MW, kW/MW.
—delivery costs for solar energy that is taken back from the grid, EUR/h.
The quantity of electricity used from the grid to cover battery charging at more favorable prices is determined by Equation (4). As mentioned earlier, the battery is charged from the grid if the lowest price condition is not met within a five-hour period, also taking into account the available battery charging capacity, and the accumulated solar energy is sufficient to perform the battery charging.
where
—using electricity from the grid to charge the battery, kW.
—lowest price condition for charging the battery from the grid.
—available battery charging capacity using electricity taken from the network for charging, kW.
—PV energy sufficiency condition for charging the battery from the grid.
The use of grid electricity to cover consumption in the model is determined according to Formula (5). It is affected by the household consumption profile, i.e., if the load is greater than the amount of energy currently produced by PV, as well as the energy stored in the battery, and the network has been used up, then electricity is bought directly from grid, with an additional incurred cost for the electricity consumed.
where
—use of grid electricity to cover consumption, kW.
—household consumption profile, kW.
—PV generated electricity volume for a system with PV and battery, kW.
using the energy stored in the battery to cover the consumption, kW.
amount of stored solar energy consumed from the grid, kW.
The delivery costs for solar energy that is recovered from the grid (from storage) are affected by the recovered electricity amount for the household’s immediate consumption, the amount of stored electricity used to charge the battery, and the electricity transmission fee (as mentioned previously, 40.76 EUR/MWh []). The total delivery cost for taking back the stored solar energy from the grid in the model is represented by Equation (6).
where
—delivery (transmission costs for solar energy that is taken back from the grid, EUR/h.
—amount of stored solar energy consumed from the grid, kW.
—using PV electricity stored in the grid to charge the battery, kW.
—electricity transmission fee, EUR/MWh.
transformation coefficient from kW to MW, kW/MW.
After determining the amount of available electricity that remains after covering the household energy consumption, and after determining the available battery capacity, the amount of energy stored in the battery is determined, under the specific conditions for every hour of the year, in the sub-model: the amount of energy stored in the battery (see Figure 6). Also, taking into account the amount of solar energy stored in the network, the model includes that the available battery charging capacity is affected by the battery charging efficiency, which was assumed to be 0.98, based on the data found in the literature [].
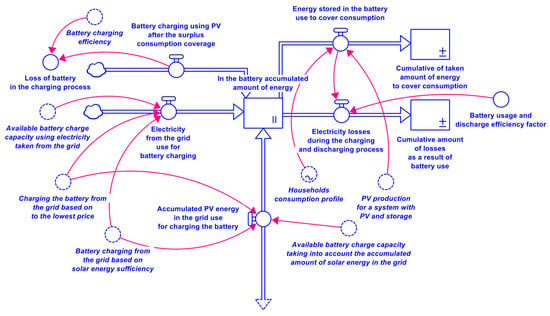
Figure 6.
A part of the sub-model: the amount of energy stored in the battery.
The stock representing the amount of energy accumulated in the battery is influenced by the flow that describes the charging fraction of the battery using the surplus PV energy after covering household consumption. This flow depends on the available battery charging capacity, taking into account the availability of surplus PV energy after consumption coverage. Additionally, the stock is affected by the incoming flow, which describes the amount of electricity that is being used for battery charging from the grid (see Equation (4)). Hence, the battery is primarily charged based on the sufficiency of solar energy and the available battery charging capacity; after that, it is charged retrieving stored energy from the grid, and, lastly, when it is economically justified, the battery is charged from grid.
The accumulated PV energy stored in the grid used for charging the battery is also an incoming flow, and its impact can be described similarly to the previous flows. However, in this case, instead of available grid electricity, the quantity of stored energy is dependent on the amount of solar energy stored in the grid, which is described by Equation (7).
where
—PV energy accumulated in the grid use for charging the battery, kW,
—lowest price condition for charging the battery from the grid,
available battery charging capacity using electricity taken from the network for charging, kW,
—PV energy sufficiency condition for charging the battery from the grid.
Similarly, the amount of energy accumulated in the battery is influenced by outgoing flows. The quantity of stored energy in the battery decreases when the consumption is covered using the energy stored in the battery. This relationship is described by Formula (8) in the model.
where
—energy stored in the battery use to cover consumption, kW.
—household consumption profile, kW.
—PV production volume, kW.
—available battery discharge capacity, kW.
Electricity losses also affect the amount of energy stored and transferred, which was described in the model as the outgoing flow from the stock of the amount of energy stored in the battery according to Formula (9).
where
—electricity losses during the discharging process, kW.
—using the energy stored in the battery to cover consumption, kW.
—battery usage and discharge efficiency factor.
The overall sub-model describing the PV and energy storage system also influences the fraction of PV energy transmitted and stored in the grid. This part of the model is depicted in Figure 7.
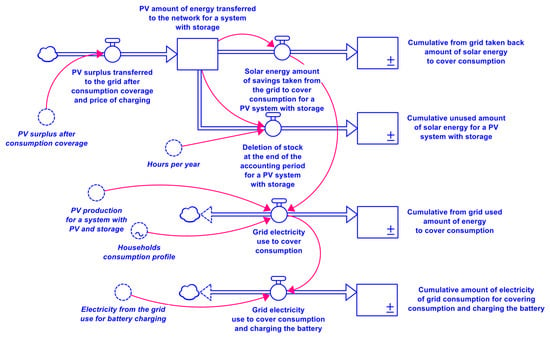
Figure 7.
Sub-model of PV surplus accumulation in the grid and its further utilization.
The stock, i.e., the PV energy transmitted to the grid with storage system, is influenced by the previously described flow, i.e., the accumulated PV energy stored in the grid used for charging the battery, as well as the incoming flow that accounts for the excess energy transmitted to the grid after meeting the consumption and battery charging, considering electricity losses as well (refer to Formula (10)).
where
—surplus PV transferred to the network after covering the consumption and charging the battery, kW.
—surplus PV energy after covering consumption, kW.
—battery charging using surplus PV after covering consumption, kW.
—losses during the battery charging process, kW.
Similarly, the volume of energy stored in the grid is influenced by outgoing flows. In this sub-model, the energy stored in the grid is used to meet household consumption, which is represented by the flow, i.e., the amount of solar energy taken from the grid for consumption in the PV system with storage, which is described by Equation (11).
where
—the amount of stored solar energy recovered from the grid to cover the household’s consumption, kW.
—household consumption profile, kW.
—PV production volume, kW.
—using the energy stored in the battery to cover consumption, kW.
—the amount of PV energy transferred to the network for the system with storage, kWh.
The sub-model of the PV and energy storage system also takes into account the degradation factor of the storage at the end of the accounting period, which describes the amount of energy lost. In this sub-model, this aspect is described by the flow, i.e., the degradation of storage at the end of the accounting period for the PV system with storage, which is influenced by the parameter of the number of hours per year, as well as the volume of PV energy transmitted to the grid. The relationship is described by Equation (12).
where
—stock degradation.
—number of hours per year, h.
—the amount of PV energy transferred to the network for the system with storage, kWh.
3. Results
This section provides the key results that describe the profitability of installing an energy storage system in households in Latvian conditions, considering the household’s overall electricity consumption profile.
After simulating the systems behavior at NordPool’s hourly electricity prices for the year 2021, it was seen that the total cost of electricity for a household with a total annual consumption of 7800 kWh/year and consuming only energy from the network is 2663.55 EUR/year. However, if a household of the same profile installs solar panels, uses the produced electricity for self-consumption, and uses the grid as storage for surplus, then the total cost of electricity is 715.82 EUR/year, thus a significant improvement is seen. If a lithium-ion battery is also connected to the PV panels and the system is used economically, then the household’s cost of electricity is 639.41 EUR/year. Cost differences from system dynamics simulations for three different years are summarized in Table 1.

Table 1.
Comparison of electricity costs.
In Table 1, a significant difference in the total annual electricity costs can be seen, depending on which year’s data (NordPool electricity exchange price) is selected in the simulation as the predicted electricity prices. This is also explained in Figure 8, with a visual comparison of the average daily NordPool tariff between the years, which were analyzed and compared in the system dynamics model.
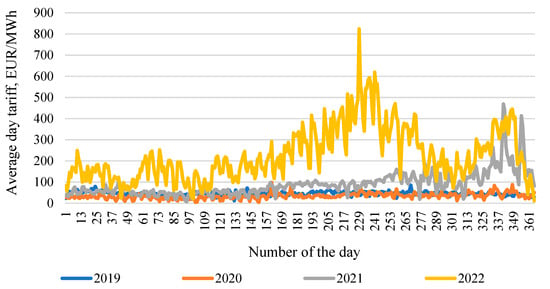
Figure 8.
Historic electricity prices.
These yearly cost differences were influenced by different external conditions. In 2019, the electricity exchange price in Latvia decreased compared to 2018, and 84.7% of the total consumption was covered using local generation. Therefore, the cost of electricity was relatively acceptable. In terms of electricity prices, 2019 to 2020 can be considered a moderate period for Latvia. In contrast, in 2021, an increase in electricity prices was observed, reaching new historical monthly average price records from September onwards. Electricity prices were rising all across Europe due to record-high gas prices and CO2 emission allowance prices. Other influencing factors were the lower power production in wind and hydroelectric power plants in Europe, which had to be covered by fossil resources. Further on, 2022 was marked by an even bigger increase in electricity prices every month, which reached 156% in comparison to the increase in 2021. Therefore, in the data obtained from the model, the costs, for example, for solely network connected system doubled for 2022. One of the main reasons for the increase in prices was Russia’s invasion of Ukraine, which resulted in the refusal of electricity imports from Russia and Belarus.
Figure 9 shows the dynamics of battery charging and discharging (kWh) depending on the electricity tariff at a given moment (EUR/kWh). The graph represents approximately one week from the entire simulated period. The amount of energy stored in the battery is represented by the blue curve, while the electricity tariff is represented by the red curve. It is possible to find that at higher electricity prices, a faster battery discharge process takes place, while at lower electricity prices, the opposite happens, i.e., the battery is charged.
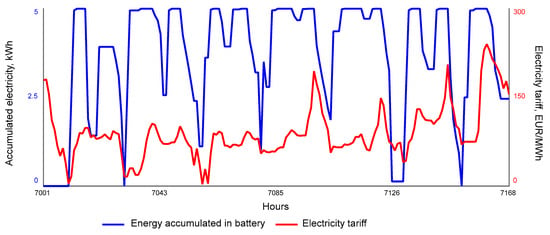
Figure 9.
Battery charging and discharging based on the electricity tariff.
According to the results gathered from the model, the profitability of installing an electricity storage was checked for a Latvian case study with the existing solar potential and annual irradiation intensity and taking into account the cost of electricity, which affects the principles of the operation of the storage system. The obtained results for the particular household described above with an installed PV and storage system, for one day (24 h basis) of average electricity load for a summer month, can be seen in Figure 10.
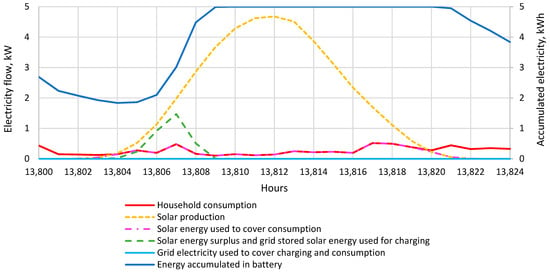
Figure 10.
Daily energy flow profile for a system with PV and battery on a summer day.
In summer, the household’s electricity consumption is relatively low (see the red curve in Figure 10); therefore, the amount of energy stored in the battery is enough to cover the consumption during the night hours (represented by the dark blue line), while during daytime, the amount of energy produced by the PV panel system becomes large enough to not only cover the household’s consumption but also fully charge the battery. In addition, in the particular day analyzed in Figure 10, it can be seen that the battery is also charged in the morning, using the surplus of PV energy stored in grid after covering the consumption. It is possible to establish that under the specific conditions, on a summer day, electricity from the grid is not consumed, and the amount of electricity stored in the grid is also not used. On the contrary, the storage is replenished, providing a larger amount of available energy storage for the days when the amount produced by the solar panels will be insufficient to cover the consumption.
Although the distribution of the total electricity profile for each of the modelled days is slightly different, overall, this justifies the profitability of installing electricity storage for the period when the solar irradiation is higher and there are more sunny days, taking into account the weather conditions in Latvia.
To also check the effect of seasonality on the profitability of the installation of the storage system in Latvia, the data for daily electricity profile for a day in a winter month were analyzed. The obtained results are reflected in Figure 11.
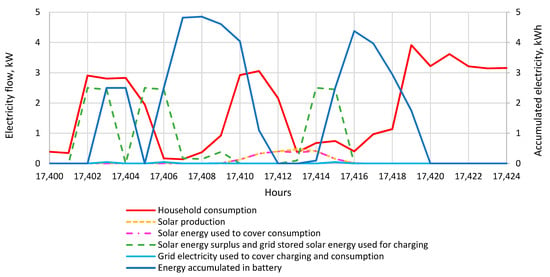
Figure 11.
Daily energy flow profile for system with PV and battery on winter day.
As can be seen from the obtained graph, household electricity consumption is relatively higher in winter. During the winter day, the energy demand is partly covered by the amount of energy stored in the battery (see dark blue line in Figure 11), while the electricity consumption from the grid, for the tariff of that moment, is very small during this day. This parameter is described by the light blue line, which is almost at the zero level in Figure 11.
In the winter months, the solar energy surplus and grid stored solar energy is used to charge the battery, which is described by the green dashed curve in the graph. However, during the winter day, under Latvian conditions, after covering the consumption and charging the battery, there is no amount of solar energy left to be transferred to the network because it is completely consumed. In general, it is possible to observe the profitability of installing an electricity storage system in a household in Latvia also during the winter period.
To obtain a yearly overview and to evaluate the modelled system from the point of view of monthly energy flows, the results obtained from the system dynamics model (using 2021 data) were summarized. Figure 12 shows the profile of energy flows by the months of the year if the household has a PV system installed, while Figure 13 describes a system with PV and battery.
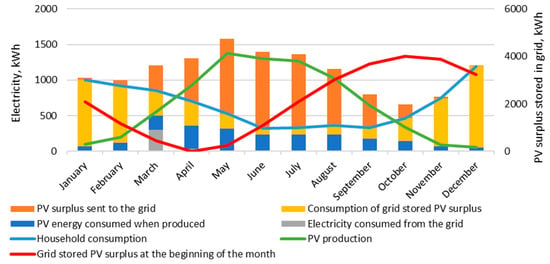
Figure 12.
Monthly energy profile for a PV system.
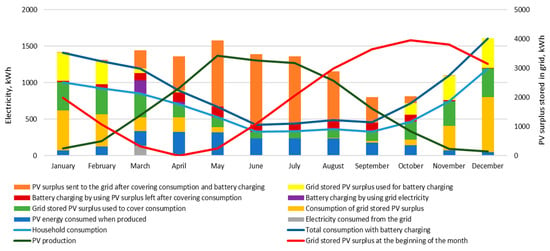
Figure 13.
Monthly energy profile for a PV system with battery.
The obtained results indicate that the highest electricity generation from PV occurs from May to August, which is represented by the green curve in Figure 12. Similarly, the lowest electricity consumption can be observed in the summer months (denoted by the blue curve). The red curve indicates the amount of PV energy stored in the grid at the beginning of each month. It can be observed that starting from May (the start of a new balance year) this amount is increasing, with the highest accumulation (~4000 kWh) being reached in October, making it possible to use this energy until next April. The graph shows the distribution of sources in each month to cover consumption. In the winter months, from November to January, for the most part, the amount of electricity stored in the grid is used to cover consumption. While in the summer period, already starting from May to August, the energy produced by PV is mostly consumed immediately and only a little of the amount stored in the grid is used, but a large amount of energy is transferred to the grid to supplement the energy storage in the net system.
A similar profile of monthly energy flows was obtained for a case if a PV and electricity storage system is installed. The obtained results can be seen in Figure 13.
The main change in the monthly profile of electricity flows when a battery is connected to the system is that the amount of energy stored in the battery plays a large role in covering household consumption in the period between October to April, but especially in the winter months. In the summer months, the energy produced by PV, as well as the amount of energy stored in the battery, is sufficient to cover household consumption, thus achieving greater independence from the grid and ensuring self-consumption. In this case, by adding a battery and providing an appropriate level of automation, it is possible to even gain economic benefits by leveraging the interrelationship between electricity costs and energy demand at a given moment, ensuring higher profitability. These relationships are characterized by the diversity of the profile of monthly electricity flows, especially in the months from October to March.
To summarize the obtained results, a comparison of all four analyzed systems is conducted by determining the annual costs of electricity from grid, the annual savings, and the payback for each system and the amount of electricity consumed from the network during the year at the analyzed electricity prices from 2019 to 2022. A summary of the results can be seen in Table 2, Table 3, Table 4 and Table 5.

Table 2.
Comparison of different systems with the electricity price at the 2019 level.

Table 3.
Comparison of different systems with the electricity price at the 2020 level.

Table 4.
Comparison of different systems with the electricity price at the 2021 level.

Table 5.
Comparison of different systems with the electricity price at the 2022 level.
At 2019 electricity prices, it is possible to observe that at moments when the costs of network energy are relatively low, it is nevertheless possible to make savings by installing a PV system or a PV and battery system (see Table 2). However, due to installation costs, the payback time would be significantly long, with the PV system reaching almost 17 years and the system with a connected battery 22.3 years, thus reducing the economic justification for introducing the system in Latvian households. On the other hand, when installing only batteries, the annual savings at low electricity prices are insignificant, and, taking into account the payback time, which reaches 448.3 years, it is possible to say that only installing batteries is unprofitable under the specific conditions.
In the case of even lower costs for electricity, i.e., at the electricity prices of 2020, when the total annual costs for network electricity in each of the analyzed system solutions decrease, it is possible to determine that the annual savings for PV and PV with accumulation systems will decrease, correspondingly increasing the payback time for both systems (see Table 3). Meanwhile, in a battery-only situation, the annual savings increase and the payback time decreases, the payback time is still unrealistic, and the scenario is defined as unprofitable.
In cases where the costs of electricity are higher, for example, as in the case of the 2021 electricity prices, it is possible to achieve much larger annual savings and a more acceptable payback period for the PV panel-only system and the PV and battery system, reaching savings of 1072 EUR/year and reducing the payback time to 13.1 years in the latter case (see Table 4). This justifies the profitability of installing energy-efficient solutions in households in Latvia. However, even at the prices of 2021, a battery-only system does not pay off in an acceptable period.
The four previous tables indicate another peculiarity—the consumption is higher in a battery-only system than in the grid electricity scenario. This is due to the battery charging/discharging process, where inevitable losses (including those in standby mode) occur. Covering the same household consumption load using a battery-only system requires more electricity. The same effect is seen for PV and battery systems in comparison to PV-only systems.
The greatest benefits can be found in the case when electricity costs are at the 2022 price level. In that case, the annual savings for PV system installation reaches 2075 EUR/year and the payback time decreases to 4.8 years (see Table 5). At the 2022 electricity prices, also for PV and battery systems, the annual savings would reach 2118 EUR/year, and the payback period would decrease to 6.6 years, thus indicating the profitability of installing the system in households in Latvia in the event that electricity prices do not decrease significantly from the 2022 levels or, in long-term view, if prices rise due to other global economic and environmental challenges (as climate change). The battery-only system is still a challenging option; though the payback time is decreasing, it still reaches 53.7 years, which is considered too long a period to be considered profitable.
4. Discussion and Conclusions
By simulating the SD model at the NordPool hourly electricity exchange prices for 2021, it was seen that the total electricity costs for a household with a total annual consumption of 7800 kWh/year and consuming only electricity from the network amounts to 2663.55 EUR/year (see Table 1). On the other hand, if a household of the same profile installs solar panels, uses the produced electricity for self-consumption, and transfers it to the network for storage (a net metering system is available in Latvia), then the total cost of electricity would be 715.82 EUR/year. But, in the case where a battery storage system is connected to the PV panels and the system is used economically, the electricity costs would decrease to 639.41 EUR/year.
The strong impact of the average electricity price on payback time (as summarized in Figure 14) is consistent throughout the analyzed period. In circumstances where the cost of electricity increases, such as the 2021 electricity prices, much higher annual savings could be achieved, as well as a more acceptable payback time. For the PV and battery system at the 2021 electricity prices, the annual savings reached 1072 EUR/year, and the payback time was reduced to 13.1 years.
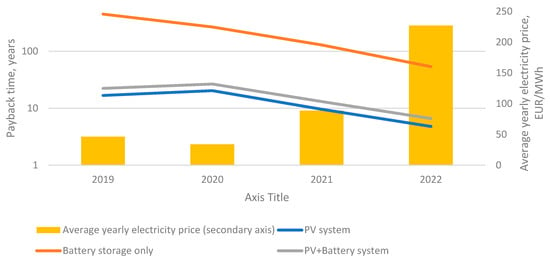
Figure 14.
Payback to price dependency in the analyzed period.
It is found that, in Latvian specific conditions (solar potential, annual average irradiation intensity, etc.), the profitability of installing PV and PV and battery systems in private households in Latvia is justified both in summer and winter conditions. In the summer, household electricity consumption is relatively low; therefore, it was determined that the amount of energy stored in the battery may be used to cover the consumption during the night hours, while the amount of energy produced by the PV panel system during the daytime is sufficient to not only cover the household consumption but also fully charge the battery. For the analyzed case, on a summer day, electricity from the network is not consumed, and the amount of electricity stored in the network is also not used. On the contrary, the storage is replenished, providing a larger amount of available energy for days when the amount produced by the solar panels would be insufficient to cover the consumption. In general, the profitability of installing electricity storage was justified for the period when solar irradiation is higher and there are more sunny days, taking into account the weather conditions in Latvia. It was found that even during the winter day it is possible to cover the energy demand with the amount of energy stored in the battery. It was also found that in the winter months, a small amount of energy is produced by solar panels that is used to cover consumption, thus overall justifying the profitability of installing an electricity storage system in a household in Latvia also during the winter period.
However, the main hindering factor for the installation of the accumulation is the high investment costs, which need to be covered prior to receiving a repayment from the supporting instruments. Additional costs for inconvenience are related to the costs of maintaining the technology, which can constitute different expenses in each case. The payback time of integrating the accumulation depends on the electricity costs of the given period. Accordingly, if electricity prices are high, the payback time of the battery system will be shortened, which affects the decision to install energy-efficient solutions.
The cost-effectiveness of implementing a battery energy storage could be improved by reducing the technology production and maintenance costs. But, considering the current technology costs during periods when electricity prices rapidly increase, the payback period of storage systems in the private household, according to the model results, is about ten years. This leads to the conclusion that increasing the number of subsidies could promote the practice of introducing accumulation in households in Latvia. It is also necessary to set clear internal EU and national goals in the electricity storage sector, as well as adopt specific laws in this area, such as making the use of renewable energy mandatory for a specific building sector or determining the need for collective self-consumption in order to stimulate the introduction of storage on a larger scale.
Currently, it is possible to carry out a wide commercialization and integration of accumulation technologies both in the state and in the private sector. The created hourly SD model can be used to analyze the real electricity profiles of specific households, determining the profitability of installing energy-efficient solutions both in Latvia and for analyzing the situations of other countries or accumulation systems.
In addition, it is concluded that the implementation of energy storage systems in private households can provide several potential benefits. Firstly, it can increase self-consumption of electricity generated from renewable sources, in this case, PV, allowing homeowners to rely less on the grid and reduce their electricity bills. Secondly, integrated energy storage systems can also provide backup power during grid outages, improving the resilience and reliability of the electricity supply.
As identified earlier, this exploratory model demonstrates the accumulation feasibility assessment. The obtained model structure can be used as a base for the further development of a system dynamics model for forecasting the development of long-term accumulation and making the most optimal decisions at household, municipal, and national levels.
Author Contributions
Conceptualization, E.A., A.G., E.K., S.R. and D.B.; methodology, E.A. and A.G.; validation, A.G., D.B. and S.R.; formal analysis, E.A. and E.K.; data curation, E.A. and E.K.; writing—original draft preparation, E.A.; writing—review and editing, E.K., A.G., S.R. and D.B.; visualization, E.A. and A.G.; supervision, D.B.; funding acquisition, E.K. All authors have read and agreed to the published version of the manuscript.
Funding
This work has been supported by the European Social Fund within the Project No 8.2.2.0/20/I/008 «Strengthening of PhD students and academic personnel of Riga Technical University and BA School of Business and Finance in the strategic fields of specialization» of the Specific Objective 8.2.2 «To Strengthen Academic Staff of Higher Education Institutions in Strategic Specialization Areas» of the Operational Programme «Growth and Employment».
Data Availability Statement
No publicly available database is generated during this study.
Conflicts of Interest
The authors declare no conflict of interest. The funders had no role in the design of the study; in the collection, analyses, or interpretation of data; in the writing of the manuscript; or in the decision to publish the results.
References
- Al-Shetwi, A.Q. Sustainable development of renewable energy integrated power sector: Trends, environmental impacts, and recent challenges. Sci. Total Environ. 2022, 822, 153645. [Google Scholar] [CrossRef] [PubMed]
- Wiatros-Motyka, M. Global Electricity Review 2023. Ember. 2023, p. 163. Available online: https://ember-climate.org/insights/research/global-electricity-review-2023/#supporting-material (accessed on 27 August 2023).
- Wang, W.; Kang, K.; Sun, G.; Xiao, L. Configuration optimization of energy storage and economic improvement for household photovoltaic system considering multiple scenarios. J. Energy Storage 2023, 67, 107631. [Google Scholar] [CrossRef]
- Elmorshedy, M.F.; Elkadeem, M.; Kotb, K.M.; Taha, I.B.; Mazzeo, D. Optimal design and energy management of an isolated fully renewable energy system integrating batteries and supercapacitors. Energy Convers. Manag. 2021, 245, 114584. [Google Scholar] [CrossRef]
- Zhao, Z. Operation Simulation and Economic Analysis of Household Hybrid PV and BESS Systems in the Improved TOU Mode. Sustainability 2023, 15, 8853. [Google Scholar] [CrossRef]
- Degefa, M.Z.; Sperstad, I.B.; Sæle, H. Comprehensive classifications and characterizations of power system flexibility resources. Electr. Power Syst. Res. 2021, 194, 107022. [Google Scholar] [CrossRef]
- Blanco, H.; Faaij, A. A review at the role of storage in energy systems with a focus on Power to Gas and long-term storage. Renew. Sustain. Energy Rev. 2018, 81, 1049–1086. [Google Scholar] [CrossRef]
- Rafał, K.; Radziszewska, W.; Grabowski, O.; Biedka, H.; Verstraete, J. Energy Cost Minimization with Hybrid Energy Storage System Using Optimization Algorithm. Appl. Sci. 2022, 13, 518. [Google Scholar] [CrossRef]
- Lund, H.; Salgi, G.; Elmegaard, B.; Andersen, A.N. Optimal operation strategies of compressed air energy storage (CAES) on electricity spot markets with fluctuating prices. Appl. Therm. Eng. 2009, 29, 799–806. [Google Scholar] [CrossRef]
- European Commission; Directorate-General for Energy; Hoogland, O.; Fluri, V.; Kost, C.; Marian, K.; Matthias, K.; Manish, K.; Michelle, A.; Joris, K.; et al. Study on Energy Storage. Publications Office of the European Union. 2023. Available online: https://op.europa.eu/en/publication-detail/-/publication/dfcaa78b-c217-11ed-8912-01aa75ed71a1/language-en (accessed on 27 August 2023).
- O’Dea, S. Projected Global Battery Demand from 2020 to 2030, by Application. Statista. 2023. Available online: https://www.statista.com/statistics/1103218/global-battery-demand-forecast/ (accessed on 27 August 2023).
- Qais, M.; Loo, K.H.; Hasanien, H.M.; Alghuwainem, S. Optimal Comfortable Load Schedule for Home Energy Management Including Photovoltaic and Battery Systems. Sustainability 2023, 15, 9193. [Google Scholar] [CrossRef]
- Miletić, M.; Gržanić, M.; Pavić, I.; Pandžić, H.; Capuder, T. The effects of household automation and dynamic electricity pricing on consumers and suppliers. Sustain. Energy Grids Netw. 2022, 32, 100931. [Google Scholar] [CrossRef]
- Garces, E.; Franco, C.J.; Tomei, J.; Dyner, I. Sustainable electricity supply for small off-grid communities in Colombia: A system dynamics approach. Energy Policy 2023, 172, 113314. [Google Scholar] [CrossRef]
- Kubli, M.; Ulli-Beer, S. Decentralisation dynamics in energy systems: A generic simulation of network effects. Energy Res. Soc. Sci. 2016, 13, 71–83. [Google Scholar] [CrossRef]
- Zapata Riveros, J.; Kubli, M.; Ulli-Beer, S. Prosumer communities as strategic allies for electric utilities: Exploring future decentralization trends in Switzerland. Energy Res. Soc. Sci. 2019, 57, 101219. [Google Scholar] [CrossRef]
- Environment and Energy Statistics Section of the Central Statistics Bureau. Overall Energy Consumption Decreased by 6.1%. Central Statistics Bureau; 2021. Available online: https://stat.gov.lv/lv/statistikas-temas/noz/energetika/preses-relizes/7129-energoresursu-paterins-latvija-2020-gada (accessed on 13 July 2023). (In Latvian)
- Cabinet of Ministers of the Republic of Latvia. Order No 46. on Latvia’s National Energy and Climate Plan for 2021–2030; Cabinet of Ministers of the Republic of Latvia: Riga, Latvia, 2020. (In Latvian)
- Environment and Energy Statistics Section of the Central Statistics Bureau. RES Consumption in 2021 was 3% higher than the year before. Central Statistics Bureau; 2022. Available online: https://stat.gov.lv/lv/statistikas-temas/noz/energetika/preses-relizes/8732-atjaunigo-energoresursu-paterins-2021-gada (accessed on 27 August 2023). (In Latvian)
- Mendziņš, K. The Number of Solar Panels in Latvia Increased Six Times in the First Quarter of the Year. Uzladets.lv. 2022. Available online: https://uzladets.lv (accessed on 27 August 2023). (In Latvian).
- Nord Pool Group. About Nord Pool Group. Nord Pool AS. 2023. Available online: https://www.nordpoolgroup.com/en/About-us/ (accessed on 19 June 2023).
- The Parliament of the Republic of Latvia. Electricity Market Law; The Parliament of the Republic of Latvia: Riga, Latvia, 2005. [Google Scholar]
- Cabinet of Ministers of the Republic of Latvia. National Energy and Climate Plan of Latvia 2021–2030. 2020. Available online: https://energy.ec.europa.eu/system/files/2020-02/lv_final_necp_main_lv_0.pdf (accessed on 13 July 2023). (In Latvian).
- Dolge, K.; Bohvalovs, G.; Kirsanovs, V.; Blumberga, A.; Blumberga, D. Bioeconomy in the Shade of Green Deal: The System Dynamic Approach. Environ. Clim. Technol. 2022, 26, 1221–1233. [Google Scholar] [CrossRef]
- Barisa, A.; Kirsanovs, V.; Safronova, A. Future transport policy designs for biomethane promotion: A system Dynamics model. J. Environ. Manag. 2020, 269, 110842. [Google Scholar] [CrossRef]
- Blumberga, A.; Gravelsins, A.; Blumberga, D. Deliberation Platform for Energy Transition Policies: How to Make Complex Things Simple. Energies 2022, 15, 90. [Google Scholar] [CrossRef]
- Pakere, I.; Gravelsins, A.; Bohvalovs, G.; Rozentale, L.; Blumberga, D. Will Aggregator Reduce Renewable Power Surpluses? A System Dynamics Approach for the Latvia Case Study. Energies 2021, 14, 7900. [Google Scholar] [CrossRef]
- Solar Radiation Data from Center of Environment, Geology and Meteorology of Latvia. Available online: https://videscentrs.lvgmc.lv/ (accessed on 27 August 2023).
- The Danish Energy Agency. Catalogues of Technology Data by Danish Energy Agency. Available online: https://ens.dk/en/our-services/projections-and-models/technology-data (accessed on 27 August 2023).
- Enefit LLC. Solar Energy Solutions. Available online: https://www.enefit.lv/majai/saules-paneli (accessed on 21 June 2023). (In Latvian).
- AS “Sadales tīkls”. Electricity Distribution System Service Tariffs. Available online: https://sadalestikls.lv/lv/sadales-tikls-tarifi#_ftn3 (accessed on 21 June 2023). (In Latvian).
- energija24.lv Group. Comparison of Electricity Traders. Available online: https://www.energija24.lv (accessed on 21 June 2023).
- Zhang, Z.; Liu, X.; Zhao, D.; Post, S.; Chen, J. Overview of the development and application of wind energy in New Zealand. Energy Built Environ. 2023, 4, 725–742. [Google Scholar] [CrossRef]
- Kudurs, E.; Atvare, E.; Dolge, K.; Blumberga, D. Ranking of Electricity Accumulation Possibilities: Multicriteria Analysis. Appl. Sci. 2023, 13, 7349. [Google Scholar] [CrossRef]
- European Association for Storage of Energy. Energy Storage Technology Descriptions Lithium-Ion Battery. Available online: www.ease-storage.eu (accessed on 27 August 2023).
Disclaimer/Publisher’s Note: The statements, opinions and data contained in all publications are solely those of the individual author(s) and contributor(s) and not of MDPI and/or the editor(s). MDPI and/or the editor(s) disclaim responsibility for any injury to people or property resulting from any ideas, methods, instructions or products referred to in the content. |
© 2023 by the authors. Licensee MDPI, Basel, Switzerland. This article is an open access article distributed under the terms and conditions of the Creative Commons Attribution (CC BY) license (https://creativecommons.org/licenses/by/4.0/).