Aroused and Impulsive Effects of Colour Stimuli on Lateral and Logical Abilities

 ,
, 
 ,
,
Abstract
1. Introduction
2. Methods
2.1. Colour Conditions
2.2. Psychometric Tests
2.3. Participants
2.4. Experimental Procedure
3. Results
3.1. General Trend
3.2. Logical Abilities
3.3. Lateral Abilities
3.4. Detail Abilities
4. Discussion
4.1. General Trend
- Purple leads to the lowest aroused state. It induced participants to make the most errors and had the longest reaction time.
- Green leads to the greatest aroused state. It induced participants to make the fewest errors and had the shortest reaction time.
- Yellow leads to the least impulsive state. Participants with yellow made the second most errors, while they reacted faster compared with green.
- Red and yellow are colours that influence people to be more impulsive.
- Blue seems to have a low aroused influence on participants’ performance. Participants with blue made more errors compared with orange, yellow, and green. Meanwhile, participants responded slower with blue compared with green.
4.2. Logical Abilities
- Colour seems to have no significant impact on participants’ reaction time on their logical performance.
- Yellow leads to the least impulsive state on participants’ logical performance.
- Yellow and green induced participants to make fewer errors in the logical ability test, suggesting green and yellow may have a positive impact on people’s logical abilities.
- Green and red are colours that influence people towards more arousal in logical performance.
- Red seems to have relatively high aroused effects on participants’ logical abilities.
- Purple and orange are colours that influence people towards low arousal in logical performance.
- Blue rarely has low impulsive impacts on logical abilities. It induced participants to make more errors in logical tests compared with yellow and green.
4.3. Spatial Imagination Abilities
- Green leads to the highest aroused state on spatial imagination abilities, suggesting green can positively stimulate people’s left cerebral hemisphere functions (lateral functions).
- Orange leads to the greatest impulsivity on lateral functions.
- Orange, red and blue seem to influence participants’ lateral functions with a high impulsivity state.
- Purple induced participants to make the most errors and had the longest reaction time in lateral ability tests.
- Red seems to have high impulsivity on participants’ lateral abilities, while it has relatively high aroused effects on participants’ logical abilities. Specifically, participants seem to make fewer errors in logical ability tests than lateral ability tests.
- Yellow has a low impulsive influence on participants’ lateral abilities.
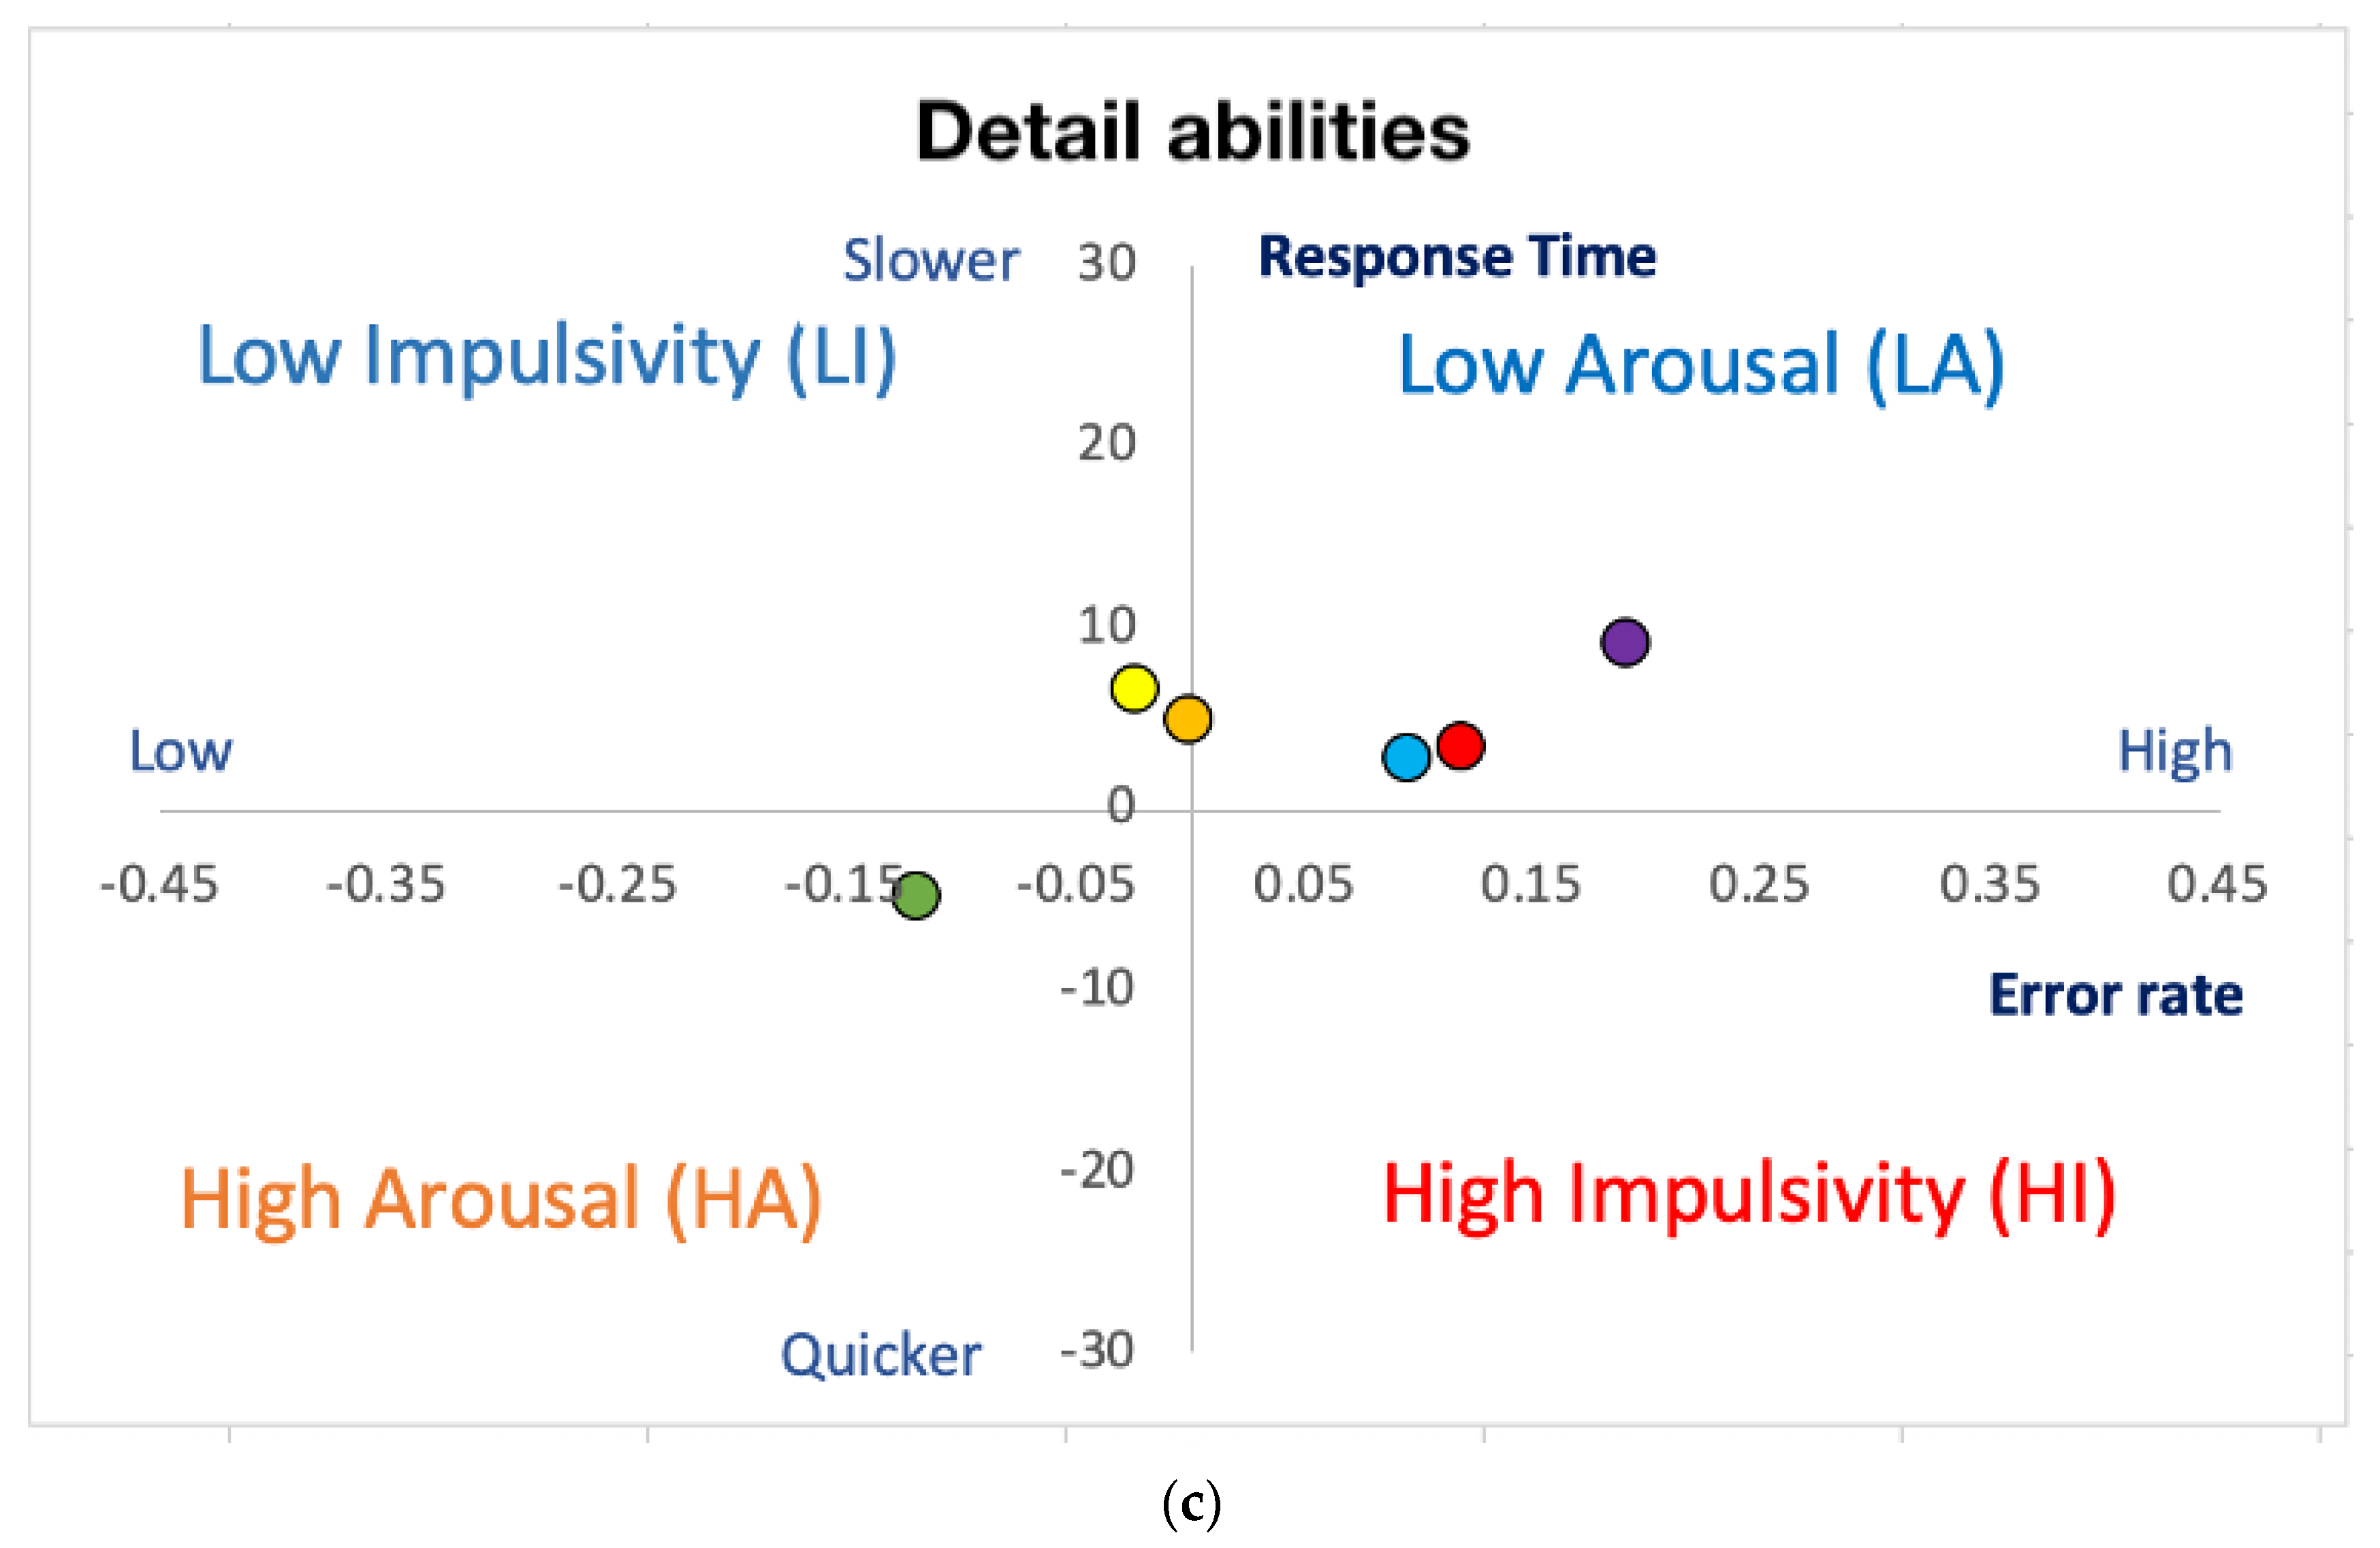
4.4. Detail Abilities
- Purple leads to the lowest aroused state on participants’ detail abilities, suggesting purple has a relatively negative influence on people’s logical and lateral abilities.
- Green leads to the highest aroused influence on participants’ spatial imagination abilities. This also suggests that the colour green can positively influence people’s logical and lateral abilities.
- Purple, red, and blue are colours that have low aroused effects on detail abilities.
- Yellow and orange seem to have a relatively low impulsivity state on participants’ detail abilities. Specifically, participants made fewer errors with the orange background compared with the purple.
5. Conclusions
Author Contributions
Funding
Institutional Review Board Statement
Informed Consent Statement
Data Availability Statement
Acknowledgments
Conflicts of Interest
Appendix A

| Colours | L * | C * | h | a * | b * | R | G | B |
|---|---|---|---|---|---|---|---|---|
| Visual Reference White | 70.01 | 0.51 | 28.34 | 0.24 | 0.19 | 171.27 | 170.01 | 169.86 |
| Red | 69.42 | 69.08 | 34.33 | 23.95 | 35.01 | 244.31 | 121.54 | 103.56 |
| Yellow | 70.52 | 69.13 | 99.63 | −25.59 | 55.21 | 187.82 | 175.99 | 19.87 |
| Blue | 69.77 | 65.86 | 286.26 | 33.33 | −36.64 | 110.09 | 158.86 | 255.00 |
| Green | 67.89 | 67.26 | 177.63 | −54.76 | −3.48 | 62.76 | 193.52 | 156.59 |
| Orange | 68.29 | 67.66 | 67.84 | −0.57 | 56.18 | 242.31 | 154.31 | 55.88 |
| Purple | 68.01 | 68.17 | 320.95 | 48.07 | −22.74 | 221.76 | 129.76 | 243.86 |
| Cerebral Hemisphere | Cognitive Functions | Tests |
|---|---|---|
| Right cerebral hemisphere | Logical function | Logical abilities: Logical rule test Mathematics sequence |
| Left cerebral hemisphere | Lateral function | Spatial imagination abilities: Spatial structure test Rotation test |
| Right cerebral hemisphere: holistic perception; Left Right cerebral hemisphere: detail oriented perception | Logical & Lateral functions | Detail abilities: Odd one out Same detail test |
| Descriptive Statistics | ||||
|---|---|---|---|---|
| Coloured_Backgrounds | Mean | Std. Deviation | N | |
| Response_time | Reference white | 42.1864 | 45.30772 | 126 |
| Red | 38.7156 | 37.01419 | 126 | |
| Yellow | 51.4849 | 84.10959 | 126 | |
| Blue | 45.9029 | 49.64691 | 126 | |
| Green | 34.8059 | 30.16076 | 126 | |
| Orange | 40.4606 | 45.95477 | 126 | |
| Purple | 57.1974 | 73.77608 | 126 | |
| Total | 44.3934 | 55.60318 | 882 | |
| Error_rate | Reference white | 0.4206 | 0.49563 | 126 |
| Red | 0.4524 | 0.49971 | 126 | |
| Yellow | 0.2698 | 0.44565 | 126 | |
| Blue | 0.4603 | 0.50041 | 126 | |
| Green | 0.1746 | 0.38114 | 126 | |
| Orange | 0.4683 | 0.50098 | 126 | |
| Purple | 0.4921 | 0.50193 | 126 | |
| Total | 0.3912 | 0.48829 | 882 | |
| Multivariate Tests a | |||||||||
|---|---|---|---|---|---|---|---|---|---|
| Effect | Value | F | Hypothesis df | Error df | Sig. | Partial Eta Squared | Noncent. Parameter | Observed Power d | |
| Intercept | Pillai’s Trace | 0.556 | 547.626 b | 2 | 874 | 0 | 0.556 | 1095.252 | 1 |
| Wilks’ Lambda | 0.444 | 547.626 b | 2 | 874 | 0 | 0.556 | 1095.252 | 1 | |
| Hotelling’s Trace | 1.253 | 547.626 b | 2 | 874 | 0 | 0.556 | 1095.252 | 1 | |
| Roy’s Largest Root | 1.253 | 547.626 b | 2 | 874 | 0 | 0.556 | 1095.252 | 1 | |
| Coloured_backgrounds | Pillai’s Trace | 0.068 | 5.128 | 12 | 1750 | 0 | 0.034 | 61.537 | 1 |
| Wilks’ Lambda | 0.933 | 5.153 b | 12 | 1748 | 0 | 0.034 | 61.833 | 1 | |
| Hotelling’s Trace | 0.071 | 5.177 | 12 | 1746 | 0 | 0.034 | 62.128 | 1 | |
| Roy’s Largest Root | 0.056 | 8.226 c | 6 | 875 | 0 | 0.053 | 49.356 | 1 | |
| Multiple Comparisons | |||||||
|---|---|---|---|---|---|---|---|
| LSD | |||||||
| Dependent Variable | (I) Coloured_Backgrounds | (J) Coloured_Backgrounds | Mean Difference (I–J) | Std. Error | Sig. | 95% Confidence Interval | |
| Lower Bound | Upper Bound | ||||||
| Response_time | Reference white | Red | 3.4708 | 6.97038 | 0.619 | −10.2098 | 17.1514 |
| Yellow | −9.2984 | 6.97038 | 0.183 | −22.9791 | 4.3822 | ||
| Blue | −3.7165 | 6.97038 | 0.594 | −17.3971 | 9.9641 | ||
| Green | 7.3806 | 6.97038 | 0.29 | −6.3001 | 21.0612 | ||
| Orange | 1.7258 | 6.97038 | 0.805 | −11.9548 | 15.4064 | ||
| Purple | −15.0110 * | 6.97038 | 0.032 | −28.6916 | −1.3304 | ||
| Red | Reference white | −3.4708 | 6.97038 | 0.619 | −17.1514 | 10.2098 | |
| Yellow | −12.7693 | 6.97038 | 0.067 | −26.4499 | 0.9113 | ||
| Blue | −7.1874 | 6.97038 | 0.303 | −20.868 | 6.4933 | ||
| Green | 3.9097 | 6.97038 | 0.575 | −9.7709 | 17.5903 | ||
| Orange | −1.745 | 6.97038 | 0.802 | −15.4256 | 11.9356 | ||
| Purple | −18.4818 * | 6.97038 | 0.008 | −32.1624 | −4.8012 | ||
| Yellow | Reference white | 9.2984 | 6.97038 | 0.183 | −4.3822 | 22.9791 | |
| Red | 12.7693 | 6.97038 | 0.067 | −0.9113 | 26.4499 | ||
| Blue | 5.5819 | 6.97038 | 0.423 | −8.0987 | 19.2625 | ||
| Green | 16.6790 * | 6.97038 | 0.017 | 2.9984 | 30.3596 | ||
| Orange | 11.0242 | 6.97038 | 0.114 | −2.6564 | 24.7048 | ||
| Purple | −5.7125 | 6.97038 | 0.413 | −19.3931 | 7.9681 | ||
| Blue | Reference white | 3.7165 | 6.97038 | 0.594 | −9.9641 | 17.3971 | |
| Red | 7.1874 | 6.97038 | 0.303 | −6.4933 | 20.868 | ||
| Yellow | −5.5819 | 6.97038 | 0.423 | −19.2625 | 8.0987 | ||
| Green | 11.0971 | 6.97038 | 0.112 | −2.5835 | 24.7777 | ||
| Orange | 5.4423 | 6.97038 | 0.435 | −8.2383 | 19.1229 | ||
| Purple | −11.2944 | 6.97038 | 0.106 | −24.9751 | 2.3862 | ||
| Green | Reference white | −7.3806 | 6.97038 | 0.29 | −21.0612 | 6.3001 | |
| Red | −3.9097 | 6.97038 | 0.575 | −17.5903 | 9.7709 | ||
| Yellow | −16.6790 * | 6.97038 | 0.017 | −30.3596 | −2.9984 | ||
| Blue | −11.0971 | 6.97038 | 0.112 | −24.7777 | 2.5835 | ||
| Orange | −5.6548 | 6.97038 | 0.417 | −19.3354 | 8.0258 | ||
| Purple | −22.3915 * | 6.97038 | 0.001 | −36.0721 | −8.7109 | ||
| Orange | Reference white | −1.7258 | 6.97038 | 0.805 | −15.4064 | 11.9548 | |
| Red | 1.745 | 6.97038 | 0.802 | −11.9356 | 15.4256 | ||
| Yellow | −11.0242 | 6.97038 | 0.114 | −24.7048 | 2.6564 | ||
| Blue | −5.4423 | 6.97038 | 0.435 | −19.1229 | 8.2383 | ||
| Green | 5.6548 | 6.97038 | 0.417 | −8.0258 | 19.3354 | ||
| Purple | −16.7368 * | 6.97038 | 0.017 | −30.4174 | −3.0561 | ||
| Purple | Reference white | 15.0110 * | 6.97038 | 0.032 | 1.3304 | 28.6916 | |
| Red | 18.4818 * | 6.97038 | 0.008 | 4.8012 | 32.1624 | ||
| Yellow | 5.7125 | 6.97038 | 0.413 | −7.9681 | 19.3931 | ||
| Blue | 11.2944 | 6.97038 | 0.106 | −2.3862 | 24.9751 | ||
| Green | 22.3915 * | 6.97038 | 0.001 | 8.7109 | 36.0721 | ||
| Orange | 16.7368 * | 6.97038 | 0.017 | 3.0561 | 30.4174 | ||
| Error_rate | Reference white | Red | −0.0317 | 0.06009 | 0.597 | −0.1497 | 0.0862 |
| Yellow | 0.1508 * | 0.06009 | 0.012 | 0.0328 | 0.2687 | ||
| Blue | −0.0397 | 0.06009 | 0.509 | −0.1576 | 0.0783 | ||
| Green | 0.2460 * | 0.06009 | 0 | 0.1281 | 0.364 | ||
| Orange | −0.0476 | 0.06009 | 0.428 | −0.1656 | 0.0703 | ||
| Purple | −0.0714 | 0.06009 | 0.235 | −0.1894 | 0.0465 | ||
| Red | Reference white | 0.0317 | 0.06009 | 0.597 | −0.0862 | 0.1497 | |
| Yellow | 0.1825 * | 0.06009 | 0.002 | 0.0646 | 0.3005 | ||
| Blue | −0.0079 | 0.06009 | 0.895 | −0.1259 | 0.11 | ||
| Green | 0.2778 * | 0.06009 | 0 | 0.1598 | 0.3957 | ||
| Orange | −0.0159 | 0.06009 | 0.792 | −0.1338 | 0.1021 | ||
| Purple | −0.0397 | 0.06009 | 0.509 | −0.1576 | 0.0783 | ||
| Yellow | Reference white | −0.1508 * | 0.06009 | 0.012 | −0.2687 | −0.0328 | |
| Red | −0.1825 * | 0.06009 | 0.002 | −0.3005 | −0.0646 | ||
| Blue | −0.1905 * | 0.06009 | 0.002 | −0.3084 | −0.0725 | ||
| Green | 0.0952 | 0.06009 | 0.113 | −0.0227 | 0.2132 | ||
| Orange | −0.1984 * | 0.06009 | 0.001 | −0.3164 | −0.0805 | ||
| Purple | −0.2222 * | 0.06009 | 0 | −0.3402 | −0.1043 | ||
| Blue | Reference white | 0.0397 | 0.06009 | 0.509 | −0.0783 | 0.1576 | |
| Red | 0.0079 | 0.06009 | 0.895 | −0.11 | 0.1259 | ||
| Yellow | 0.1905 * | 0.06009 | 0.002 | 0.0725 | 0.3084 | ||
| Green | 0.2857 * | 0.06009 | 0 | 0.1678 | 0.4037 | ||
| Orange | −0.0079 | 0.06009 | 0.895 | −0.1259 | 0.11 | ||
| Purple | −0.0317 | 0.06009 | 0.597 | −0.1497 | 0.0862 | ||
| Green | Reference white | −0.2460 * | 0.06009 | 0 | −0.364 | −0.1281 | |
| Red | −0.2778 * | 0.06009 | 0 | −0.3957 | −0.1598 | ||
| Yellow | −0.0952 | 0.06009 | 0.113 | −0.2132 | 0.0227 | ||
| Blue | −0.2857 * | 0.06009 | 0 | −0.4037 | −0.1678 | ||
| Orange | −0.2937 * | 0.06009 | 0 | −0.4116 | −0.1757 | ||
| Purple | −0.3175 * | 0.06009 | 0 | −0.4354 | −0.1995 | ||
| Orange | Reference white | 0.0476 | 0.06009 | 0.428 | −0.0703 | 0.1656 | |
| Red | 0.0159 | 0.06009 | 0.792 | −0.1021 | 0.1338 | ||
| Yellow | 0.1984 * | 0.06009 | 0.001 | 0.0805 | 0.3164 | ||
| Blue | 0.0079 | 0.06009 | 0.895 | −0.11 | 0.1259 | ||
| Green | 0.2937 * | 0.06009 | 0 | 0.1757 | 0.4116 | ||
| Purple | −0.0238 | 0.06009 | 0.692 | −0.1418 | 0.0941 | ||
| Purple | Reference white | 0.0714 | 0.06009 | 0.235 | −0.0465 | 0.1894 | |
| Red | 0.0397 | 0.06009 | 0.509 | −0.0783 | 0.1576 | ||
| Yellow | 0.2222 * | 0.06009 | 0 | 0.1043 | 0.3402 | ||
| Blue | 0.0317 | 0.06009 | 0.597 | −0.0862 | 0.1497 | ||
| Green | 0.3175 * | 0.06009 | 0 | 0.1995 | 0.4354 | ||
| Orange | 0.0238 | 0.06009 | 0.692 | −0.0941 | 0.1418 | ||
| Descriptive Statistics | ||||
|---|---|---|---|---|
| Coloured_Backgrounds | Mean | Std. Deviation | N | |
| Logical_Response_Time | Reference white | 43.462 | 36.98222 | 42 |
| Yellow | 61.7532 | 129.30801 | 42 | |
| Green | 39.5396 | 37.95461 | 42 | |
| Blue | 54.4412 | 56.83899 | 42 | |
| Purple | 67.7787 | 105.389 | 42 | |
| Red | 41.0226 | 29.54236 | 42 | |
| Orange | 48.5597 | 54.56498 | 42 | |
| Total | 50.9367 | 73.33785 | 294 | |
| Logical_Error_rate | Reference white | 0.4762 | 0.50549 | 42 |
| Yellow | 0.2381 | 0.43108 | 42 | |
| Green | 0.1905 | 0.39744 | 42 | |
| Blue | 0.4524 | 0.50376 | 42 | |
| Purple | 0.5 | 0.50606 | 42 | |
| Red | 0.4286 | 0.50087 | 42 | |
| Orange | 0.5714 | 0.50087 | 42 | |
| Total | 0.4082 | 0.49233 | 294 | |
| Lateral_Response_Time | Reference white | 46.6805 | 58.013 | 42 |
| Yellow | 49.7937 | 48.91309 | 42 | |
| Green | 33.3861 | 28.51248 | 42 | |
| Blue | 44.1349 | 48.82134 | 42 | |
| Purple | 58.4328 | 57.48352 | 42 | |
| Red | 35.4139 | 28.68746 | 42 | |
| Orange | 31.5281 | 28.2063 | 42 | |
| Total | 42.7671 | 45.0009 | 294 | |
| Lateral_Error_rate | Reference white | 0.4524 | 0.50376 | 42 |
| Yellow | 0.2619 | 0.445 | 42 | |
| Green | 0.119 | 0.32777 | 42 | |
| Blue | 0.5 | 0.50606 | 42 | |
| Purple | 0.4524 | 0.50376 | 42 | |
| Red | 0.4762 | 0.50549 | 42 | |
| Orange | 0.5 | 0.50606 | 42 | |
| Total | 0.3946 | 0.48959 | 294 | |
| Detail_Response_Time | Reference white | 36.4168 | 38.32565 | 42 |
| Yellow | 42.9077 | 47.63413 | 42 | |
| Green | 31.4918 | 21.99098 | 42 | |
| Blue | 39.1327 | 42.13849 | 42 | |
| Purple | 45.3806 | 43.86046 | 42 | |
| Red | 39.7102 | 49.63497 | 42 | |
| Orange | 41.294 | 50.15938 | 42 | |
| Total | 39.4763 | 42.69481 | 294 | |
| Detail_Error_Rate | Reference white | 0.3333 | 0.47712 | 42 |
| Yellow | 0.3095 | 0.4679 | 42 | |
| Green | 0.2143 | 0.4153 | 42 | |
| Blue | 0.4286 | 0.50087 | 42 | |
| Purple | 0.5238 | 0.50549 | 42 | |
| Red | 0.4524 | 0.50376 | 42 | |
| Orange | 0.3333 | 0.47712 | 42 | |
| Total | 0.3707 | 0.48383 | 294 | |
| Multivariate Tests a | |||||||||
|---|---|---|---|---|---|---|---|---|---|
| Effect | Value | F | Hypothesis df | Error df | Sig. | Partial Eta Squared | Noncent. Parameter | Observed Power d | |
| Intercept | Pillai’s Trace | 0.801 | 189.496 b | 6 | 282 | 0 | 0.801 | 1136.976 | 1 |
| Wilks’ Lambda | 0.199 | 189.496 b | 6 | 282 | 0 | 0.801 | 1136.976 | 1 | |
| Hotelling’s Trace | 4.032 | 189.496 b | 6 | 282 | 0 | 0.801 | 1136.976 | 1 | |
| Roy’s Largest Root | 4.032 | 189.496 b | 6 | 282 | 0 | 0.801 | 1136.976 | 1 | |
| Coloured_backgrounds | Pillai’s Trace | 0.235 | 1.952 | 36 | 1722 | 0.001 | 0.039 | 70.262 | 1 |
| Wilks’ Lambda | 0.778 | 2.024 | 36 | 1241.11 | 0 | 0.041 | 52.907 | 0.994 | |
| Hotelling’s Trace | 0.267 | 2.082 | 36 | 1682 | 0 | 0.043 | 74.967 | 1 | |
| Roy’s Largest Root | 0.185 | 8.851 c | 6 | 287 | 0 | 0.156 | 53.108 | 1 | |
| Multiple Comparisons | |||||||
|---|---|---|---|---|---|---|---|
| LSD | |||||||
| Dependent Variable | (I) Coloured_Backgrounds | (J) Coloured_Backgrounds | Mean Difference (I–J) | Std. Error | Sig. | 95% Confidence Interval | |
| Lower Bound | Upper Bound | ||||||
| Logical_Response_Time | Reference white | Yellow | −18.2911 | 16.01793 | 0.254 | −49.8187 | 13.2364 |
| Green | 3.9224 | 16.01793 | 0.807 | −27.6051 | 35.4499 | ||
| Blue | −10.9792 | 16.01793 | 0.494 | −42.5067 | 20.5483 | ||
| Purple | −24.3167 | 16.01793 | 0.13 | −55.8442 | 7.2108 | ||
| Red | 2.4395 | 16.01793 | 0.879 | −29.0881 | 33.967 | ||
| Orange | −5.0977 | 16.01793 | 0.751 | −36.6252 | 26.4298 | ||
| Yellow | Reference white | 18.2911 | 16.01793 | 0.254 | −13.2364 | 49.8187 | |
| Green | 22.2136 | 16.01793 | 0.167 | −9.314 | 53.7411 | ||
| Blue | 7.312 | 16.01793 | 0.648 | −24.2155 | 38.8395 | ||
| Purple | −6.0256 | 16.01793 | 0.707 | −37.5531 | 25.502 | ||
| Red | 20.7306 | 16.01793 | 0.197 | −10.7969 | 52.2581 | ||
| Orange | 13.1934 | 16.01793 | 0.411 | −18.3341 | 44.721 | ||
| Green | Reference white | −3.9224 | 16.01793 | 0.807 | −35.4499 | 27.6051 | |
| Yellow | −22.2136 | 16.01793 | 0.167 | −53.7411 | 9.314 | ||
| Blue | −14.9016 | 16.01793 | 0.353 | −46.4291 | 16.6259 | ||
| Purple | −28.2391 | 16.01793 | 0.079 | −59.7666 | 3.2884 | ||
| Red | −1.483 | 16.01793 | 0.926 | −33.0105 | 30.0446 | ||
| Orange | −9.0201 | 16.01793 | 0.574 | −40.5476 | 22.5074 | ||
| Blue | Reference white | 10.9792 | 16.01793 | 0.494 | −20.5483 | 42.5067 | |
| Yellow | −7.312 | 16.01793 | 0.648 | −38.8395 | 24.2155 | ||
| Green | 14.9016 | 16.01793 | 0.353 | −16.6259 | 46.4291 | ||
| Purple | −13.3375 | 16.01793 | 0.406 | −44.8651 | 18.19 | ||
| Red | 13.4186 | 16.01793 | 0.403 | −18.1089 | 44.9461 | ||
| Orange | 5.8815 | 16.01793 | 0.714 | −25.6461 | 37.409 | ||
| Purple | Reference white | 24.3167 | 16.01793 | 0.13 | −7.2108 | 55.8442 | |
| Yellow | 6.0256 | 16.01793 | 0.707 | −25.502 | 37.5531 | ||
| Green | 28.2391 | 16.01793 | 0.079 | −3.2884 | 59.7666 | ||
| Blue | 13.3375 | 16.01793 | 0.406 | −18.19 | 44.8651 | ||
| Red | 26.7562 | 16.01793 | 0.096 | −4.7713 | 58.2837 | ||
| Orange | 19.219 | 16.01793 | 0.231 | −12.3085 | 50.7465 | ||
| Red | Reference white | −2.4395 | 16.01793 | 0.879 | −33.967 | 29.0881 | |
| Yellow | −20.7306 | 16.01793 | 0.197 | −52.2581 | 10.7969 | ||
| Green | 1.483 | 16.01793 | 0.926 | −30.0446 | 33.0105 | ||
| Blue | −13.4186 | 16.01793 | 0.403 | −44.9461 | 18.1089 | ||
| Purple | −26.7562 | 16.01793 | 0.096 | −58.2837 | 4.7713 | ||
| Orange | −7.5372 | 16.01793 | 0.638 | −39.0647 | 23.9904 | ||
| Orange | Reference white | 5.0977 | 16.01793 | 0.751 | −26.4298 | 36.6252 | |
| Yellow | −13.1934 | 16.01793 | 0.411 | −44.721 | 18.3341 | ||
| Green | 9.0201 | 16.01793 | 0.574 | −22.5074 | 40.5476 | ||
| Blue | −5.8815 | 16.01793 | 0.714 | −37.409 | 25.6461 | ||
| Purple | −19.219 | 16.01793 | 0.231 | −50.7465 | 12.3085 | ||
| Red | 7.5372 | 16.01793 | 0.638 | −23.9904 | 39.0647 | ||
| Logical_Error_rate | Reference white | Yellow | 0.2381 * | 0.10468 | 0.024 | 0.0321 | 0.4441 |
| Green | 0.2857 * | 0.10468 | 0.007 | 0.0797 | 0.4918 | ||
| Blue | 0.0238 | 0.10468 | 0.82 | −0.1822 | 0.2299 | ||
| Purple | −0.0238 | 0.10468 | 0.82 | −0.2299 | 0.1822 | ||
| Red | 0.0476 | 0.10468 | 0.65 | −0.1584 | 0.2537 | ||
| Orange | −0.0952 | 0.10468 | 0.364 | −0.3013 | 0.1108 | ||
| Yellow | Reference white | −0.2381 * | 0.10468 | 0.024 | −0.4441 | −0.0321 | |
| Green | 0.0476 | 0.10468 | 0.65 | −0.1584 | 0.2537 | ||
| Blue | −0.2143 * | 0.10468 | 0.042 | −0.4203 | −0.0082 | ||
| Purple | −0.2619 * | 0.10468 | 0.013 | −0.4679 | −0.0559 | ||
| Red | −0.1905 | 0.10468 | 0.07 | −0.3965 | 0.0156 | ||
| Orange | −0.3333 * | 0.10468 | 0.002 | −0.5394 | −0.1273 | ||
| Green | Reference white | −0.2857 * | 0.10468 | 0.007 | −0.4918 | −0.0797 | |
| Yellow | −0.0476 | 0.10468 | 0.65 | −0.2537 | 0.1584 | ||
| Blue | −0.2619 * | 0.10468 | 0.013 | −0.4679 | −0.0559 | ||
| Purple | −0.3095 * | 0.10468 | 0.003 | −0.5156 | −0.1035 | ||
| Red | −0.2381 * | 0.10468 | 0.024 | −0.4441 | −0.0321 | ||
| Orange | −0.3810 * | 0.10468 | 0 | −0.587 | −0.1749 | ||
| Blue | Reference white | −0.0238 | 0.10468 | 0.82 | −0.2299 | 0.1822 | |
| Yellow | 0.2143 * | 0.10468 | 0.042 | 0.0082 | 0.4203 | ||
| Green | 0.2619 * | 0.10468 | 0.013 | 0.0559 | 0.4679 | ||
| Purple | −0.0476 | 0.10468 | 0.65 | −0.2537 | 0.1584 | ||
| Red | 0.0238 | 0.10468 | 0.82 | −0.1822 | 0.2299 | ||
| Orange | −0.119 | 0.10468 | 0.256 | −0.3251 | 0.087 | ||
| Purple | Reference white | 0.0238 | 0.10468 | 0.82 | −0.1822 | 0.2299 | |
| Yellow | 0.2619 * | 0.10468 | 0.013 | 0.0559 | 0.4679 | ||
| Green | 0.3095 * | 0.10468 | 0.003 | 0.1035 | 0.5156 | ||
| Blue | 0.0476 | 0.10468 | 0.65 | −0.1584 | 0.2537 | ||
| Red | 0.0714 | 0.10468 | 0.496 | −0.1346 | 0.2775 | ||
| Orange | −0.0714 | 0.10468 | 0.496 | −0.2775 | 0.1346 | ||
| Red | Reference white | −0.0476 | 0.10468 | 0.65 | −0.2537 | 0.1584 | |
| Yellow | 0.1905 | 0.10468 | 0.07 | −0.0156 | 0.3965 | ||
| Green | 0.2381 * | 0.10468 | 0.024 | 0.0321 | 0.4441 | ||
| Blue | −0.0238 | 0.10468 | 0.82 | −0.2299 | 0.1822 | ||
| Purple | −0.0714 | 0.10468 | 0.496 | −0.2775 | 0.1346 | ||
| Orange | −0.1429 | 0.10468 | 0.173 | −0.3489 | 0.0632 | ||
| Orange | Reference white | 0.0952 | 0.10468 | 0.364 | −0.1108 | 0.3013 | |
| Yellow | 0.3333 * | 0.10468 | 0.002 | 0.1273 | 0.5394 | ||
| Green | 0.3810 * | 0.10468 | 0 | 0.1749 | 0.587 | ||
| Blue | 0.119 | 0.10468 | 0.256 | −0.087 | 0.3251 | ||
| Purple | 0.0714 | 0.10468 | 0.496 | −0.1346 | 0.2775 | ||
| Red | 0.1429 | 0.10468 | 0.173 | −0.0632 | 0.3489 | ||
| Lateral_Response_Time | Reference white | Yellow | −3.1132 | 9.71618 | 0.749 | −22.2372 | 16.0108 |
| Green | 13.2943 | 9.71618 | 0.172 | −5.8297 | 32.4183 | ||
| Blue | 2.5455 | 9.71618 | 0.794 | −16.5785 | 21.6695 | ||
| Purple | −11.7523 | 9.71618 | 0.227 | −30.8763 | 7.3717 | ||
| Red | 11.2665 | 9.71618 | 0.247 | −7.8575 | 30.3905 | ||
| Orange | 15.1524 | 9.71618 | 0.12 | −3.9716 | 34.2764 | ||
| Yellow | Reference white | 3.1132 | 9.71618 | 0.749 | −16.0108 | 22.2372 | |
| Green | 16.4076 | 9.71618 | 0.092 | −2.7165 | 35.5316 | ||
| Blue | 5.6588 | 9.71618 | 0.561 | −13.4652 | 24.7828 | ||
| Purple | −8.6391 | 9.71618 | 0.375 | −27.7631 | 10.4849 | ||
| Red | 14.3797 | 9.71618 | 0.14 | −4.7443 | 33.5037 | ||
| Orange | 18.2656 | 9.71618 | 0.061 | −0.8584 | 37.3896 | ||
| Green | Reference white | −13.2943 | 9.71618 | 0.172 | −32.4183 | 5.8297 | |
| Yellow | −16.4076 | 9.71618 | 0.092 | −35.5316 | 2.7165 | ||
| Blue | −10.7488 | 9.71618 | 0.27 | −29.8728 | 8.3752 | ||
| Purple | −25.0466 * | 9.71618 | 0.01 | −44.1707 | −5.9226 | ||
| Red | −2.0278 | 9.71618 | 0.835 | −21.1518 | 17.0962 | ||
| Orange | 1.8581 | 9.71618 | 0.848 | −17.2659 | 20.9821 | ||
| Blue | Reference white | −2.5455 | 9.71618 | 0.794 | −21.6695 | 16.5785 | |
| Yellow | −5.6588 | 9.71618 | 0.561 | −24.7828 | 13.4652 | ||
| Green | 10.7488 | 9.71618 | 0.27 | −8.3752 | 29.8728 | ||
| Purple | −14.2979 | 9.71618 | 0.142 | −33.4219 | 4.8261 | ||
| Red | 8.721 | 9.71618 | 0.37 | −10.403 | 27.845 | ||
| Orange | 12.6068 | 9.71618 | 0.195 | −6.5172 | 31.7308 | ||
| Purple | Reference white | 11.7523 | 9.71618 | 0.227 | −7.3717 | 30.8763 | |
| Yellow | 8.6391 | 9.71618 | 0.375 | −10.4849 | 27.7631 | ||
| Green | 25.0466 * | 9.71618 | 0.01 | 5.9226 | 44.1707 | ||
| Blue | 14.2979 | 9.71618 | 0.142 | −4.8261 | 33.4219 | ||
| Red | 23.0188 * | 9.71618 | 0.018 | 3.8948 | 42.1428 | ||
| Orange | 26.9047 * | 9.71618 | 0.006 | 7.7807 | 46.0287 | ||
| Red | Reference white | −11.2665 | 9.71618 | 0.247 | −30.3905 | 7.8575 | |
| Yellow | −14.3797 | 9.71618 | 0.14 | −33.5037 | 4.7443 | ||
| Green | 2.0278 | 9.71618 | 0.835 | −17.0962 | 21.1518 | ||
| Blue | −8.721 | 9.71618 | 0.37 | −27.845 | 10.403 | ||
| Purple | −23.0188 * | 9.71618 | 0.018 | −42.1428 | −3.8948 | ||
| Orange | 3.8859 | 9.71618 | 0.69 | −15.2381 | 23.0099 | ||
| Orange | Reference white | −15.1524 | 9.71618 | 0.12 | −34.2764 | 3.9716 | |
| Yellow | −18.2656 | 9.71618 | 0.061 | −37.3896 | 0.8584 | ||
| Green | −1.8581 | 9.71618 | 0.848 | −20.9821 | 17.2659 | ||
| Blue | −12.6068 | 9.71618 | 0.195 | −31.7308 | 6.5172 | ||
| Purple | −26.9047 * | 9.71618 | 0.006 | −46.0287 | −7.7807 | ||
| Red | −3.8859 | 9.71618 | 0.69 | −23.0099 | 15.2381 | ||
| Lateral_Error_rate | Reference white | Yellow | 0.1905 | 0.1037 | 0.067 | −0.0136 | 0.3946 |
| Green | 0.3333 * | 0.1037 | 0.001 | 0.1292 | 0.5374 | ||
| Blue | −0.0476 | 0.1037 | 0.646 | −0.2517 | 0.1565 | ||
| Purple | 0 | 0.1037 | 1 | −0.2041 | 0.2041 | ||
| Red | −0.0238 | 0.1037 | 0.819 | −0.2279 | 0.1803 | ||
| Orange | −0.0476 | 0.1037 | 0.646 | −0.2517 | 0.1565 | ||
| Yellow | Reference white | −0.1905 | 0.1037 | 0.067 | −0.3946 | 0.0136 | |
| Green | 0.1429 | 0.1037 | 0.169 | −0.0612 | 0.347 | ||
| Blue | −0.2381 * | 0.1037 | 0.022 | −0.4422 | −0.034 | ||
| Purple | −0.1905 | 0.1037 | 0.067 | −0.3946 | 0.0136 | ||
| Red | −0.2143 * | 0.1037 | 0.04 | −0.4184 | −0.0102 | ||
| Orange | −0.2381 * | 0.1037 | 0.022 | −0.4422 | −0.034 | ||
| Green | Reference white | −0.3333 * | 0.1037 | 0.001 | −0.5374 | −0.1292 | |
| Yellow | −0.1429 | 0.1037 | 0.169 | −0.347 | 0.0612 | ||
| Blue | −0.3810 * | 0.1037 | 0 | −0.5851 | −0.1768 | ||
| Purple | −0.3333 * | 0.1037 | 0.001 | −0.5374 | −0.1292 | ||
| Red | −0.3571 * | 0.1037 | 0.001 | −0.5612 | −0.153 | ||
| Orange | −0.3810 * | 0.1037 | 0 | −0.5851 | −0.1768 | ||
| Blue | Reference white | 0.0476 | 0.1037 | 0.646 | −0.1565 | 0.2517 | |
| Yellow | 0.2381 * | 0.1037 | 0.022 | 0.034 | 0.4422 | ||
| Green | 0.3810 * | 0.1037 | 0 | 0.1768 | 0.5851 | ||
| Purple | 0.0476 | 0.1037 | 0.646 | −0.1565 | 0.2517 | ||
| Red | 0.0238 | 0.1037 | 0.819 | −0.1803 | 0.2279 | ||
| Orange | 0 | 0.1037 | 1 | −0.2041 | 0.2041 | ||
| Purple | Reference white | 0 | 0.1037 | 1 | −0.2041 | 0.2041 | |
| Yellow | 0.1905 | 0.1037 | 0.067 | −0.0136 | 0.3946 | ||
| Green | 0.3333 * | 0.1037 | 0.001 | 0.1292 | 0.5374 | ||
| Blue | −0.0476 | 0.1037 | 0.646 | −0.2517 | 0.1565 | ||
| Red | −0.0238 | 0.1037 | 0.819 | −0.2279 | 0.1803 | ||
| Orange | −0.0476 | 0.1037 | 0.646 | −0.2517 | 0.1565 | ||
| Red | Reference white | 0.0238 | 0.1037 | 0.819 | −0.1803 | 0.2279 | |
| Yellow | 0.2143 * | 0.1037 | 0.04 | 0.0102 | 0.4184 | ||
| Green | 0.3571 * | 0.1037 | 0.001 | 0.153 | 0.5612 | ||
| Blue | −0.0238 | 0.1037 | 0.819 | −0.2279 | 0.1803 | ||
| Purple | 0.0238 | 0.1037 | 0.819 | −0.1803 | 0.2279 | ||
| Orange | −0.0238 | 0.1037 | 0.819 | −0.2279 | 0.1803 | ||
| Orange | Reference white | 0.0476 | 0.1037 | 0.646 | −0.1565 | 0.2517 | |
| Yellow | 0.2381 * | 0.1037 | 0.022 | 0.034 | 0.4422 | ||
| Green | 0.3810 * | 0.1037 | 0 | 0.1768 | 0.5851 | ||
| Blue | 0 | 0.1037 | 1 | −0.2041 | 0.2041 | ||
| Purple | 0.0476 | 0.1037 | 0.646 | −0.1565 | 0.2517 | ||
| Red | 0.0238 | 0.1037 | 0.819 | −0.1803 | 0.2279 | ||
| Detail_Response_Time | Reference white | Yellow | −6.491 | 9.36793 | 0.489 | −24.9295 | 11.9476 |
| Green | 4.925 | 9.36793 | 0.599 | −13.5136 | 23.3635 | ||
| Blue | −2.716 | 9.36793 | 0.772 | −21.1545 | 15.7226 | ||
| Purple | −8.9639 | 9.36793 | 0.339 | −27.4024 | 9.4747 | ||
| Red | −3.2935 | 9.36793 | 0.725 | −21.7321 | 15.1451 | ||
| Orange | −4.8773 | 9.36793 | 0.603 | −23.3159 | 13.5613 | ||
| Yellow | Reference white | 6.491 | 9.36793 | 0.489 | −11.9476 | 24.9295 | |
| Green | 11.4159 | 9.36793 | 0.224 | −7.0227 | 29.8545 | ||
| Blue | 3.775 | 9.36793 | 0.687 | −14.6636 | 22.2136 | ||
| Purple | −2.4729 | 9.36793 | 0.792 | −20.9115 | 15.9657 | ||
| Red | 3.1975 | 9.36793 | 0.733 | −15.2411 | 21.636 | ||
| Orange | 1.6137 | 9.36793 | 0.863 | −16.8249 | 20.0522 | ||
| Green | Reference white | −4.925 | 9.36793 | 0.599 | −23.3635 | 13.5136 | |
| Yellow | −11.4159 | 9.36793 | 0.224 | −29.8545 | 7.0227 | ||
| Blue | −7.6409 | 9.36793 | 0.415 | −26.0795 | 10.7977 | ||
| Purple | −13.8888 | 9.36793 | 0.139 | −32.3274 | 4.5498 | ||
| Red | −8.2185 | 9.36793 | 0.381 | −26.657 | 10.2201 | ||
| Orange | −9.8023 | 9.36793 | 0.296 | −28.2408 | 8.6363 | ||
| Blue | Reference white | 2.716 | 9.36793 | 0.772 | −15.7226 | 21.1545 | |
| Yellow | −3.775 | 9.36793 | 0.687 | −22.2136 | 14.6636 | ||
| Green | 7.6409 | 9.36793 | 0.415 | −10.7977 | 26.0795 | ||
| Purple | −6.2479 | 9.36793 | 0.505 | −24.6865 | 12.1907 | ||
| Red | −0.5775 | 9.36793 | 0.951 | −19.0161 | 17.861 | ||
| Orange | −2.1613 | 9.36793 | 0.818 | −20.5999 | 16.2772 | ||
| Purple | Reference white | 8.9639 | 9.36793 | 0.339 | −9.4747 | 27.4024 | |
| Yellow | 2.4729 | 9.36793 | 0.792 | −15.9657 | 20.9115 | ||
| Green | 13.8888 | 9.36793 | 0.139 | −4.5498 | 32.3274 | ||
| Blue | 6.2479 | 9.36793 | 0.505 | −12.1907 | 24.6865 | ||
| Red | 5.6704 | 9.36793 | 0.545 | −12.7682 | 24.1089 | ||
| Orange | 4.0866 | 9.36793 | 0.663 | −14.352 | 22.5251 | ||
| Red | Reference white | 3.2935 | 9.36793 | 0.725 | −15.1451 | 21.7321 | |
| Yellow | −3.1975 | 9.36793 | 0.733 | −21.636 | 15.2411 | ||
| Green | 8.2185 | 9.36793 | 0.381 | −10.2201 | 26.657 | ||
| Blue | 0.5775 | 9.36793 | 0.951 | −17.861 | 19.0161 | ||
| Purple | −5.6704 | 9.36793 | 0.545 | −24.1089 | 12.7682 | ||
| Orange | −1.5838 | 9.36793 | 0.866 | −20.0224 | 16.8548 | ||
| Orange | Reference white | 4.8773 | 9.36793 | 0.603 | −13.5613 | 23.3159 | |
| Yellow | −1.6137 | 9.36793 | 0.863 | −20.0522 | 16.8249 | ||
| Green | 9.8023 | 9.36793 | 0.296 | −8.6363 | 28.2408 | ||
| Blue | 2.1613 | 9.36793 | 0.818 | −16.2772 | 20.5999 | ||
| Purple | −4.0866 | 9.36793 | 0.663 | −22.5251 | 14.352 | ||
| Red | 1.5838 | 9.36793 | 0.866 | −16.8548 | 20.0224 | ||
| Detail_Error_Rate | Reference white | Yellow | 0.0238 | 0.10455 | 0.82 | −0.182 | 0.2296 |
| Green | 0.119 | 0.10455 | 0.256 | −0.0867 | 0.3248 | ||
| Blue | −0.0952 | 0.10455 | 0.363 | −0.301 | 0.1105 | ||
| Purple | −0.1905 | 0.10455 | 0.07 | −0.3963 | 0.0153 | ||
| Red | −0.119 | 0.10455 | 0.256 | −0.3248 | 0.0867 | ||
| Orange | 0 | 0.10455 | 1 | −0.2058 | 0.2058 | ||
| Yellow | Reference white | −0.0238 | 0.10455 | 0.82 | −0.2296 | 0.182 | |
| Green | 0.0952 | 0.10455 | 0.363 | −0.1105 | 0.301 | ||
| Blue | −0.119 | 0.10455 | 0.256 | −0.3248 | 0.0867 | ||
| Purple | −0.2143 * | 0.10455 | 0.041 | −0.4201 | −0.0085 | ||
| Red | −0.1429 | 0.10455 | 0.173 | −0.3486 | 0.0629 | ||
| Orange | −0.0238 | 0.10455 | 0.82 | −0.2296 | 0.182 | ||
| Green | Reference white | −0.119 | 0.10455 | 0.256 | −0.3248 | 0.0867 | |
| Yellow | −0.0952 | 0.10455 | 0.363 | −0.301 | 0.1105 | ||
| Blue | −0.2143 * | 0.10455 | 0.041 | −0.4201 | −0.0085 | ||
| Purple | −0.3095 * | 0.10455 | 0.003 | −0.5153 | −0.1037 | ||
| Red | −0.2381 * | 0.10455 | 0.024 | −0.4439 | −0.0323 | ||
| Orange | −0.119 | 0.10455 | 0.256 | −0.3248 | 0.0867 | ||
| Blue | Reference white | 0.0952 | 0.10455 | 0.363 | −0.1105 | 0.301 | |
| Yellow | 0.119 | 0.10455 | 0.256 | −0.0867 | 0.3248 | ||
| Green | 0.2143 * | 0.10455 | 0.041 | 0.0085 | 0.4201 | ||
| Purple | −0.0952 | 0.10455 | 0.363 | −0.301 | 0.1105 | ||
| Red | −0.0238 | 0.10455 | 0.82 | −0.2296 | 0.182 | ||
| Orange | 0.0952 | 0.10455 | 0.363 | −0.1105 | 0.301 | ||
| Purple | Reference white | 0.1905 | 0.10455 | 0.07 | −0.0153 | 0.3963 | |
| Yellow | 0.2143 * | 0.10455 | 0.041 | 0.0085 | 0.4201 | ||
| Green | 0.3095 * | 0.10455 | 0.003 | 0.1037 | 0.5153 | ||
| Blue | 0.0952 | 0.10455 | 0.363 | −0.1105 | 0.301 | ||
| Red | 0.0714 | 0.10455 | 0.495 | −0.1344 | 0.2772 | ||
| Orange | 0.1905 | 0.10455 | 0.07 | −0.0153 | 0.3963 | ||
| Red | Reference white | 0.119 | 0.10455 | 0.256 | −0.0867 | 0.3248 | |
| Yellow | 0.1429 | 0.10455 | 0.173 | −0.0629 | 0.3486 | ||
| Green | 0.2381 * | 0.10455 | 0.024 | 0.0323 | 0.4439 | ||
| Blue | 0.0238 | 0.10455 | 0.82 | −0.182 | 0.2296 | ||
| Purple | −0.0714 | 0.10455 | 0.495 | −0.2772 | 0.1344 | ||
| Orange | 0.119 | 0.10455 | 0.256 | −0.0867 | 0.3248 | ||
| Orange | Reference white | 0 | 0.10455 | 1 | −0.2058 | 0.2058 | |
| Yellow | 0.0238 | 0.10455 | 0.82 | −0.182 | 0.2296 | ||
| Green | 0.119 | 0.10455 | 0.256 | −0.0867 | 0.3248 | ||
| Blue | −0.0952 | 0.10455 | 0.363 | −0.301 | 0.1105 | ||
| Purple | −0.1905 | 0.10455 | 0.07 | −0.3963 | 0.0153 | ||
| Red | −0.119 | 0.10455 | 0.256 | −0.3248 | 0.0867 | ||
References
- Bibost, A.-L.; Brown, C. Laterality influences cognitive performance in rainbowfish Melanotaenia duboulayi. Anim. Cogn. 2014, 17, 1045–1051. [Google Scholar] [CrossRef] [PubMed]
- Chen, Q.; Beaty, R.E.; Cui, Z.; Sun, J.; He, H.; Zhuang, K.; Ren, Z.; Liu, G.; Qiu, J. Brain hemispheric involvement in visuospatial and verbal divergent thinking. NeuroImage 2019, 202, 116065. [Google Scholar] [CrossRef]
- Pflug, A.; Gompf, F.; Muthuraman, M.; Groppa, S.; Kell, C.A. Differential contributions of the two human cerebral hemispheres to action timing. eLife 2019, 8, 48404. [Google Scholar] [CrossRef]
- Mihov, K.M.; Denzler, M.; Förster, J. Hemispheric specialization and creative thinking: A meta-analytic review of lateralization of creativity. Brain Cognit. 2010, 72, 442–448. [Google Scholar] [CrossRef]
- Brown, R.J.; Oakley, D. Hypnotic susceptibility and holistic/emotional styles of thinking. Contemp. Hypn. 1998, 15, 76–83. [Google Scholar] [CrossRef]
- Ramachandran, V.S.; Hubbard, E.M. Synaesthesia—A window into perception, thought and language. J. Conscious. Stud. 2001, 8, 3–34. [Google Scholar]
- Henry, J.P. Psychological and physiological responses to stress: The right hemisphere and the hypothalamo-pituitary-adrenal axis, an inquiry into problems of human bonding. Integr. Physiol. Behav. Sci. 1993, 28, 369–387. [Google Scholar] [CrossRef]
- Elliot, A.J.; Maier, M.A. Color and psychological functioning. Curr. Dir. Psychol. Sci. 2007, 16, 250–254. [Google Scholar] [CrossRef]
- Kaya, N.; Epps, H.H. Relationship between color and emotion: A study of college students. Coll. Stud. J. 2004, 38, 396. [Google Scholar]
- Ou, L.-C.; Luo, M.R.; Sun, P.-L.; Hu, N.; Chen, H.-S. Age effects on colour emotion, preference, and harmony. Color Res. Appl. 2011, 37, 92–105. [Google Scholar] [CrossRef]
- Xia, G.; Henry, P.; Queiroz, F.; Westland, S. Effects of object colour stimuli on human brain activities and subjective feelings in physical environment and virtual reality. In Proceedings of the International Colour Association (AIC) Conference, Buenos Aires, Argentina, 15–17 October 2019. [Google Scholar]
- Jang, S.C.S.; Namkung, Y. Perceived quality, emotions, and behavioral intentions: Application of an extended Mehrabian–Russell model to restaurants. J. Bus. Res. 2009, 62, 451–460. [Google Scholar] [CrossRef]
- Elliot, A.J.; Maier, M.A.; Moller, A.C.; Friedman, R.; Meinhardt, J.J. Color and psychological functioning: The effect of red on performance attainment. J. Exp. Psychol. Gen. 2007, 136, 154. [Google Scholar] [CrossRef] [PubMed]
- Yildirim, K.; Cagatay, K.; Ayalp, N. Effect of wall colour on the perception of classrooms. Indoor Built Environ. 2014, 24, 607–616. [Google Scholar] [CrossRef]
- Lin, J.; Westland, S.; Cheung, V. Effect of intensity of short-wavelength light on electroencephalogram and subjective alertness. Light. Res. Technol. 2019, 52, 413–422. [Google Scholar] [CrossRef]
- Lin, J.; Westland, S. Effect of long-wavelength light on electroencephalogram and subjective alertness. Light. Res. Technol. 2020, 52, 763–774. [Google Scholar] [CrossRef]
- Hill, R.A.; Barton, R.A. Red enhances human performance in contests. Nat. Cell Biol. 2005, 435, 293. [Google Scholar] [CrossRef] [PubMed]
- Ilie, A.; Ioan, S.; Zagrean, L.; Moldovan, M. Better to Be Red than Blue in Virtual Competition. Cyberpsychol. Behav. 2008, 11, 375–377. [Google Scholar] [CrossRef]
- Attrill, M.J.; Gresty, K.A.; Hill, R.A.; Barton, R.A. Red shirt colour is associated with long-term team success in English football. J. Sports Sci. 2008, 26, 577–582. [Google Scholar] [CrossRef]
- Matsumoto, D.; Konno, J.; Hata, S.; Takeuchi, M. Blue judogi may bias competition outcomes. Percept. Motor Skills 2007, 39. [Google Scholar] [CrossRef]
- Rowe, C.; Harris, J.M.; Roberts, S.C. Seeing red? Putting sportswear in context. Nat. Cell Biol. 2005, 437, e10. [Google Scholar] [CrossRef]
- Al-Ayash, A.; Kane, R.T.; Smith, D.; Green-Armytage, P. The influence of color on student emotion, heart rate, and performance in learning environments. Color Res. Appl. 2016, 41, 196–205. [Google Scholar] [CrossRef]
- Ou, L.-C.; Luo, M.R.; Woodcock, A.; Wright, A. A study of colour emotion and colour preference. Part I: Colour emotions for single colours. Color Res. Appl. 2004, 29, 232–240. [Google Scholar] [CrossRef]
- Xin, J.; Cheng, K.M.; Taylor, G.; Sato, T.; Hansuebsai, A. Cross-regional comparison of colour emotions Part II: Qualitative analysis. Color Res. Appl. 2004, 29, 458–466. [Google Scholar] [CrossRef]
- Soriano, C.; Valenzuela, J. Emotion and colour across languages: Implicit associations in Spanish colour terms. Soc. Sci. Inf. 2009, 48, 421–445. [Google Scholar] [CrossRef]
- Duan, Y.; Rhodes, P.A.; Cheung, V. The influence of color on impulsiveness and arousal: Part 1—Hue. Color Res. Appl. 2018, 43, 396–404. [Google Scholar] [CrossRef]
- Pribram, K.H.; McGuinness, D.J. Arousal, activation, and effort in the control of attention. Psychol. Rev. 1975, 82, 116–149. [Google Scholar] [CrossRef]
- Waid, W.M.; Orne, E.C.; Orne, M.T. Selective memory for social information, alertness, and physiological arousal in the detection of deception. J. Appl. Psychol. 1981, 66, 224–232. [Google Scholar] [CrossRef]
- Hackfort, D.; Schinke, R.J.; Strauss, B. Dictionary of Sport Psychology: Sport, Exercise, and Performing Arts; Elsevier Science & Technology: San Diego, CA, USA, 2019. [Google Scholar]
- Galentino, A.; Bonini, N.; Savadori, L. Positive Arousal Increases Individuals’ Preferences for Risk. Front. Psychol. 2017, 8, 2142. [Google Scholar] [CrossRef] [PubMed]
- Teigen, K.H. Yerkes-Dodson: A Law for all Seasons. Theory Psychol. 1994, 4, 525–547. [Google Scholar] [CrossRef]
- Russell, J.A.; Mehrabian, A. Distinguishing anger and anxiety in terms of emotional response factors. J. Consult. Clin. Psychol. 1974, 42, 79. [Google Scholar] [CrossRef]
- Jacobs, K.W.; Suess, J.F. Effects of Four Psychological Primary Colors on Anxiety State. Percept. Mot. Skills 1975, 41, 207–210. [Google Scholar] [CrossRef]
- Wilson, G.D. Arousal properties of red versus green. Percept. Mot. Skills 1966. [Google Scholar] [CrossRef]
- Greene, T.C.; Bell, P.A.; Boyer, W.N. Coloring the environment: Hue, arousal, and boredom. Bull. Psychon. Soc. 1983, 21, 253–254. [Google Scholar] [CrossRef]
- Griffitt, W. Environmental effects on interpersonal affective behavior: Ambient effective temperature and attraction. J. Personal. Soc. Psychol. 1970, 15, 240. [Google Scholar] [CrossRef] [PubMed]
- Russell, J.A.; Pratt, G. A description of the affective quality attributed to environments. J. Personal. Soc. Psychol. 1980, 38, 311. [Google Scholar] [CrossRef]
- Beck, J.; Egger, R. Emotionalise Me: Self-reporting and Arousal Measurements in Virtual Tourism Environments. In Information and Communication Technologies in Tourism; Springer: Berlin/Heidelberg, Germany, 2018; pp. 3–15. [Google Scholar]
- Groeppel-Klein, A. Arousal and consumer in-store behavior. Brain Res. Bull. 2005, 67, 428–437. [Google Scholar] [CrossRef] [PubMed]
- Korff, J.; Geer, J.H. The Relationship Between Sexual Arousal Experience and Genital Response. Psychophysiology 1983, 20, 121–127. [Google Scholar] [CrossRef]
- Barratt, E.S. Anxiety and impulsiveness: Toward a neuropsychological model. In Anxiety; Elsevier: Amsterdam, The Netherlands, 1972; pp. 195–222. [Google Scholar]
- Zentall, S.S.; Falkenberg, S.D.; Smith, L.B. Effects of color stimulation and information on the copying performance of attention-problem adolescents. J. Abnorm. Child Psychol. 1985, 13, 501–511. [Google Scholar] [CrossRef] [PubMed]
- Wang, L.; Pirouz, D.; Zhang, X. Should Santa Still Wear Red?: Investigating the Effects of Color on Impulsive Buying Behavior. Assoc. Consum. Res. 2011, 39, 730. [Google Scholar]
- Sevda, K.; Özer, Ö.; Kaya, Ş.; Kazgan, A.; Atmaca, M. The correlation between color choices and impulsivity, anxiety and depression. Eur. J. Gen. Med. 2016, 13, 47–50. [Google Scholar] [CrossRef]
- Ciccone, N.W. A Multifaceted Approach into the Effect of Coloured Environment on Impulsivity Using Personality, Behavioural and Neurological Methods; University of Leeds: Leeds, UK, 2018. [Google Scholar]
- Salkind, N.J.; Wright, J. The development of reflection-impulsivity and cognitive efficiency. Hum. Dev. 1977, 20, 377–387. [Google Scholar] [CrossRef]
- Eysenck, H.J. A Critical and Experimental Study of Colour Preferences. Am. J. Psychol. 1941, 54, 385. [Google Scholar] [CrossRef]
- Yu, L.; Westland, S.; Li, Z.; Pan, Q.; Shin, M.J.; Won, S. The role of individual colour preferences in consumer purchase decisions. Color Res. Appl. 2018, 43, 258–267. [Google Scholar] [CrossRef]
- Singh, S. Impact of color on marketing. Manag. Decis. 2006, 44, 783–789. [Google Scholar] [CrossRef]
- Yu, L.; Westland, S.; Li, Z. Analysis of experiments to determine individual colour preference. Color Res. Appl. 2021, 46, 155–167. [Google Scholar] [CrossRef]


Publisher’s Note: MDPI stays neutral with regard to jurisdictional claims in published maps and institutional affiliations. |
© 2021 by the authors. Licensee MDPI, Basel, Switzerland. This article is an open access article distributed under the terms and conditions of the Creative Commons Attribution (CC BY) license (http://creativecommons.org/licenses/by/4.0/).
Share and Cite
Xia, G.; Li, M.; Henry, P.; Westland, S.; Queiroz, F.; Peng, Q.; Yu, L. Aroused and Impulsive Effects of Colour Stimuli on Lateral and Logical Abilities. Behav. Sci. 2021, 11, 24. https://doi.org/10.3390/bs11020024
Xia G, Li M, Henry P, Westland S, Queiroz F, Peng Q, Yu L. Aroused and Impulsive Effects of Colour Stimuli on Lateral and Logical Abilities. Behavioral Sciences. 2021; 11(2):24. https://doi.org/10.3390/bs11020024
Chicago/Turabian StyleXia, Guobin, Muzi Li, Philip Henry, Stephen Westland, Francisco Queiroz, Qiwei Peng, and Luwen Yu. 2021. "Aroused and Impulsive Effects of Colour Stimuli on Lateral and Logical Abilities" Behavioral Sciences 11, no. 2: 24. https://doi.org/10.3390/bs11020024
APA StyleXia, G., Li, M., Henry, P., Westland, S., Queiroz, F., Peng, Q., & Yu, L. (2021). Aroused and Impulsive Effects of Colour Stimuli on Lateral and Logical Abilities. Behavioral Sciences, 11(2), 24. https://doi.org/10.3390/bs11020024