Abstract
The Metaponto coastal plain (Ionian margin, Southern Italy) records the Late Pleistocene–Holocene evolution of a foredeep coastal system shaped by relative sea-level change, vertical land motion, and compaction. We analyze a 22 m continuous core (Meta 1) using lithofacies logging, grain size statistics and cumulative curves, multivariate analysis of grain size distributions (PCA and k-means clustering), and three AMS 14C ages, and we compare the record with a nearby borehole (MSB) and a global eustatic curve. Four depositional units document a shift from lower-shoreface–offshore deposition to lagoon–barrier/aeolian systems, culminating in late Holocene near-surface progradation. Textural end members (mud-rich offshore/lagoonal, traction-dominated, and sand-rich) are coherent across classical parameters, Visher-type curves, PCA, and k-means clusters. Depth–age comparisons suggest net uplift during the Late Glacial, followed by near-present relative sea level and a Late Holocene onset of modest net subsidence; a compaction contribution is plausible but unquantified. Subsidence/uplift rates therefore remain upper-bound estimates owing to sparse chronological control and the lack of glacio-isostatic and compaction modeling. Together with the MSB emerged-beach tie-point, the record constrains shoreline position and progradation. The inferred Mid- to Late-Holocene stabilization and progradational trends are consistent with other Italian and wider Mediterranean coastal plains. Additional dating and quantitative paleoecological proxies (e.g., foraminifera/ostracods/molluscs) are key to independently constrain salinity and water-depth changes and to refine the partitioning between subsidence and compaction.
1. Introduction
The Metaponto coastal plain (Basilicata Region, Southern Italy) is an onshore portion of the Southern Apennine foredeep, where Late Quaternary relative sea level variability and active foredeep deformation jointly shaped stratigraphic architecture and landscape evolution [1,2,3,4,5]. The plain records incision at the Last Glacial Maximum (LGM) and subsequent infill by Late Pleistocene–Holocene marine, transitional, and continental deposits organized into coastal wedges and a staircase of marine terraces, reflecting the superposition of eustasy with vertical land motion (VLM) and compaction [2,3,4,6,7,8,9]. Along this Ionian sector, MIS 5.5 shorelines occur at ~23 m a.s.l. near Taranto and up to ~40 m a.s.l. between Metaponto and Policoro, attesting to long-term uplift superposed on glacio-eustatic forcing [2].
Recent multidisciplinary work in the Metaponto sector has combined geomorphology, borehole stratigraphy, grain size analysis, paleoecology, and radiocarbon dating to refine the Late Quaternary evolution of the plain and to disentangle the relative roles of eustasy, uplift/subsidence, and compaction in controlling accommodation and shoreline mobility [1,3,10,11,12,13,14,15,16,17,18].
The present study adopts a multi-proxy process-to-product approach. A continuous core (Meta 1) was analyzed and described in detail to produce a high-resolution stratigraphic log (sediment characterization, sedimentary structures, fossils, and organic remains). No quantitative paleoecological analyses (e.g., foraminifera, ostracods, or molluscan assemblages) were carried out on the core; consequently, water depth and salinity estimates rely primarily on lithofacies, macrofossil occurrence, and regional analogues. Grain size data were processed into graphical products (histograms and cumulative and frequency distribution curves) and statistics [19], while environmental attribution relied on the morphology of cumulative curves following [20]. Independent chronological control was provided by radiocarbon dating. However, only three AMS ages are available for the 22 m long succession, so the chronostratigraphic framework remains relatively sparse. Ages between dated horizons are therefore interpolated and should be regarded as first-order constraints rather than a fully resolved time–depth model. In addition, the full set of grain size distributions was analyzed using principal component analysis (PCA) and k-means clustering to provide an independent multivariate check on the facies interpretation.
To place the Meta 1 record in a broader coastal context, we combine our core analysis with the MSB borehole presented in [4]. MSB, located in a back-barrier position, contains a fine- to medium-sand unit dated 3742 ± 45 yr BP and interpreted as emerged beach. This external Late Holocene tie-point has been used as an independent check on beach–dune/lagoonal stacking and as a working constraint on shoreline progradation in the Metaponto area [4]. In addition, several studies along the Ionian margin have compared depth–age information from coastal boreholes with global eustatic curves to obtain first-order estimates of vertical land motion, usually without explicit glacio-hydro-isostatic corrections [2,21,22,23,24,25,26]. Within this framework, late Pleistocene deposits have been interpreted to record apparent uplift rates of up to a few mm yr−1 (locally approaching ~4 mm yr−1), whereas Late Holocene back-barrier and lagoonal successions have been linked to modest subsidence on the order of ~1 mm yr−1, plausibly including a significant compaction component [2,4,21,22,23,24,25,26]. These earlier estimates, however, are based on sparse chronological control and on the use of a global eustatic template and should therefore be regarded as indicative ranges rather than precise local rates. One aim of this study is to refine this framework by integrating the new high-resolution stratigraphic and granulometric data from Meta 1 with the MSB record and with regional sea-level information.
By integrating cumulative curve morphology, graphic statistics, stratigraphic surfaces, MSB correlation, and RSL rate estimates, we achieve the objective of this study: a robust, internally consistent paleo-environmental interpretation for the Metaponto plain.
2. Geological Setting
The study area is located along the western margin of the Gulf of Taranto (Ionian Sea, Figure 1) [27,28]. It occupies the north westernmost sector of the Bradanic Trough, a structural domain of the Southern Apennines.
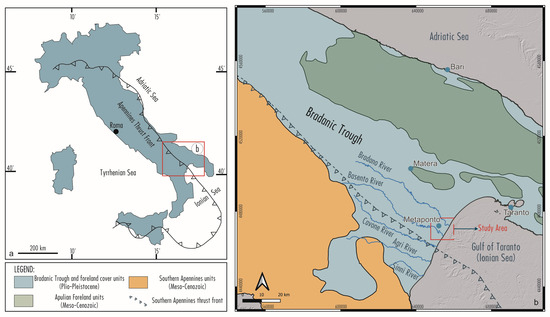
Figure 1.
(a) Location map of Italy showing the Southern Apennines thrust front and the main tectono-stratigraphic domains. (b) Enlarged view of the Gulf of Taranto margin with towns (Bari, Matera, Taranto, and Metaponto), principal rivers, and the trace of the Southern Apennines thrust front. The red rectangle marks the study area on the Metaponto coastal plain.
The tectonic evolution of the Southern Apennines began during the Mesozoic. From the Late Mesozoic through the Cenozoic, at least three syn-sedimentary tectonic phases with distinct kinematics can be recognized. The first tectonic phase, assigned to the Late Cretaceous [29,30,31,32,33,34,35], is characterized by extensional tectonics and associated normal faulting. The second phase, spanning from the Miocene to the Early Pliocene [29,36,37,38,39,40], is linked to the development of the Lucanian–Apulian fold-and-thrust belt system. The third tectonic phase, occurring during the Plio-Pleistocene [32,41], involves reactivation of pre-existing normal faults and a major episode of subsidence. This subsidence, on the order of approximately 2 mm/yr [42,43], contributed a relative sea level rise that partially drowned the Apulian foreland. During the Early Pleistocene, the progressive advance of the allochthonous Apennine chain induced flexural subsidence of the foredeep and foreland basins toward the orogenic front, promoting the deposition of the siliciclastic pelitic formations [44,45].
Since the Middle Pleistocene, sustained regional uplift has shaped the present morphological and structural configuration of the area [46,47].
In the Metaponto sector, the formation that represents the basement of the coastal depositional succession consists of the Argille subappennine: an informal lithostratigraphic unit [48], well known in the Southern Apennine Chain and mainly composed of silty clay and clay from a transitional to fully marine environment. Numerous studies have focused on this unit [49,50,51,52,53,54], highlighting its significance in the regional stratigraphy and its morphological organization into a set of terraces subparallel to the modern coastline [1,2,55,56,57]. These marine terraces represent paleo-shorelines produced by the interplay between tectonic uplift and glacio-eustatic sea level fluctuations [58,59].
The Gulf of Taranto forms the northern tip of the Ionian Sea (Figure 1b), bounded to the west by the Southern Apennine chain–Calabrian Arc and to the east by the Apulian foreland; it represents the offshore continuation of the Southern Apennine accretionary wedge–foredeep system [27,28]. During the Early Pleistocene, the thrust front advanced toward the foreland at a rate of ~1 cm/yr within the coupled thrust belt–foredeep–foreland system [27,60,61]. The rapid forelandward migration of the thrust front promoted the development of extensional structures related to flexure of the downgoing lithosphere, producing outer-arc extension across the peripheral bulge in the outer foredeep [27,28,62,63,64,65,66]. This structural configuration favours erosional features within the recent sedimentary cover of the submerged foredeep, with clear geohazard implications [67,68,69,70]. Late Pleistocene–Holocene sedimentary bodies broadly comparable to onshore deposits have been identified in the western sector of the gulf [28,71].
The Bradanic Foredeep
The Bradanic Trough is the foredeep of the southern Apennines, active from the Pliocene to the present. During the Pliocene–Early Pleistocene, the eastward migration of the orogenic system, accompanied by several deformation phases, led to the development of this trough at the front of the allochthonous Apennine thrust belt [72].
The Quaternary successions exposed within the trough represent the thickest sedimentary sequences in the area. From the base to the top, the succession begins with the Calcarenite di Gravina formation, which is composed of transitional, bioclastic calcarenites [53,73]. The Calcarenite di Gravina grades into the Argille subappennine through heteropic contact [14,74,75,76]. Upsection and laterally, the Argille subappennine locally passes into bioclastic calcarenites, reflecting a transitional depositional environment [14,76].
Several authors report that regional uplift has been ongoing since the Middle Pleistocene at an average rate of approximately 1 mm/yr [4,47,77,78]. Together with glacio-eustatic sea level fluctuations [1], this uplift produced a staircase of marine terraces ranging from 380 m to 10 m above the present sea level. The overall orientation appears unrelated to north-eastward thrusting of the Apennine front towards the undeformed Apulian foreland, which would typically produce northeast-dipping landforms [49]. The sedimentary characteristics of analogous Pleistocene deposits from both the northern and southern sectors of the Periadriatic foredeep have been thoroughly described elsewhere [79,80]. More recently, eleven terrace orders dated to 600 kyr −60 kyr BP have been identified [3,7] and described as gravel and sand wedges unconformably overlying marine silts and clays [53].
In the Holocene marine, transitional or continental deposits associated with the post-glacial transgression that followed the last sea level lowstand (20 yr BP) attain thicknesses of roughly 100 m [2,3]. Since the Holocene Climatic Optimum, beach sand deposits corresponding to multiple coastal ridges have formed through eastward progradation (Figure 2), extending up to the present-day coastline [1,4,56].
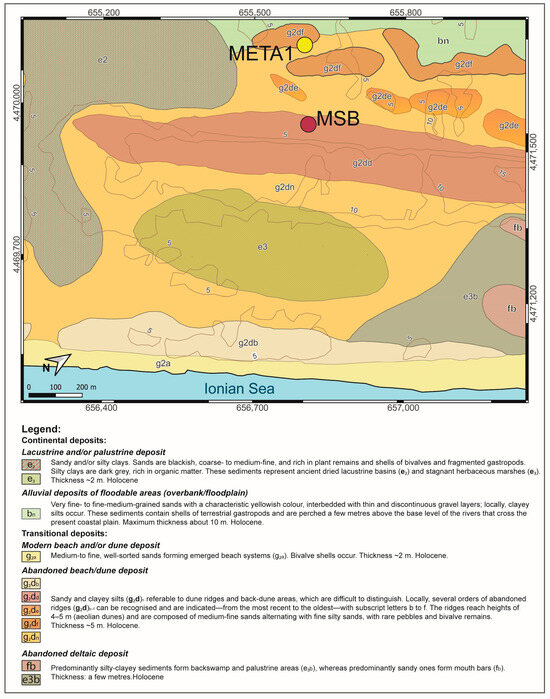
Figure 2.
Geological–geomorphological map of the Metaponto coastal plain showing the distribution of Late Pleistocene–Holocene surficial units (mod. after [48]). The locations of the two boreholes discussed in the text are indicated: META 1 (yellow) and MSB (purple). Contours interval: 5 m.
3. Materials and Methods
A 22 m deep borehole was drilled by SOLGEOTEK s.r.l. using a Beretta T44 crawler drilling rig equipped with a simple core barrel (101/113 mm diameter and 3 m length). To preserve the original sedimentary structures, dry drilling was carried out (i.e., without circulation of water). The borehole is located in the Metaponto area (Bernalda municipality, Southern Italy) 2 m above sea level with coordinates 40°22′30.1105′′ N 16°50′00.9126′′ E (WGS84), 1.1 km inland from the present-day coastline (Figure 2).
Macroscopic sediment characteristics were recorded through visual description. For coarser fractions, granule and pebble-sized clasts were measured directly with a calliper. The sand grain size was determined following standard sedimentological procedures [81] using visual comparison charts, including the American/Canadian Stratigraphic Comparator and the British Petroleum Sedimentology Branch Comparator. These charts were also employed to assess roundness, sphericity, and sorting. Sediment colour was classified using the Munsell Color System [82], and unit thicknesses were recorded following the criteria outlined in [83]. The sample interval was 10 cm from the top to the base of the borehole. Macrofaunal remains (bivalves, gastropods, and echinoderms) and plant fragments were systematically noted during logging, but no taxonomic or quantitative paleoecological analyses were performed.
In total, 42 sediment samples were collected, prepared, and analyzed using standard grain size techniques [84,85,86]. The methodology included wet sieving for the >63 μm fraction and the pipette method (based on Stokes’ law) for the silt and clay fractions (2–63 μm). Samples were oven-dried at 100 °C for 24 h; sub-samples (10–15 g) were treated in a solution with deionized water, oxalate, and 30% H2O2 to remove organic matter. After treatment, the samples were wet-sieved at 63 μm to separate sand from mud. The mud fraction was placed in a 1000 mL graduated cylinder with deionized water; silt and clay contents were determined based on settling times and depths corresponding to part icle sizes ranging from 63 μm to 2 μm. Each fraction was oven-dried and weighed to compute the relative proportions of sand, silt, and clay. The bulk sediment texture for each sample was classified using the ternary diagram in [87,88]. In this framework, grain size data are treated as one line of evidence among several (lithofacies, stratigraphic position, macrofossils, and organic remains) rather than as a stand-alone paleoenvironmental proxy. The use of Folk and Ward graphic parameters and grain size distributions follows established sedimentological practices, which continue to be widely adopted in both process-based and facies-based studies. Based on the grain size analyses, histograms, cumulative curves, and frequency distribution curves were produced [19,84]. In addition, cumulative curves (Q3 vs. grain size) were compared with the template families presented in [20]. In this study, Visher-type curve shapes are used as a qualitative supporting tool that complements Folk and Ward statistics and facies analysis; they are not treated as an automated classifier, and curve-based assignments are always cross-checked against the independent stratigraphic and sedimentological framework. In addition, graphic statistical parameters, mode, median, sorting, graphic skewness, and kurtosis were computed.
To complement these univariate statistics and the visual inspection of cumulative curves, we also applied a multivariate analysis to the full set of grain size distributions. The input matrix consists of 42 samples. The matrix was standardized to zero mean and unit variance and subjected to principal component analysis (PCA) using scikit-learn routines in Python 3.6.4. The first two principal components (PC1 and PC2) were retained for interpretation and clustering. A k-means algorithm (k = 2) was then applied to the standardized data to identify internally homogeneous groups of grain size distributions. The resulting clusters and PC scores were used to (i) conduct an objective check on the Visher-based curve classification and (ii) evaluate whether traction-dominated versus fine-tail-rich distributions form distinct families that correspond to specific facies and depositional units. All raw grain size data, Folk and Ward statistics, Visher curve family assignments, PCA loadings, and sample-level scores with k-means cluster membership are compiled in the Supplementary Material (S1).
Three samples were dated using Accelerator Mass Spectrometry (AMS) at Beta Analytic Inc., Miami, FL, USA. The “Conventional Radiocarbon Age” was calculated using the Libby half-life of 5568 yr, corrected for total isotopic fractionation, and used for calendar calibration where applicable. Ages are rounded to the nearest 10 yr and reported in radiocarbon years before present (BP), where “present” is AD 1950. Results exceeding the modern reference are expressed as percent modern carbon (pMC). The modern reference standard corresponds to 95% of the ^14C activity of NIST SRM-4990C (oxalic acid). The quoted uncertainties standard represents 1σ counting statistics; for conventional radiocarbon ages with calculated uncertainties < 30 yr BP, a minimum uncertainty of 30 yr BP is conservatively applied. δ13C values refer to the original sample material (not the AMS δ13C), while δ13C and δ15N values are reported relative to the VPDB standard. Calendar calibrations were performed with BetaCal v4.20 (HPD method; Beta Analytic, Miami, FL, USA) using the MARINE20 calibration curve.
4. Results
4.1. Stratigraphic Log with Radiometric Data
To reconstruct the temporal evolution of the sedimentary environments, the analysis of core samples from the Meta 1 borehole led to the identification of four stratigraphic depositional units (DUs) within which several depositional sub-units (DSs) were defined. These units, together with corresponding radiometric ages, are presented below through an analytical stratigraphic visual description and grain size analysis (Figure 3, Figure 4 and Figure 5).
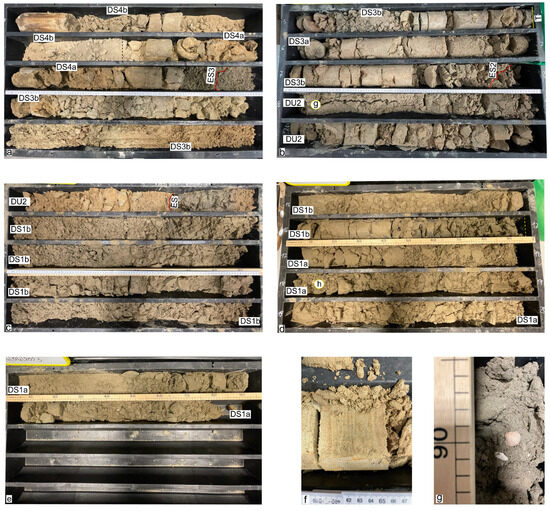
Figure 3.
Core photographs of the Meta 1 borehole showing the main depositional units and sub-units. (a) The upper part of the core (0–2.8 m): DS4b and DS4a of DU4 and DS3b, with the sharp erosional surface, ES3, highlighted. (b) The interval across DU3 and DU2, with DS3a–DS3b and the underlying lagoonal unit of DU2; ES2 and ES3 mark major bounding surfaces. (c,d) The middle and lower portions of DU2 and DU1b, showing stacked silty-sand and fine-sand beds with pervasive parallel lamination and scattered macrofossils. (e) The basal part of DU1a with thick fine-sand packages. (f) A core from DS3b illustrating internal lamination and soft-sediment deformation. (g) A close-up of sandy–silty facies with a shell fragment at ~9 m depth.
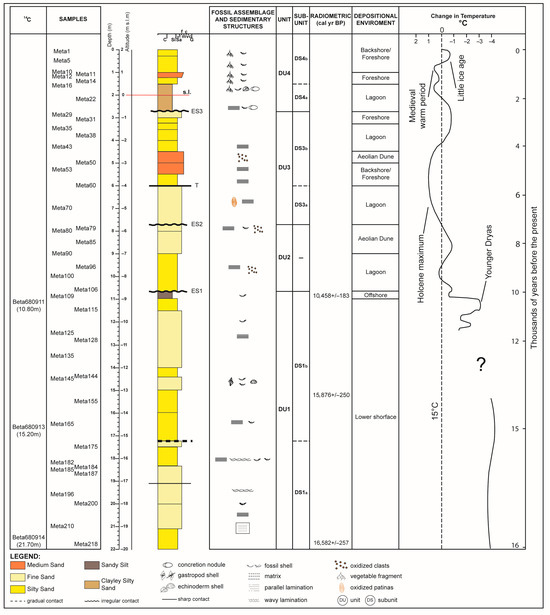
Figure 4.
Stratigraphic log and environmental interpretation of the Meta 1 borehole. From left to right: sampled ID and radiocarbon control, depth and elevation (m), lithology, fossil assemblages and sedimentary structures, depositional units (DU1–DU4) and sub-units (DS1a–DS4b), and interpreted depositional environments (offshore, lower shoreface, lagoon, aeolian dune, and foreshore–backshore). Major erosional contact within ES1–ES3 and the minor surface, T, mark erosional or flooding discontinuities separating the main stratigraphic units. Colours and symbols for the grain size and structures are shown in the legend. The right-hand column shows a schematic late glacial to Holocene temperature–anomaly curve (°C) plotted against time (thousands of years before the present), highlighting the main climatic phases (mod. after [89]).
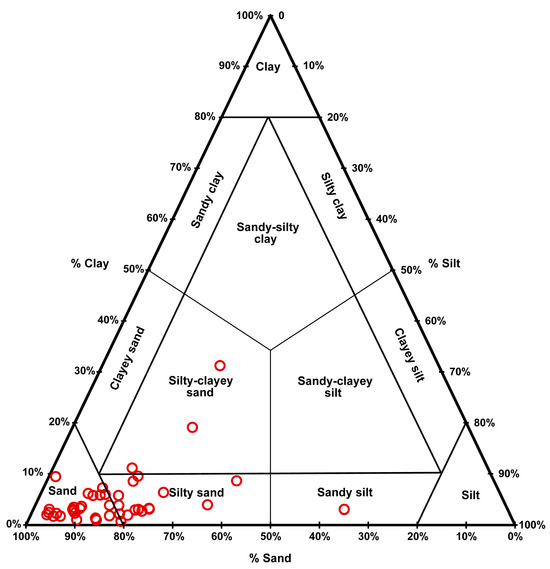
Figure 5.
Ternary diagram showing textural classification of Meta 1 samples in (red circles, [87]). Red circles plot sample compositions as percentages of sand, silt, and clay. Most samples cluster in sand and silty sand fields, with a few plotting toward sandy silt and silty–clayey sand, indicating overall sand-dominated textures with subordinate mud fractions.
From bottom to top, the depositional units are as follows:
Depositional Unit 1 (DU1): 2200–1062 cm
DU1 is subdivided into two depositional sub-units (DS1a and DS1b). The top is marked by irregular erosional contact (ES1), while the base coincides with the end of the borehole; the full thickness of DS1a is therefore undetermined.
- -
- DS1a (2200–1697 cm): The minimum recorded thickness is 480 cm, consisting of alternating sand, silt, and fine sand beds with parallel horizontal and cross-laminations. Complete and fragmented mollusc shells occur throughout. A radiocarbon age at 1217 cm yielded 16,582 ± 257 cal yr BP (Beta-680914_META1_217).
- -
- DS1b (1697–1062 cm): This sub-unit comprises a 615 cm succession of interbedded silty sand and fine sand with parallel horizontal laminations. Mollusc shells (bivalves and gastropods) are frequent; echinoderms are locally fragmented. At 1152 cm, the radiocarbon age is 15,876 ± 250 cal yr BP (Beta-680913_META1_152). A thin sandy silt layer (43 cm) containing bivalve shells overlies this bed and was dated to 10,458 ± 183 cal yr BP (Beta-680911_META1_108). The top of DS1b is marked by a sharp irregular contact (ES1).
Depositional Unit 2 (DU2): 1062–780 cm
DU2 is bounded above and below by sharp and irregular erosive contacts (ES2 and ES1). It consists of an upper part of a 121 cm bed of fine sand, underlain by a 161 cm bed of silty sand with parallel horizontal laminations and locally oxidized clasts.
Depositional Unit 3 (DU3): 780–280 cm
DU3 consists of two depositional sub-units (DS3a and DS3b) and is bounded by irregular erosional contacts at the top and base (ES2 and ES3).
- -
- DS3a (780–600 cm): This sub-unit comprises a 180 cm bed of fine sand with parallel horizontal lamination and oxidation patinas.
- -
- DS3b (600–280 cm): The basal portion comprises a 40 cm bed of silty sand with parallel horizontal lamination, overlain by two beds of medium sand with a total thickness of 100 cm. The lower medium-sand bed shows parallel horizontal lamination, whereas the upper bed contains oxidized clasts and horizontal lamination. Above, several silty sand beds (cumulative thickness 160 cm) occur, some with parallel horizontal laminations; the interval is capped by a 20 cm bed of fine sand. The base of DS3b is marked by a sharp, horizontal minor erosional surface (T).
Depositional Unit 4 (DU4): 280–0 cm
DU4 comprises two sub-units (DS4a and DS4b).
DS4a (280–145 cm): This sub-unit comprises silty, clayey sand overlying DS4b.
- -
- DS4b (145–0 cm): This sub-unit demonstrates upward gradation from silty clay at the base to sandy silt. At a 100 cm depth, a 20 cm thick bed exhibits inverse grading from silt to medium sand.
Both DS4a and DS4b locally contain fragmented mollusc shells. Roots, leaves, calcareous concretions, and nodules observed from sea level to the top of the core are interpreted as evidence of present-day pedogenesis.
4.2. Statistical Parameters
Sample-level parameters (in φ) show coherent trends throughout the core [16]. The mean grain size (Mz) predominantly lies within the very fine–fine sand range, with localized excursions toward coarser silt where muddy fractions increase. Sorting (σᵢ) is mostly poor to moderate, consistent with the alternation between traction-dominated, sand-rich intervals with substantial suspension load input. Skewness (Skᵢ) is generally positive (fine-skewed), indicating persistent fine tails, whereas negative skewness is rare and confined to horizons showing a subtle coarse shoulder. Kurtosis (KG) ranges from mesokurtic to strongly leptokurtic, with the latter developing where narrow sand modes are reinforced by elevated fines. Median and mean values are mutually consistent with shallow marine to marginal marine sand–silt mixtures, indicating repetitive alternation of traction and settling processes [19]. The complete set of sample statistics is reported in Supplementary Table S1.
4.3. Relationship Between Grain Size Parameters
Relationships among parameters conform to expected granulo-dynamic trends. Coarser means (lower φ) tend to exhibit better sorting (lower σᵢ), consistent with selective winnowing and tractional reworking; conversely, finer means (higher φ) correlate with poorer sorting and more prominent fine tails. Positive skewness co-occurs with long fine tails and concave-up sand–silt transitions in the cumulative curves, whereas local negative skewness marks subtle coarse shoulder development. Kurtosis increases from mesokurtic to leptokurtic in intervals characterized by narrow, traction-dominated sand modes and/or strengthened fines. Collectively, these co-variations indicate that the relative weighting of tractional transport versus suspension fallout exerts a first-order control, with not only central tendency but also on the tails and peakedness of the grain size distributions.
4.4. Visher Model
Cumulative curves (Q3, percent passing vs. grain size in mm) were compared with the template families proposed in [20] and cross-checked against the independent stratigraphic and sedimentological framework of the core. Twenty-nine samples were assigned to environments by best-fit to Visher-type curve families. Within this retained set, three families dominate: (i) lagoonal, with long fine tails and concave-up sand–silt transitions; (ii) aeolian/beach (traction-dominated), with sharp sand-mode segments and attenuated fine tails; and (iii) transitional to offshore, occupying intermediate positions with subdued coarse shoulders but persistent fine tails. These families are vertically organized along the unit/sub-unit hierarchy, reinforcing the internal consistency between curve morphology and stratigraphic architecture.
Retained classifications and qualitative curve criteria are summarized in Table 1, whereas sample-level Folk and Ward statistics and RMSE values used for curve fitting are reported in Supplementary Material S1.

Table 1.
Retained samples (n = 29) classified according to Visher-type cumulative curve families, with qualitative curve criteria, indicative Folk and Ward parameter ranges (φ), and [87] textural classes. Sample statistics and RMSE values used for curve fitting are reported in Supplementary Material S1.
4.5. Multivariate Analysis (PCA and k-Means Clustering)
To complement the qualitative Visher-based classification, principal component analysis (PCA) was applied to the full set of 42 grain size distributions (retained percentages in 15 grain size classes between 1.4 and 0.002 mm). The first two principal components explain 36.6% and 16.1% of the total variance, respectively, and capture the main contrast between sand-dominated and mud-enriched distributions (PC1) and secondary variation within the sand fraction (PC2), mainly reflecting the balance between medium- and fine-sand modes and the development of fine tails.
k-means clustering (k = 2, defined from the elbow criterion in the within-cluster sum of squares), performed in the PC1–PC2 space, separates a sand-dominated cluster with relatively narrow sand modes and attenuated fine tails (Cluster 0, “sand facies”, SF) from a mud-enriched cluster with broader modes and more pronounced fine tails (Cluster 1, “mud-enriched facies”, MF). Positive PC1 scores and membership in Cluster 0 therefore characterize traction-dominated, sand-rich samples, whereas negative PC1 scores and Cluster 1 membership mark intervals with a stronger suspension load component.
When Visher curve families are projected onto the PCA plane, all aeolian dune/beach samples systematically fall within Cluster 0 (SF), whereas all transitional → offshore and offshore fine samples belong to Cluster 1 (MF). Lagoonal and lagoon–transitional samples are split between the two clusters: mud-rich, inner-lagoon examples are plotted in Cluster 1, while sandier, fine-tail-dominated lagoonal curves—consistent with marginal lagoon settings—are assigned to Cluster 0. Thus, the multivariate structure of the grain size data independently reproduces the main process-based families inferred from cumulative curve morphology and facies analysis.
In this sense, the k-means clusters behave as granulometric end members rather than as rigid depositional facies classes: Cluster 0 isolates well-sorted, sand-dominated units, while Cluster 1 groups more poorly sorted, mud-enriched intervals. In the upper part of the core (DU3–DU4), where lagoonal, back-barrier and beach/dune facies are interbedded and locally pedogenized, some mismatches between Visher-based environments and cluster membership reflect this difference in focus: unsupervised clustering responds solely to bulk grain size structure and cannot distinguish facies with overlapping textures but distinct stratigraphic positions and sedimentary structures. Integrated results—PC1–PC2 scores, cluster labels, and facies/environmental assignments for each sample—are summarized in Table 2, while the full PCA output (including grain size loadings) is provided in Supplementary Material S1.
Table 2.
Principal component (PC1 and PC2) scores, k-means cluster membership, PCA-based granulometric facies (SF = sand facies; MF = mud-enriched facies), and corresponding Visher environments for the 42 Meta 1 samples. PCA/cluster results are derived from retained percentages in 15 grain size classes between 1.4 and 0.002 mm; full PCA loadings and numerical outputs are reported in Supplementary Material S1.
4.6. Unit-by-Unit Synthesis
When Visher curve families (Table 1) and PCA/k-means clusters (Table 2) are projected back onto the stratigraphic framework of Meta 1 (Figure 4), a coherent vertical organization of environments emerges. The basal DU1 is dominated by transitional–offshore signatures, DU2 marks the onset of lower-shoreface to foreshore and aeolian dune conditions, DU3 records the alternation between lagoonal infill and aeolian/beach reworking, and DU4 is characterized by back-barrier, lagoonal, and pedogenized near-surface deposits.
- DU1 (2200–1062 cm): Grain size statistics, long fine tails, and the dominance of transitional–offshore Visher families indicate offshore to lower shoreface conditions during the Late Glacial. PCA places these samples mainly in Cluster 1 (negative PC1), consistent with relatively mud-rich, suspension-influenced sand–silt mixtures. Radiocarbon ages between ~16.6 and 10.5 kyr BP bracket this offshore to lower-shoreface setting during the Last Glacial–interglacial transition.
- DU2 (1062–780 cm): The sharp, sand-dominated succession with improved sorting and reduced mud content marks a shift to higher-energy, tractional conditions, compatible with foreshore to upper-shoreface and aeolian dune facies. Grain size distributions mainly fall in Cluster 0 and are plotted at positive PC1 values, reflecting well-developed sand modes and attenuated fine tails.
- • DU3 (780–280 cm): Alternations of medium sand and silty sand, together with repeated lagoonal and transitional Visher families, indicate a stacked set of aeolian dune facies. PCA/cluster analysis shows an interbedding of Cluster 0 and Cluster 1 samples, reflecting the vertical alternation between traction-dominated sand bodies and finer, tail-rich intervals. This organization is consistent with repeated shifts between lagoonal infill and aeolian/beach reworking.
- • DU4 (280–0 cm): The upward transition from lagoonal silty clay and sandy silt (Cluster 1; negative PC1, long fine tails) to sandier deposits with local tractional beds (Cluster 0) records the final stages of lagoonal infill and subsequent emergence of the plain. Residual sand lenses preserve the imprint of shallow-marine or beach reworking predating stabilization, whereas roots, calcareous nodules, and other soil features reflect ongoing pedogenesis under present subaerial conditions.
Overall, stratigraphic stacking from transitional–offshore settings (DU1) through increasingly proximal shoreface, aeolian dune, and lagoonal facies (DU2–DU4), as independently supported by both Visher curve families and PCA-based clusters, documents the late Pleistocene to Holocene evolution of the Metaponto coastal system from offshore settings to an emerged coastal plain.
5. Discussion
5.1. Global Sea Level Change
The sea level changes globally over time but also exhibits regional trending from the global signal. The curve in Figure 6 illustrates global sea level rise relative to the present over the past 20,000 years, from the Last Glacial Maximum (LGM) to today [89]. During the LGM (20–15 kyr BP), the sea level was approximately 100–120 m below the present level due to water stored in continental ice sheets. The post-glacial transgression includes the rapid meltwater pulse MWP-1A (~14.6 kyr BP; ~20 m within a few centuries), followed by the Younger Dryas (~12.9–11.7 kyr BP), during which sea level rise continued at a reduced rate, MWP-1B (~11.5 kyr BP, smaller amplitude than MWP-1A), with a temporary slowdown near 8.2 kyr BP. A final acceleration (MWP-1C, ~8–7.5 kyr BP) precedes stabilization near modern levels after 4 kyr BP, with minor regional fluctuations driven by climatic or tectonic factors. The most recent portion of the curve shows renewed acceleration linked to modern global warming driven by greenhouse gas emissions and contemporary ice melt (20th-century warming).
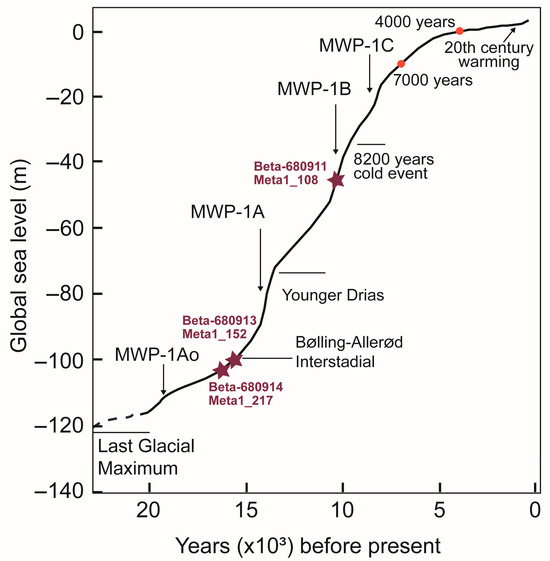
Figure 6.
Global eustatic sea level curve for the past ~21 kyr and placement of Meta 1 ages (mod. after [90]). Reconstructed global sea level (m relative to present) from the Last Glacial Maximum to the present, highlighting meltwater pulse events MWP-1A0/1A/1B/1C, the Bølling–Allerød interstadial, the Younger Dryas, the 8.2 kyr cold event, and Late Holocene stabilization with a modern rise. Purple stars mark calibrated radiocarbon ages from the Meta 1 core: Beta-680914 (16582+/−257 cal yr BP; Meta1_217), Beta-680913 (15876+/−250 cal yr BP; Meta1_152), and Beta−680911 (10458+/−183 cal yr BP; Meta1_108).
5.2. Paleoenvironmental Evolution of the Metaponto Area from ~16 kyr to the Present: Evidence from the Meta 1 Borehole
The vertical stacking of lithofacies, bounding erosional surfaces (ES1–ES3), bedding structures, and grain size statistics in Meta 1 delineate a three-stage environmental evolution. This trajectory is primarily constrained by the stratigraphic log and radiocarbon ages, and is supported, but non dictated, by grain size metrics, Visher families (Table 1), and PCA/k-means clustering (Table 2).
Phase I—Transgressive deepening and offshore accommodation (DU1, ~16–10 kyr BP).
The lower part of core records a non-linear deepening from transitional to offshore conditions (DS1a-DS1b). Thick intervals of fine sand interbedded with silty sand, pervasive parallel laminations, and abundant marine macrofissils (whole/fragmented bivalves and gastropods; echinoderms) indicate lower-shoreface to offshore settings under sustained suspension fallout. Visher-based classifications are dominated by transitional–offshore and offshore-fine families (Table 1), characterized by long fine tails and subdued coarse shoulders, while PCA/k-means assigns most DU1 samples to the mud-rich Cluster 1 (Table 2), consistent with fine-tail-dominated, poorly to moderately sorted sand–silt mixtures. Radiocarbon ages between ~16.6 and 10.5 kyr BP bracket this lower-shoreface-to-offshore setting during the Late Glacial–Early Holocene transition. The irregular surface at ES1 capping DU1 indicates a break in accommodation and/or sediment supply.
Phase II—Back-barrier infill and episodic emergence (DU2).
Above ES1, DU2 records the establishment of a back-barrier system. At the base, silty sand beds with parallel laminations, elevated mud content, and bioclastic fragments are compatible with lagoonal conditions. Up-section, medium- to fine-sand beds with improved sorting, oxidized clasts, and cross/parallel laminations document upper-shoreface to foreshore sands and the development of coastal dunes. In grain size terms, these traction-dominated sands show sharper sand modes, attenuated fine tails, and better sorting than the underlying offshore-prone units. Consistently, many DU2 samples fall in the sand-dominated Cluster 0 (Table 2), while Visher families shift toward aeolian/beach types with reduced fine tails (Table 1). Oxidation patinas and the sharp, irregular upper contact support the interpretation of episodic emergence and partial reworking of the coastal wedge.
Phase III—Shoreline oscillations and progradation (DU3–DU4).
At the base of DU3, an 18 cm thick DS3a bed of fine sand with parallel lamination and oxidized patinas indicates lagoonal deposition, bounded at the top by a surface (T), indicating minor erosion during a landward coastline shift (minor sea level oscillation). Above (DS3b), two medium-sand beds—with the upper containing oxidized clasts—record a shift from emerged beach to aeolian dune environments. The upper DS3b reflects a lagoonal setting, grading in its upper 20 cm into beach deposits. The DS3b upper boundary is the sharp irregular surface, ES3. At the base of DU4, the DS4a sub-unit consists of lagoonal sediments (parallel lamination and fragmented bivalves) and grades upward into beach sand (DS4b), culminating at the modern topographic surface, marking coastal progradation to its present position. In these upper units, Visher families alternate between lagoonal and aeolian/beach types (Table 1), while PCA/k-means reveals an interbedding of mud-rich Cluster 1 and sand-dominated Cluster 0 samples (Table 2). This pattern reflects the vertical alternation between fine-tail-dominated lagoonal intervals and tractional sand bodies but also highlights that different facies (e.g., lagoonal sand vs. foreshore sand) can share similar bulk grain size structures and thus be grouped within the same cluster.
The three-phase trajectory inferred from lithofacies, erosional surfaces, and grain size statistics is consistent with the multivariate structure of the dataset: mud-enriched (MF, Cluster 1) samples dominate the lower, transitional–offshore portion of the core (DU1), whereas sand facies (SF, Cluster 0) samples become increasingly common upwards, in correspondence with foreshore, beach–dune and marginal-lagoon facies in the DU2–DU4 region (Table 2). Lagoonal samples split between the two clusters, reflecting the natural spectrum from mud-rich, inner-lagoon conditions to sandier, marginal-lagoon settings.
5.3. Stratigraphic Correlation Between Meta 1 and MSB Boreholes
The Meta 1 borehole is located 300 m inland from the MSB borehole [4]; MSB is approximately 850 m from the present-day shoreline and landward of the modern dune–beach system (Figure 2). Elevations are 2 m a.s.l. (Meta 1) and 3 m a.s.l. (MSB).
A multidisciplinary study on MSB samples integrated stratigraphy, paleoecology, and geomorphology [4]; one AMS ^14C date was obtained on bulk sediment. Sample LTL14789A (fine–medium sand at ~8 m from the top of the MSB borehole; ~6 m b.s.l.) yielded 3742 ± 45 yr BP, consistent with a meso/supralittoral context and thus interpreted as emerged beach [4].
When placing the four Meta 1 units and sub-units into a chronostratigraphic framework and correlating them with MSB (Figure 7), it is suggested that the two medium-sand beds at the base of DS3a (~4 m b.s.l.; total thickness ~1 m) represent a beach deposit overlain by an aeolian dune bed. This aeolian dune bed is tentatively correlated to the dated MSB sand (~3.74 kyr BP approximately 4 kyr), both representing emerged beach/dune deposits along the same coastal tract (see the ecological analysis in [4]). Although this correlation rests on a single radiocarbon tie-point and the similarity of facies, it is consistent with the observed beach–dune stacking in Meta 1 and with the present-day position of the dune–beach belt.
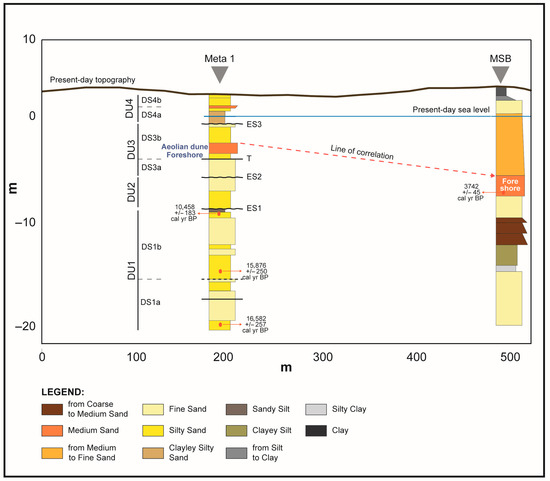
Figure 7.
Schematic correlation between the Meta 1 and MSB boreholes along a short coastal transect in the Metaponto plain. Lithofacies are grouped into main environmental categories (offshore/transitional, shoreface–beach, aeolian dune, lagoonal–back-barrier; colours are the same as in Figure 4). The positions of the three ^14C ages in Meta 1 and the single ^14C age in MSB are shown with their depths below the present sea level. The dashed red line highlights a tentative correlation between the beach–aeolian dune couplet at the base of DU3 in Meta 1 (around −4 m b.s.l.) and the emerged-beach sand dated at 3742 ± 45 yr BP in MSB, both located landward of the modern dune–beach belt. This first-order, facies-based correlation constrains the Late Holocene shoreline position but remains limited by sparse chronological control.
The combined log evidence therefore supports a vertically stacked beach–aeolian dune system, comparable with modern analogues in coastal settings, while also highlighting that the Late Holocene chronology remains anchored to one external age constraint and should be treated accordingly.
5.4. Sea Level Change and Tectonic Interplay
The relative sea level at specific localities reflects the combined effects of tectonic uplift/subsidence and glacio-eustatic forcing. The tectonic component typically varies irregularly in space and time and is less predictable than the climate-driven component.
The Metaponto coastal plain (Figure 1) lies within the Bradanic Trough, the foredeep of the Southern Apennines. Regional post-orogenic uplift has affected the area since the Middle Pleistocene [37,57,58], with rates commonly estimated at ~1 mm/yr [51], although a higher rate of ~4 mm/yr for the Pleistocene–Holocene was proposed [4]. The interaction between uplift and eustatic fluctuations produced a staircase of marine terraces from ~380 m to ~10 m a.s.l.
Depth–age pairs in DU1, when compared with the global eustatic curve (Figure 6), imply significant vertical motions:
- -
- At 17 kyr BP, transitional–offshore deposits are observed at −19 m b.s.l., while the global sea level stood at ~−100 m, implying that an ~81 m offset difference suggests an apparent uplift component on the order of ~4 mm/yr (consistent with [39]).
- -
- At ~16 kyr BP, transitional–offshore deposits are observed at −12 m b.s.l., corresponding to a global sea level of ~−105 m, implying that an offset of ~93 m likewise supports apparent uplift near ~4 mm/yr.
- -
- At ~10 kyr BP, offshore deposits are observed at −9 m b.s.l. and coincide with a global sea level of ~−40 m, implying that an offset of ~31 m difference suggests ongoing uplift near ~4 mm/yr.
If interpreted purely as tectonic uplift relative to a rigid eustatic baseline, these offsets correspond to apparent uplift components on the order of a few mm/yr (first-order ~4 mm/yr), consistent with estimate rates for this sector [38].
The 10 kyr BP age occurs near the top of DS1b, just below an erosional unconformity (ES1) that marks the onset of transitional conditions.
However, these estimates are derived without applying glacio-hydro-isostatic corrections or using formal sea-level index points and therefore represent maximum possible values rather than precise uplift rates.
In the Late Holocene, the correlation with MSB places an equivalent level in Meta 1 at ~4 m below ground (~−4 m b.s.l.), while the global sea level stood near +1 m relative to the present. This ~5 m offset implies a net subsidence component on the order of ~1 mm/yr. Following the interpretation proposed for the Metaponto plain in [4], sediment compaction is a plausible contributor to this offset, particularly given the presence of fine-grained lagoonal/back-barrier intervals in DU3–DU4. However, we present no independent lithological or geotechnical proxy (e.g., porosity/water-content profiles, oedometer tests, or other consolidation data) to quantify compaction at Meta 1; therefore, the compaction contribution should be regarded as an inference rather than a resolved interpretation. Finally, the global sea level curve indicates a transition to more stable sea levels at about 7 kyr BP and from approximately 4000 years ago onward (Holocene stability), with sea level approaching present-day values. According to the correlation, the aeolian dune in DU3 is dated to ~4 kyr BP, while the aeolian dune of DU2 is hypothetically related to the ~7 kyr stability around −5 m b.s.l. This first-order correspondence is broadly consistent with the global sea level curve. Taken together, these relationships support a working scenario in which net uplift diminished by mid-Holocene time and subsequent relative sea-level behaviour reflects a combination of minor tectonic trends and compactional subsidence.
Taken together, depth–age offsets and comparison with the global curve are consistent with significant uplift during the Late Glacial–Early Holocene, followed by near-stable relative sea level and then the onset of net subsidence in the Late Holocene. Nonetheless, the small number of radiocarbon ages, the reliance on a global eustatic template, and the absence of explicit glacio-hydro-isostatic and compaction modelling mean that these values should be regarded as indicative ranges. A complete separation between tectonic and compactional contributions cannot yet be achieved. In particular, the hypothesis of a sharp transition from regional uplift to subsidence near ~7 kyr BP should be considered a working scenario rather than a definitive conclusion: continued minor tectonic subsidence in the Late Holocene cannot be excluded, and both tectonics and compaction may have contributed to the observed behaviour.
At the scale of the Metaponto–Gulf of Taranto coastal sector, the three-stage evolution inferred from Meta 1 (Late Glacial offshore accommodation, mid-Holocene back-barrier infill/episodic emergence, and Late-Holocene progradation) is consistent with regional syntheses based on geomorphology, boreholes, and coastal-terrace datasets, which document LGM incision followed by rapid post-glacial transgression and Holocene beach-ridge development and progradation [1,4,8,24,25,26].
Comparable mid- to Late-Holocene patterns—deceleration of relative sea-level rise, establishment of back-barrier environments, and widespread coastal progradation—have also been documented at the Italian scale in other coastal plains of southern and central Italy using multiproxy stratigraphic frameworks [12,15,16,91,92,93]. Beyond Italy, similar trajectories have been described across several Mediterranean coastal plains, deltas, and lagoonal systems, highlighting the combined role of relative sea level, sediment supply, and local subsidence/compaction [94,95,96,97].
Within this uncertainty, the multivariate grain size analysis (PCA and k-means clustering) does not provide direct quantitative constraints on vertical land motion but supports the existence of two main textural end members—offshore/lagoonal and mud-rich deposits versus sand-dominated coastal wedges—that are consistent with a shift from deep-marine accommodation in the Late Glacial to shallow-marine and back-barrier settings in the Holocene. This reinforces the interpretation that the Meta 1 record captures the combined imprint of glacio-eustatic sea level rise, differential uplift/subsidence, and compaction within the Metaponto coastal plain.
5.5. Limitations and Future Research
Although macrofossils were recorded during logging, no quantitative paleoecological analyses were performed on Meta 1. A key avenue for future research is to integrate microfaunal (foraminifera, ostracods) and molluscan assemblage analyses with additional radiocarbon dates to provide independent constraints on water depth, salinity, and depositional energy across DU1–DU4, thereby testing and refining the lithofacies and grain size based environmental interpretation presented here. In addition, collecting basic porosity/consolidation data for the mud-rich lagoonal intervals would help quantify any compactional component and better partition tectonic versus compaction-driven vertical land motion.
In summary, the interpretation of the Meta 1 core suggests that
- A phase of net tectonic uplift likely persisted at least until ~7 kyr BP, with the relative sea level approaching a quasi-steady position around −5 m b.s.l. (as inferred from the DU2 aeolian-dune deposits at Meta 1).
- After ~7 kyr BP, the system appears to have entered a phase of modest net subsidence on the order of ~1 mm/yr, for which a compaction contribution is plausible but unquantified, as indicated by the relationship between the Meta 1 aeolian dune deposits in DS3b and the dated emerged-beach sands in the MSB core ~4 m below the present sea level [4].
Supplementary Materials
The following supporting information can be downloaded at: https://www.mdpi.com/article/10.3390/geosciences16010005/s1, Supplementary Material (S1): Excel workbook containing sample metadata, grain-size data (raw and cumulative), derived statistics, Visher fitting results, multivariate outputs (PCA and k-means), and QA/QC information for the Meta 1 core.
Author Contributions
Conceptualization, A.M. and M.R.S.; methodology, A.M. and M.R.S.; software, A.M.; validation, A.M. and M.R.S.; formal analysis, A.M.; investigation, A.M. and M.R.S.; resources, M.R.S.; data curation, A.M.; writing—original draft preparation, A.M., M.R.S.; writing—review and editing, A.M. and M.R.S.; visualization, A.M.; supervision, M.R.S.; project administration, M.R.S.; funding acquisition, M.R.S. All authors have read and agreed to the published version of the manuscript.
Funding
The project was supported by the PON “GeoArchaeo” Project (PON “R&I”–2014/2020–Code: ARS01_01249–CUP: B89C20000880005). Scientific Coordinator: Prof. M.R. Senatore.
Data Availability Statement
No new data were created or analyzed in this study. Data sharing is not applicable to this article.
Acknowledgments
The authors express their sincere gratitude to the Guest Editors of the Special Issue “Sedimentology and Stratigraphy” and to the anonymous reviewers for their constructive comments and insightful suggestions, which significantly improved the quality of this manuscript. The authors have reviewed and edited the output and take full responsibility for the content of this publication.
Conflicts of Interest
The authors declare no conflicts of interest.
References
- Pescatore, T.; Pieri, P.; Sabato, L.; Senatore, M.R.; Gallicchio, S.; Boscaino, M.; Cilumbriello, A.; Quarantiello, R.; Capretto, G. Stratigrafia dei depositi pleistocenico-olocenici dell’area costiera di Metaponto compresa fra Marina di Ginosa ed il Torrente Cavone (Italia meridionale): Carta geologica in scala 1: 25.000. Alp. Mediterr. Quat. 2009, 22, 307–324. [Google Scholar]
- Caputo, R.; Bianca, M.; D’Onofrio, R. Ionian marine terraces of southern Italy: Insights for the quaternary geodynamic evolution of the area. Tectonics 2010, 29, TC4005. [Google Scholar] [CrossRef]
- Gioia, D.; Bavusi, M.; Di Leo, P.; Giammatteo, T.; Schiattarella, M. Geoarchaeology and geomorphology of the Metaponto area, Ionian coastal belt, Italy. J. Maps 2020, 16, 117–125. [Google Scholar] [CrossRef]
- Corrado, G.; Aiello, G.; Barra, D.; Di Leo, P.; Gioia, D.; Amodio Antonio, M.; Parisi, R.; Schiattarella, M. Late Quaternary evolution of the Metaponto coastal plain, southern Italy, inferred from geomorphological and borehole data. Quat. Int. 2022, 638–639, 84–110. [Google Scholar] [CrossRef]
- Gioia, D.; Schiattarella, M.; Giano, S.I. Right-Angle Pattern of Minor Fluvial Networks from the Ionian Terraced Belt, Southern Italy: Passive Structural Control or Foreland Bending? Geosciences 2018, 8, 331. [Google Scholar] [CrossRef]
- Sauer, D.; Wagner, S.; Brückner, H.; Scarciglia, F.; Mastronuzzi, G.; Stahr, K. Soil development on marine terraces near Metaponto (Gulf of Taranto, southern Italy). Quat. Int. 2010, 222, 48–63. [Google Scholar] [CrossRef]
- Gioia, D.; Corrado, G.; Amodio, A.M.; Schiattarella, M. Uplift rate calculation based on the comparison between marine terrace data and river profile analysis: A morphotectonic insight from the Ionian coastal belt of Basilicata, Italy. Geomorphology 2024, 447, 109030. [Google Scholar] [CrossRef]
- Tropeano, M.; Cilumbriello, A.; Sabato, L.; Gallicchio, S.; Grippa, A.; Longhitano, S.G.; Bianca, M.; Gallipoli, M.R.; Mucciarelli, M.; Spilotro, G. Surface and subsurface of the Metaponto coastal plain (Gulf of Taranto-southern Italy): Present- day- vs LGM-landscape. Geomorphology 2013, 203, 115–131. [Google Scholar] [CrossRef]
- Di Leo, P.; Bavusi, M.; Corrado, G.; Danese, M.; Giammatteo, T.; Gioia, D.; Schiattarella, M. Ancient settlement dynamics and predictive archaeological models for the Metapontum coastal area in Basilicata, southern Italy: From geomorphological survey to spatial analysis. J. Coast. Conserv. 2018, 22, 865–877. [Google Scholar] [CrossRef]
- Abate, D.; De Pippo, T.; Ilardi, M.; Pennetta, M. Studio delle caratteristiche morfoevolutive quaternarie della piana del Garigliano. Alp. Mediterr. Quat. 1998, 11, 149–158. [Google Scholar]
- Aiello, G.; Barra, D.; De Pippo, T.; Donadio, C.; Miele, P.; Russo Ermolli, E. Morphological and paleoenvironmental evolution of the Vendicio coastal plain in the Holocene (Latium, Central Italy). Alp. Mediterr. Quat. 2007, 20, 185–194. [Google Scholar]
- Aiello, G.; Amato, V.; Aucelli, P.P.C.; Barra, D.; Corrado, G.; Di Leo, P.; Di Lorenzo, H.; Jicha, B.; Pappone, G.; Parisi, R.; et al. Multiproxy study of cores from the Garigliano plain: An insight into the late quaternary coastal evolution of central-southern Italy. Palaeogeogr. Palaeoclimatol. Palaeoecol. 2021, 567, 110298. [Google Scholar] [CrossRef]
- Aiello, G.; Barra, D.; Parisi, R.; Arienzo, M.; Donadio, C.; Ferrara, L.; Toscanesi, M.; Trifuoggi, M. Infralittoral Ostracoda and benthic foraminifera of the Gulf of Pozzuoli (Tyrrhenian sea, Italy). Aquat. Ecol. 2021, 55, 955–998. [Google Scholar] [CrossRef]
- Amore, F.O.; Argenio, C.; Faranda, C.; Ferraro, L.; Gliozzi, E.; Magri, D.; Michelangeli, M.; Russo, B.; Siciliano, J.; Vallefuoco, M.; et al. Sedimentological and biostratigraphic reconstruction of the Early Pleistocene San Giuliano Lake section (Matera, Southern Italy). Quat. Int. 2025, 730, 109793. [Google Scholar] [CrossRef]
- Barra, D.; Romano, P.; Santo, A.; Campajola, L.; Roca, V.; Tuniz, C. The Versilian transgression in the Volturno River Plain (Campania, southern Italy): Palaeoenvironmental history and chronological data. Alp. Mediterr. Quat. 1996, 9, 445–458. [Google Scholar]
- Barra, D.; Calderoni, G.; Cinque, A.; De Vita, P.; Rosskopf, C.M.; Russo Ermolli, E. New data on the evolution of the Sele river coastal plain (southern Italy) during the Holocene. Alp. Mediterr. Quat. 1998, 11, 287–299. [Google Scholar]
- Cilumbriello, A.; Sabato, L.; Tropeano, M.; Gallicchio, S.; Grippa, A.; Maiorano, P.; Mateu-Vicens, G.; Rossi, C.A.; Spilotro, G.; Calcagnile, L.; et al. Sedimentology, stratigraphic architecture and preliminary hydrostratigraphy of the Metaponto coastal-plain subsurface (Southern Italy). Mem. Descr. Carta Geol. D’italia 2010, 90, 67–84. [Google Scholar]
- Marturano, A.; Aiello, G.; Barra, D. Evidence for late Pleistocene uplift at the Somma-Vesuvius apron near Pompeii. J. Volcanol. Geoth. Res. 2011, 202, 211–227. [Google Scholar] [CrossRef]
- Folk, R.L.; Ward, W.C. A Study in the Significance of Grain-Size Parameters. J. Sediment. Petrol. 1957, 27, 3–26. [Google Scholar] [CrossRef]
- Visher, G.S. Grain-Size Distribution and Depositional Processes. J. Sediment. Petrol. 1969, 39, 1074–1106. [Google Scholar]
- Ferranti, L.; Antonioli, F.; Scicchitano, G.; Spampinato, C.R. Uplifted Late Holocene shorelines along the coasts of the Calabrian Arc: Geodynamic and seismotectonic implications. Ital. J. Geosci. 2017, 136, 454–470. [Google Scholar] [CrossRef]
- Santoro, E.; Mazzella, M.E.; Ferranti, L.; Randisi, A.; Napolitano, E.; Rittner, S.; Radtke, U. Raised coastal terraces along the Ionian Sea coast of northern Calabria, Italy, suggest space and time variability of tectonic uplift rates. Quat. Int. 2009, 206, 78–101. [Google Scholar] [CrossRef]
- Santoro, E.; Ferranti, L.; Burrato, P.; Mazzella, M.E.; Monaco, C. Deformed Pleistocene marine terraces along the Ionian Sea margin of southern Italy: Unveiling blind fault-related folds contribution to coastal uplift. Tectonics 2013, 32, 737–762. [Google Scholar] [CrossRef]
- Scardino, G.; Sabatier, F.; Scicchitano, G.; Piscitelli, A.; Milella, M.; Vecchio, A.; Anzidei, M.; Mastronuzzi, G. Sea-level rise and shoreline changes along an open sandy coast: Case study of Gulf of Taranto, Italy. Water 2020, 12, 1414. [Google Scholar] [CrossRef]
- De Santis, V.; Caldara, M.; Torres, T.; Ortiz, J.E.; Sánchez-Palencia, Y. The Role of Beach Ridges, Spits, or Barriers in Understanding Marine Terraces Processes on Loose or Semiconsolidated Substrates: Insights from the Givoni of the Gulf of Taranto (Southern Italy). Geol. J. 2019, 55, 2951–2975. [Google Scholar] [CrossRef]
- De Santis, V.; Scardino, G.; Meschis, M.; Ortiz, J.E.; Sánchez-Palencia, Y.; Caldara, M. Refining the Middle-Late Pleistocene Chronology of Marine Terraces and Uplift History in a Sector of the Apulian Foreland (Southern Italy) by Applying a Synchronous Correlation Technique and Amino Acid Racemization to Patella spp. and Thetystrombus Latus. Ital. J. Geosci. 2021, 140, 438–463. [Google Scholar] [CrossRef]
- Pescatore, T.; Senatore, M.R. A Comparison between a Present-Day (Taranto Gulf) and a Miocene (Irpinian Basin) Foredeep of the Southern Apennines (Italy); John Wiley & Sons: Hoboken, NJ, USA, 1986; Volume 8, pp. 169–182. [Google Scholar] [CrossRef]
- Senatore, M.R.; Normark, W.R.; Pescatore, T.; Rossi, S. Structural framework of the Gulf of Taranto (Ionian Sea). Mem. Della Soc. A Geol. D’italia 1988, 41, 533–539. [Google Scholar]
- Chilovi, C.; De Feyter, A.J.; Pompucci, A. Wrench zone reactivation in the Adriatic block: The example of the Mattinata fault system (SE Italy). Boll. Soc. Geol. It 2000, 119, 3–8. [Google Scholar]
- Morsilli, M.; De Cosmo, P.D.; Bosellini, A.; Luciani, V. L’annegamento santoniano della Piattaforma Apula nell’area di Apricena (Gargano, Puglia): Nuovi dati per la paleogeografia del Cretaceo superiore. In Fascicolo Degli Abstract Della IX Riunione del Gruppo di Sedimentologia del CNR (Pescara, Italy, 21–22 October 2002); Consiglio Nazionale delle Ricerche (CNR): Rome, Italy, 2002; Volume 1, pp. 63–64. [Google Scholar]
- Spalluto, L. La Piattaforma Apula nel Gargano Centro-Occidentale: Organizzazione Stratigrafica ed Assetto Della Successione Mesozoica di Piattaforma Interna. PhD Thesis, Università degli Studi di Bari, Bari, Italy, 2004. [Google Scholar]
- Spalluto, L. Facies evolution and sequence chronostratigraphy of a “mid”-Cretaceous shallow-water carbonate succession of the Apulia Carbonate platform from the northern Murge area (Apulia, southern Italy). Facies 2011, 58, 17–36. [Google Scholar] [CrossRef]
- Santantonio, M.; Scrocca, D.; Lipparini, L. The Ombrina-Rospo Plateau (Apulian platform): Evolution of a carbonate platform and its margins during the Jurassic and Cretaceous. Mar. Petrol. Geol. 2013, 42, 4–29. [Google Scholar] [CrossRef]
- Korneva, I.; Tondi, E.; Agosta, F.; Rustichelli, A.; Spina, V.; Bitonte, R.; Di Cuia, R. Structural properties of fractured and faulted Cretaceous platform carbonates, Murge Plateau (southern Italy). Mar. Petrol. Geol. 2014, 57, 312–326. [Google Scholar] [CrossRef]
- Agosta, F.; Manniello, C.; Cavalcante, F.; Belviso, C.; Prosser, G. Late cretaceous transtensional faulting of the Apulian platform, Italy. Mar. Petrol. Geol. 2021, 127, 104889. [Google Scholar] [CrossRef]
- Mazzoli, S.; D’Errico, M.; Aldega, L.; Corrado, S.; Invernizzi, C.; Shiner, P.; Zattin, M. Tectonic burial and “young” (<10 Ma) exhumation in the southern Apennines fold-and-thrust belt (Italy). Geology 2008, 36, 243–246. [Google Scholar] [CrossRef]
- Vitale, S.; Ciarcia, S. Tectono-stratigraphic and kinematic evolution of the southern Apennines/Calabria–Peloritani Terrane system (Italy). Tectonophysics 2013, 583, 164–182. [Google Scholar] [CrossRef]
- Vitale, S.; Prinzi, E.P.; Tramparulo, F.D.A.; De Paola, C.; Di Maio, R.; Piegari, E.; Sabbatino, M.; Natale, J.; Notaro, P.; Ciarcia, S. Late Miocene-early Pliocene out-of-sequence thrusting in the southern Apennines (Italy). Geosciences 2020, 10, 301. [Google Scholar] [CrossRef]
- Ciarcia, S.; Vitale, S. Orogenic evolution of the northern Calabria–southern Apennines system in the framework of the Alpine chains in the central-western Mediterranean area. Geol. Soc. Am. Bull. 2025, 137, 1143–1176. [Google Scholar] [CrossRef]
- Schiattarella, M.; Leo, P.D.; Beneduce, P.; Giano, S.I.; Martino, C. Tectonically Driven Exhumation of a Young Orogen: An Example from the Southern Apennines, Italy; Willett, S.D., Hovius, N., Brandon, M.T., Fisher, D., Eds.; Geol S Am S. Special Paper of the Geological Society of America; Geological Society of America: Boulder, CO, USA, 2006; Volume 398, pp. 371–385. [Google Scholar] [CrossRef]
- Tondi, E.; Piccardi, L.; Cacon, S.; Kontny, B.; Cello, G. Structural and time constraints for dextral shear along the seismogenic Mattinata fault (Gargano, southern Italy). J. Geodyn. 2005, 40, 134–152. [Google Scholar] [CrossRef]
- Doglioni, C.; Mongelli, F.; Pieri, P. The Puglia uplift (SE Italy): An anomaly in the foreland of the Apenninic subduction due to buckling of a thick continental lithosphere. Tectonics 1994, 13, 1309–1321. [Google Scholar] [CrossRef]
- Doglioni, C.; Tropeano, M.; Mongelli, F.; Pieri, P. Middle-late Pleistocene uplift of Puglia: An anomaly in the Apenninic foreland. Mem. Soc. Geol. It 1996, 51, 101–117. [Google Scholar]
- Patacca, E.; Scandone, P. The Plio-Pleistocene thrust belt-foredeep system in the southern Apennines and Sicily (Italy). Geol. Italy 2004, 32, 93–129. [Google Scholar]
- Sabbatino, M.; Tavani, S.; Vitale, S.; Ogata, K.; Corradetti, A.; Consorti, L.; Arienzo, I.; Cipriani, A.; Parente, M. Forebulge migration in the foreland basin system of the central-southern Apennine fold-thrust belt (Italy): New high-resolution Sr-isotope dating constraints. Basin Res. 2021, 33, 2817–2836. [Google Scholar] [CrossRef]
- Doglioni, C.; Harabaglia, P.; Martinelli, G.; Mongelli, F.; Zito, G. A geodynamic model of the Southern Apennines accretionary prism. Terra Nova 1996, 8, 540–547. [Google Scholar] [CrossRef]
- Westaway, R.; Bridgland, D. Late Cenozoic uplift of southern Italy deduced from fluvial and marine sediments: Coupling between surface processes and lower crustal flow. Quat. Int. 2007, 175, 86–124. [Google Scholar] [CrossRef]
- Azzaroli, A.; Perno, U.; Radina, B. Note Illustrative Della Carta Geologica d’Italia Alla Scala 1:100,000. Foglio 188: Gravina di Puglia; Servizio Geologico d’Italia: Roma, Italy, 1968; pp. 1–57. [Google Scholar]
- Di Gennaro, M.; Moresi, M.; Nuovo, G. Argille subappennine di Irsina (Mt) e Monternesola (Ta): Analisi comparativa di dati geochimici e mineralogici. Geol. Appl. Idrogeol. 1977, 12, 65–78. [Google Scholar]
- Del Prete, M. Aspetti evolutivi dei versanti in argille sub-appennine dell’avanfossa bradanica. Edagricola Bologna 1994, 4, 320–330. [Google Scholar]
- Ciaranfi, N.; Marino, M.; Sabato, L.; D’Alessandro, A.; De Rosa, R. Studio geologico stratigrafico di una successione infra e mesopleistocenica nella parte sudoccidentale della Fossa Bradanica (Montalbano Ionico, Basilicata). Boll. Soc. Geol. It. 1996, 115, 379–391. [Google Scholar]
- Ciaranfi, N.; Lirer, F.; Lirer, L.; Lourens, L.J.; Maiorano, P.; Marino, M.; Petrosino, P.; Sprovieri, M.; Stefanelli, S.; Brilli, M.; et al. Integrated stratigraphy and astronomical tuning of the Lower- Middle Pleistocene Montalbano Jonico land section (southern Italy). Quat. Int. 2010, 210, 109–120. [Google Scholar] [CrossRef]
- Tropeano, M.; Sabato, L.; Pieri, P. Filling and cannibalization of a foredeep: The Bradanic Trough, southern Italy. Geol. Soc. Lond. Sp. Publ. 2002, 191, 55–79. [Google Scholar] [CrossRef]
- Gallicchio, S.; Colacicco, R.; Capolongo, D.; Girone, A.; Maiorano, P.; Marino, M.; Ciaranfi, N. Geological features of the special nature reserve of Montalbano Jonico Badlands (Basilicata, Southern Italy). J. Maps 2023, 19, 2179435. [Google Scholar] [CrossRef]
- Bentivenga, M.; Coltorti, M.; Prosser, G.; Tavarnelli, E. Marine terraces and extensional faulting in the Taranto Gulf, Bradanic Trough, Southern Italy. Studi Geol. Camerti Nuova Ser. 2004, 123, 391–404. [Google Scholar]
- Cilumbriello, A.; Sabato, L.; Tropeano, M. Problemi di cartografia geologica relativa ai depositi quaternari di chiusura del ciclo della Fossa bradanica: L’area chiave di Banzi e Genzano di Lucania (Basilicata). Mem. Soc. Geol. It 2008, 77, 119–142. [Google Scholar]
- Gallicchio, S.; Senatore, M.R.; Sabato, L.; Boscaino, M.; Capretto, G.; Cilumbriello, A.; Quarantiello, R. Carta Geologica Dell’area Costiera di Metaponto fra Marina di Ginosa ed il Torrente Cavone (scale 1:25,000). Il Quat. (Ital. J. Quat. Sci.) 2025, 22. Available online: https://www.aiqua.it/images/Tavole/Gallicchio%20et%20al%2022_2%20rid.pdf (accessed on 19 November 2025).
- Simms, A.R.; Rouby, H.; Lambeck, H. Marine terraces and rates of vertical tectonic motion: The importance of glacio-isostatic adjustment along the Pacific coast of central North America. GSA Bull. 2016, 128, 81–93. [Google Scholar] [CrossRef]
- Bruckner, H. Marine Terrassen in Süditalien Eine quartärmorphologische Studie über dasKüstentiefland von Metapont. Düsserdolfer Geogr. Schriften 1980, 14, 225. [Google Scholar]
- Finetti, I. The CROP profiles across the Mediterranean Sea (CROP mare I and II). Mem. Descr. Carta Geol. D’It. 2003, 12, 171–184. [Google Scholar]
- Patacca, E.; Scandone, P. Late thrust propagation and sedimentary response in the thrust-belt—Foredeep system of the Southern Apennines (Pliocene-Pleistocene). In Anatomy of an Orogen: The Apennines and Adjacent Mediterranean Basins; Vai, G.B., Martini, I.P., Eds.; Springer: Dordrecht, The Netherland, 2001; pp. 401–440. [Google Scholar] [CrossRef]
- Turcotte, D.L.; Schubert, G. Applications of Continuum Physics to Geological Problems; University of Michigan; John Wiley & Sons: Hoboken, NJ, USA, 1982. [Google Scholar]
- Bradley, D.C.; Kidd, W.S.F. Flexural extension of the upper continental crust in collisional foredeeps. Geol. Soc. Am. Bull. 1991, 103, 1416–1438. [Google Scholar]
- Doglioni, C. Geological remarks on the relationships between extension and convergent geodynamic settings. Tectonophysics 1995, 252, 253–267. [Google Scholar] [CrossRef]
- Langhi, L.; Ciftci, N.B.; Borel, G.D. Impact of lithospheric flexure on the evolution of shallow faults in the Timor foreland system. Mar. Geol. 2011, 284, 40–54. [Google Scholar] [CrossRef]
- Tavani, S.; Vignaroli, G.; Parente, M. Transverse versus longitudinal extension in the foredeep-peripheral bulge system: Role of Cretaceous structural inheritances during early Miocene extensional faulting in inner central Apennines belt. Tectonics 2015, 34, 1412–1430. [Google Scholar] [CrossRef]
- Meo, A.; Chiocci, F.L.; Senatore, M.R. Morphometric measures to assess the maturity of the submerged drainage basins: The case of the Taranto Canyon upper reach. In Proceedings of the IMEKO International Conference on Metrology for the Sea (MetroSea 2017), Naples, Italy, 11–13, October 2017; pp. 133–137. [Google Scholar]
- Senatore, M.R.; Meo, A.; Budillon, F. Measurements in marine geology: Anexample in the Gulf of Taranto (northern Ionian Sea). In Measurement for the Sea: Supporting the Marine Environment and the Blue Economy; Springer International Publishing: Cham, Switzerland, 2022; pp. 271–289. [Google Scholar]
- Meo, A.; Senatore, M.R. Morphological and seismostratigraphic evidence of Quaternary mass transport deposits in the North Ionian Sea: The Taranto landslide complex (TLC). Front. Earth Sci. 2023, 11, 1168373. [Google Scholar] [CrossRef]
- Ceramicola, S.; Senatore, M.R.; Cova, A.; Meo, A.; Forlin, E.; Critelli, S.; Markezic, N.; Zecchin, M.; Civile, D.; Bosman, A.; et al. Geohazard features of the Gulf of Taranto. J. Maps 2024, 20, 2431073. [Google Scholar] [CrossRef]
- Senatore, M.R. Caratteri sedimentari e tettonici di un bacino di avanfossa. Il Golfo di Taranto. Mem. Soc. Geol. It. 1987, 38, 177–204. [Google Scholar]
- Di Bucci, D.; Burrato, P.; Vannoli, P.; Valensise, G. Tectonic evidence for the ongoing Africa-Eurasia convergence in central Mediterranean foreland areas: A journey among long-lived shear zones, large earthquakes, and elusive fault motions. J. Geophys. Res. 2010, 115, B12404. [Google Scholar] [CrossRef]
- Tropeano, M.; Sabato, L. Response of Plio-Pleistocene Mixed Bioclastic-Lithoclastic Temperate-Water Carbonate Systems to Forced Regressions: The Calcarenite di Gravina Formation, Puglia, SE Italy. Geol. Soc. Lond. Spec. Publ. 2000, 172, 217–243. [Google Scholar] [CrossRef]
- Boenzi, F.; Radina, B.; Ricchetti, G.; Valduga, A. Note Illustrative della Carta Geologica d’Italia, Foglio 201 “Matera”; Servizio Geologico d’Italia: Roma, Italy, 1971. [Google Scholar]
- Lisco, S.; Corselli, C.; De Giosa, F.; Mastronuzzi, G.; Moretti, M.; Siniscalchi, A.; Marchese, F.; Bracchi, V.; Tessarolo, C.; Tursi, A. Geology of Mar Piccolo, Taranto (southern Italy): The physical basis for remediation of a polluted marine area. J. Maps 2016, 12, 173–180. [Google Scholar] [CrossRef]
- Meo, A.; Mauro, A.; Senatore, M.R. Geological map of the San Giuliano Lake (Southern Italy): New stratigraphic and sedimentological data. Ital. J. Geosci. 2024, 143, 175–186. [Google Scholar] [CrossRef]
- Westaway, R. Quaternary uplift of southern Italy. J. Geophys. Res. 1993, 87, 21741–21772. [Google Scholar] [CrossRef]
- Ferranti, L.; Oldow, J.S. Latest Miocene to Quaternary horizontal and vertical displacement rates during simultaneous contraction and extension in the Southern Apennines orogen, Italy. Terra Nova 2005, 17, 209–214. [Google Scholar] [CrossRef]
- Rainone, M.; Nanni, T.; Ori, G.G.; Ricci Lucchi, F. A prograding gravel beach in Pleistocene fan-delta deposits South of Ancona, Italy. In International Association of Sedimentologists―European Regional Meeting, 2nd ed.; European Meeting: Bologna/Ancona, Italy, 1981; pp. 155–156. [Google Scholar]
- Massari, F.; Parea, G.C. Progradational gravel beach sequences in a moderate to high energy microtidal marine environment. Sedimentology 1988, 35, 881–913. [Google Scholar] [CrossRef]
- Tucker, M. Techniques in Sedimentology; Blackwell Scientific Publications: Oxford, UK, 1988; p. 394. [Google Scholar]
- Munsell, A. Soil Colour Charts; Macbeth Division of Eolianllmorgen Corporation: Baltimore, MD, USA, 1975; p. 21218. [Google Scholar]
- Campbell, C.V. Lamina, laminaset, bed and bedset. Sedimentology 1967, 8, 7–26. [Google Scholar] [CrossRef]
- Folk, R.L. Petrology of Sedimentary Rocks; Hemphill’s: Austin, TX, USA, 1968; Volume 70, p. 85. [Google Scholar]
- Lewis, D.W.; McConchie, D. Analytical Sedimentology; Chapman & Hall: New York, NY, USA.; London, UK, 1994. [Google Scholar]
- Tucker, M. Principles of Sedimentology and Stratigraphy|S. Boggs (1995); Englewood Cliffs; Hardcover, XVII; Prentice Hall: Englewood Cliffs, NJ, USA, 1995; ISBN 0-02-311792-3. [Google Scholar]
- Gorsline, D.S. 1971, Procedures in Sedimentary Petrology; University of Texas: Austin, TX, USA, 1960; p. 653. [Google Scholar]
- Blott, S.J.; Pye, K. Particle size scales and classification of sediment types based on particle size distributions: Review and recommended procedures. Sedimentology 2012, 59, 2071–2096. [Google Scholar] [CrossRef]
- Schönwiese, C.D. Globale Klimaänderungen aufgrund des anthropogenen Treibhauseffektes und konkurrierender Einflüsse. In CO2—Eine Herausforderung für die Menschheit; Gehr, P., Kost, C., Stephan, G., Eds.; Springer: Berlin/Heidelberg, Germany, 1997. [Google Scholar] [CrossRef]
- Gornitz, V. The Great Ice Meltdown and Rising Seas: Lessons for Tomorrow. NASA News 2012, Public Domain. Available online: https://commons.wikimedia.org/w/index.php?curid=42012722 (accessed on 27 October 2025).
- Aiello, G. Regional Geological Data on the Volturno Basin Filling and Its Relationship to the Massico Structure (Southern Tyrrhenian Sea, Italy). J. Mar. Sci. Eng. 2025, 13, 241. [Google Scholar] [CrossRef]
- Budillon, F.; Senatore, M.R.; Insinga, D.D.; Iorio, M.; Lubritto, C.; Roca, M.; Rumolo, P. Late Holocene sedimentary changes in shallow water settings: The case of the Sele river offshore in the Salerno Gulf (south-eastern Tyrrhenian Sea, Italy). Rend. Lincei 2012, 23, 25–43. [Google Scholar]
- Barra, D.; Calderoni, G.; Cipriani, M.; De La Genire, J.; Fiorillo, L.; Greco, G.; Mariotti Lippi, M.; Mori Secci, M.; Pescatore, T.; Russo, B.; et al. Depositional history and paleogeographic reconstruction on Sele coastal plain during Magna Grecia Settlement of Hera Argiva (Southern Italy). Geol. Romana 1999, 35, 151–166. [Google Scholar]
- Fanget, A.S.; Bassetti, M.A.; Fontanier, C.; Tudryn, A.; Berné, S. Sedimentary archives of climate and sea-level changes during the Holocene in the Rhône prodelta (NW Mediterranean Sea). Clim. Past 2016, 12, 2161–2179. [Google Scholar] [CrossRef]
- Raynal, O.; Bouchette, F.; Certain, R.; Sabatier, P.; Lofi, J.; Seranne, M.; Dezileau, L.; Briqueu, L.; Ferrer, P.; Courp, T. Holocene evolution of a Languedocian lagoonal environment controlled by inherited coastal morphology (northern Gulf of Lions, France). Bull. De La Société Géologique De Fr. 2010, 181, 211–224. [Google Scholar] [CrossRef]
- Cearreta, A.; Benito, X.; Ibáñez, C.; Trobajo, R.; Giosan, L. Holocene palaeoenvironmental evolution of the Ebro Delta (Western Mediterranean Sea): Evidence for an early construction based on the benthic foraminiferal record. Holocene 2016, 26, 1438–1456. [Google Scholar] [CrossRef]
- Zaibi, C.; Kamoun, F.; Viehberg, F.; Carbonel, P.; Jedoui, Y.; Abida, H.; Fontugny, M. Impact of relative sea level and extreme climate events on the Southern Skhira coastline (Gulf of Gabes, Tunisia) during Holocene times: Ostracodes and foraminifera associations’ response. J. Afr. Earth Sci. 2016, 118, 120–136. [Google Scholar] [CrossRef]


Disclaimer/Publisher’s Note: The statements, opinions and data contained in all publications are solely those of the individual author(s) and contributor(s) and not of MDPI and/or the editor(s). MDPI and/or the editor(s) disclaim responsibility for any injury to people or property resulting from any ideas, methods, instructions or products referred to in the content. |
© 2025 by the authors. Licensee MDPI, Basel, Switzerland. This article is an open access article distributed under the terms and conditions of the Creative Commons Attribution (CC BY) license.