Abstract
The stability of underground excavations is a critical factor in the safety and efficiency of mining operations, particularly in structurally complex and geomechanically variable rock mass. This study presents a comparative evaluation of empirical and numerical methods for the design of tunnel support systems in the Gilar underground mine, located in the Gedabek Contract Area of Azerbaijan. To validate and optimize the empirical Q-system-based support designs, Finite Element Method (FEM) simulations were conducted using RS2 software. These simulations enabled the modeling of stress distribution, deformation, and support–rock interaction under in situ conditions. Critical sections along the main ramp were analyzed in detail to determine safety factors during excavation and post-support installation. The study reveals that, although the Q-system provides a practical and time-efficient method for support selection, it may underestimate the reinforcement required in highly fractured or low-strength zones. Numerical modeling proved to be essential in identifying zones with low strength factors and in optimizing support configurations by adjusting rockbolt spacing and shotcrete thickness. The hybrid approach adopted in this study—empirical classification followed by numerical verification and optimization—demonstrated significant improvements in long-term tunnel stability. This research highlights the importance of integrating empirical and numerical approaches for robust ground support design in underground mining. The proposed methodology not only enhances the accuracy of support recommendations but also provides a more reliable basis for decision-making in complex geological settings. The results are particularly relevant for deep and geologically active mines requiring long-term stability of access tunnels.
1. Introduction
Ensuring the stability of underground excavations is one of the most critical challenges in recent mining and tunneling operations. This issue is particularly important at significant depths where stress conditions, geological heterogeneity, and time-dependent deformation processes become increasingly complex. With the progressive depletion of shallow, easily available mineral resources, underground mining has become the primary method of accessing high-value ore deposits. However, the advancement into deeper and more structurally complex geological formations necessitates robust and adaptable ground control strategies to ensure the safety of workers and the long-term operational reliability of mining infrastructure [1,2,3,4,5,6].
In most hard rock deep mines, the primary way of providing excavation support is rockbolt-based ground reinforcement [7,8]. Such ground support systems, including not only rockbolts but also shotcrete, steel sets, and wire mesh, are designed to maintain the mechanical integrity of underground openings by reinforcing rock masses and controlling deformation with a progression in excavation and change in stress field [9,10,11,12,13,14]. The effectiveness of these systems depends on accurate characterization of the rock mass and a thorough understanding of excavation-induced stress redistribution. Traditionally, empirical classification systems such as the Q-system [15] and Rock Mass Rating (RMR) system [16] have been widely used in support design due to their simplicity, accessibility, and ability to provide first-order recommendations based on geological and structural observations [17]. The Q-system, in particular, has been extensively validated and updated over decades, culminating in the 2015 NGI guidelines that incorporate modern reinforcement technologies such as fiber-reinforced shotcrete and reinforced ribs of shotcrete [15,18].
Despite their usefulness, empirical methods often rely on generalized assumptions and may not capture local-scale variability, complex stress interactions, or anisotropic material behavior, especially in jointed or faulted rock masses [19,20,21,22]. In contrast, numerical methods such as the Finite Element Method (FEM), Discrete Element Method (DEM), and hybrid FEM/DEM techniques allow for more rigorous simulation of excavation performance, accounting for geometry, loading history, material heterogeneity, and support-structure interaction [23,24,25,26]. FEM-based approaches are particularly suited to modeling stress distribution and deformation in isotropic and anisotropic continua and have been widely applied in geotechnical analysis of tunnels and deep mines [27,28,29,30].
This paper presents a comparative evaluation of empirical and numerical approaches for ground support design based on a case study from the Gilar underground mine, located in the Lesser Caucasus region of Azerbaijan. The mine, developed by Anglo Asian Mining PLC, features geomechanically challenging conditions, including variable RQD values, extensive faulting, and fractured volcanic lithologies. The support system for the main ramp tunnel was initially designed using the Q-system and then optimized using FEM simulations in RS2, enabling detailed assessment of safety factors and deformation patterns in the surrounding excavation under in situ stress conditions.
The core aim of this study is to assess the compatibility and limitations of empirical design principles with respect to numerically validated stability outcomes and to propose a hybrid methodology that enhances reliability and adaptability of support design in deep underground settings. Particular emphasis is placed on quantifying the performance differences between the Q-based preliminary designs and FEM-optimized reinforcement layouts with respect to factor of safety, deformation control, and long-term excavation stability.
This article provides a concise summary of the key research activities and findings reported in [31]. Conducted research studies contribute to a broader understanding of ground control practices in underground mining and support the need for integrating classification-based and simulation-driven approaches in the design of support systems for deep, geologically complex mining environments.
2. Design and Evaluation of Support Efficiency
2.1. Empirical Approach
Rock mass quality evaluation and appropriate support system selection in underground excavations are universally applied by empirical methods. These methods rely on previously documented relationships between rock mass behavior and support performance and, as such, are practical tools for engineers to use in preliminary support design. The Q-System and the Rock Mass Rating (RMR) system are among the best-known and most of the utilized empirical methods. In situ determined rock mass parameters are used to quantify rock mass quality and correlate to recommended support measures in these systems.
Originally, the Q-system was developed to describe rock mass quality and to provide guidelines for the tunnel support design. A baseline for this research was a project conducted for the Norwegian State Power Board (Statkraft), who wanted to know why underground powerhouses in Norway had such a wide spread of deformations. Other empirical methods available, such as Deere’s Rock Quality Designation (RQD) [32], were not suited to such problems because they only measured block size and ignored the effects of joint strength, water, and stress [15,33,34]. To address this, researchers analyzed 212 case records of tunnels and caverns. Most of the data came from hydropower projects in Norway and Sweden, which involved different rock types and excavation sizes. After studying the influence of multiple rock mass parameters, six key factors affecting tunnel stability were identified and combined into the Q-value based on the following formula:
where RQD represents the Rock Quality Designation, Jn accounts for the number of joint sets, and Jr and Ja describe joint surface roughness and alteration, respectively. The groundwater condition is expressed through the Jw factor, while stress-induced effects such as squeezing or bursting are represented by the SRF. The Q-value ranges on a logarithmic scale from 0.001 for very poor rock to 1000 for excellent rock quality. This wide range makes the Q-system practical for classifying rock mass quality across different geological conditions [15]. The development of the Q-system was a breakthrough because it brought together factors like block size, shear strength, water, and stress into one simple classification. This made it possible to link rock quality directly to tunnel support needs, helping engineers plan safer and more cost-effective designs.
A major step in linking rock mass quality to tunnel support requirements was the Q-support chart. The objective was to propose practicable recommendations for stabilizing tunnels using Q-value and tunnel span. The Q-support chart is arranged with the tunnel span (in meters) on the vertical axis and the Q-value (rock mass quality) on the horizontal axis. It is broken down into zones that suggest specific amounts of rockbolt placement and shotcrete thickness.
Then, the Q-system was further developed based on 1050 new case records, mostly from Norwegian road tunnels. In 1993, Grimstad and Barton [33] introduced a major update to the Q-support chart. This update reflected advancements in rock support technology, particularly the shift from steel mesh-reinforced shotcrete to fiber-reinforced shotcrete. Another key feature of this update was the inclusion of a narrow “bolt-only” category for tunnels up to 10 m wide with Q-values between 10 and 20. However, this approach, while acceptable for certain high-quality rock masses, was later deemed insufficient for critical transport tunnels, such as road and rail infrastructure. Thus, in 2002, the Q-support chart underwent further refinement with the addition of 800 new case records from tunnels and caverns across Norway, Switzerland, and India [33]. This update introduced energy absorption parameters to quantify shotcrete performance specified for very poor rock conditions. These additions emphasized the need for thicker layers of fiber-reinforced shotcrete and reinforced ribs of shotcrete (RRS) in weak or highly stressed zones. The most recent significant update, which is shown in Figure 1, was published in the Norwegian Geotechnical Institute Handbook [18].
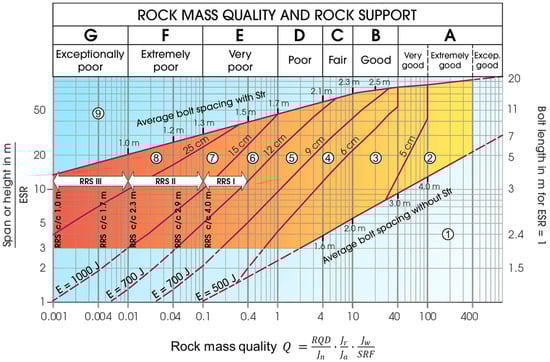
Figure 1.
The Q-systems rock support chart [18].
In Figure 1, RQD represents the percentage of competent rock mass in a core sample, Jn quantifies the number of joint sets, Jr describes joint roughness, Ja accounts for the degree of alteration or infilling, Jw evaluates the effect of water inflow, and SRF considers stress-related factors affecting stability.
This version integrates modern tunneling technologies, numerical modeling validation, and additional empirical data from international tunneling projects. A key advancement of this update was the improved classification of RRS, which categorizes it into multiple energy absorption classes. Additionally, support recommendations for poor-quality rock masses have been optimized. The update also introduced refinements in bolt spacing for both shotcreted and unshotcreted areas, ensuring more effective stabilization in varying geological conditions [35].
2.2. Computer-Aided Simulations
Numerical methods are widely used in rock mechanics to study stress distribution, failure mechanisms, and ground support systems in underground excavations [36,37]. These methods are essential for solving complex geotechnical problems where simple analytical or empirical approaches are not effective. By using computer simulations, engineers can better understand how rock masses behave and test the effectiveness of support systems under various conditions. The most common methods include the Limit Equilibrium Method (LEM), Finite Element Method (FEM), Discrete Element Method (DEM), and the Hybrid Finite–Discrete Element Method (FDEM).
The Limit Equilibrium Method (LEM) is one of the simplest methods for computer-based tools for underground working stability evaluation [38,39]. In general, this is a set of procedures that calculates stability by iterative checking forces or moments on some special failure surfaces, e.g., wedges or planes in rock masses. This works fine when the geometry and orientation of joints are known [39], for instance, in rock wedges. At the moment, one of the most popular software systems for LEM-based underground stability calculation is UnWedge by RocScience. In this software, stability is presented in the form of the factor of safety (FOS), which is calculated according to Hoek et al. [39]. The exemplary stability calculation, using UnWedge software, is presented in Figure 2.
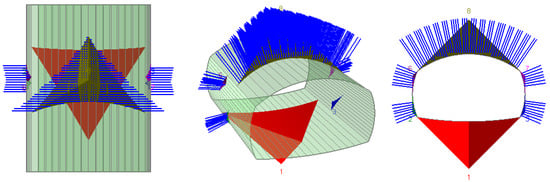
Figure 2.
Chamber stability analysis using UnWedge v4 software.
Despite many advantages (like computational simplicity), LEM has important limitations: it enforces only global force and moment equilibrium on assumed failure surfaces, so it cannot capture strain compatibility, deformations, or progressive failure, and results are highly sensitive to the chosen failure surface. It also struggles to represent fully 3D geometry, anisotropy/heterogeneity, support–ground interaction, and coupled hydro-mechanical or dynamic (seismic) effects.
Another tool for underground excavation stability assessment is the Finite Element Method (FEM). This approach discretizes a whole domain into small elements, uses shape functions to approximate the governing equations within each element, assembles these into a global system with boundary conditions, and solves for the unknown fields (e.g., displacements, stresses) [40]. For complex geometries and rock support interactions, it is effective and has been proven numerous times in recent publications. Tunnel excavation and support design using FEM is completed using software such as Plaxis, RS2, and GTS NX. In Figure 3, an example of a 3D numerical simulation of underground working stability with GTS NX 2024 has been presented.
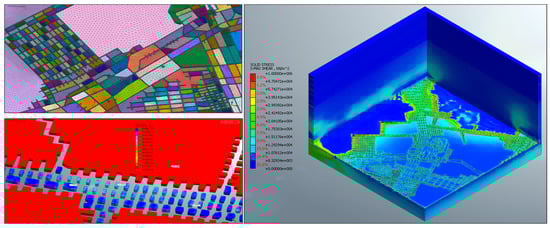
Figure 3.
Large-scale FEM-based numerical simulation of mining excavation.
The Finite Difference Method (FDM) is another widely applied continuum approach in rock engineering, particularly for problems involving large-strain plasticity, time-dependent behavior (e.g., creep), and staged excavation in underground mines. In FDM, the governing equilibrium and compatibility equations are solved on a grid by approximating spatial derivatives with finite differences, which makes the method well suited to strongly non-linear constitutive responses and progressive yielding under changing stress paths. Many FDM codes employ an explicit time-marching scheme (often via dynamic relaxation), allowing efficient simulation of step-by-step excavation, installation of support, and the associated stress redistribution (Figure 4). FDM is frequently used to evaluate plastic zone development around headings, pillar behavior, ground support demand, and the influence of in situ stress anisotropy and mining sequence; it can also incorporate structural features (interfaces/joints), coupled hydro-mechanical processes, and dynamic loading when required. Well-known implementations include FLAC/FLAC3D, which provide a broad library of constitutive models and excavation-support workflows; however, as with other continuum methods, results remain sensitive to zoning strategy, constitutive calibration, and the representation of discontinuities, which may require explicit interfaces or complementary discontinuum analyses for highly jointed rock masses [41,42,43,44].
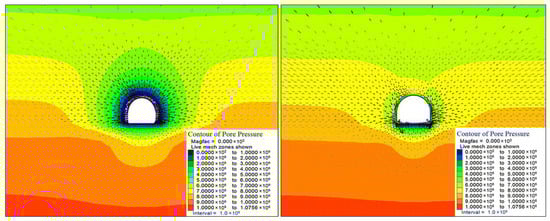
Figure 4.
Exemplary pore pressure generated after excavation without support (left) and contour of pore pressure after excavation with support (right) [41].
Although FDM and FEM often yield comparable engineering outputs when calibrated consistently, FEM was selected in this study because RS2 provides a robust workflow for bolt/shotcrete/mesh elements, strength factor evaluation, and practical post-processing, aligned with the Q-to-FEM verification objective.
Based on recent advances in underground stability evaluation, it may be stated that FEM is well suited for underground stability assessments because it handles complex 2D/3D geometries, anisotropy and non-linearity, jointed media, staged excavation, and support interaction, as well as hydro-mechanical or dynamic loads [45,46,47,48]. Of course, it also has some limitations like dependence on high-quality input data, necessity of model calibration, sensitivity to mesh and boundary conditions, and relatively high computational cost. Still, when properly calibrated and validated, FEM remains the most widely used, best-proven, and reliable method for underground stability assessment [49].
The Discrete Element Method (DEM) was developed for fractured and jointed rock masses (Figure 5). The DEM does not treat rock as a solid block but as many smaller blocks, or particles, which interact at contact points. For studying block movements, fracture development, and failure processes, it is especially useful [50,51]. Popular DEM analyses are carried out using software such as UDEC (2D) and 3DEC (3D). DEM requires very detailed input data, such as joint geometry, and is computationally expensive for large systems.
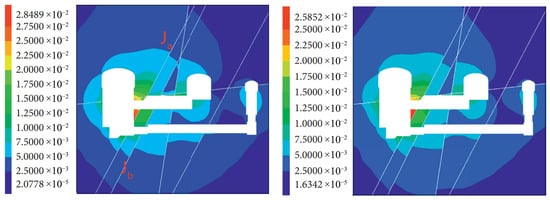
Figure 5.
Total displacement contour (m) mining section of the unsupported (left) and supported condition (right) obtained in 3DEC software [50].
DEM is one of the best tools for representing discontinuous rock masses and granular media by explicitly modeling contacts, fractures, block rotations, and large deformations. However, it relies on many hard-to-calibrate micro-parameters and small time steps, and it is computationally hardware-intensive and generally less validated than FEM. Also, because of its complexity and time-consuming character, it is not the best choice for very large models or continuum-dominated problems.
Recently, hybrid FEM/DEM (FDEM) software has also become available on the market. This method combines the strengths of continuum and discrete approaches, while it treats the rock mass as a continuum until damage localizes, and it allows fractures to initiate, propagate, and coalesce into discrete blocks, capturing crack growth, support–rock interactions, and dynamic phenomena (e.g., blasting, rockbursts). Recently, software such as Irazu, LS-DYNA, and ELFEN has been widely used for complex fracture problems. However, reliable FDEM analyses require detailed, well-calibrated input data, very small time steps, and fine discretization—leading to high computational cost and long run times [52]. An exemplary calculation performed with Irazu FDEM-based software is presented in Figure 6.
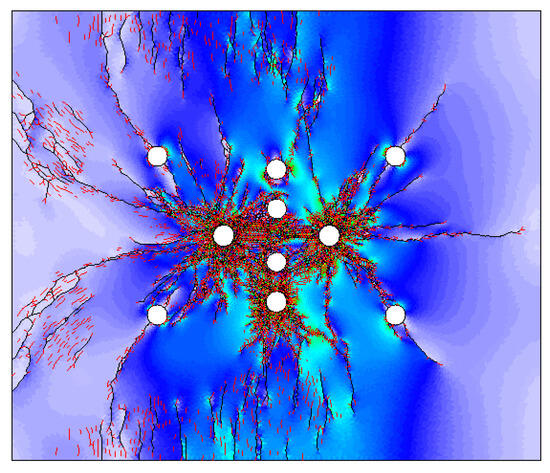
Figure 6.
Rock mass fracture and stress distribution map due to detonation of explosives in burn cut—calculated in IRAZU FDEM software.
Consequently, FDEM is seldom practical for very large models or routine, day-to-day underground mine operations and is best deployed selectively for critical zones where fracture processes govern stability. The summarizing comparison of abovementioned numerical methods is presented in Table 1.

Table 1.
Summary of numerical methods for underground stability calculations.
LEM is rapid but restricted to predefined failure planes and weak on support–ground interaction. DEM and FDEM resolve fracture physics and dynamics but require many micro-parameters and high computational effort, which limits model size and routine use. FEM offers the best balance for ground support design at Gilar. It captures stress–strain redistribution in complex excavations, staged excavation, and bolt/shotcrete/mesh interaction. It provides design-relevant outputs: convergence, plastic zones, support demand, and safety margins. It also integrates naturally with empirical inputs (Q, RMR, and GSI) for parameterization and sensitivity studies. With careful calibration, boundary conditions, and meshing, FEM gives the most defensible realism-to-effort ratio for this comparative evaluation and, therefore, was chosen as the numerical simulation method for this research.
3. Description of the Trial Site
The trial site for this research was the Gilar mine located in western Azerbaijan. The geological setting of the Gilar mine is complicated due to its position in the Lesser Caucasus Mountain range. Mining activities and infrastructure expansion in the Lesser Caucasus are strongly influenced by rugged mountainous conditions and seasonal variability. These factors underline the need for robust ground support and effective resource management to ensure safe and sustainable operations. Figure 7 shows the regional distribution of Anglo Asian Mining PLC’s contract areas in Azerbaijan and emphasizes the central role of Gedabek in AAM’s portfolio. Figure 8 then zooms in on the Gedabek district, highlighting the main deposits—Gilar, Zafar, Qadir, and Gedabek. The Google Earth view clearly indicates the location of the Gilar Au–Cu deposit within the contract area, positioned close to several other important mineral occurrences.
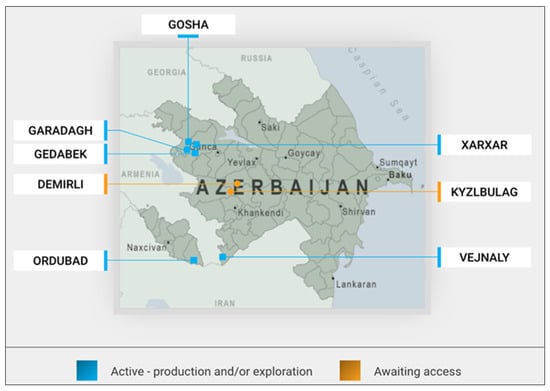
Figure 7.
Overview of Anglo Asian Mining PLC’s contract areas in Azerbaijan, showing active and pending-access sites [31].
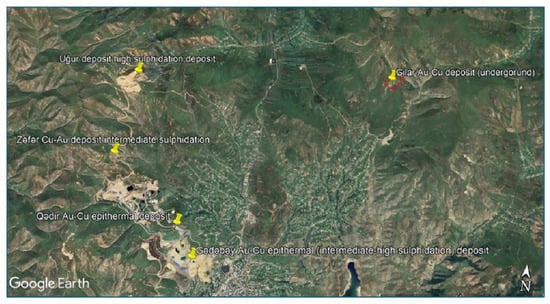
Figure 8.
Close-up of mineral deposits in the Gedabek Contract Area, including Gilar, Zafar, Qadir, and Gedabek [31].
Volcanic and sedimentary rocks, predominantly andesites, dacites, and tuffaceous sediments, characterize the site. They have been hydrothermally altered extensively and provide a suitable setting for epithermal gold and copper mineralization. A network of faults and fractures has been responsible for controlling the mineral deposition as well as providing challenges to ground stability. While useful for mineral concentration, these structural features present complex requirements for mining design to have safe and efficient practices. The geological section of the Gilar mine is presented in Figure 9.
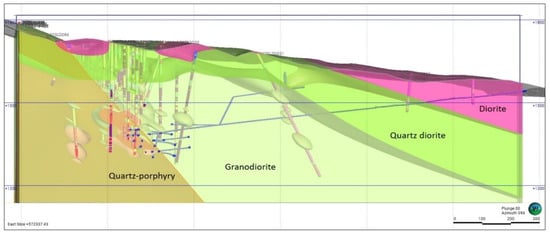
Figure 9.
Geological section of the Gilar mine showing major lithological units [31].
The orebody at the Gilar mine is extracted 300 to 400 m below the surface. Sublevel caving is the mining method used. The mining scheme consists of five sublevels, designed to give the maximum ore recovery and to provide safe operation. Sublevel caving is systematic blasting of the orebody, opening up draw points into which the broken rock can cave, for extraction. The five sublevels are spaced so that ore recovery and stability are optimized, with minimal ore loss but a safe working environment. The mine layout, orebody elevation, access drifts, and positioning of the five sublevels are shown in Figure 10.
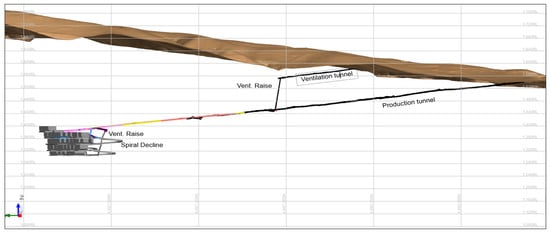
Figure 10.
Gilar mine layout, showing the orebody, sublevels, ventilation raises, and spiral decline [31].
The average tunnel at the Gilar mine has dimensions of 4.9 m height and 5 m width. The surrounding rock mass is closely jointed, requiring robust ground support systems to maintain stability and ensure safe working conditions. The tunnel face and installed support elements are shown in Figure 11, highlighting the challenging ground conditions and the measures taken to secure the excavation.
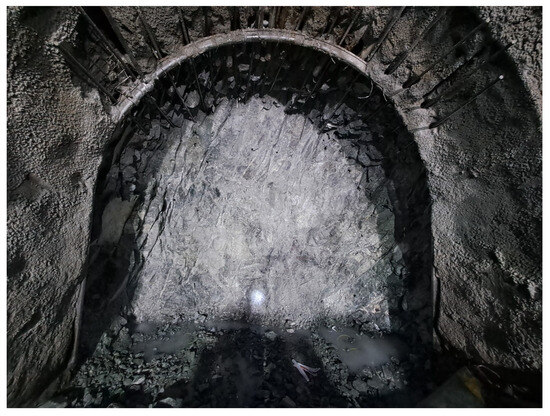
Figure 11.
View of the mining face showing a distinct fracture pattern.
It is worth emphasizing that the RQD index was determined from core drilling of the roof strata, which enabled a direct assessment of fracturing intensity and rock mass quality in the zone above the underground openings. The core drilling was carried out separately for each of the sections marked in Figure 12, resulting in a set of spatially comparable data that captures the local variability of geological and structural conditions. This approach allowed RQD values to be assigned to specific parts of the analyzed area and reduced the uncertainty associated with averaging parameters over the entire site. In addition, the drilling and logging procedure followed a drill-run (core-run) basis, with a maximum run length of 3 m, ensuring consistent RQD reporting along the boreholes.
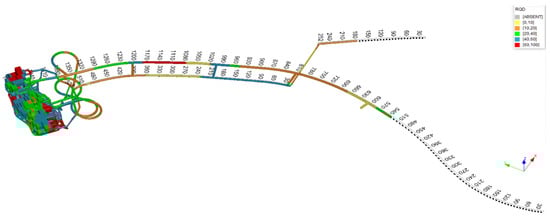
Figure 12.
Rock Quality Designation (RQD) block model and underground wireframe of the Gilar mine [31].
In addition, uniaxial compressive strength (UCS) tests were performed under laboratory conditions using a standard uniaxial compression testing apparatus. Rock specimens were collected from four sampling locations shown in Figure 13, ensuring that the measured strength parameters reflect the spatial variability of the investigated rock mass. The UCS results were subsequently used to support the calibration and verification of the adopted rock mass strength parameters in the analyses.
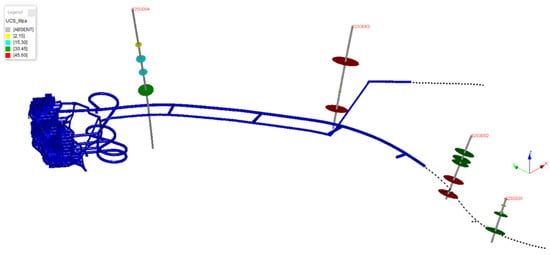
Figure 13.
Uniaxial compressive strength model of analyzed drifts [31].
4. Materials and Methods
4.1. Empirically Based Rock Support Design
For this study, the Q-value calculations were conducted for different sections of the tunnel to account for variations in Rock Quality Designation (RQD), which influences the rock mass classification. Other parameters, including Joint Set Number (Jn), Joint Roughness Number (Jr), Joint Alteration Number (Ja), Joint Water Reduction Factor (Jw), and Stress Reduction Factor (SRF), were assumed to remain constant across sections. These parameters were obtained from the mining company’s geotechnical data, ensuring consistency in classification.
In the Q-system, the Excavation Support Ratio (ESR) is used to account for the importance, required reliability, and intended service life of an underground opening. In this study, the analyzed excavations are planned for long-term use, meaning that stability must be maintained not only during development but throughout prolonged operation under evolving stress and environmental conditions. Therefore, an ESR value of 1.6 was adopted, corresponding to excavations with higher support demands and stricter performance requirements than temporary headings. This choice is conservative and appropriate for ensuring a sufficient safety margin and serviceability over the expected lifetime of the openings, particularly in the presence of time-dependent deterioration mechanisms and potential loading changes during mine progression. The ESR value selection follows standard industry practices for main mine access tunnels, ensuring adequate stability under operational conditions.
The tunnel was divided into multiple sections based on changes in RQD, while other geotechnical parameters remained the same. The division was necessary to accurately assess rock mass variability and optimize the support system accordingly. The variations in RQD were identified through geological mapping and core logging performed by the mining company. The input parameters for Q-value calculations are summarized in Table 2. For consistency across the analyzed profiles, the Stress Reduction Factor (SRF) was set to 10 for each section, reflecting the expected moderate-to-high stress influence and potential stress-related instability (e.g., stress-induced fracturing and local yielding) in the vicinity of the excavations under the prevailing in situ stress conditions and mining-related stress redistribution, which warrants a conservative representation in the Q-system classification.
Table 2.
Input parameters and rock classification for different sections of the tunnel.
4.2. Numerical Modeling
The modeling was performed using RS2 software by Rocscience, which is an FEM-based tool widely used in geotechnical engineering. FEM was chosen for its ability to simulate non-linear deformations, stress distribution, and interactions between the rock mass and support systems. This approach bridges the gap between empirical methods and real-world conditions, ensuring a comprehensive analysis of tunnel performance.
4.2.1. In Situ Stresses
Vertical stress for each section was determined using Equation (2).
where is unit weight of the rock mass (MN/m3), chosen as 0.027 MN/m3, and is the overburden thickness (m).
Horizontal stress is given by Equation (3).
where is the horizontal stress to vertical stress ratio, and E is the deformation modulus of the Earth’s crust in the horizontal direction.
The values of at various depths for the Gilar mine are illustrated in Figure 14.
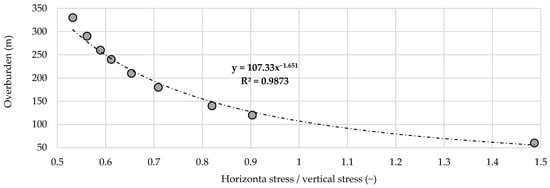
Figure 14.
Variation of k with depth.
4.2.2. Rock Mass Strength (Generalized Hoek–Brown)
Rock mass strength was characterized with the Generalized Hoek–Brown criterion—a non-linear empirical model linking the intact rock parameter mi, rock mass quality (GSI), and disturbance factor D to derive equivalent strength parameters for jointed rock masses [1]. Hoek–Brown constants were obtained from the following:
In these equations, represents the intact rock parameter, which in this study, was determined based on rock lithology knowledge using RSData software. The Geological Strength Index (GSI), a measure of rock mass quality, was estimated using the Q-value. The disturbance factor , which accounts for the effects of blasting and stress relaxation, can range from 0 (undisturbed rock mass) to 1 (highly disturbed rock mass). In this study, was set to 0.6, indicating a moderate level of disturbance.
The values of Rock Mass Rating (RMR) and Geological Strength Index (GSI) were calculated using Equations (8) and (9):
All the parameters used in numerical modeling are listed in Table 3.
Table 3.
Rock mass and material properties.
4.2.3. Development of the Model
The numerical model includes both the tunnel and the surrounding rock mass to accurately simulate stress distribution and ground behavior. A 2D plane-strain FE model of a 5.0 m × 4.9 m tunnel was embedded in the surrounding rock mass. A joint network with a spacing of 1 m and an inclination of 75 degrees was included to represent the discontinuities within the rock mass, while the boundary conditions were set with fixed constraints on all sides to prevent movement in both X and Y directions. At the same time, the external boundary dimensions were set at 4 times the span of the tunnel, ensuring that the results were unaffected by edge and corner effects. This setup is shown in Figure 15, which provides an overall view of the model, including the fixed boundary conditions, joint network, and bolting pattern.
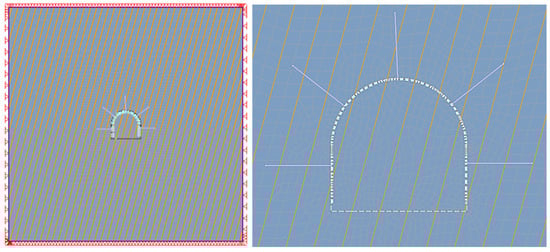
Figure 15.
General view of 2D model (left) and focus on mesh size and bolting pattern (right).
A 4-noded quadrilateral mesh was generated, with finer zoning implemented around the tunnel periphery to enhance the accuracy of the stress and deformation analysis.
The simulation was conducted in three stages: the initial state, excavation, and support installation. The initial support system was designed using empirical recommendations from the Q-chart. However, the support system was iteratively adjusted until the strength factor ranged between 1.6 and 1.8, ensuring long-term stability of the tunnel, which is the main access tunnel for the mine. This adjustment was crucial to accommodate the tunnel’s expected lifetime. Detailed characteristics of the support elements used in the numerical model are presented in Table 4.
Table 4.
Characteristics of support elements.
4.2.4. Evaluation Criteria
In this article, the effectiveness of the proposed ground support layout is evaluated by checking the strength factor (SF). In RS2, the SF is a local stability indicator computed at every point in the mesh as the ratio of the available rock strength (defined by the selected failure criterion, e.g., Mohr–Coulomb or Hoek–Brown) to the induced stress at that location; consequently, SF > 1 indicates that the stress state remains below the failure envelope, whereas SF < 1 marks zones where yielding/failure is expected. RS2 accounts for the influence of the principal stress components (including out-of-plane stress), so the SF contours can be interpreted as a three-dimensional measure of proximity to failure even in a two-dimensional model
A target SF of 1.6–1.8 was adopted for the main haulage excavations, which must remain serviceable over the full mine life. This range provides reserve for geotechnical parameter uncertainty, construction variability, and long-term stress changes as mining advances. It also offers a buffer against transient and dynamic actions (blasting vibrations and potential induced seismicity), despite the static nature of the FEM-based analyses. Capping the global SF at 1.8 avoids overdesign (excess shotcrete thickness and bolt density) and preserves economic feasibility and maintainability. Overall, SF = 1.6–1.8 balances durability and resilience with cost efficiency and can be applied consistently across sections.
5. Results
The empirical solution results were determined using the Q-system chart to categorize and recommend appropriate support methods for the 5 m span tunnel. The analysis considered the provided ranges for red, green, and blue zones, corresponding to different Q-values and rock mass qualities. Below is a summary of the results and support recommendations, as shown in Figure 16 and Table 5:
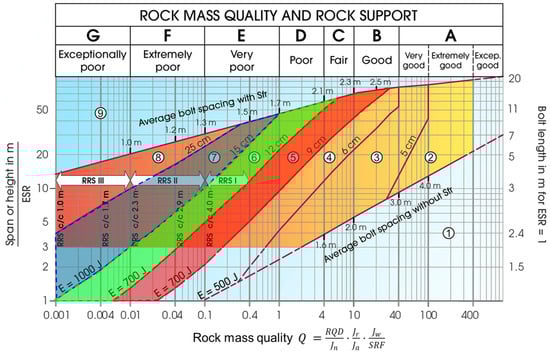
Figure 16.
Q-System chart with tunnel support recommendations. Red zone: tunnel section 540–660, 975–1020, 1080–1440. Green zone: 660–975. Blue zone: 1020–1080 (based on [18]).
Table 5.
Tunnel supports estimated from the Q method.
Strength factors (SFs) were obtained from FEM excavation-stage analyses without support for sections 540, 810, and 1040, classified by the Q-system as Categories 5, 6, and 7, respectively. This provides a direct check on empirical assignments.
- In section 540 (Figure 17, left), SF = 0.95 at 0.10 m above the crown. This section is near the stability limit but does not indicate immediate failure. Early shotcrete and systematic bolting are still required to maintain the margin as advance proceeds.
- In section 810 (Figure 17-centre), SF falls to 0.63 near the upper sidewalls, indicating a high risk of local instability. At 0.10 m above the crown, SF = 0.95, showing better conditions directly over the opening. Immediate application of shotcrete after each round and prompt bolt installation is recommended to control slabbing and ensure safe support installation.
- Section 1040 (Figure 17, right) shows the lowest margins, with zones of SF < 1 concentrated around the crown and sidewalls. Heavy, closely spaced support and short advance lengths are advised, followed by verification of stability after each stage.

Figure 17.
FEM analysis of excavation stage in the tunnel section 540 (left), section 810 (center), and section 1040 (right) (based on [31]).
Figure 17.
FEM analysis of excavation stage in the tunnel section 540 (left), section 810 (center), and section 1040 (right) (based on [31]).

Overall, the FEM results align with the Q-based categories and highlight where immediate support is critical.
Comparison of Empirical and FEM Solutions
To compare empirical and numerical solutions, we first implemented the Q-system support for each section and used FEM to compute the excavation-stage strength factor (SF) and its distribution around the workings. Then, FEM-based optimization was performed by adjusting bolt length and spacing to raise the controlling (minimum) SF of the bolt-reinforced rock mass into the target band (1.6–1.8). This Q-FEM workflow both checks the empirical assignment and identifies zones requiring immediate strengthening.
The initial support for section 540 followed the Q-system (Category 5) and was as follows: fiber-reinforced shotcrete 9–12 cm and 2.4 m bolts at 2.3 m spacing. The layout was analyzed in RS2 to assess the strength factor distribution. RS2 returned SF = 1.32–1.58 with minima at the crown (Figure 18), below the target 1.6–1.8. Given the ramp’s long service life, additional reinforcement was adopted to secure a higher safety margin against stress variability and time-dependent effects.
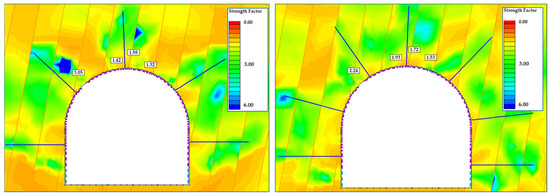
Figure 18.
FEM simulation Q-based rock support (left) and optimized to achieve minimum SF (right) for section 540 (based on [31]).
To improve long-term stability of the main ramp, rockbolt spacing was reduced from 2.3 m to 1.8 m, with all other support parameters unchanged. RS2 simulations of the optimized layout showed clear gains: the minimum strength factor (SF) increased from 1.32 to 1.53 (+16%) and the maximum from 1.58 to 1.93 (+22%), and the average SF at the crown exceeded 1.6, meeting the target for long-term stability. Figure 18 (right) illustrates a more uniform SF distribution, particularly near the crown. The denser bolting enhanced stability without excessive material use, and the final design ensures the 540 m ramp section remains serviceable over its life with reduced risk of deformation and support degradation.
The 810 m ramp section was classified by the Q-system as Category 6, recommending 12–15 cm fiber-reinforced shotcrete with one rebar layer and 2.4 m bolts at 1.8 m spacing. This layout was evaluated in RS2 to check the target SF = 1.6–1.8. Initial RS2 results yielded SF = 1.32–1.66 (Figure 19, left). The excavation was stable but near the lower bound for a permanent ramp. Given the long service life and cyclic loads, additional reinforcement was required to increase the safety margin.
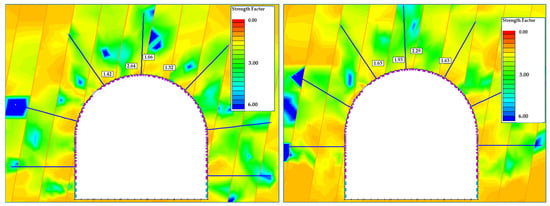
Figure 19.
FEM simulation Q-based rock support (left) and optimized to achieve minimum SF (right) for section 810 (based on [31]).
To enhance stability, rockbolt spacing was reduced from 1.8 m to 1.5 m, a 17% decrease in spacing (i.e., higher pattern density) while keeping all other parameters unchanged. The optimized support was then analyzed in RS2 to quantify its effect on the strength factor (SF) distribution. The simulations showed a marked improvement: the minimum SF rose from 1.32 to 1.66 (+26%), and the maximum SF increased from 1.66 to 2.20 (+32%), as shown in Figure 19, right. These results indicate that the entire 810 m ramp section now exceeds the 1.6 threshold, providing a robust safety margin for long-term stability. The refined layout also produced a more uniform SF field, especially at the crown and sidewalls, which previously controlled the design. Overall, the optimization confirms that reducing rockbolt spacing is an effective reinforcement measure, bringing the excavation into the target safety range.
The 1040 m ramp section was the weakest and required the strongest support per the Q-system (Category 7). The empirical design specified >15 cm fiber-reinforced shotcrete with two rebar layers and 2.4 m bolts at 1.5 m spacing to achieve long-term stability. Given the critical ground, attaining a high safety factor was the primary objective. The layout was evaluated with FEM in RS2 to assess its performance under expected loads.
RS2 simulations of the empirical Category 7 support gave SF = 1.12–1.42 (Figure 20, left), below the ≥1.6 target for this highly stressed, deforming section. The design was, therefore, insufficient. To improve stability, bolt spacing was reduced from 1.5 m to 1.2 m (20% reduction) with other parameters unchanged. The optimized model returned SFmin = 1.73 and SFmax = 1.93 (Figure 20, right), i.e., +54% and +36%, respectively. All critical zones met or exceeded the requirement, and the SF field became more uniform, especially at the crown and sidewalls. Denser bolting is thus an effective reinforcement for weak ground and meets long-term operational needs.
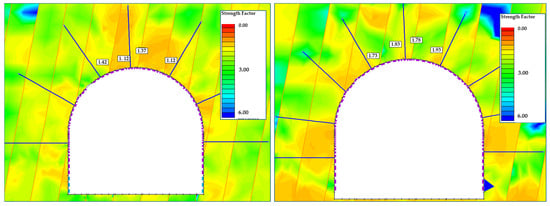
Figure 20.
FEM simulation Q-based rock support (left) and optimized to achieve minimum SF (right) for section 1040 (based on [31]).
Table 6 contrasts Q-system and FEM-derived bolt patterns. FEM consistently recommends tighter bolt spacing (17–22% reduction) than the empirical design, reflecting stress-driven optimization rather than conservative defaults. This refinement is required to reach the target strength factor of 1.6–1.8, as verified numerically. The Q-system is a practical starting point, while FEM calibrates the layout to improve stability and material efficiency. In complex geology, integrating empirical classification with FEM yields a more precise and cost-effective support design.
Table 6.
Rockbolt pattern comparison (Q-System vs FEM).
6. Conclusions
This study compared empirical support selection (Q-system) with an FEM-based design for the Gilar main haulage excavations. While the Q-system provided a practical baseline, FEM—by explicitly modeling in situ stresses and excavation-induced redistribution—yielded different, site-specific outcomes and highlighted critical zones (crown and shoulders) that the empirical approach did not fully resolve.
A key finding is that stability was frequently governed by the bolt pattern and local spacing. In several sections, repatterning and targeted spacing adjustments at the crown/sidewalls—while keeping bolt type and length, shotcrete thickness, and mesh unchanged, and often without increasing the total bolt count per round—were sufficient to raise the controlling strength factor into the project target band. In other words, careful layout optimization can increase stability without increasing material quantities, improving both safety and cost efficiency.
The target SF = 1.6–1.8 adopted here was recommended by Gilar mine experts and was achieved by stress-informed refinement of bolt spacing. This combined workflow—empirical classification for rapid scoping followed by FEM to tune the support to actual stress paths—proved effective and operationally realistic for long-life ramps exposed to blasting and potential dynamic effects, while maintaining economic discipline.
To clarify cases where the preset target was not fully achieved, the adopted SF criterion (1.6–1.8) should be understood as a long-term design objective for the main excavation, while localized SF minima may still occur near geometric irregularities and during intermediate excavation/support installation stages. For this reason, the optimization was intentionally limited to realistic and constructible support modifications (primarily bolt spacing/pattern and shotcrete thickness), and any remaining low-SF pockets should be treated as zones requiring staged reinforcement and enhanced monitoring. The optimized support scheme presented here is, therefore, proposed as a practical design-update workflow, whose on-site performance should be verified using routine monitoring data (e.g., convergence measurements, bolt load monitoring, and damage mapping) and, where possible, supported by back-analysis of observed deformation. Potential discrepancies between numerical predictions and field response are expected to arise mainly from uncertainties in rock mass parameters, simplified representation of discontinuities, and inherent limitations of 2D modeling; consequently, a site-specific calibration step is recommended prior to full implementation in routine design.
Limitations of the present work include the use of 2D analyses and assumed joint-infill properties (defaults in RS2 due to lack of laboratory tests). Nevertheless, the relative conclusions are robust: numerical modeling refines empirical layouts, identifies where immediate support is critical, and shows that optimized bolt spacing can deliver the required safety margins without systematic cost escalation. Future extensions should consider 3D FEM, tighter calibration with monitoring, and targeted high-fidelity modeling only in zones where fracture processes dominate.
Finally, it needs to be highlighted that the proposed classification-to-modeling workflow is readily transferable and can be applied in any underground mine as a fast, practical decision-support method for support design and refinement. It enables rapid testing of alternative support layouts while explicitly accounting for variable inputs (e.g., stress levels and anisotropy, excavation geometry, sequencing, and support parameters), making it well suited for iterative optimization under real operational constraints. Compared with the Q-system alone, the numerical approach provides a clear advantage by capturing site-specific stress redistribution and identifying localized critical zones that empirical charts may overlook, thereby supporting more reliable, tailored designs with improved safety and cost control.
Author Contributions
Conceptualization, S.I. and K.F.; methodology, S.I. and K.F.; software, S.I. and K.F.; validation, K.F. and K.A.-P.; formal analysis, S.I.; investigation, S.I. and K.F.; resources, S.I. and A.V.; data curation, S.I.; writing—original draft preparation, S.I., K.F., K.A.-P. and A.V.; writing—review and editing, S.I., K.F., K.A.-P. and A.V.; visualization, S.I.; supervision, K.F.; project administration, S.I. and A.V.; funding acquisition, K.A.-P. and A.V. All authors have read and agreed to the published version of the manuscript.
Funding
APC was funded with the research subsidy of the Polish Ministry of Science and Higher Education, granted for 2025.
Data Availability Statement
The raw data supporting the conclusions of this article will be made available by the authors on request.
Acknowledgments
The authors gratefully acknowledge Reza Vaziri, President of Azerbaijan International Mining Company Limited, as well as the entire company leadership and all AIMC employees for their expert support during data acquisition and interpretation, and for providing access to datasets essential for the analyses presented in this study. This article was prepared as a concise synthesis of the research conducted within the master’s thesis “Design and numerical modelling of ground support systems in underground mine Gilar using rock mechanics principles” (Ismayilov, 2025 [31]; doi: 10.34901/mul.pub.2025.106).
Conflicts of Interest
Author Suleyman Ismayilov and Anar Valiyev were employed by the company Azerbaijan International Mining Company Limited. Author Krzysztof Fuławka was employed by the company Rock Engineering Department, KGHM Cuprum Ltd. Research & Development Centre. The remaining authors declare that the research was conducted in the absence of any commercial or financial relationships that could be construed as a potential conflict of interest.
References
- Hoek, E.; Brown, E.T. Chapter 14: Rock Bolts and Cables. In Rock Mechanics for Underground Mining; Springer: Dordrecht, The Netherlands, 2006. [Google Scholar]
- Kaiser, P.K.; Cai, M. Design of Rock Support System under Rockburst Condition. J. Rock Mech. Geotech. Eng. 2012, 4, 215–227. [Google Scholar] [CrossRef]
- Lubryka, D.; Madziarz, M. Underground Testing of Load Bearing Capacity of Rock Bolting as Part of the Verification of Its Proper Selection. Min. Sci. 2023, 30, 63–81. [Google Scholar] [CrossRef]
- Madziarz, M. Monitoring system of rockbolting interaction in rock mass conduct under seismic activity in undeground mines. In Proceedings of the 17th International Multidisciplinary Scientific GeoConference SGEM 2017, Albena, Bulgaria, 29 June–5 July 2017. [Google Scholar]
- Varelija, M.; Hartlieb, P. Designing Intelligent Rock Support Systems to Detect Gravity-Driven Wedges. Rock. Mech. Rock. Eng. 2025, 58, 4527–4541. [Google Scholar] [CrossRef]
- Fuławka, K.; Stolecki, L.; Szumny, M.; Pytel, W.; Jaśkiewicz-Proć, I.; Jakić, M.; Nöger, M.; Hartlieb, P. Roof Fall Hazard Monitoring and Evaluation—State-of-the-Art Review. Energies 2022, 15, 8312. [Google Scholar] [CrossRef]
- Pytel, W.; Mertuszka, P.; Fuławka, K.; Lurka, A.; Pałac-Walko, B. Resultant Axial Stresses in Instrumented Rockbolts Induced by Dynamic Effects Occurred Due to Multi-Face Blasting in the Working Areas. Tunn. Undergr. Space Technol. 2021, 116, 104088. [Google Scholar] [CrossRef]
- Fuławka, K.; Pytel, W.; Szumny, M.; Mertuszka, P.; Pałac-Walko, B.; Hartlieb, P.; Jakić, M.; Nöger, M. Prototype of Instrumented Rock Bolt for Continuous Monitoring of Roof Fall Hazard in Deep Underground Mines. Sensors 2022, 23, 154. [Google Scholar] [CrossRef] [PubMed]
- Brady, B.H.G.; Brown, E.T. Rock Mechanics for Underground Mining, 3rd ed.; Springer: Dordrecht, The Netherlands, 2006; ISBN 9781402021169, 9781402020643. [Google Scholar]
- Adach-Pawelus, K.; Pawelus, D. Influence of Driving Direction on the Stability of a Group of Headings Located in a Field of High Horizontal Stresses in the Polish Underground Copper Mines. Energies 2021, 14, 5955. [Google Scholar] [CrossRef]
- Pawelus, D.; Adach-Pawelus, K.; Butra, J. Issue of Selecting Stress Field Parameters for the Analysis of Mining Excavation Stability Using Numerical Methods in the Conditions of the LGCB Mines. Appl. Sci. 2025, 15, 12365. [Google Scholar] [CrossRef]
- Adach-Pawelus, K.; Szyry, N. Influence of a Type of Rock Mass on the Stability of Headings in Polish Underground Copper Mines Based on Boundary Element Method. Energies 2022, 15, 5837. [Google Scholar] [CrossRef]
- Elrawy, W.R.; Abdelhaffez, G.S.; Saleem, H.A. Stability assessment of underground openings using different rock support systems. MGPB 2020, 35, 49–63. [Google Scholar] [CrossRef]
- Skrzypkowski, K.; Korzeniowski, W.; Zagórski, K.; Zagórska, A. Modified Rock Bolt Support for Mining Method with Controlled Roof Bending. Energies 2020, 13, 1868. [Google Scholar] [CrossRef]
- Barton, N.; Grimstad, E. Q-System—An Illustrated Guide Following Forty Years in Tunnelling; Technical Report. 2014. Available online: http://www.nickbarton.com (accessed on 14 January 2024).
- Bieniawski, Z.T. Rock Mass Classification in Rock Engineering. In Exploration for Rock Engineering; Bieniawski, Z.T., Ed.; A.A. Balkema: Cape Town, South Africa, 1976; Volume 1, pp. 97–106. [Google Scholar]
- Potvin, Y.; Hadjigeorgiou, J. Empirical Ground Support Design of Mine Drives. In Proceedings of the International Seminar on Design Methods in Underground Mining; Australian Centre for Geomechanics, Perth, Australia, 17–19 November 2015; pp. 419–430. [Google Scholar]
- Norwegian Geotechnical Institute (NGI). Using the Q-System: Rock Mass Classification and Support Design; NGI Report; NGI: Oslo, Norway, 2015. [Google Scholar]
- Palmstrom, A.; Broch, E. Use and Misuse of Rock Mass Classification Systems with Particular Reference to the Q-System. Tunn. Undergr. Space Technol. 2006, 21, 575–593. [Google Scholar] [CrossRef]
- Sebbeh-Newton, S.; Abdulazeez Shehu, S.; Ayawah, P.; Kaba, A.A.; Zabidi, H. Analytical and Numerical Assessment of a Preliminary Support Design—A Case Study. Cogent Eng. 2021, 8, 1869367. [Google Scholar] [CrossRef]
- Kanik, M.; Gurocak, Z. Importance of Numerical Analyses for Determining Support Systems in Tunneling: A Comparative Study from the Trabzon-Gumushane Tunnel, Turkey. J. Afr. Earth Sci. 2018, 143, 253–265. [Google Scholar] [CrossRef]
- Marinos, P.; Hoek, E. Estimating the Geotechnical Properties of Heterogeneous Rock Masses Such as Flysch. Bull. Eng. Geol. Environ. 2001, 60, 85–92. [Google Scholar] [CrossRef]
- Zienkiewicz, O.C.; Taylor, R.L. The Finite Element Method. 2: Solid Mechanics; Butterworth-Heinemann: Oxford, UK, 2003; ISBN 9780750650557. [Google Scholar]
- Cundall, P.A.; Hart, R.D. Numerical modelling of discontinua. Eng. Comput. 1992, 9, 101–113. [Google Scholar] [CrossRef]
- Shen, B.; Stephansson, O.; Rinne, M. Modelling Rock Fracturing Processes: A Fracture Mechanics Approach Using FRACOD; Springer: Dordrecht, The Netherlands, 2014; ISBN 9789400769038, 9789400769045. [Google Scholar]
- Shapka-Fels, T.; Elmo, D. Numerical Modelling Challenges in Rock Engineering with Special Consideration of Open Pit to Underground Mine Interaction. Geosciences 2022, 12, 199. [Google Scholar] [CrossRef]
- Kulatilake, P.H.S.W.; Chen, J.; Teng, J.; Pan, G.; Shufang, X. Discontinuity network modeling of the rock mass around a tunnel close to the proposed permanent shiplock area of the Three Gorges Dam site in China. In Proceedings of the 35th U.S. Symposium on Rock Mechanics (USRMS), Lake Tahoe, NV, USA, 5–7 June 1995; pp. 807–812. [Google Scholar]
- Ghasemi, E.; Ataei, M.; Shahriar, K.; Sereshki, F.; Jalali, S.E.; Ramazanzadeh, A. Assessment of Roof Fall Risk during Retreat Mining in Room and Pillar Coal Mines. Int. J. Rock Mech. Min. Sci. 2012, 54, 80–89. [Google Scholar] [CrossRef]
- Gurocak, Z.; Solanki, P.; Zaman, M.M. Empirical and Numerical Analyses of Support Requirements for a Diversion Tunnel at the Boztepe Dam Site, Eastern Turkey. Eng. Geol. 2007, 91, 194–208. [Google Scholar] [CrossRef]
- Vlachopoulos, N.; Carrapatoso, C.; Holt, S.W.; Cruz, D.; Forbes, B. An Investigation into Support Interaction of Ground Support Through Numerical Modelling and Laboratory Testing. Geotech. Geol. Eng. 2020, 38, 5719–5736. [Google Scholar] [CrossRef]
- Ismayilov, S. Design and Numerical Modelling of Ground Support Systems in Underground Mine Gilar Using Rock Mechanics Principles. Master’s Thesis, Montanuniversität Leoben, Leoben, Austria, 2025. [Google Scholar]
- Deere, D.U.; Deere, D.W. Rock Quality Designation (RQD) After Twenty Years; Contract Report GL-89-1; U.S. Army Engineer Waterways Experiment Station: Vicksburg, MS, USA, 1989. [Google Scholar]
- Grimstad, E.; Barton, N. Updating the Q-system for NMT. In Proceedings of the International Symposium on Sprayed Concrete, Fagernes, Norway, 17–21 October 1993. [Google Scholar]
- Barton, N. Some new Q-value correlations to assist in site characterization and tunnel design. Int. J. Rock Mech. Min. Sci. 2002, 39, 185–216. [Google Scholar] [CrossRef]
- Høien, A.H.; Nilsen, B.; Olsson, R. Main Aspects of Deformation and Rock Support in Norwegian Road Tunnels. Tunn. Undergr. Space Technol. 2019, 86, 262–278. [Google Scholar] [CrossRef]
- Pawelus, D. Stability Assessment of Headings Situated in a Field of High Horizontal Stress in Polish Copper Mines by Means of Numerical Methods. IOP Conf. Ser. Earth Environ. Sci. 2019, 221, 012097. [Google Scholar] [CrossRef]
- Pawelus, D.; Butra, J. Numerical Methods as an Aid in the Selection of Roof Bolting Systems for Access Excavations Located at Different Depths in the LGCB Mines. Appl. Sci. 2024, 14, 7052. [Google Scholar] [CrossRef]
- Ciantia, M.O.; Arroyo, M.; Kaiser, P. Application of a Bonded Critical State Model to Design Tunnel Support for Rockmass Bulking. IOP Conf. Ser. Earth Environ. Sci. 2021, 833, 012162. [Google Scholar] [CrossRef]
- Hoek, E. Practical Rock Engineering; 2023 Edition; Rocscience: Toronto, ON, Canada, 2023; Available online: https://www.rocscience.com/learning/hoeks-corner (accessed on 4 November 2025).
- Fuławka, K.; Stolecki, L.; Jaśkiewicz-Proć, I.; Kołodziej, R. The Use of Large-Scale 3D Numerical Modeling to Identify Areas of Increased Seismic Risk in Polish Underground Copper Mines. In Proceedings of the 7th International Conference on Geotechnical and Geophysical Site Characterization, Barcelona, Spain, 18–21 June 2024; CIMNE: Barcelona, Spain, 2024. [Google Scholar]
- Zhang, H.; Adoko, A.C.; Meng, Z.; Wang, H.; Jiao, Y. Mechanism of the Mudstone Tunnel Failures Induced by Expansive Clay Minerals. Geotech. Geol. Eng. 2017, 35, 263–275. [Google Scholar] [CrossRef]
- Krawiec, K.; Czarny, R. Comparison of an Empirical S-Wave Velocity Model and a Calculated Stress-Strain Model for a Rock Mass Disturbed by Mining. E3S Web Conf. 2017, 24, 03001. [Google Scholar] [CrossRef]
- Wojtecki, L.; Krawiec, K.; Ćwiękała, M.; Dzik, G. An Attempt to Determine the Cause of the Strong Tremor Responsible for a Rockburst in a Hard Coal Mine Based on Numerical Modeling and Spectral Parameter. Geol. Geophys. Environ. 2024, 50, 323–340. [Google Scholar] [CrossRef]
- Saadat, M.; Khishvand, M.; Seccombe, A. FLAC3D Simulation of Caving Mechanism and Strata Fracture Response in Underground Mining. Mining 2024, 4, 818–840. [Google Scholar] [CrossRef]
- Deb, D.; Das, K.C. Modelling of Fully Grouted Rock Bolt Based on Enriched Finite Element Method. Int. J. Rock Mech. Min. Sci. 2011, 48, 283–293. [Google Scholar] [CrossRef]
- Jalalifar, H.; Aziz, N. Numerical Simulation of Fully Grouted Rock Bolts. In Numerical Simulation—From Theory to Industry; Andriychuk, M., Ed.; InTech: Nappanee, IN, USA, 2012; ISBN 9789535107491. [Google Scholar]
- Aziz, N.; Marston, K.; Mirzaghorbanali, A. (Eds.) Proceedings of the 2023 Resource Operators Conference: 9–10 February 2023; University of Wollongong: Wollongong, Australia, 2023; ISBN 9781741283686. [Google Scholar]
- Ghadimi Chermahini, A.; Tahghighi, H. Numerical Finite Element Analysis of Underground Tunnel Crossing an Active Reverse Fault: A Case Study on the Sabzkouh Segmental Tunnel. Geomech. Geoengin. 2019, 14, 155–166. [Google Scholar] [CrossRef]
- Su, Y.; Vlachopoulos, N. Numerical Modelling of Fully Grouted Rock Bolts Using a 2D Finite Element Method. In Proceedings of the GeoVirtual 2020, Online, 14–16 September 2020. [Google Scholar]
- Wang, T.; Fan, B.; Khadka, S.S. Flowchart of DEM Modeling Stability Analysis of Large Underground Powerhouse Caverns. Adv. Civ. Eng. 2020, 2020, 8874120. [Google Scholar] [CrossRef]
- Zhou, P.; Bazargan, M.; Lanaro, F.; Shirzadegan, S.; Nikadat, N.; Warema, S.; Yi, C.; Nordlund, E. Dynamic Modelling of Rock Bolts at Kiirunavaara Mine; BeFo Report 244; BeFo—Rock Engineering Research Foundation: Stockholm, Sweden, 2024; ISBN BEFO-R-244-SE. ISSN 1104-1773. [Google Scholar]
- Munjiza, A. The Combined Finite-Discrete Element Method, 1st ed.; Wiley: Hoboken, NJ, USA, 2004; ISBN 9780470841990. [Google Scholar]


Disclaimer/Publisher’s Note: The statements, opinions and data contained in all publications are solely those of the individual author(s) and contributor(s) and not of MDPI and/or the editor(s). MDPI and/or the editor(s) disclaim responsibility for any injury to people or property resulting from any ideas, methods, instructions or products referred to in the content. |
© 2025 by the authors. Licensee MDPI, Basel, Switzerland. This article is an open access article distributed under the terms and conditions of the Creative Commons Attribution (CC BY) license.