Abstract
Ground instability represents a major environmental hazard in the Loess Hilly region of Northwest China, threatening infrastructure and human safety. This study establishes an integrated information-theoretic framework for evaluating regional instability risk by coupling the information value model with analytic hierarchy process (AHP) weighting and subsequent hazard–exposure synthesis. Seven conditioning factors—geomorphic type, slope, aspect, lithology, distance to faults, river system, and NDVI—were analyzed to derive susceptibility, while rainfall, peak ground acceleration, and human engineering activity were incorporated as triggering elements of hazard. Exposure was quantified from population density and infrastructure exposure, and overall risk was defined as the product of hazard and exposure after normalization and calibration. Results indicate that hilly landforms, slopes of 10–20°, and NDVI values between 0.3 and 0.6 are the dominant controls on instability occurrence. Extreme-risk zones are concentrated in central Guyuan and northwest Shizuishan (0.16% of the study area), with high-risk zones covering 21.87%, moderate-risk zones covering 41.65%, and low-risk zones covering 6.32%. Model validation yields an AUC of 0.833 and a consistent increase in observed disaster-point density from low to extreme classes, confirming strong predictive reliability. These results demonstrate that the proposed calibrated framework provides a practical and transferable tool for ground-instability risk assessment and land-use planning in loess terrains.
1. Introduction
Ground instability, including landslides, debris flows, and collapses, poses persistent threats to infrastructure, land-use safety, and socio-economic development in regions with fragile loess terrain. The Loess Hilly region of Northwest China is particularly prone to such hazards due to its steep slopes, unconsolidated loess deposits, and intensive human disturbance. In recent years, repeated instability events have led to severe losses of life and property, highlighting the urgent need for accurate and spatially explicit hazard–risk assessments to support disaster mitigation and territorial planning [1,2,3,4,5].
Early investigations into mass movement susceptibility primarily employed qualitative or semi-quantitative approaches, relying heavily on expert judgment, such as overlay analysis, index weighting, and hierarchical scoring methods [6,7,8,9]. With advancements in geographic information systems (GIS) and computational modeling, these traditional approaches have progressively evolved toward fully quantitative techniques. Widely adopted models include Frequency Ratio (FR), Logistic Regression (LR), and Weight-of-Evidence (WoE), as well as data-driven and machine-learning algorithms such as Random Forest (RF), Support Vector Machine (SVM), and Artificial Neural Networks (ANN) [10,11]. These methods have substantially enhanced predictive accuracy by capturing nonlinear relationships between conditioning factors and hazard occurrence.
At the regional scale, numerous studies have demonstrated that the Loess Plateau of Northwest China—particularly the Ningxia Hui Autonomous Region—exhibits a unique combination of geomorphic, climatic, and lithologic conditions that promote frequent mass movements [12,13,14,15,16,17,18]. The area’s thick unsaturated loess, high relief energy, and seasonal rainfall create favorable conditions for landslides and debris flows, often exacerbated by agricultural reclamation and infrastructure development. Consequently, Ningxia and its surrounding areas have become typical regions for studying the evolution and risk mechanisms of loess-related ground instabilities.
Internationally, a growing number of large-scale studies have advanced quantitative hazard assessment methods. These include multi-factor probabilistic analyses and physically based models that incorporate hydrological and seismic triggers, as demonstrated in Italy, the United States, and other regions [19,20,21,22]. In particular, national- and regional-scale quantitative risk assessment (QRA) has recently evolved substantially. For example, ref. [23] developed a nationwide QRA framework for Italy, integrating hazard frequency, exposure distribution, and expected losses into a unified model, while [24] proposed a regional methodology for slow-moving landslide risk that emphasized proper definition and separation of hazard, exposure, and vulnerability components. In the United States, ref. [25] introduced a cost-effective, regional-scale landslide risk assessment strategy for Eastern Kentucky, demonstrating how exposure density can be evaluated under limited-data conditions. Machine-learning-assisted QRA has also emerged, such as the InSAR–ML hybrid model by [26], which improves both spatial and temporal representation of hazard evolution.
Global and regional guidelines have further emphasized the integration of susceptibility, hazard, and risk mapping as essential tools for land-use management [27]. At the same time, conventional GIS-based frameworks and inventory-driven models remain foundational to hazard mapping and validation [28], while recent progress has expanded their scope to incorporate rainfall and ground-shaking triggers through satellite and near-real-time data [29,30]. More recently, ensemble and hybrid frameworks that combine statistical, heuristic, and data-driven methods have shown improved accuracy, interpretability, and transferability across diverse geological environments [31,32,33,34]. However, purely statistical or data-driven models often face limitations in interpretability, regional adaptability, and the calibration between susceptibility, hazard, and exposure—issues that constrain their effectiveness in comprehensive risk evaluation.
To address these challenges, this study proposes an integrated, information-theoretic framework that couples the Information Value (IV) model with Analytic Hierarchy Process (AHP) weighting for the evaluation of ground-instability susceptibility and risk in the Loess Hilly region of Northwest China. The framework quantitatively integrates multiple conditioning and triggering factors—including geomorphology, lithology, slope, vegetation, rainfall, and seismic activity—while calibrating their interactions through expert weighting and statistical validation. The main objectives are to: (1) establish a hybrid IV-AHP model to enhance interpretability and reduce subjectivity; (2) delineate susceptibility, hazard, exposure, and risk zones through multi-source data fusion; and (3) verify model performance using receiver operating characteristic (ROC) analysis. This research provides a transferable approach for ground-instability risk assessment in loess terrains and offers a scientific basis for regional disaster prevention and sustainable land-use planning.
2. Geographical and Geological Background
The study area is located in the Ningxia Hui Autonomous Region, situated in the transitional zone between the eastern margin of the Qinghai–Tibet Plateau and the western edge of the Loess Plateau (coordinates: E 104°17′–107°39′, N 35°14′–39°23′). It encompasses the middle to upper reaches of the Yellow River and extends approximately 465 km from north to south, with an east–west width ranging from 45 km to 250 km. The total area covers around 66,400 km2, featuring diverse geomorphological units and a vertically differentiated topographic profile (Figure 1).
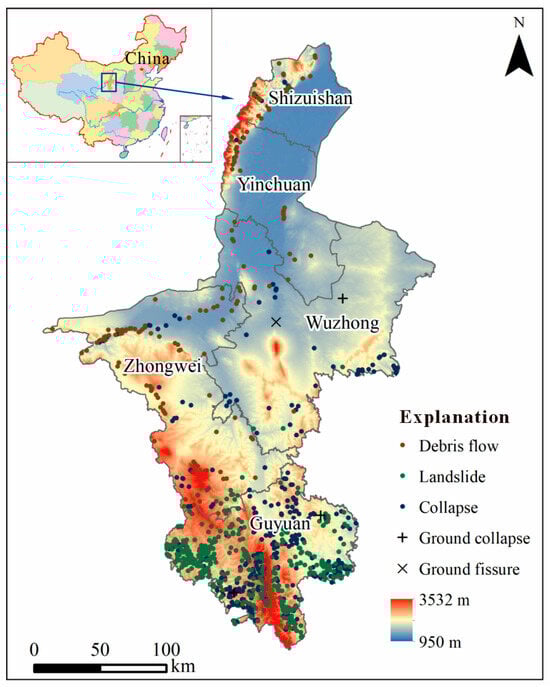
Figure 1.
Geographic location and topographic setting of the study area in the Loess Hilly Region of Ningxia, Northwest China, including elevation contours and the spatial distribution of recorded mass movement points (landslides, collapses, debris flows, ground fissures). Major cities and counties are labeled for reference. Coordinate reference: WGS-84 UTM Zone 48 N; gridlines omitted for map clarity.
The terrain of the region is characterized by significant elevation variation, with altitudes ranging from about 1100 m in the northern plains to over 2000 m in the southern hilly and mountainous zones. From north to south, the region transitions from fluvial plains to intermontane basins and finally to deeply dissected loess hills. These loess-dominated uplands exhibit steep slopes, deep gullies, and widespread signs of surface erosion, forming a geomorphic environment highly prone to mass movement processes.
The climate is semi-arid, dominated by monsoonal influence. Annual precipitation ranges from 200 to 600 mm, with strong spatial gradients—rainfall increases significantly from north to south. Most precipitation is concentrated in the summer months, often in the form of short-duration, high-intensity convective storms. Coupled with high evaporation rates and poor vegetation cover in many parts, this climatic regime contributes to recurrent slope instability.
From a geological perspective, the region is structurally complex and seismically active. It lies near the Alxa–Ordos tectonic junction, where neotectonic uplift and fault activity have created a fragmented bedrock foundation. Loess deposits, with thicknesses up to 100 m in places, blanket much of the terrain. The loose, unconsolidated nature of these deposits, combined with slope steepness and rainfall infiltration, makes the area particularly vulnerable to landslides, collapses, and debris flows.
According to regional geological disaster monitoring data, as of June 2024, a total of 1038 potential hazard sites have been identified, including 437 landslides, 443 collapses, 154 debris flows, three ground collapses, and one ground fissure. These hazards threaten the safety of approximately 18,600 residents. The most concentrated and severe hazards are found in the southern mountainous areas, particularly within the five counties of Guyuan City. These zones correspond closely with steep terrain, sparse vegetation, and active fault development.
3. Methodology
3.1. Evaluation Framework
The comprehensive mass movement risk assessment in this study is established on a multi-source data fusion and model-coupling framework that integrates the Information Value (IV) model, the Analytic Hierarchy Process (AHP), and the Weighted Information Value (WIV) method. This combination is designed to harness the strengths of both statistical and expert-based approaches—balancing objectivity with geological reasoning—to better capture the spatial heterogeneity and multi-factorial nature of ground instability formation in loess terrains.
The workflow comprises four main stages: (1) data acquisition and preprocessing, including the collection of conditioning and triggering factors such as topography, lithology, vegetation, and seismic data; (2) susceptibility evaluation using the IV model to quantify the relative contribution of each factor to hazard occurrence; (3) weighting of these factors through AHP to incorporate expert judgment and to mitigate redundancy among correlated variables; and (4) model integration using the WIV approach to synthesize the results into a spatial susceptibility index, followed by overlay analysis with exposure indicators to generate risk maps.
This multi-level framework provides a transparent and reproducible pathway to assess ground-instability hazards in complex terrain settings, similar to integrated approaches adopted in other large-scale assessments [19,21,31]. The use of both bivariate statistics and expert-derived weights ensures that the model is both data-driven and interpretable, thereby improving its regional adaptability and practical applicability in land-use planning and disaster mitigation.
3.1.1. Information Value (IV) Model
In this study, the Information Quantity (IQ) method was employed to evaluate the susceptibility and hazard of mass movements. As a bivariate statistical model grounded in information theory, the IQ model quantifies the informational contribution of different classes within each conditioning factor to the occurrence of mass movements, thereby elucidating their role in the development and propagation of such events [35,36].
This method is considered objective, computationally efficient, and widely used in susceptibility assessment practices. In the context of mass movement risk analysis, the IQ model evaluates each factor’s relative contribution based on its class-specific influence compared to a baseline or average level across the entire study area [37]. An IQ value less than 0 indicates that the specific class of an influencing factor reduces the likelihood of hazard occurrence, while a value greater than 0 suggests an increased susceptibility associated with that class. An IQ value of 0 implies that the factor class offers no additional information regarding hazard potential within the designated interval.
In this study, the IQ model is applied to quantitatively divide the study area into zones of varying susceptibility. Given that geological disasters are typically the result of complex interactions among multiple conditioning variables, the IQ method enables a disaggregated interpretation of these influences, highlighting the most sensitive factor intervals in specific geological settings [38]. The total information conveyed by the combination of multiple factors within each classified interval can be calculated using Formula (1).
where I(xi, D) denotes the information quantity (IQ) that the evaluation factor xi contributes to the mass movement occurrence D. Specifically, Ni represents either the number or spatial area of mass movement events corresponding to the ith interval of factor x, while Si is the total area occupied by that factor interval across the study region. N denotes the total number or area of all mass movement occurrences in the study area, and S represents the entire area of the study region.
To ensure adequate spatial resolution for analysis, the entire study area was discretized into grid units measuring 25 m × 25 m. This resolution balances computational efficiency with spatial precision and facilitates the integration of rasterized factor layers during subsequent GIS-based processing.
3.1.2. Analytic Hierarchy Process (AHP)
The Analytic Hierarchy Process (AHP) is a structured and systematic approach widely used in multi-criteria decision-making, particularly effective in situations involving both qualitative and quantitative factors [39,40]. In this study, AHP is employed to determine the relative weights of mass movement evaluation indicators, offering a transparent and logic-based framework for incorporating expert knowledge into the risk modeling process.
The AHP procedure begins with the construction of a hierarchical structure, which organizes the evaluation factors into multiple levels based on their causal relationships or thematic relevance. Pairwise comparisons are then conducted to assess the relative importance of each factor with respect to others at the same hierarchical level. These comparisons form a judgment matrix, which reflects the decision-maker’s preferences.
The priority weights of each factor are calculated using either the eigenvalue method (root method) or the normalized sum-product method. The derived feature vector and maximum eigenvalue are used to evaluate consistency through a consistency ratio (CR). A CR value less than 0.1 is generally accepted as indicative of a logically coherent matrix, ensuring that the derived weights are both mathematically and logically reliable [41].
3.1.3. Weighted Information Value (WIV) Method
This study employs the weighted Information Quantity (IQ) method to evaluate mass movement risk, combining the strengths of both statistical inference and expert-based judgment. The approach integrates the Analytic Hierarchy Process (AHP) for factor weighting with the IQ model for factor classification analysis.
Specifically, the process begins with determining the relative importance (weights) of each conditioning factor via AHP, thereby reflecting the subjective knowledge and experience of domain experts. These weights capture the perceived influence of each factor on hazard occurrence. Following this, the IQ model is applied to calculate the information quantity of each class interval under all factors, based on the statistical relationship between factor levels and historical hazard distributions.
Finally, the weight of each factor is multiplied by the corresponding IQ value of its class to obtain a composite weighted information quantity. This cumulative value synthesizes the spatial contribution and relative significance of all conditioning factors, resulting in a more refined and interpretable risk index map [42]. The formula for computing the weighted IQ is expressed as follows.
where Wi denotes the weight of the ith evaluation indicator, as derived from the Analytic Hierarchy Process. IQi represents the information quantity value of the corresponding class interval for factor i, obtained via the bivariate statistical IQ model. The weighted information value is computed by multiplying the factor’s weight by its IQ value, reflecting both the statistical correlation and expert-judged importance of the factor. This calculation integrates multiple evaluation layers to generate a composite risk indicator used in spatial mapping and classification.
3.2. The Selection of Influence Factors and Data Sources
The development of ground-instability hazards in the Loess Hilly Region is controlled by multiple natural and anthropogenic factors. These factors can be broadly grouped into (1) intrinsic conditioning elements such as topography, geomorphic type, lithology, geological structure, and vegetation cover; and (2) extrinsic triggering agents including rainfall, seismic shaking, and human engineering activity [2,43]. To comprehensively represent these influences, this study constructs a factor-system framework comprising geomorphic, geological, environmental, external, and socio-economic components.
The geomorphic component includes geomorphic type, slope, and aspect. Elevation was excluded to prevent multicollinearity with slope, as previous studies have demonstrated a strong positive correlation between them [44]. The geological component considers rock-and-soil mass types and distance to fault zones, which jointly reflect the mechanical integrity and deformation susceptibility of the substrate. The environmental component incorporates vegetation cover, represented by the Normalized Difference Vegetation Index (NDVI), and the hydrological setting derived from the drainage network and river-system hierarchy.
The external component captures short-term dynamic processes including precipitation intensity and seismic activity, both of which directly trigger slope failures. Rainfall data were obtained from the China Meteorological Administration, representing a 30-year average (1993–2022) with a spatial resolution of 1 km. Peak Ground Acceleration (PGA) values were taken from the China Seismic Intensity Zonation Map (1:1,000,000) published by the China Earthquake Administration. The geological map used in this study is at a scale of 1:250,000, compiled from the Geological Survey of Ningxia and verified through field mapping.
The socio-economic component accounts for exposure and exposure conditions, using population density and the spatial distribution of buildings and major transportation corridors extracted from the National Bureau of Statistics (2020 census) and the OpenStreetMap (OSM) dataset. Land-use information was cross-referenced with Sentinel-2 Level-1C imagery (10 m resolution, 2023) to refine built-up areas. To avoid conceptual overlap, geomorphic type describes the physical landform morphology (e.g., hill, mountain, basin, plain), whereas land-use refers to human utilization patterns (e.g., urban, agricultural, forest) and was used only within the exposure evaluation.
All spatial layers were converted into 25 m × 25 m grid cells for uniform spatial analysis. Data preprocessing, projection unification (WGS-84 UTM Zone 48N), and raster normalization were performed using ArcGIS 10.8 and ENVI 5.6. The complete list of factor datasets and their sources is provided in Table 1.

Table 1.
Data sources.
3.3. Data Preprocessing and Model Implementation
To ensure data integrity, consistency, and comparability among multi-source spatial datasets, all thematic layers were standardized before model construction. Continuous variables such as slope, NDVI, and rainfall were normalized to a common scale using min–max rescaling, while categorical variables (e.g., lithology, geomorphic type, and fault proximity) were reclassified into discrete intervals based on thresholds defined by regional geological standards and prior empirical studies [45,46,47]. Each class was numerically encoded for model compatibility and cross-checked to avoid redundancy and overfitting.
To achieve uniform spatial granularity, all datasets were resampled to a grid resolution of 25 m × 25 m, using bilinear interpolation for continuous data and nearest-neighbor interpolation for categorical data. This resolution provided a balance between terrain precision and computational efficiency in loess and mountainous settings. Each grid cell was assigned a set of attribute values corresponding to the selected conditioning and triggering factors, forming the base dataset for subsequent calculations.
Model implementation was conducted in a GIS–Python hybrid environment. ArcGIS 10.8 was used for spatial operations, raster algebra, and projection unification, while Python 3.9 scripts were applied for automated information value computation and weight assignment. For each influencing factor, the information value (IV) was calculated according to the spatial association between historical instability events and factor categories. These values were then adjusted using AHP-derived weights to produce the weighted information value (WIV) for each grid unit, ensuring that both statistical and expert-based information were integrated into the susceptibility model.
Subsequently, the calibrated susceptibility, hazard, and exposure layers were integrated through a normalized multiplicative process to generate a comprehensive risk index. To maintain consistency across all evaluation components (susceptibility, hazard, and exposure) and to avoid sparsely populated classes in the regional-scale dataset, the resulting continuous risk map was reclassified into four categories—low, moderate, high, and extreme—using the Jenks natural breaks method.
To ensure consistency across all components of the assessment framework, all continuous datasets were uniformly reclassified into four levels (low, moderate, high, and extreme) using the Jenks natural breaks method. This choice avoids sparsely populated “very low” classes and ensures that susceptibility, hazard, and exposure adopt a coherent classification structure across the study. This systematic preprocessing and implementation workflow establishes a transparent, reproducible, and calibrated pathway for translating heterogeneous spatial datasets into a unified risk model. It effectively addresses previous limitations associated with uncalibrated overlays and inconsistent data scaling, providing a scientifically grounded foundation for subsequent spatial analysis and decision support.
3.4. Definitions of Risk, Hazard, and Exposure
Following internationally accepted guidelines for landslide and ground-instability assessment [27,48], risk (R) is defined as the combined effect of the probability of hazardous processes and the level of exposure of elements at risk. Accordingly, the overall risk index in this study is expressed as:
where H (Hazard) represents the spatial probability of occurrence of a mass movement event of a given magnitude. V (Exposure) represents the degree of loss of an exposed element (0–1), conditional on a mass movement of given intensity. E (Exposure) represents the value, density, or presence of elements at risk (population, infrastructure, assets).
R = H × V × E
In this study, specific exposure information (V) for individual buildings or infrastructure is not available; thus, following [23,25], we assume V = 1 (worst-case scenario), and the combined term V × E is treated as “effective exposure”.
R = H × (V × E) = H × E
This formulation is consistent with many regional-scale risk assessments where detailed structural exposure data are unavailable [23,25].
3.5. Model Validation and Rationale for Weighting Strategy
To ensure the reliability and scientific rigor of the susceptibility and risk assessments, the model was validated using both statistical performance metrics and expert-based weighting evaluation.
(1) Verification of susceptibility model using ROC analysis
The Receiver Operating Characteristic (ROC) curve was applied to evaluate the predictive performance of the susceptibility model. Due to the limited number of mapped mass movement events in the study area, the entire historical disaster inventory was used for validation following the widely adopted “success-rate” evaluation approach. This avoids sample-size reduction and ensures statistical representativeness. The AUC value of 0.833 indicates that the model achieves a high prediction accuracy.
(2) Expert elicitation for weight determination
The AHP weighting process incorporated the judgments of seven experts specializing in geomorphology, engineering geology, hydrogeology, and remote sensing interpretation. Each expert independently completed a pairwise comparison matrix. The final judgment matrix was obtained through geometric averaging, and all matrices satisfied the consistency requirement with CR < 0.1, demonstrating satisfactory logical coherence [8,13].
(3) Multi-stage hierarchical weighting
The weighting was performed across three hierarchical levels (criterion → sub-criteria → factor) rather than a single aggregated comparison, because the indicators belong to conceptually distinct groups (topography, geology, hydrology, land cover, anthropogenic influences). Forcing all indicators into one flat comparison would require evaluating logically unrelated factors directly against each other, potentially inflating or suppressing weights inappropriately [49,50].
The hierarchical weighting design ensures that: comparisons occur only within conceptually coherent groups, intermediate weights reflect factor relationships within each subsystem, and final global weights fully align with multi-criteria spatial analysis principles commonly adopted in AHP-based hazard modeling.
This multi-layered weighting strategy, combined with ROC-based validation, establishes a transparent and reproducible workflow for deriving susceptibility and risk maps and ensures a methodologically sound foundation for subsequent analysis.
4. Results
4.1. Susceptibility Evaluation
4.1.1. The IQ of Evaluation Indicators
The conditioning indicators governing ground-instability susceptibility in the Ningxia Loess Hilly Region were grouped into four primary domains: topography, geology, hydrology, and anthropogenic activity. Seven representative variables—geomorphic type, slope, aspect, lithology, distance to fault zones, surface-water distribution, and the normalized difference vegetation index (NDVI)—were selected for quantitative assessment. These parameters jointly characterize the intrinsic mechanical setting and the external surface processes that favor instability development.
According to the regional geomorphic framework and the spatial distribution of historical instability events, five landform categories were identified: mountains, hills, plateaus, deserts, and basins (Figure 2a). Hilly terrain proved most prone to ground failure, accounting for 74.6% of all recorded events (Table 2). This predominance reflects the combination of steep, irregular slopes, thick loess cover, and intense runoff concentration that together enhance shear stress within surface materials.
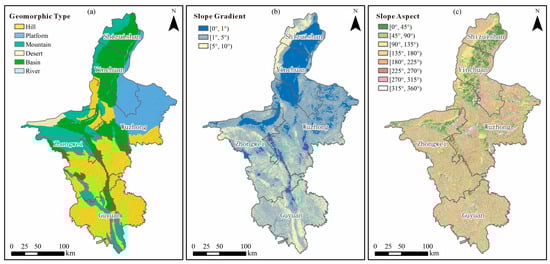
Figure 2.
Topographic indicator layers used in susceptibility assessment. (a) Geomorphic landforms classified into five major types (mountains, hills, plateaus, deserts, and basins). (b) Slope gradient map reclassified into five terrain-based intervals. (c) Aspect categories grouped into eight directional classes reflecting differential microclimatic influences. Coordinate reference: WGS-84 UTM Zone 48N; gridlines omitted for map clarity.
Table 2.
Information values (IQ) and associated metrics for each susceptibility indicator and classification type used in the risk assessment.
The regional slope gradient varies between 0° and 75°. Following standard geomorphological thresholds, five slope intervals were delineated: 0–1°, 1–5°, 5–10°, 10–20°, and 20–75° (Figure 2b). More than 83% of all instability occurrences lie within slopes steeper than 5°, while the 10–20° interval exhibits the highest concentration of events. These moderate slopes are steep enough to generate gravitational shear but gentle enough to accumulate thick, moisture-sensitive loess, explaining their dominant contribution to slope failures.
Aspect exerts a strong control on local hydrothermal regimes and soil-moisture dynamics. Eight directional intervals—0–45°, 45–90°, 90–135°, 135–180°, 180–225°, 225–270°, 270–315°, and 315–360°—were defined (Figure 2c). The greatest density of instability events occurs on south- and southwest-facing slopes (180–225°), followed by southeast-facing slopes (135–180°). Enhanced solar radiation on these aspects increases evapotranspiration, accelerates desiccation cracking, and reduces effective cohesion, thereby pre-conditioning slopes for failure once rainfall infiltration resumes.
Lithological and structural factors further amplify susceptibility. Nine representative rock-and-soil units were distinguished: hard rock, relatively hard rock, soft–hard interbedding, soft rock, relatively soft rock, gravel soil, silty clay, loess, and river deposits (Figure 3a). Loess alone covers 25.8% of the study area yet hosts 47.3% of instability events, highlighting its weak cementation, collapsibility, and strong water sensitivity. Fault proximity also plays a major role: zones within 0–1000 m of mapped faults display the highest event density (Figure 3b), indicating that fractured rock masses and preferential groundwater pathways near faults markedly lower slope stability.
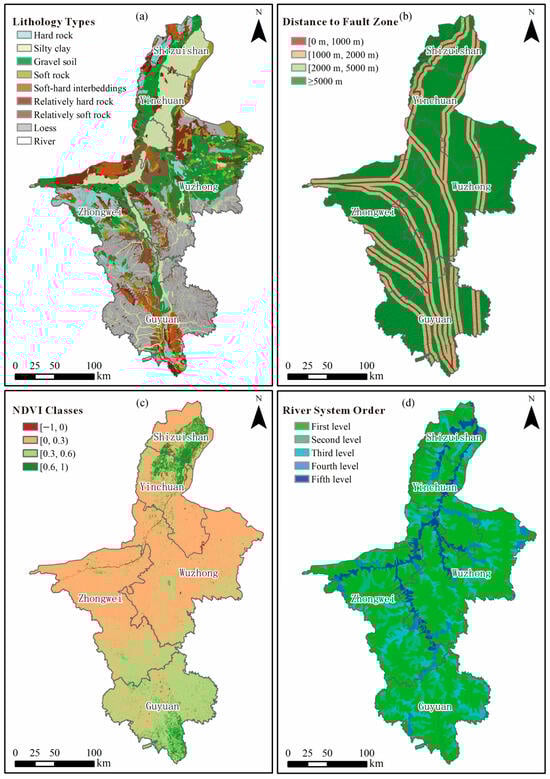
Figure 3.
Geological and environmental indicator layers. (a) Reclassified rock–soil mass types reflecting structural and lithological controls. (b) Distance-to-fault buffer zones (0–1000 m, 1000–2000 m, 2000–5000 m, >5000 m). (c) NDVI distribution categorized into four ecological intervals. (d) Watershed hierarchy levels derived from DEM-based hydrological analysis. Coordinate reference: WGS-84 UTM Zone 48 N; gridlines omitted for map clarity.
Vegetation exerts both stabilizing and destabilizing effects depending on coverage density. NDVI values were partitioned into four ecological ranges—0–0.3 (sparse), 0.3–0.6 (moderate), 0.6–1 (dense), and bare ground (no vegetation) (Figure 3c). The moderate-vegetation interval (0.3–0.6) shows the strongest correlation with instability occurrence, suggesting that slopes with partial coverage and weak loess substrates are most vulnerable because vegetation roots increase pore-pressure pathways while offering insufficient mechanical reinforcement.
Hydrological and geomorphic coupling is equally evident. Flow-accumulation analysis from the digital elevation model delineated five watershed hierarchy levels (Figure 3d). Third-order basins exhibit the highest instability density, reflecting runoff convergence, erosion intensification, and sediment re-mobilization processes that frequently initiate debris flows and shallow landslides.
Overall, the spatial pattern of susceptibility indicates that hilly loess terrain, moderate slopes (10–20°), and south-facing aspects represent the critical conditions for ground instability in Ningxia, with secondary modulation by lithology, fault structure, vegetation density, and drainage concentration.
4.1.2. Estimation of Indices Weights
To quantify the relative contribution of each conditioning factor to ground-instability susceptibility, a hierarchical decision-making structure was constructed to reflect the logical relationships among the indicators (Table 3). Within this framework, factors belonging to four domains—topography, geology, hydrology, and human activity—were organized into criterion and sub-criterion levels according to their functional relationships and potential influence magnitudes.
Table 3.
Hierarchical structure diagram of mass movement susceptibility evaluation.
The Analytic Hierarchy Process (AHP) was adopted to perform pairwise comparisons among indicators using Saaty’s 1–9 scale [41]. This approach transforms qualitative expert judgments into quantitative weights while maintaining the interpretability of decision logic. Each comparison matrix was completed by a group of domain specialists familiar with the loess-hill environment. The resulting judgment matrices express the dominance of one factor over another with respect to susceptibility contribution.
To ensure methodological rigor, a consistency ratio (CR) test was carried out for each matrix. When CR < 0.1, the comparison was deemed logically consistent; otherwise, the matrix was revised until the criterion was satisfied. The verified weights of individual indicators were then propagated upward through the hierarchy by multiplying local (sub-layer) weights with their corresponding parent (criterion-layer) weights to obtain final comprehensive weights. These results are summarized in Table 4, Table 5, Table 6, Table 7 and Table 8.
Table 4.
Comparative judgment matrix and weighs of criterion layer.
Table 5.
Comparative judgment matrix and weighs of index layer in B1.
Table 6.
Comparative judgment matrix and weighs of index layer in B2.
Table 7.
Comparative judgment matrix and weighs of index layer in B3.
Table 8.
Criterion and factor weights derived from the multi-stage AHP process.
The use of AHP provides a transparent and traceable means of integrating expert knowledge into quantitative modeling while avoiding the over-fitting risk typical of purely data-driven methods. Although alternative approaches such as entropy weighting or machine-learning-based feature importance could also be applied, AHP was preferred here because of its strong interpretability, its proven reliability in ground-instability mapping, and its ability to maintain consistency across multi-source datasets [19,21,31].
The final set of weights derived through this process was subsequently incorporated into the weighted information-value (WIV) model to refine susceptibility mapping. This combination of objective statistical evaluation and expert-guided weighting enhances both the precision and the physical interpretability of the ground-instability susceptibility assessment.
4.1.3. Results of Susceptibility Evaluation
Weighted overlay analysis of the seven conditioning factors produced a continuous susceptibility surface with total information-value scores ranging from −3.11 to 1.30 (Figure 4a). The spatially normalized results were classified into four levels—extreme, high, moderate, and low—using the Jenks natural-breaks optimization (Figure 4b). A four-class scheme was adopted to ensure consistency across all evaluation components (susceptibility, hazard, and exposure) and because the distribution of values in this regional dataset did not support a meaningful separation into five classes without producing sparsely populated categories [33,34].
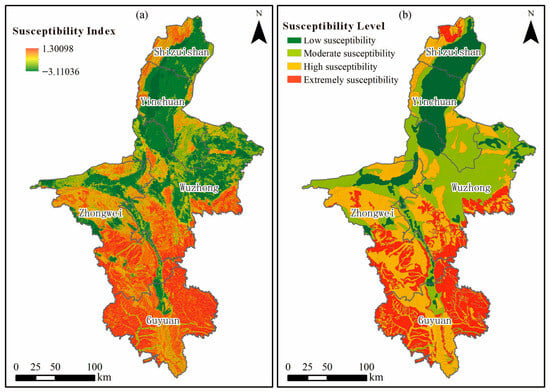
Figure 4.
Mass movement susceptibility mapping results. (a) Continuous Weighted Information Value (WIV) surface showing spatial variation in susceptibility. (b) Final susceptibility zoning map classified into five categories (very low, low, moderate, high, and very high) using the Jenks natural breaks method. Coordinate reference: WGS-84 UTM Zone 48N; gridlines omitted for map clarity.
Extreme-susceptibility zones are primarily concentrated in northern Shizuishan, the loess-hill terrain south of Zhongwei, the eastern and southern sectors of Wuzhong, and both the eastern and western margins of Guyuan. These zones collectively cover about 11,464 km2 (22.1% of the study area). Their elevated instability potential arises from the convergence of steep slopes, thick loess deposits with low cohesion, active fault zones, and intensive river-valley incision. These conditions promote deep-seated deformation, gully erosion, and loess-collapse failures, explaining the clustering of historical events.
High-susceptibility areas, totaling 17,371 km2 (33.4%), are mainly located in the western Shizuishan belt, the eastern and western flanks of Yinchuan, the southwestern margin of Wuzhong, and the central-Zhongwei and mid-Guyuan regions. Here, alternating loess–soft-rock strata, neotectonic uplift, and dense gully networks enhance differential weathering and shear concentration, thereby intensifying slope deformation processes.
Moderate-susceptibility regions (14,581 km2; 28.1%) are distributed mainly in southern Yinchuan, northern Wuzhong, and northern Zhongwei, where plains transition into loess hills. Although these zones lack extreme slopes or active faulting, the combined influence of variable lithology, moderate slopes, and intermittent rainfall still generates localized failures, particularly along road cuts and terrace margins. These transitional areas thus require focused monitoring during construction and land-use planning.
Low-susceptibility areas (8548 km2; 16.5%) are confined to central Shizuishan, central Yinchuan, and northwestern Wuzhong, with additional minor patches along broad river valleys. These stable terrains are characterized by gentle gradients, well-consolidated strata, and limited tectonic disturbance. Their geomorphological stability provides favorable conditions for urban expansion and infrastructure projects, subject to standard site-specific geotechnical verification.
Overall, the susceptibility pattern reveals a north–south gradient of increasing instability, with loess-covered hills and structurally complex areas exhibiting the greatest hazard potential, whereas plains and basin environments remain largely stable.
4.2. Hazard Evaluation
Building upon the results of the susceptibility assessment, the hazard evaluation further integrates external triggering factors—rainfall, seismic acceleration, and human engineering disturbance—to capture the dynamic conditions responsible for ground-instability initiation. These factors were standardized to a consistent spatial framework and incorporated through information-value weighting to refine the predictive accuracy of the hazard model.
(1) Rainfall: The multi-year (1990–2023) mean annual precipitation data were obtained from the China Meteorological Administration (CMA) station network and resampled to 25 m resolution using spatial interpolation. Precipitation exhibits a clear north–south gradient, increasing from approximately 150 mm yr−1 in Shizuishan to more than 700 mm yr−1 in southern Guyuan. Based on the Jenks natural-breaks classification, rainfall was divided into eight intervals—(100, 200], (200, 250], (250, 300], (300, 400], (400, 450], (450, 500], (500, 600], and (600, 800] mm yr−1 (Figure 5a). These categories effectively distinguish areas with high potential for rainfall-induced landslides and loess collapses.
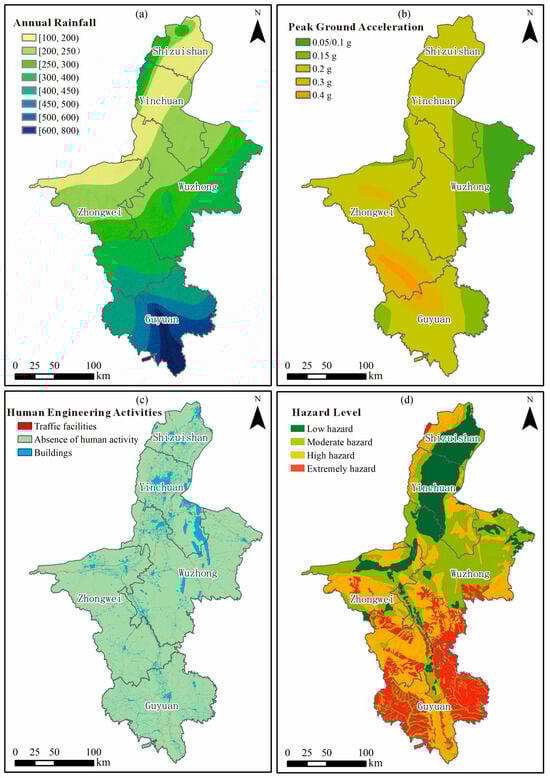
Figure 5.
Triggering-factor layers and hazard evaluation results. (a) Spatial distribution of annual rainfall classified into eight precipitation intervals. (b) Peak Ground Acceleration (PGA) zoning representing seismic influence levels. (c) Human engineering activities categorized by land-use intensity and infrastructure density. (d) Final hazard zoning map classified into five hazard levels. Coordinate reference: WGS-84 UTM Zone 48N; gridlines omitted for map clarity.
(2) Seismic factor: Seismic shaking intensity was represented by Peak Ground Acceleration (PGA), extracted from the 2022 national seismic zoning map issued by the China Earthquake Administration. The study region is subdivided into five PGA zones—0.05/0.1 g, 0.15 g, 0.20 g, 0.30 g, and 0.40 g (Figure 5b)—revealing a distinct east–west gradient. The highest PGA values coincide with active fault systems in the Liupan–Xihaigu structural belt, where repeated historical earthquakes have contributed to slope destabilization and secondary failures.
(3) Human activity: Anthropogenic modification of the terrain, including road construction, urban expansion, and mining operations, alters both local hydrological routing and the mechanical stability of slopes. Based on land-use datasets and high-resolution remote-sensing imagery (2020 Landsat-8 OLI), engineering activities were classified into transportation corridors and built-up areas (Figure 5c). Their spatial intensity was quantified using buffer-zone density statistics to compute corresponding information values.
By overlaying the susceptibility map with these three triggering-factor layers, a composite hazard index was derived and subsequently reclassified into four hazard levels—extreme, high, moderate, and low—using the Jenks method (Figure 5d). Extreme-hazard zones, characterized by strong neotectonic activity, high rainfall, and intensive human interference, cover approximately 9849 km2 (18.9%) of the study area. High-hazard zones extend across 18,793 km2 (36.2%), mainly along the southern margin of the Ningxia Basin and central Wuzhong. Moderate-hazard areas (14,721 km2; 28.3%) are distributed within transitional hilly terrain, whereas low-hazard zones (8597 km2; 16.5%) correspond to flat plains with limited triggering potential.
The spatial coherence between high-hazard regions and recorded disaster events demonstrates that the integration of dynamic triggers into the susceptibility framework significantly improves the reliability and realism of the hazard assessment.
4.3. Exposure Evaluation
The exposure assessment aims to quantify the degree of potential damage and loss of exposure elements under mass movement scenarios. Based on field investigations, remote-sensing interpretation, and socio-economic statistics, three key indicators were selected to represent human and infrastructural exposure: population density, building structures, and transportation networks.
(1) Population density: Population data for 2020 were obtained from the National Bureau of Statistics of China and spatially disaggregated to a 25 m grid using areal-weighted interpolation. High population densities are mainly concentrated in urbanized centers such as Yinchuan, Wuzhong, and Guyuan, where the potential human impact of ground instabilities is greatest.
(2) Building and land-use intensity: Residential and industrial construction areas were extracted from Landsat-8 OLI imagery (30 m resolution) and refined using Sentinel-2A data for validation. The total building footprint and land-use intensity were quantified by calculating built-up ratios within each grid cell. Areas with a high proportion of permanent or multi-story buildings were assigned higher exposure scores due to greater potential property losses (Figure 6a).
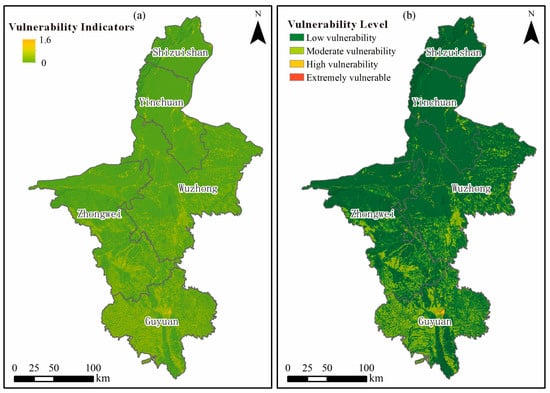
Figure 6.
Exposure evaluation results. (a) Spatial distribution of key exposure indicators (population density, building footprint, and transportation infrastructure). (b) Final exposure zoning map classified into four exposure levels using Jenks natural breaks. Coordinate reference: WGS-84 UTM Zone 48 N; gridlines omitted for map clarity.
(3) Transportation infrastructure: Major highways, secondary roads, and railway lines were mapped using vector data from OpenStreetMap and regional planning maps (2023). Linear density analysis in ArcGIS was applied to estimate the cumulative length of transport corridors within a 1 km buffer zone (Figure 6b). Transport networks in hilly terrains exhibit higher exposure due to the combined effects of slope cutting and runoff concentration along road embankments.
The above indicators were standardized through min–max normalization and aggregated using an empirical scoring approach (Table 9). The cumulative exposure index (CVI) was derived by raster-based overlay analysis and subsequently categorized into four levels—extreme, high, moderate, and low exposure—according to the Jenks natural-breaks method (Figure 6b).
Table 9.
Exposure assignment of hazard-affected objects.
The spatial pattern reveals that extreme and high-exposure zones are concentrated in Yinchuan, Wuzhong, and the central-eastern part of Guyuan, covering approximately 8900 km2 (17.1% of the total area). These regions feature dense population clusters and extensive infrastructure networks. Moderate-exposure areas account for 42.6%, corresponding to transitional suburban belts, while low-exposure zones (40.3%) dominate sparsely populated mountainous and desert regions. The resulting exposure map effectively characterizes the spatial differentiation of exposure intensity and provides a quantitative foundation for subsequent risk synthesis.
4.4. Risk Evaluation
In accordance with the Technical Requirements for Geological Disaster Risk Investigation and Evaluation (1:50,000), a risk classification matrix (Table 10) was applied to synthesize the results of the hazard and exposure assessments. Within this framework, mass movement risk (R) is defined as the joint probability and expected consequence of a hazardous event, expressed conceptually as R = H × E, where H and V denote normalized hazard intensity and exposure index, respectively.
Table 10.
Classification matrix of mass movement risk level.
Raster-based overlay analysis was performed in ArcGIS to integrate the two layers. The initial composite map revealed fragmented and discontinuous zoning due to the pixel-level variation inherent in raster calculations (Figure 7a). To enhance cartographic readability and ensure spatial coherence, a spatial optimization and neighborhood aggregation procedure was employed. Adjacent grid cells sharing similar hazard and exposure combinations were merged through region-group and dissolve operations, generating a continuous and interpretable final risk zoning map (Figure 7b).
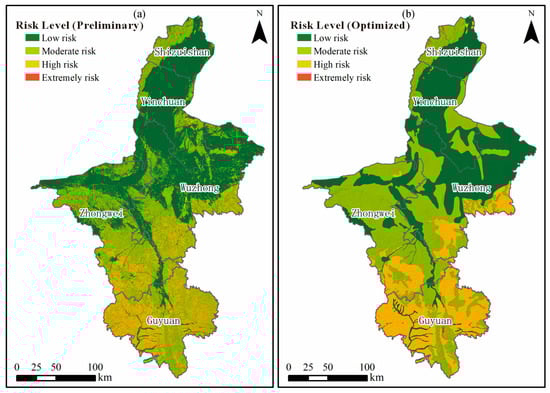
Figure 7.
Mass movement risk zoning results. (a) Preliminary risk zoning map obtained through overlaying susceptibility, hazard, and exposure layers. (b) Final optimized risk zoning map after spatial generalization and cluster merging to reduce fragmentation. Coordinate reference: WGS-84 UTM Zone 48 N; gridlines omitted for map clarity.
The final results indicate that extreme-risk zones encompass approximately 83.6 km2 (0.16% of the study area) and are primarily located in central Guyuan and northwestern Shizuishan. These regions coincide with steep loess slopes, active faults, and dense transportation corridors, where high hazard intensity converges with concentrated exposure. High-risk zones cover about 11,366 km2 (21.9%), distributed across most of Guyuan and southern Wuzhong, reflecting the combined influence of strong seismic shaking, high rainfall, and urban expansion.
Moderate-risk areas dominate the central portion of the Ningxia Basin and northern Zhongwei, accounting for 41.7% of the study area, where moderate hazard levels overlap with medium population density and infrastructure exposure. Low-risk zones (36.3%) are primarily found in central Yinchuan and the surrounding plains, corresponding to flat terrain and limited triggering or exposure factors.
Comparative spatial validation using historical disaster inventories confirms a positive correlation between observed event density and modeled risk grades, thereby verifying the internal consistency and predictive capability of the risk evaluation model. The resulting risk zoning provides a decision-support tool for disaster prevention, urban land-use control, and regional resilience planning in the Loess Hilly region of Northwest China.
5. Discussion
5.1. Comparative Analysis of Susceptibility Evaluation Indexes
The information quantity (IQ) of susceptibility indicators provides a quantitative measure of the degree to which each factor influences the spatial occurrence of mass movements [51]. The comparative ranking of IQ values indicates the relative contribution of individual factors: hilly landforms (IQ = 0.6997), slopes between 10° and 20° (IQ = 0.6966), NDVI values between 0.3 and 0.6 (IQ = 0.6498), loess-type rock and soil (IQ = 0.6044), aspects between 180° and 225° (IQ = 0.3626), third-order drainage basins (IQ = 0.3577), and distances within 0–1000 m from fault zones (IQ = 0.2548). These results suggest that terrain morphology, slope gradient, and vegetation conditions are the dominant controls on instability development in the Loess Hilly region.
Hilly terrains are commonly distributed along active structural zones where crustal movement and fault activity are pronounced [52]. The steep slopes, complex topography, and loose loess deposits typical of these settings favor rapid surface runoff and concentrated erosion, reducing slope stability. Long-term fluvial incision and gully expansion further enhance susceptibility to landslides and debris flows. Additionally, agricultural terracing, road cutting, and open-pit mining intensify anthropogenic disturbance, accelerating soil loosening and groundwater infiltration, thereby increasing the probability of mass movement events.
Slope gradient exerts a fundamental mechanical influence on slope stability [2]. As shown in Table 2, the IQ values for slope classes increase with slope steepness from −1.8759 (<1°) to a maximum of 0.6966 (10–20°), then slightly decrease to 0.4922 (20–75°). This pattern reflects the nonlinear relationship between slope angle and gravitational driving force. Moderate slopes (10–20°) are particularly susceptible because they allow sufficient accumulation of colluvium and infiltration without providing full mechanical support. When slopes exceed 20°, reduced human activity and limited infiltration tend to lower the frequency of instability, although potential energy remains high.
Vegetation cover, represented by NDVI, also exerts both stabilizing and destabilizing effects depending on vegetation density and lithologic context [44,53]. The hydrological regulation and mechanical reinforcement provided by root systems generally improve slope stability in densely vegetated areas (NDVI > 0.6). Conversely, moderate vegetation coverage (NDVI 0.3–0.6) corresponds to the highest IQ (0.6498), implying that partial root anchoring combined with high soil moisture and weak loess material enhances the likelihood of shallow failures. In sparsely vegetated or bare-slope zones (NDVI < 0.3), surface erosion is strong but the total soil mass available for sliding is small, leading to reduced large-scale instability.
Collectively, these findings demonstrate that the spatial heterogeneity of mass movements in Ningxia results from the coupled effects of terrain morphology, soil–vegetation interaction, and fault-controlled hydrological processes. The IQ-based quantitative ranking effectively captures these mechanisms and provides a robust foundation for multi-factor calibration in subsequent hazard and risk assessments.
5.2. Analysis of Evaluation Results
The predictive reliability of the mass movement susceptibility model was quantitatively evaluated using the Receiver Operating Characteristic (ROC) curve, a standard statistical tool for assessing model performance [54,55]. The Area Under the Curve (AUC) serves as a key metric reflecting the model’s ability to distinguish between hazard and non-hazard occurrences. The x-axis of the ROC plot represents the cumulative proportion of the total study area ranked by ascending IQ values, whereas the y-axis denotes the cumulative proportion of correctly predicted mass movement occurrences within corresponding IQ intervals. An AUC value greater than 0.5 indicates model discrimination above random chance, and values approaching 1.0 denote excellent predictive accuracy. Specifically, AUC values between 0.5 and 0.7 indicate low reliability, 0.7 and 0.9 indicate high reliability, and values >0.9 signify very high precision [56].
As shown in Figure 8, the calculated AUC value for this study is 0.833, confirming that the weighted information model provides a highly accurate representation of spatial hazard likelihood. The obtained AUC value (0.833) is comparable to those reported in previous IV- or AHP-based susceptibility models in similar environments, which commonly range between 0.78 and 0.86 [13,14,19], indicating that the predictive performance of our model is consistent with the current state of practice. The ROC curve demonstrates a stable and monotonic increase, suggesting that the model effectively captures the relationship between conditioning factors and observed geological disaster events. Furthermore, the AUC value obtained here is comparable to or exceeds that reported in similar regional-scale susceptibility studies employing logistic regression, random forest, or certainty factor approaches, indicating the robustness of the hybrid information–AHP framework.
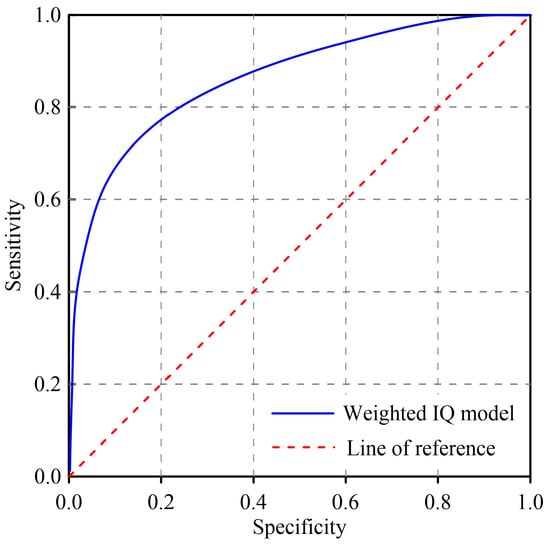
Figure 8.
The receiver operating characteristic (ROC) curve.
Additional model validation was conducted by examining the correspondence between observed geological disaster point densities and predicted risk zoning results [57]. The number of disaster occurrences within the extremely high, high, moderate, and low-risk zones were 15, 764, 255, and 4, respectively. Corresponding spatial densities were calculated as 0.2357, 0.0656, 0.0118, and 0.0002 events/km2, revealing a clear positive correlation between the model’s predicted risk classes and the actual frequency of disasters. This systematic gradient demonstrates that the information-based risk evaluation approach maintains both internal consistency and external validity.
Collectively, these validation results confirm that the proposed weighted information value (WIV) model effectively integrates physical, environmental, and anthropogenic factors to yield credible spatial predictions of hazard and risk. The strong correlation between modeled and observed distributions provides scientific support for its application in regional disaster management, particularly in loess hilly terrains characterized by high environmental heterogeneity and data constraints.
It is important to note that the present validation is based on a regional presence-only inventory of mass movement occurrences. Because systematically mapped “non-hazard” or stable reference units are unavailable, confusion-matrix-based indices such as accuracy, precision, recall, and F1-score cannot be reliably computed without introducing subjective assumptions regarding absence sampling and classification thresholds. Under such data conditions, many IV- and AHP-based susceptibility studies adopt the threshold-independent ROC curve and AUC as the primary performance metric. In this study, AUC therefore serves as the main validation measure, while we acknowledge that broader metrics may be incorporated in future work when more comprehensive inventories become available.
5.3. Model Applicability and Limitations
The combined use of the Information Value (IV) model and the Analytic Hierarchy Process (AHP) proves to be an effective and transparent framework for evaluating mass movement susceptibility and risk. This hybrid model is particularly suitable for regions where historical hazard inventories are relatively complete and environmental conditioning factors can be quantitatively characterized. Its main strengths include simplicity of implementation, integration of expert knowledge, and robust predictive performance, as demonstrated by the high AUC value (0.833) achieved in this study. Comparable studies have also shown that hybrid models incorporating both statistical and expert-based components outperform purely qualitative approaches in delineating high-risk zones [58,59].
Despite these advantages, several limitations remain inherent to the WIV–AHP framework. First, the information model is fundamentally empirical and data-driven, assuming that the spatial correlation between past and future events remains stable. This assumption may not hold under rapidly changing climate, land-use, or hydrological conditions, which could lead to under- or overestimation of risk [60]. Second, the AHP weighting process, while systematic, introduces subjectivity through expert judgment during pairwise comparisons. Even though consistency checks reduce logical inconsistencies, subjective bias in the initial weighting cannot be entirely eliminated. This subjectivity may be especially significant in regions where expert opinions diverge or available training datasets are limited.
Another constraint of the current modeling framework is its static nature. Most influencing factors (e.g., slope, lithology, geomorphology) are treated as temporally invariant, while dynamic triggers such as rainfall or seismic acceleration are represented as static mean values or discrete classes. Such simplifications limit the model’s ability to capture temporal variability or sudden environmental changes, which are critical for short-term hazard forecasting and early warning applications [61].
In addition, the spatial resolution of input datasets affects the granularity and precision of the model results. Coarse-resolution datasets (e.g., 30 m DEM, 1:200,000 geological maps) may generalize complex terrain features and obscure small-scale controlling structures. Studies have shown that increasing spatial resolution can significantly improve the accuracy of susceptibility mapping, especially in mountainous or loess-dominated terrains where micro-topography and local hydrology strongly control failure mechanisms [45].
Future work could address these limitations by integrating machine learning algorithms, such as Random Forest (RF), Support Vector Machines (SVM), or Extreme Gradient Boosting (XGBoost), which can learn nonlinear and high-order interactions among multiple conditioning variables while reducing reliance on subjective weighting [62]. Furthermore, incorporating time-series remote sensing, InSAR deformation data, and real-time hydrological monitoring could enable dynamic, multi-temporal hazard evaluation. Ultimately, a hybrid modeling approach that couples data-driven learning with mechanistic process understanding would provide a more resilient and adaptive framework for mass movement risk assessment across diverse geomorphic and climatic environments.
6. Conclusions
This study developed an integrated framework for mass movement risk assessment in the Loess Hilly Region of Northwest China by combining information value analysis, AHP-based weighting, and a calibrated hazard–exposure synthesis. The results highlight the dominant influence of hilly geomorphology, slopes of 10–20°, and NDVI values between 0.3 and 0.6 on ground-instability processes within the region. Spatial risk zoning reveals that extreme-risk areas are primarily concentrated in central Guyuan and northwest Shizuishan, whereas high-risk zones extend across southern Wuzhong and most of Guyuan, reflecting the combined effects of terrain conditions, lithology, and human activities. Model performance is supported by ROC analysis (AUC = 0.833) and the increasing density of historical disaster points from low to extreme risk classes, indicating strong predictive reliability. These findings provide a scientific basis for regional disaster-prevention strategies and land-use planning, and the proposed calibrated framework offers a practical and transferable tool for hazard assessment in loess-dominated environments. Future work may integrate time-series monitoring and machine-learning approaches to further enhance dynamic hazard prediction and model robustness.
Author Contributions
Conceptualization, Z.H. (Zhiyong Hu); Methodology, Z.H. (Zhiyong Hu) and J.Y.; Software, J.Y. and Y.G.; Validation, Y.G. and F.J.; Formal analysis, F.J.; Investigation, F.J. and G.W.; Resources, G.W., H.W. and X.H.; Data curation, G.W., H.W., X.H. and Z.H. (Zheng He); Writing—original draft, Z.H. (Zhiyong Hu); Writing—review and editing, J.Y. and Y.G.; Visualization, H.W. and S.G.; Supervision, X.H., S.G. and Z.H. (Zheng He); Project administration, S.G. and Z.H. (Zheng He); Funding acquisition, Y.G. All authors have read and agreed to the published version of the manuscript.
Funding
The work was funded by the Ningxia Natural Science Foundation Project (2023AAC03746), the Ningxia Hui Autonomous Region Mine Geological Environment Monitoring and Ecological Restoration Innovation Team (2022BSB03106), the Ningxia Mine Slope Geo-Environment Reconstruction and Ecological Restoration Technology R&D and Demonstration Project (2023BEG02051), the Ningxia 2021 Young Talent Support Program, and the Ningxia 2022 Science and Technology Youth Talent Support Program.
Data Availability Statement
Data is contained within the article.
Conflicts of Interest
Author Fangyuan Jiang was employed by the company Shenzhen Investigation and Research Institute Co. Ltd. The remaining authors declare that the research was conducted in the absence of any commercial or financial relationships that could be construed as a potential conflict of interest.
References
- Huang, P.; Peng, L.; Pan, H. Linking the Random Forests Model and GIS to Assess Geo-Hazards Risk: A Case Study in Shifang County, China. IEEE Access 2020, 8, 28033–28042. [Google Scholar] [CrossRef]
- Lin, J.; Chen, W.; Qi, X.; Hou, H. Risk assessment and its influencing factors analysis of geological hazards in typical mountain environment. J. Clean. Prod. 2021, 309, 127077. [Google Scholar] [CrossRef]
- Maes, J.; Kervyn, M.; de Hontheim, A.; Dewitte, O.; Jacobs, L.; Mertens, K.; Vanmaercke, M.; Vranken, L.; Poesen, J. Landslide risk reduction measures: A review of practices and challenges for the tropics. Prog. Phys. Geogr. Earth Environ. 2017, 41, 191–221. [Google Scholar] [CrossRef]
- Fell, R.; Ho, K.K.S.; Lacasse, S.; Leroi, E. A framework for landslide risk assessment and management. In Landslide Risk Management; CRC Press: Boca Raton, FL, USA, 2005; pp. 13–36. [Google Scholar]
- Van Westen, C.J.; Castellanos, E.; Kuriakose, S.L. Spatial data for landslide susceptibility, hazard, and vulnerability assessment: An overview. Eng. Geol. 2008, 102, 112–131. [Google Scholar] [CrossRef]
- Varnes, D.J. Slope Movement Types and Processes. Transp. Res. Board Spec. Rep. 1978, 176, 11–33. [Google Scholar]
- Carrara, A.; Guzzetti, F.; Cardinali, M.; Reichenbach, P. Use of GIS Technology in the Prediction and Monitoring of Land-slide Hazard. Nat. Hazards 1999, 20, 117–135. [Google Scholar] [CrossRef]
- Zhou, J.; Tan, S.; Li, J.; Xu, J.; Wang, C.; Ye, H. Landslide susceptibility assessment using the analytic hierarchy process (AHP): A case study of a construction site for photovoltaic power generation in Yunxian County, Southwest China. Sustainability 2023, 15, 5281. [Google Scholar] [CrossRef]
- Intarawichian, N.; Dasananda, S. Frequency ratio model-based landslide susceptibility mapping in the lower Mae Chaem watershed, Northern Thailand. Environ. Earth Sci. 2011, 64, 2271–2285. [Google Scholar] [CrossRef]
- Chowdhury, M.S.; Rahman, M.N.; Sheikh, M.S.; Sayeid, M.A.; Mahmud, K.H.; Hafsa, B. GIS-based landslide susceptibility mapping using logistic regression, random forest and decision and regression tree models in Chattogram District, Bangladesh. Heliyon 2024, 10, e23424. [Google Scholar] [CrossRef]
- El-Haddad, B.A.; Youssef, A.M.; Mahdi, A.M.; Karimi, Z.; Pourghasemi, H.R. Seismic-induced landslides susceptibility mapping of the NEOM area, northwestern Saudi Arabia using machine learning models. Earth Sci. Inform. 2025, 18, 44. [Google Scholar] [CrossRef]
- Degg, M. Natural Disasters: Recent Trends and Future Prospects. Geography 1992, 77, 198–209. [Google Scholar] [CrossRef]
- Komac, M. A landslide susceptibility model using the Analytical Hierarchy Process method and multivariate statistics in perialpine Slovenia. Geomorphology 2006, 74, 17–28. [Google Scholar] [CrossRef]
- Yalcin, A.; Reis, S.; Aydinoglu, A.C.; Yomralioglu, T. A GIS-based comparative study of frequency ratio, analytical hierarchy process, bivariate statistics and logistics regression methods for landslide susceptibility mapping in Trabzon, NE Turkey. Catena 2011, 85, 274–287. [Google Scholar] [CrossRef]
- Peng, J.; Wang, S.; Wang, Q.; Zhuang, J.; Huang, W.; Zhu, X.; Leng, Y.; Ma, P. Distribution and genetic types of loess landslides in China. J. Asian Earth Sci. 2019, 170, 329–350. [Google Scholar] [CrossRef]
- Yang, S.; Han, X.; Chang, C.; Yu, S.; Wang, Y.; Peng, D. Study on the distribution characteristics and seismic hazard evaluation of loess seismic landslides in the southern Ningxia area. Sci. Rep. 2025, 15, 22666. [Google Scholar] [CrossRef]
- Wang, H.B.; Zhou, B.; Wu, S.R.; Shi, J.S.; Li, B. Characteristic analysis of large-scale loess landslides: A case study in Baoji City of Loess Plateau of Northwest China. Nat. Hazards Earth Syst. Sci. 2011, 11, 1829–1837. [Google Scholar] [CrossRef]
- Yang, Y.; Zhang, R.; Wang, T.; Liu, A.; He, Y.; Lv, J.; He, X.; Mao, W.; Xiang, W.; Zhang, B. An information quantity and ma-chine learning integrated model for landslide susceptibility mapping in Jiuzhaigou, China. Nat. Hazards 2024, 120, 10185–10217. [Google Scholar] [CrossRef]
- Ciurleo, M.; Cascini, L.; Calvello, M. A comparison of statistical and deterministic methods for shallow landslide susceptibility zoning in clayey soils. Eng. Geol. 2017, 223, 71–81. [Google Scholar] [CrossRef]
- Gariano, S.L.; Guzzetti, F. Landslides in a Changing Climate. Earth-Sci. Rev. 2016, 162, 227–252. [Google Scholar] [CrossRef]
- Grozavu, A.; Patriche, C.V. Mapping landslide susceptibility at national scale by spatial multi-criteria evaluation. Geomat. Nat. Hazards Risk 2021, 12, 1127–1152. [Google Scholar] [CrossRef]
- Ado, M.; Amitab, K.; Maji, A.K.; Jasińska, E.; Gono, R.; Leonowicz, Z.; Jasiński, M. Landslide susceptibility mapping using machine learning: A literature survey. Remote Sens. 2022, 14, 3029. [Google Scholar] [CrossRef]
- Caleca, F.; Tofani, V.; Raspini, F.; Segoni, S.; Casagli, N. Quantitative landslide risk assessment for Italy. Landslides 2025, 22, 3537–3559. [Google Scholar] [CrossRef]
- Caleca, F.; Tofani, V.; Segoni, S.; Raspini, F.; Rosi, A.; Natali, M.; Catani, F.; Casagli, N. A methodological approach of QRA for slow-moving landslides at a regional scale. Landslides 2022, 19, 1539–1561. [Google Scholar] [CrossRef]
- Crawford, M.M.; Dortch, J.M.; Koch, H.J.; Zhu, Y.; Haneberg, W.C.; Wang, Z.; Bryson, L.S. Landslide risk as-sessment in Eastern Kentucky, USA: Developing a regional scale, limited resource approach. Remote Sens. 2022, 14, 6246. [Google Scholar] [CrossRef]
- Novellino, A.; Cesarano, M.; Cappelletti, P.; Di Martire, D.; Di Napoli, M.; Ramondini, M.; Sowter, A.; Calcaterra, D. Slow-moving landslide risk assessment combining Machine Learning and InSAR techniques. Catena 2021, 203, 105317. [Google Scholar] [CrossRef]
- Fell, R.; Corominas, J.; Bonnard, C.; Cascini, L.; Leroi, E.; Savage, W.Z. JTC-1 Joint Technical Committee on Landslides and Engineered Slopes. Guidelines for landslide susceptibility, hazard and risk zoning for land use planning. Eng. Geol. 2008, 102, 85–98. [Google Scholar] [CrossRef]
- Legorreta Paulín, G.; Bursik, M.; Hubp, J.L.; Mejía, L.M.P.; Aceves Quesada, F. A GIS method for landslide inventory and susceptibility mapping in the Río El Estado watershed, Pico de Orizaba volcano, México. Nat. Hazards 2014, 71, 229–241. [Google Scholar] [CrossRef]
- Gómez, D.; García, E.F.; Aristizábal, E. Spatial and temporal landslide distributions using global and open landslide databases. Nat. Hazards 2023, 117, 25–55. [Google Scholar] [CrossRef]
- Seal, D.M.; Nowicki Jessee, A.; Hamburger, M.; Dills, C.; Allstadt, K.E. Comprehensive Global Database of Earth-Quake-Induced Landslide Events and Their Impacts (Ver. 2.0, February 2022); Data Release; US Geological Survey (USGS): Washington, DC, USA, 2022; p. 137.
- Thai Pham, B.T.; Shirzadi, A.; Shahabi, H.; Omidvar, E.; Singh, S.K.; Sahana, M.; Asl, D.T.; Bin Ahmad, B.; Quoc, N.K.; Lee, S. Landslide susceptibility assessment by novel hybrid machine learning algorithms. Sustainability 2019, 11, 4386. [Google Scholar] [CrossRef]
- Dahal, A.; Tanyas, H.; van Westen, C.; van der Meijde, M.; Mai, P.M.; Huser, R.; Lombardo, L. Space–time land-slide hazard modeling via Ensemble Neural Networks. Nat. Hazards Earth Syst. Sci. 2024, 24, 823–845. [Google Scholar] [CrossRef]
- Ali, N.; Chen, J.; Fu, X.; Ali, R.; Hussain, M.A.; Daud, H.; Hussain, J.; Altalbe, A. Integrating machine learning ensembles for landslide susceptibility mapping in northern Pakistan. Remote Sens. 2024, 16, 988. [Google Scholar] [CrossRef]
- Zhao, P.; Wang, Y.; Xie, Y.; Uddin, G.; Xu, Z.; Chang, X.; Zhang, Y. Landslide susceptibility assessment using information quantity and machine learning integrated models: A case study of Sichuan province, southwestern China. Earth Sci. Inform. 2025, 18, 190. [Google Scholar] [CrossRef]
- Zhang, K.; Wu, X.; Niu, R.; Yang, K.; Zhao, L. The assessment of landslide susceptibility mapping using random forest and decision tree methods in the three gorges reservoir area, China. Environ. Earth Sci. 2017, 76, 40. [Google Scholar] [CrossRef]
- Li, R.; Tan, S.; Zhang, M.; Zhang, S.; Wang, H.; Zhu, L. Geological Disaster Susceptibility Evaluation Using a Random Forest Empowerment Information Quantity Model. Sustainability 2024, 16, 765. [Google Scholar] [CrossRef]
- Huang, F.; Teng, Z.; Guo, Z.; Catani, F.; Huang, J. Uncertainties of landslide susceptibility prediction: Influences of different spatial resolutions, machine learning models and proportions of training and testing dataset. Rock Mech. Bull. 2023, 2, 100028. [Google Scholar] [CrossRef]
- Wang, J.; Wang, Y.; Li, Y.; Wei, S.; Li, C.; Wang, Y.; Qi, H. Landslide susceptibility assessment based on weighted information value model: A case study of Chongqing city. Sci. Soil Water Conserv. 2023, 21, 53–62, (In Chinese with English abstract). [Google Scholar]
- Vaidya, O.S.; Kumar, S. Analytic hierarchy process: An overview of applications. Eur. J. Oper. Res. 2006, 169, 1–29. [Google Scholar] [CrossRef]
- Olson, D.L. The Analytic Hierarchy Process. In Decision Aids for Selection Problems; Olson, D.L., Ed.; Springer: New York, NY, USA, 1996; pp. 49–68. [Google Scholar]
- Tavana, M.; Soltanifar, M.; Santos-Arteaga, F.J. Analytical hierarchy process: Revolution and evolution. Ann. Oper. Res. 2023, 326, 879–907. [Google Scholar] [CrossRef]
- Shao, M.; Hou, S.; Gao, J. Using the Information Quantity Method to Assess the Regional Risk of Highway Slope to Improve the Level of Risk Management. Adv. Civ. Eng. 2023, 2023, 1–15. [Google Scholar] [CrossRef]
- Liu, Z.; Sun, L.; Zhang, Y.; Yu, Z. Landslide risk evaluation based on slope unit: A case on the Western Hubei area, China. Arab. J. Geosci. 2022, 15, 1072. [Google Scholar] [CrossRef]
- Long-Ji, G.; Zhi-Gang, T.; Man-Chao, H.E.; Jian-Ning, L.; Massimo, C. A case study of a giant reactivated landslide based on NPR anchor cable newton force early warning. J. Mt. Sci. 2023, 20, 3283–3294. [Google Scholar] [CrossRef]
- Reichenbach, P.; Rossi, M.; Malamud, B.D.; Mihir, M.; Guzzetti, F. A review of statistically-based landslide susceptibility models. Earth-Sci. Rev. 2018, 180, 60–91. [Google Scholar] [CrossRef]
- Broeckx, J.; Vanmaercke, M.; Duchateau, R.; Poesen, J. A data-based landslide susceptibility map of Africa. Earth-Sci. Rev. 2018, 185, 102–121. [Google Scholar] [CrossRef]
- Kumar, A.; Sharma, R.K.; Bansal, V.K. GIS-based comparative study of information value and frequency ratio method for landslide hazard zonation in a part of mid-Himalaya in Himachal Pradesh. Innov. Infrastruct. Solut. 2019, 4, 28. [Google Scholar] [CrossRef]
- Corominas, J.; van Westen, C.; Frattini, P.; Cascini, L.; Malet, J.P.; Fotopoulou, S.; Smith, J.T. Recommendations for the quantitative analysis of landslide risk. Bull. Eng. Geol. Environ. 2014, 73, 209–263. [Google Scholar] [CrossRef]
- Mfondoum, A.H.N.; Nguet, P.W.; Seuwui, D.T.; Mfondoum, J.V.M.; Ngenyam, H.B.; Diba, I.; Tchindjang, M.; Djiangoue, B.; Mihi, A.; Hakdaoui, S.; et al. Stepwise integration of analytical hierarchy process with machine learning algorithms for landslide, gully erosion and flash flood susceptibility mapping over the North-Moungo perimeter, Cameroon. Geoenviron. Disasters 2023, 10, 22. [Google Scholar] [CrossRef]
- Segoni, S.; Nocentini, N.; Ajin, R.S.; Gatto, A.; Fanti, R. Understanding the spatial patterns of major geo-hydrological disasters in Italy using the CatBoost algorithm. Sci. Total. Environ. 2025, 999, 180355. [Google Scholar] [CrossRef]
- Hu, X.; Fu, S.; Chi, H.; Zhang, H.; Zhang, Z. Geological hazard risk assesment based on AHP—information coupling model: A case studv of Wuan Citv in Hebei Province. Geol. Survev China 2023, 10, 109–117, (In Chinese with English abstract). [Google Scholar]
- Li, M.; Qiu, Y.; Xiong, H.; Zhang, Z. Evaluation of landslide susceptibility based on VW-AHP-IV model: A case of Peng-yang County, Ningxia, China. Environ. Earth Sci. 2023, 82, 108. [Google Scholar] [CrossRef]
- Masi, E.B.; Segoni, S.; Tofani, V. Tofani Root Reinforcement in Slope Stability Models. Geosciences 2021, 11, 212. [Google Scholar] [CrossRef]
- Jiang, W.; Rao, P.; Cao, R.; Tang, Z.; Chen, K. Comparative evaluation of geological disaster susceptibility using multi-regression methods and spatial accuracy validation. J. Geogr. Sci. 2017, 27, 439–462. [Google Scholar] [CrossRef]
- Tan, P. Receiver Operating Characteristic. In Encyclopedia of Database Systems; Liu, L., ÖZsu, M.T., Eds.; Springer: Boston, MA, USA, 2009; pp. 2349–2352. [Google Scholar]
- Wang, X.; Shi, Y.; Chen, H. Evaluation of geological hazard susceptibility based on certainty factors coupling logistic regression. Bull. Surv. Mapp. 2022, 11, 112–117. [Google Scholar]
- Zhang, S.; Tan, S.; Sun, Y.; Ding, D.; Yang, W. Risk Mapping of Geological Hazards in Plateau Mountainous Areas Based on Multisource Remote Sensing Data Extraction and Machine Learning (Fuyuan, China). Land 2024, 13, 1361. [Google Scholar] [CrossRef]
- Dou, J.; Yunus, A.P.; Merghadi, A.; Shirzadi, A.; Nguyen, H.; Hussain, Y.; Avtar, R.; Chen, Y.; Pham, B.T.; Yamagishi, H. Different sampling strategies for predicting landslide susceptibilities are deemed less consequential with deep learning. Sci. Total Environ. 2020, 720, 137320. [Google Scholar] [CrossRef]
- Hung, L.Q.; Van, N.T.H.; Duc, D.M.; Ha, L.T.C.; Van Son, P.; Khanh, N.H.; Binh, L.T. Landslide susceptibility map-ping by combining the analytical hierarchy process and weighted linear combination methods: A case study in the upper Lo River catchment (Vietnam). Landslides 2016, 13, 1285–1301. [Google Scholar] [CrossRef]
- Park, S.-J.; Lee, D.-K. Predicting susceptibility to landslides under climate change impacts in metropolitan areas of South Korea using machine learning. Geomat. Nat. Hazards Risk 2021, 12, 2462–2476. [Google Scholar] [CrossRef]
- Lin, N.; Ding, K.; Tan, L.; Li, B.; Yang, K.; Wang, C.; Wang, B.; Li, N.; Yang, R. Dynamic landslide susceptibility mapping on time-series InSAR and explainable machine learning: A case study at Wushan in the Three Gorges Reservoir area, China. Adv. Space Res. 2025, 75, 8439–8465. [Google Scholar] [CrossRef]
- Huang, Y.; Zhao, L. Review on landslide susceptibility mapping using support vector machines. Catena 2018, 165, 520–529. [Google Scholar] [CrossRef]
Disclaimer/Publisher’s Note: The statements, opinions and data contained in all publications are solely those of the individual author(s) and contributor(s) and not of MDPI and/or the editor(s). MDPI and/or the editor(s) disclaim responsibility for any injury to people or property resulting from any ideas, methods, instructions or products referred to in the content. |
© 2025 by the authors. Licensee MDPI, Basel, Switzerland. This article is an open access article distributed under the terms and conditions of the Creative Commons Attribution (CC BY) license (https://creativecommons.org/licenses/by/4.0/).