Abstract
Following the Mw 5.0 earthquake of 1 August 2024, which struck the Ionian sector of north-central Calabria (southern Italy), the SISMIKO emergency group of INGV deployed a temporary seismic network to enhance coverage of the National Seismic Network. This improved configuration enabled the relocation of over 1300 aftershocks and the identification of a second swarm near Cirò, active since May and reactivated after mid-August. A machine learning workflow was applied for automatic phase picking, event association, and relocation, producing a high-resolution catalogue. The seismicity of both sequences aligns with the NW-trending Rossano–San Nicola shear zone but reveals distinct rupture patterns: the Pietrapaola sequence, targeted by the SISMIKO deployment, shows compact hypocentral clustering, while the Cirò swarm displays more scattered seismicity. The analysis of the catalogue reveals a two-slope temporal decay of aftershocks and relatively low completeness magnitudes. Source geometry inferred from hypocentre distributions and INGV focal mechanisms supports the structural interpretation. Overall, the machine learning-based catalogue proved effective for near-real-time analysis and offers new insights into the active tectonic framework of the Calabrian Arc.
1. Introduction
On 1 August 2024, at 21:43 local time (19:43 UTC), a moment magnitude = 5.0 (ML = 5.0) earthquake nucleated at a depth of 24 km within the Upper Ionian Calabrian region [1]. Its epicentre was located in proximity to the municipality of Pietrapaola, approximately 10 km inland from the coast, 17 km from Rossano, and nearly 50 km from Cosenza. Over the following six months, the INGV monitoring and surveillance service [2] detected more than 260 aftershocks in this area (cf. green box related to the Pietrapaola sequence in Figure 1). Additionally, a second seismic swarm, with events up to = 4.0 (ML = 4.0), began in May 2024 and remained active in the weeks following the Pietrapaola mainshock. This swarm was located about 20 km southeast, near the town of Cirò (Crotone province). Between April and December 2024, over 500 shocks related to the Cirò swarm were recorded, many of which were significantly felt along the Crotone coastline (cf. green box for the Cirò swarm in Figure 1).
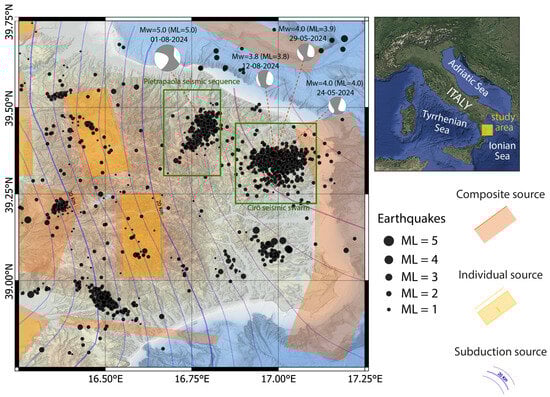
Figure 1.
Map of epicentres of earthquakes located by the INGV surveillance service between 1 April and 31 October 2024. Event data are available from the INGV Earthquake List (https://terremoti.ingv.it/en, accessed on 8 November 2025). The green boxes mark the Pietrapaola sequence, following the = 5.0 mainshock, and the Cirò swarm (ML≤ 4.0), used as spatial filters to compare the INGV catalogue with the relocated events in this study. Focal mechanisms (ML≥ 3.8) from the TDMT catalogue [3], and seismogenic sources and subduction zones from the DISS 3.3.1 database [4], are also shown.
The focal mechanism of the Pietrapaola mainshock, determined using the Time-Domain Moment Tensor (TDMT) technique [3], indicates a strike-slip to normal faulting regime (Figure 1). Both nodal planes exhibit dip angles of approximately 72°, with strike values of 295° and 31°, and corresponding rake angles of −18° and −162°, respectively [1]. The nodal plane striking ≈ 295° is consistent with the NW-trending Rossano–San Nicola shear zone, suggesting left-lateral motion on steeply dipping structures. In contrast, the main events of the Cirò swarm—here defined as those with magnitude ML ≥ 3.8—are characterised by a strike-slip to reverse faulting mechanism (Figure 1). One nodal plane dips between 76°and 79° angles, strikes in the range 20°–27°, and has a rake angle between 122° and 143°. The conjugate plane dips 35°–54°, strikes 118°–130°, and exhibits rake angles of 13°–25° [5,6,7].
These transpressive kinematics suggest a local compressive regime and may involve the reactivation of pre-existing structures under conditions of oblique shortening. The observed faulting styles are consistent with the broader tectonic stress field in the region. According to the updated Italian stress database IPSI 1.7 [8], the Ionian sector of Calabria is affected by a transtensional to extensional regime, with the minimum compressive stress axis () oriented NE–SW to ENE–WSW. This stress configuration supports the strike-slip with normal components observed in the Pietrapaola sequence and also accommodates the mixed strike-slip/reverse mechanisms seen in the Cirò swarm. The latter may reflect local perturbations of the regional stress field, possibly related to structural complexity or inherited heterogeneities. Comparable spatial variability in stress regimes has been documented in other parts of southern Italy, notably in the Pollino area [9]. These analogies underscore the importance of high-resolution seismic networks in capturing local stress heterogeneities and assessing their influence on fault reactivation. From a broader geodynamic perspective, these observations are consistent with the long-term tectonic evolution of the Calabrian Arc, which has migrated southeastward since the Middle Miocene (Figure 2a). Specifically, the retreat of the Calabrian Arc and the opening of the back-arc basin in the Tyrrhenian Sea are driven by the subduction of the Ionian oceanic lithosphere beneath the Eurasian plate [10,11,12,13,14]. However, the southeastward migration of the Calabrian Arc has led to the significant fragmentation of the overriding crust into several blocks, which are bounded by NW- to WNW-trending shear zones, such as the Rossano–San Nicola and Petilia–Sosti fault systems (Figure 2b) [15,16,17,18,19].
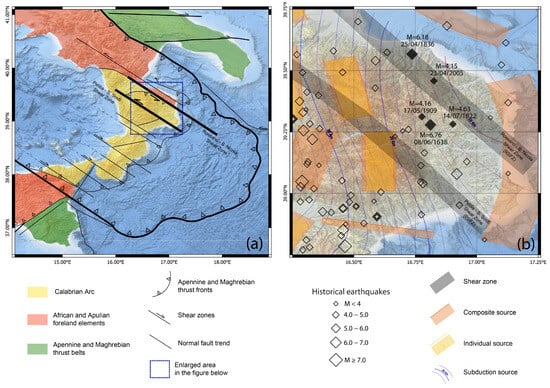
Figure 2.
(a) The map shows the area between the southern Apennine chain and the Maghrebide thrust belt, illustrating the structure of the Calabrian Arc (modified from [16,17]). It highlights the main shear zones PSFZ and RSFZ, with the latter affecting the studied seismic sequences. The blue box marks the zoomed-in area below. (b) Historical earthquakes from the CPTI catalogue [20] are shown; black diamonds indicate events with intensity-based magnitudes > 4.0 near the shear zone RSFZ.
Historical earthquake catalogues confirm the seismic potential of these shear zones. A major earthquake with estimated magnitude M = 6.8 struck the region in June 1638 approximately 24 km south of Pietrapaola and about 20 km northeast of the Cirò swarm area (cf. CPTI [20]). This event caused extensive structural damage across the central region, including ground ruptures and landslides (cf. CFTI5Med [21,22]). Another significant event, with an estimated equivalent magnitude M = 6.2, occurred in April 1836 roughly 12 km northwest of Pietrapaola (cf. CPTI [20]) and struck several coastal villages, resulting in severe damage and over 150 casualties (cf. CFTI5Med [21,22]). Moderate events (M ≥ 4) have been documented in areas affected by the 2024–2025 seismic sequence. This paper outlines the activities of the SISMIKO operational group to densify the seismic network in the area affected by the Pietrapaola sequence and enhance seismic monitoring of the Cirò seismic swarm. In this study, we adopt a clear distinction between seismic sequence and seismic swarm, based on the temporal and spatial characteristics of the events. A seismic sequence is defined by the occurrence of a dominant mainshock, followed by a series of aftershocks that decay in time and are spatially concentrated around the main event. In contrast, a seismic swarm consists of multiple earthquakes of comparable magnitude, occurring over a limited time span and spatial area, without a clearly identifiable mainshock. Accordingly, the Pietrapaola case is classified as a seismic sequence, as it was initiated by an identifiable mainshock followed by aftershocks within a confined area. The Cirò case, instead, is described as a seismic swarm, having produced several events with magnitude around 4.0 and numerous lower-magnitude earthquakes distributed more diffusely, without a dominant triggering event. To complete the information, although some authors have proposed the Das magnitude () [23,24], derived from the seismic moment, to account for the known limitations of the scale when applied outside its original calibration region [25,26], in the Introduction, the moment magnitude () and local magnitude (ML) values reported for the main events of the analysed sequences are those computed by the INGV service and publicly released through official channels. Furthermore, this paper presents the implementation of an automated waveform-picking procedure based on machine learning, combined with phase association and hypocentral relocation techniques. This approach was tested on the case study to evaluate its potential for future integration into near-real-time operations. An introduction to these activities is provided in a conference abstract by the same authors [27]. Finally, this paper presents the insights obtained from the analysis of the seismic sequences that occurred between May 2024 and March 2025 in the Ionian sector of Calabria, providing new constraints on the seismotectonic evolution of the region.
2. Materials and Methods
2.1. SISMIKO Temporary Seismic Network
Following the 1 August 2024 Pietrapaola mainshock, the SISMIKO Emergency Operational Group [28] promptly activated its rapid response protocol and deployed a temporary seismic network to enhance the spatial coverage and data quality of the permanent networks operating in the epicentral region, including INGV-RSN [29], DPC-RAN [30], and the University of Calabria [31]. SISMIKO, established in 2015 as one of six INGV operational groups, specializes in the rapid planning, deployment installation, and maintenance of temporary seismic stations during seismic crises involving events of magnitude M ≥ 5.0 or prolonged seismic sequences. The temporary stations are preconfigured for immediate data streaming once site coordinates are set. All data are acquired by the SISMIKO acquisition system and transmitted in real time to the INGV control room in Rome [28], from where they are made publicly available through the EIDA portal [32,33]. SISMIKO ensures data interoperability and long-term accessibility by registering network codes and station metadata with the International Federation of Digital Seismograph Networks (FDSN), and assigns persistent Digital Object Identifiers (DOIs) to each emergency dataset according to principles of the INGV Data Policy (https://data.ingv.it/docs/principles/) (accessed on 8 November 2025). The Pietrapaola dataset is assigned a persistent DOI as documented by Costanzo et al. [34], enabling accurate citation and reproducibility. Since 2009, SISMIKO stations have adhered to a standardized naming convention comprising the letter “T” (temporary), a two-digit emergency identifier, and a two-digit station code. For the Pietrapaola deployment, stations were designated T1811, T1812, and T1813 (Rome office), as well as T1886 (Rende office). Between 2 and 3 August 2024, field teams deployed three stations selected based on azimuthal gap optimization, site accessibility, and local geological conditions. The initial instrumentation included Reftek 130-1 data loggers (Reftek Systems Inc., Richardson, TX, USA), Lennartz 3D Lite short-period seismometers (GEBR. LENNARTZ GMBH & CO. KG, Remscheid, Germany), and Episensor FBA ES-T accelerometers (Kinemetrics Inc., Pasadena, CA, USA), sampling at 100 and 200 sps, respectively. The network was subsequently expanded on 28 August 2024 with the installation of station T1886, positioned to monitor the southeastward migration of seismicity and to compensate for the failure of the permanent LADO station, in collaboration with the University of Calabria. Hardware upgrades from Reftek to ATLAS acquisition systems (Lunitek S.r.l., Sarzana (SP), Italy) were performed in March 2025 and December 2024 at stations T1811 and T1812, respectively. The details about the SISMIKO stations are reported in Table 1. SISMIKO also employed a suite of tools developed within the ArcGIS Online (ESRI, Redlands, CA, USA) environment, including a web application for seismic emergency planning, a mobile-optimised station installation form, and an interactive dashboard for real-time monitoring and metadata integration [35]. These tools facilitated the planning and coordination of station deployments, enabled real-time information exchange with field teams, supported systematic collection of field data, and allowed for the automated generation of station forms and updated cartographic reports during seismic emergencies. An example of such a report, produced during the Pietrapaola emergency, is shown in Figure 3. The SISMIKO temporary network provided essential data for real-time seismic surveillance and substantially improved earthquake location accuracy during the Pietrapaola sequence.

Table 1.
Summary of the SISMIKO temporary seismic stations deployed following the 1 August 2024 Mw 5.0 earthquake near Pietrapaola (CS). For each station, the geographic coordinates, elevation, site location, and full instrumental setup are reported, including the data logger, short-period seismometer, accelerometer, and sampling rate. Operational time windows are indicated in UTC. Stations T1811 and T1812 were upgraded during the monitoring period, with new instrumentation installed in March 2025 and December 2024, respectively.
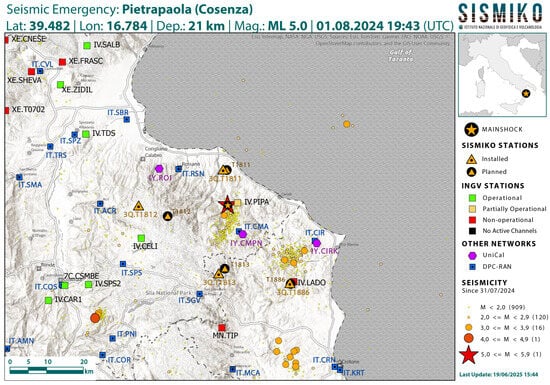
Figure 3.
Cartographic report illustrating the distribution of seismic stations and recorded seismicity between 31 July 2024 and 19 June 2025. The map shows stations from INGV-RSN [29] (squares color-coded by operational status), DPC-RAN [30] (blue squares), University of Calabria [31] (purple hexagons), and SISMIKO, including both installed (orange triangles) and planned sites (orange triangles on a black background).
2.2. Preliminary Catalogue Based on Machine Learning Algorithms
The waveform data collected by the SISMIKO temporary network, in conjunction with data from permanent seismic stations, constituted the primary dataset for subsequent machine learning-based seismic analysis.
The construction of the preliminary seismic event catalogue was carried out through a structured workflow integrating advanced data-driven techniques (Figure 4). The procedure encompassed the retrieval of continuous waveform data, automatic phase picking using a deep neural network capable of identifying P- and S-wave onsets directly from unprocessed signals, phase association via probabilistic clustering based on Gaussian mixture models, and event relocation employing a non-linear, grid-search algorithm. This methodological framework enabled the generation of a high-resolution seismic catalogue, minimizing manual intervention while preserving accuracy and reproducibility. The individual steps of the workflow are described in the following sections.
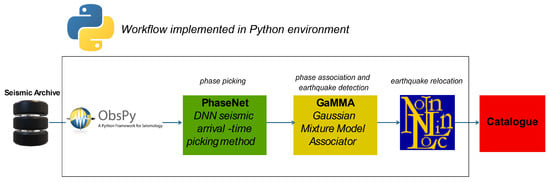
Figure 4.
Workflow to produce the seismic catalogue.
2.2.1. Data Collection
A Python 3.11 script, built using the ObsPy framework [36,37], queried the EIDA FDNS web service [38] to collect waveform data. The selection criteria for the dataset included the following:
- Time range: from 1 April 2024 to 20 March 2025.
- Geographic bounds: Latitude between 38.47° N and 40.47° N, and longitude between 15.78° E and 17.78° E (±1° from the mainshock of 1 August 2024), in the EPSG:4326–WGS84 reference system.
- Sensor selection: For each available station, only channels from one sensor type were used to avoid redundancy. Priority was given to the three-component seismometer channels over accelometer ones, which were only used in the absence or malfunction of the former.
The retrieved waveforms were stored in MiniSEED format and sampled at 100 Hz.
Although the data were not subjected to a formal quality control process at this stage, subsequent preprocessing steps incorporated measures to mitigate the impact of low signal-to-noise ratios and ensure the robustness of phase picking.
2.2.2. Preprocessing and Phase Picking
No quality checks or de-noising was applied to the waveform data, as the PhaseNet deep neural network is trained to detect P-waves, S-waves, and noise directly from raw signals [39]. A high-pass Butterworth filter with a corner frequency of 1 Hz and four poles was applied to improve performance for low-signal-to-noise ratio (SNR) events [40,41]. Using the standard PhaseNet model [39], implemented in Python, the arrival times of P- and S-waves were automatically picked. A probability threshold of 0.5 was used for both phases, following established practices in the literature [39,42,43,44,45].
2.2.3. Event Association
The PhaseNet picks were then processed using the Gaussian Mixture Model Association (GaMMA) algorithm [46] to group phases belonging to the same seismic event. A homogeneous stratigraphic model was assumed, which was characterised by 6 km/s P-wave velocity and 1.80 Vp/Vs velocity ratio. An event was declared when at least six picks were associated. This resulted in
- 80,948 P-wave-associated phases;
- 60,817 S-wave-associated phases;
- 10,243 detected events.
Although a systematic comparison of the picking and association phases with other codes or manual detection was not conducted for the case under study, several studies in the literature demonstrate the reliability of the machine learning-based code implemented in the workflow [42,46,47,48,49,50,51].
2.2.4. Earthquake Relocation
Earthquakes characterised by a minimum of eight associated phases were relocated using the NonLinLoc (NLL) version 7.00 software [52]. This software implements a probabilistic, non-linear grid-search algorithm [53] to determine hypocentral locations and their associated uncertainties. The crustal velocity models used for earthquake relocation were based on the seismic model for the lithospheric structure of the region, as defined by [54,55]. Local magnitudes were calculated using the empirical relationship proposed by [56] for crustal earthquakes in Italy. Earthquakes located within the central-eastern Calabria region (bounded by latitudes of 38.75°–39.75° and longitudes of 16.25°–17.25°) were then selected to produce a catalogue of 5145 seismic events (cf. Supplementary Materials—Catalogue). Furthermore, two sub-catalogues were defined to analyse the behaviour of the two main seismic sequences in the area (see green boxes in Figure 1): the first includes earthquakes occurring in proximity to the epicentral area of the = 5.0 event that initiated the Pietrapaola seismic sequence, while the second comprises events located near the Cirò seismic swarm region.
3. Results
Seismicity recorded over approximately one year, from April 2024 to mid-March 2025, in the central Calabria region on the Ionian side is shown in Figure 5. During this period, in addition to the Pietrapaola sequence triggered by the mainshock of magnitude = 5.0, other seismic swarms can be identified. The most significant of these occurred in the Cirò area and had already begun prior to August 2024 (see blue dots in Figure 5a). Further swarms were also recorded between February and March 2025, involving events with magnitudes ML < 4: the first approximately 15 km west of the city of Crotone; and the second near the city of Catanzaro, along the isthmus that separates the Ionian Sea from the Tyrrhenian Sea.
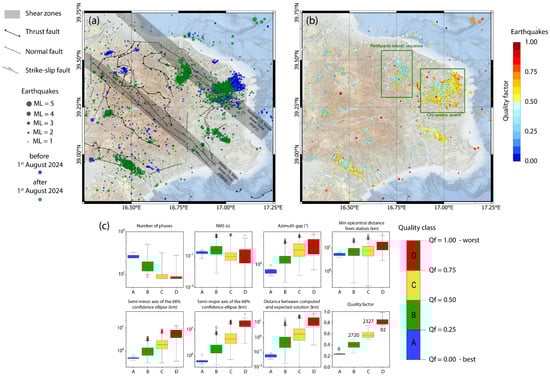
Figure 5.
(a) Earthquakes located using the machine learning method: before the 1 August 2024 mainshock (blue dots) and after it (green dots), when SISMIKO stations densified the network. The two main NW–SE shear zones, RSFZ and PSFZ, together with major fault lineaments and kinematics, are shown [17,19]. (b) Same earthquakes classified by quality factor, expressing location uncertainty following [57], from 0 (best) to 1 (worst). (c) Distribution of parameters used to estimate the quality factor. Parameters are grouped into four classes based on the quality factor associated with the events. Boxes show the interquartile range, central lines represent the median, lines extend to minimum and maximum values, and open circles indicate outliers.
Although these other seismic swarms are included in the catalogue—particularly the one near the Ionian area of the Lamezia Terme–Catanzaro isthmus, which comprises approximately 580 events—they were not analyzed in detail in the present study. Most of these events occurred in the early months of 2025 and are characterised by lower magnitudes (ML < 3.5). Based on current knowledge, this cluster may represent an independent seismic phenomenon, and further investigation would be required to assess its tectonic significance and potential links to regional stress redistribution.
In contrast, the geographical distribution of the epicentres associated with the two main sequences—Pietrapaola and Cirò, highlighted by green boxes in Figure 5b—shows a clear spatial correlation with the Rossano–San Nicola shear zone. The epicentres are clustered near potential fault segments within the shear zone, which are predominantly characterised by strike-slip kinematics, suggesting a tectonic control on the observed seismicity.
To describe the quality of the locations, an empirical relation proposed by Michele et al. [57] was used, which allows a set of uncertainty estimators to be combined once they have been normalized. This enables the definition of a synthetic parameter for each location in a rapid, simple, and routine manner, providing an overall summary of the quality of the produced catalogue (Figure 5b). The quality factor was obtained by considering seven estimators: the number of phase observations actually used to compute the origin, the root mean square (RMS) of travel time residuals of the arrivals used in the origin calculation, the largest azimuthal gap in the station distribution as seen from the epicentre, the epicentral distance of the station closest to the epicentre, the semi-major axis of the 68%-confidence ellipse, the semi-minor axis of the 68%-confidence ellipse, and the three-dimensional Euclidean distance between the computed solution and the expected one. The last three estimators are based on uncertainties provided by NLL, which supplies Gaussian error estimates, including the expected hypocentre location (representing the centroid of the sampling points defining the probability density function, PDF) and the 68%-confidence ellipsoid that represents the likelihood hypocentre [52]. Therefore, the semi-major and semi-minor axes of the 68%-confidence ellipse provide a measure of location reliability, as does the distance between the expected hypocentre location and the maximum likelihood hypocentre location estimated from the probability density function. In fact, large differences between these locations may indicate an ill-conditioned problem, since Gaussian estimates only provide adequate uncertainty measures if the PDF exhibits a clear, single global minimum [52,58].
The estimator values were normalized using the 99th-percentile values of the catalogue, rather than the maximum values as originally suggested by the authors [57], in order to reduce the influence of outliers that could diminish the contribution of certain factors to the relationship. An exception was made for the number of phases, which was normalized relative to the median value: since a higher number of phases generally indicates better location reliability, this normalization better reflects that relationship. The quality coefficient was obtained by multiplying the normalized estimators for each location. Finally, a quality classification ranging from A (highest quality) to D (lowest quality) was attributed to each event based on the computed coefficient. The statistical distributions of the estimators, once grouped by the quality class of the corresponding hypocentre, are shown in the figure, where the median values, first and third quartiles, minimum and maximum values, and outliers are displayed (Figure 5c). Of the events in the catalogue, 53% percent are classified within the top two quality classes (6 in class A and 2720 in class B), 45% are in class C (2327 events), and just under 2% fall into the lowest-quality class (only 92 events).
4. Discussion
Examining the events associated with the two seismic swarms (Figure 6), it is evident that the overall quality of the locations is significantly better for the Pietrapaola sequence—where over 65% of the locations are classified as class B—thanks to the SISMIKO network, which was specifically planned for monitoring this area. Instead, the quality is considerably lower for the Cirò swarm, for which the temporary network was not yet available (events before August 2024) and, in any case, was not fully optimized for azimuthal coverage in this area—only about 37% of events fall into class B. However, it can also be observed that events classified as class C in both sequences show median quality coefficient values below 0.6 and thus very close to the upper limit of the previous class.
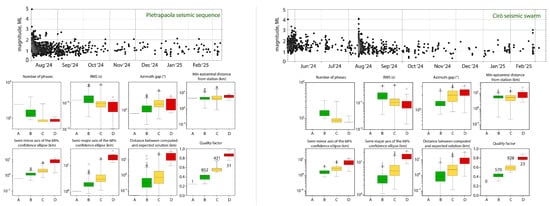
Figure 6.
Temporal trend of events and distribution of parameters used to estimate the location quality factor for the Pietrapaola sequence (left panel) and Cirò swarm (right panel)—cf. events in green frames in Figure 5b. Parameters are grouped into the four classes by quality factor. Boxes show the interquartile range, central lines represent the median, lines extend to minimum and maximum values, and open circles indicate outliers.
Analysing the trend of the average daily number of events as a function of time elapsed since the mainshock, the two sequences appear to exhibit similar behaviour (Figure 7a,c for Pietrapaola sequence and Cirò swarm, respectively). Although the number of events on the first day is higher for the Pietrapaola sequence following the = 5.0 mainshock, over the subsequent ten days the event rate decays with a slope of −0.49 (red dots in Figure 7a), which is very similar to the −0.46 observed in the Cirò swarm (red dots in Figure 7c). However, in the following days, the number of events decreases significantly, with slope values reaching −0.87 and −0.84 for the Pietrapaola sequence and the Cirò swarm, respectively (blue dots in Figure 7a,c). Furthermore, even when the Cirò seismic swarm recorded several events in mid-August 2024 with maximum magnitudes comparable to those of the main events in May, a clear increase in the ratio between the number of events and the days elapsed since the 24 May event is observable; however, the decay slope in the following days (green dots in Figure 7c) remained similar to the previous trend (blue dots in Figure 7c).
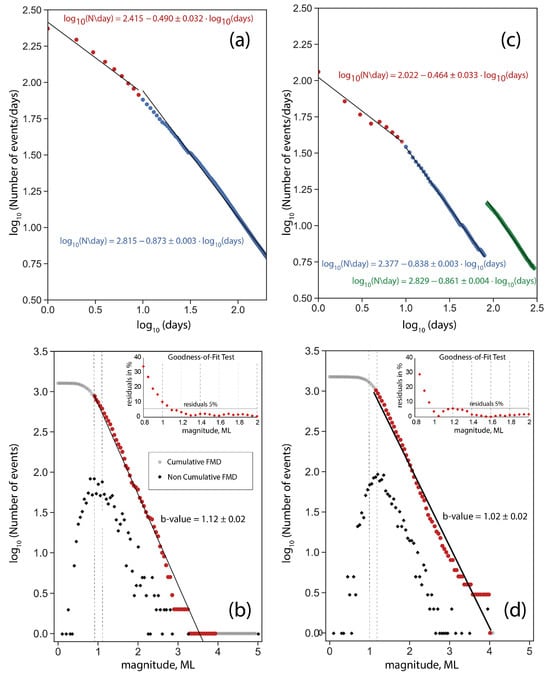
Figure 7.
The temporal distribution of aftershocks, shown as daily event counts versus time since the mainshock, follows a two-slope decay for both sequences. For the Pietrapaola sequence (a) and the Cirò swarm (c), the initial slopes are −0.49 and −0.46, while the second segments are steeper at −0.87 and −0.84. The second phase of the Cirò swarm (after 12 August 2024) has a similar slope of −0.86 (c). Considering magnitudes up to 4 and completeness magnitudes of 0.9 (Pietrapaola, (b)) and 1.2 (Cirò, (d)) using the maximum curvature (MAXC) method, b-values are 1.12 ± 0.02 and 1.02 ± 0.02. The Goodness-of-Fit Test (GFT, 5% residual threshold) gives slightly different completeness magnitudes of 1.1 and 1.0 (see residual plots in panels (b,d)).
During the first nine days following the main events, the slope of the curve (≈0.5) reflects the characteristic decay rate of a diffusion-like process [59,60,61]. After this period, however, the slope aligns with a typical Omori-like decay rate (≈0.9). These observations suggest that fluid pressure diffusion may have played a significant role in the seismogenesis during the early stage (first 9 days) of the sequences.
The catalogue nonetheless reveals relatively low completeness magnitudes. In fact, using the maximum curvature (MAXC) technique [62], which provides a rapid and straightforward method to estimate the completeness magnitude, values of 0.9 for the Pietrapaola sequence and 1.2 for the Cirò swarm are obtained. These correspond, in practice, to the magnitude bin with the highest frequency of events in the non-cumulative frequency–magnitude distribution (FMD). Furthermore, by adopting more conservative approaches, such as the Goodness-of-Fit Test (GFT) [62,63], the completeness magnitude is computed by comparing the observed FMD with the synthetic one derived from the Gutenberg–Richter law. The goodness of fit is evaluated through the parameter R, defined as the absolute difference in the number of events within each magnitude bin between the observed and synthetic distributions. Residuals are calculated using the formula proposed by [62,64]:
In Equation (1), and represent the observed and predicted cumulative number of events in each magnitude bin, respectively. The completeness magnitude is determined at the first cutoff magnitude at which a confidence level is reached. In the present case, by fixing a confidence level of 95%, completeness magnitudes of 1.1 and 1.0 are obtained for the two sequences, respectively (cf. charts for Goodness-of-Fit Test in Figure 7b,d).
The b-values obtained for the two sequences—0.9 ÷ 1.1 for the Pietrapaola sequence and 1.0 ÷ 1.2 for the Cirò swarm—are consistent with regional seismotectonic patterns and provide insights into the underlying faulting regimes. These values align well with those reported in the b-value tomography of the Calabrian Arc for the central Ionian sector, where values around 1.0 are found within the first 100 km of depth [65]. Additionally, other authors [66] reported b-values between 0.96 and 0.99 for the grid cells representative of the Italian territory that encompass the study areas, highlighting the relevance of these parameters in the context of probabilistic seismic hazard assessment. The slightly higher b-value for Pietrapaola may reflect a more homogeneous stress field and rupture along a single, well-defined fault segment, consistent with the observed clustering of hypocentres and the strike-slip to normal faulting mechanism. In contrast, the lower b-value for the Cirò swarm could indicate a more complex fault system, possibly involving multiple fault strands or segments, and a transpressive regime. This interpretation is supported by the diffuse spatial distribution of hypocentres and the mixed strike-slip/reverse focal mechanisms. Moreover, the temporal decay pattern of seismicity in Cirò, characterised by a two-slope model, suggests that fluid pressure diffusion may have contributed to the swarm dynamics, further differentiating it from the more tectonically driven Pietrapaola sequence.
To ensure consistency in the statistical analyses, all magnitudes used for the b-value estimation and the Gutenberg–Richter law analysis were expressed as local magnitudes (ML), derived from the relationship proposed by [56]. Only a few events within the two sequences exhibit magnitudes equal to or greater than 4, and the values were estimated from amplitudes recorded at monitoring stations located close to the event hypocentres. Therefore, the authors consider the magnitudes obtained using this relationship to be reliable, as it was specifically calibrated for seismic events that occurred within the Italian territory.
The vertical cross-section in a roughly SW–NE direction, oriented transversely to the S. Nicola–Rossano shear zone and following the distribution of the epicentres of the Pietrapaola sequence, shows the position of the hypocentres, which appears consistent with a high-angle dip. Considering the nodal plane with a strike compatible with the direction of the shear zone, the dip angle of 73° calculated by INGV is in good agreement with the distribution of the hypocentres (section AB in Figure 8). In fact, the hypocentres appear to align along a fault dipping at about 65°, and they also seem to indicate a secondary rupture with a comparable dip but in the opposite direction.
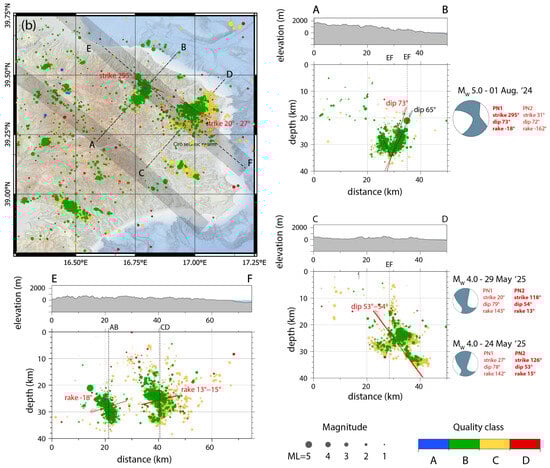
Figure 8.
Map showing seismic events color-coded by quality class and the locations of the vertical sections. Light-grey areas mark the two shear zones from Figure 2 and Figure 5. Sections AB and CD cross the RSFZ transversely, intersecting the Pietrapaola sequence and Cirò swarm, including events within 5 km of the vertical plane. Black segments show dip angles from focal mechanisms; in AB, red segments indicate dips from the Pietrapaola hypocentres. Section EF runs along the shear zone, including events within 10 km, with INGV focal mechanisms and reported strike, dip, and rake angles.
In the section corresponding to the Cirò swarm—which also crosses the Rossano–San Nicola shear zone but is shifted southeastward relative to the previous one—the 53°–54° dip angles, calculated using the TDMT technique for the nodal plane with a strike consistent with the potential seismic source, also appears to be in good agreement with the locations of the hypocentres (section CD in Figure 8).
The focal mechanisms, derived by comparing the hypocentre patterns with previous TDMT solutions for the main events, are consistent with the stress field orientation determined by Totaro et al. [67] for the Calabrian Arc region. Specifically, the fault associated with the Cirò swarm exhibits a transpressional behavior and is located within sector 3, corresponding to the northern Ionian Calabria area, which is characterized by a dominant left-lateral strike-slip regime oriented NNW and a principal compression axis trending ENE. The fault associated with the Campana seismic sequence also shows a predominant strike-slip regime, although accompanied by a secondary extensional component.
From the section aligned with the shear zone (section EF in Figure 8), which intersects both seismic sequences, it can be observed that the events associated with the Pietrapaola sequence are well-clustered, suggesting a fault rupture with approximate dimensions of 9 km in width and 11 km in length, located between 23 and 34 km depth. In contrast, the hypocentres of the Cirò swarm appear more scattered in the same figure, making it more challenging to delineate a well-defined rupture area. However, a main cluster can be identified, indicating a rupture that is more extensive in plan than that of the Pietrapaola sequence, but occurring at significantly shallower depths—approximately between 22 and 30 km. Additionally, a secondary, deeper cluster is observed below 30 km depth. The section in the figure also shows the rake angles and the kinematics of the two potential sources, as derived from the focal mechanisms of the main events, calculated by INGV.
Tomographic studies with good resolution identify the subducting Ionian Moho in the area, but with markedly different depth estimates. Earlier studies placed this surface at about 20 km depth [68], whereas more recent works locate it between approximately 35 and 45 km [69,70]. According to the latter authors, the higher-velocity-ratio anomalies observed along the outer front of the Calabrian subduction zone near the Ionian coastline are attributed to the hydrated sediments of the Ionian oceanic wedge. Agostinetti et al. [71] identified underplated subducted sediments, roughly 10 km thick, whose top lies at about 20 km depth beneath the Ionian coastline, close to the study area. These sedimentary layers are characterized by lower seismic velocities compared to both the upper and lower crust and are water-rich; they accumulate before undergoing dehydration and compaction, subsequently accreting to the overlying Calabrian crust, much of which is likely composed of such scraped-off sediments [71].
In light of this framework and the results obtained in our work, it appears that the two sequences occurred within the band of underplated sediments, as most of the hypocentres fall within this zone (Figure 9). The temporal evolution of the Cirò swarm (cf. map and sections in Figure 9) shows an initial phase with a cluster of deeper hypocentres (depths > 30 km), located near the interface between the lower sedimentary layers and the upper portion of the oceanic crust. Following the Campana sequence, the rupture appears to have migrated upward to shallower levels, with a well-defined cluster between 25 and 30 km depth, within the underplated sediments (section CD in Figure 9). Conversely, the Campana sequence exhibits an opposite and more rapid pattern in time: it starts with the main event near the top of the underplated sediments and subsequently propagates to greater depths within a few days (section AB in Figure 9).
Although the main fault geometries at the depths relevant to these sequences are not well constrained in the Rossano–San Nicola shear zone, and the DISS database does not report any specific seismogenic sources in this area, the mapped fault traces show multiple faults offsetting all the seismic-stratigraphic units down to about 5 km depth. These give rise to flower structures typical of strike-slip kinematics [72,73]. The sections in Figure 9 show the traces of the main faults belonging to the strike-slip system associated with the Rossano–San Nicola and Petilia–San Sosti shear zones, which run approximately parallel and extend subvertically within the upper few kilometers of the crust [19,74].

Figure 9.
Map showing seismic events color-coded by days since 1 August 2024, with the locations of the vertical sections. Light-grey areas mark the two shear zones, and black lines show main tectonic features from Figure 2 and Figure 5. Sections AB and CD cross the RSFZ transversely, including events within 5 km of the section plane. Interpretations are based on previous studies and observed hypocentres. The Moho is inferred by [69] and underplated sediment boundaries by [71], and yellow areas highlight major transpressive shear zones [19,74].
The geo-structural and geomorphological analysis carried out by Tansi [73] revealed a more complex system of surface faulting, with normal to strike-slip faults developing along the coastline, and a prevailing transpressive regime moving inland (i.e., in correspondence with the RSFZ shear zone shown in the figure). This strike-slip fault system, characterized by a secondary compressive or extensional component and detected within the uppermost crustal layers, may have developed as a consequence of ruptures in the deeper portions—similar to those identified for the two analysed sequences—which subsequently propagated into a stiffer medium, represented by the continental Calabrian crust, progressively acquiring a more vertical geometry.
5. Conclusions
On 1 August 2024, an = 5.0 earthquake struck the Ionian coast of north-central Calabria. In response, SISMIKO, the INGV operational group for emergency response installed four new temporary seismic stations. These supplemental stations, combined with the permanent National Seismic Network, aimed to improve the overall network geometry and enable more accurate determination of aftershocks. By mid-March 2025, this enhanced configuration had enabled the identification of over 1300 seismic events with good location accuracy.
Furthermore, despite its primary purpose, the temporary network proved valuable in detecting earthquakes from other nearby seismic swarms. Notably, it recorded events from the Cirò swarm, located approximately 20 km southeast of the mainshock from the other sequence. The Cirò swarm itself had two distinct phases: one in May 2024 and a second in August 2024, occurring about ten days after the main earthquake for which the network was originally set up.
The recordings from the SISMIKO network were regularly checked to ensure optimal operational time and data quality, including maintenance activities. Moreover, these recordings, along with those from the National Seismic Network, were processed for event localization using a machine learning-based procedure for phase picking, association, and relocation. This processing system was tested to assess its future use by the operational group for automated near-real-time data analysis and seismic sequence evolution monitoring.
The results obtained show good consistency with the focal mechanisms determined by the monitoring and surveillance service of INGV for the main events in the two sequences. Furthermore, the epicentral distribution appears to be in good agreement with the geological and tectonic knowledge of the area, which identifies seismogenic sources predominantly with strike-slip kinematics, and secondarily with normal or reverse faulting. These are governed by the presence of a wide shear zone trending approximately NW–SE, controlled by the subduction of the Ionian oceanic crust beneath the Eurasian plate.
The temporal evolution of the sequences appears to indicate a change in rate about nine days after the main events, suggesting that fluid pressure diffusion may have played a significant role in the early-stage seismogenesis. Based on the previous studies and on the results presented here, we interpret the two seismic sequences as adjustments occurring within the underplated sedimentary wedge located between the Calabrian continental crust and the Ionian oceanic crust. Most of the hypocentres of both sequences are likely situated within the zone of subducted sediments, or at most within the upper portion of the oceanic crust. These sediments, accumulated through subduction processes, are progressively deformed and fractured by the acting tectonic forces, as suggested by [71]. Ruptures in the deeper layers may, in turn, be responsible for the complex fault system affecting the more rigid upper Calabrian crust, where geo-structural and geomorphological studies have identified numerous fault traces and a predominantly subvertical dip. However, a more detailed study of the temporal and spatial distribution of stress variations would be required to substantiate these interpretations and, in any case, would provide further insights into the evolution of the phenomena.
Supplementary Materials
The following supporting information can be downloaded at https://www.mdpi.com/article/10.3390/geosciences15110436/s1.
Author Contributions
Conceptualization, A.C. (Antonio Costanzo), M.P., and E.D.; methodology, A.C. (Antonio Costanzo); software, A.C. (Antonio Costanzo), M.P., E.D., and S.M.; validation, A.C. (Antonio Costanzo), M.P., E.D., and A.G.; formal analysis, A.C. (Antonio Costanzo); investigation, A.C. (Antonio Costanzo), A.G., A.L.R., A.R., S.F., A.C. (Adriano Cavaliere), M.P., E.D., M.M. (Milena Moretti), M.A., S.B., F.C., M.M. (Matteo Migliari), I.C., M.C., D.P., and S.M.; resources, A.C. (Antonio Costanzo), M.P., E.D., M.M. (Milena Moretti), D.P., and L.M.; data curation, A.C. (Antonio Costanzo), M.P., E.D., S.M., and M.L.; writing—original draft preparation, A.C. (Antonio Costanzo) and M.P.; writing—review and editing, all authors; visualization, A.C. (Antonio Costanzo); supervision, A.C. (Antonio Costanzo), M.P., E.D., and L.M.; project administration, A.C. (Antonio Costanzo), M.P., and E.D. All authors have read and agreed to the published version of the manuscript.
Funding
The activities of SISMIKO have been funded in the framework of the Agreement between National Institute of Geophysics and Volcanology and the Department of Civil Protection (DPC) of the Italian Government Presidency of the Council of Ministers-DPC-INGV Agreement 2024–2026 (Annex A). The views and conclusions expressed in this paper are those of the authors and do not necessarily reflect the official policies of the DPC.
Informed Consent Statement
Not applicable.
Data Availability Statement
Waveforms from the SISMIKO temporary network are available at https://doi.org/10.13127/SD/O5PHM7WPKO (accessed on 8 November 2025). All data are freely accessible and can be downloaded through the EIDA portal at https://eida.ingv.it/en/ (accessed on 8 November 2025).
Acknowledgments
The authors wish to thank the Municipality of Savelli (KR), the Parco Astronomico Lilio, Vincenzo Veloce, and Don Franco for allowing the installation of the SISMIKO temporary network stations. They also wish to thank the reviewers and the academic editor for their valuable suggestions, which helped improve the paper.
Conflicts of Interest
The authors declare no conflicts of interest.
Abbreviations
The following abbreviations are used in this manuscript:
| CPTI | Parametric Catalogue of Italian Earthquakes— |
| https://doi.org/10.13127/cpti/cpti15.4 (accessed on 8 November 2025) | |
| CFTI5Med | Catalogue of Strong Earthquakes in Italy (461 B.C.–1997) and in the Mediterranean |
| Area (760 B.C.–1500)— https://storing.ingv.it/cfti/cfti5/ (accessed on | |
| 8 November 2025) | |
| DOI | Digital Object Identifier |
| DPC | Dipartimento di Protezione Civile—Department of Civil Protection |
| EIDA | European Integrated Data Archive |
| FBA | Force-Balance Accelerometer |
| FDSN | Federation of Digital Seismograph Networks |
| GaMMA | Gaussian Mixture Model Association |
| INGV | National Institute of Geophysics and Volcanology |
| IPSI | Italian Present-day Stress Indicators |
| NLL | NonLinLoc Software |
| Probability Density Function | |
| PSFZ | Petilia–San Sosti Fault Zone |
| RAN | National Accelerometric Network |
| RMS | Root Mean Square |
| RSFZ | Rossano–San Nicola Fault Zone |
| RSN | Rete Sismica Nazionale—National Seismic Network |
| SISMIKO | Operational Group—Coordination of Mobile Seismic Networks in Emergencies |
| SNR | Signal-to-Noise Ratio |
| TDMT | Time-Domain Moment Tensor |
References
- INGV. Earthquake with Magnitude of Mw 5.0 on 01-08-2024 at 21:43:19 (Italy) in Region 4 km SW Pietrapaola (CS). Available online: https://terremoti.ingv.it/en/event/39921481 (accessed on 8 November 2025).
- Margheriti, L.; Nostro, C.; Cocina, O.; Castellano, M.; Moretti, M.; Lauciani, V.; Quintiliani, M.; Bono, A.; Mele, F.M.; Pintore, S.; et al. Seismic surveillance and earthquake monitoring in Italy. Seismol. Res. Lett. 2021, 92, 1659–1671. [Google Scholar] [CrossRef]
- Scognamiglio, L.; Tinti, E.; Quintiliani, M. Time Domain Moment Tensor (TDMT) [Data Set]. Istituto Nazionale di Geofisica e Vulcanologia (INGV). Available online: https://terremoti.ingv.it/tdmt (accessed on 8 November 2025).
- DISS Working Group. Database of Individual Seismogenic Sources (DISS), Version 3.0.0. Istituto Nazionale di Geofisica e Vulcanologia (INGV). Available online: https://diss.ingv.it/data/ (accessed on 8 November 2025).
- INGV. Earthquake with Magnitude of Mw 4.0 on 24-05-2024 at 19:35:25 (Italy) in Region 6 km N Carfizzi (KR). Available online: https://terremoti.ingv.it/en/event/38844781 (accessed on 8 November 2025).
- INGV. Earthquake with Magnitude of Mw 4.0 on 29-05-2024 at 14:07:13 (Italy) in Region 6 km E Umbriatico (KR). Available online: https://terremoti.ingv.it/en/event/38928171 (accessed on 8 November 2025).
- INGV. Earthquake with Magnitude of Mw 3.8 on 12-08-2024 at 15:31:10 (Italy) in Region 6 km S Crucoli (KR). Available online: https://terremoti.ingv.it/en/event/40044811 (accessed on 8 November 2025).
- Mariucci, M.T.; Montone, P. IPSI 1.7, Database of Italian Present-Day Stress Indicators. Istituto Nazionale di Geofisica e Vulcanologia (INGV), 2025. Available online: https://ipsi.rm.ingv.it/ (accessed on 8 November 2025).
- Pastori, M.; Margheriti, L.; De Gori, P.; Govoni, A.; Lucente, F.P.; Moretti, M.; Marchetti, A.; Di Giovambattista, R.; Anselmi, M.; De Luca, P.; et al. The 2011–2014 Pollino Seismic Swarm: Complex Fault Systems Imaged by 1D Refined Location and Shear Wave Splitting Analysis at the Apennines–Calabrian Arc Boundary. Front. Earth Sci. 2021, 9, 618293. [Google Scholar] [CrossRef]
- Cifelli, F.; Mattei, M.; Rossetti, F. Tectonic evolution of arcuate mountain belts on top of a retreating subduction slab: The example of the Calabrian Arc. J. Geophys. Res. 2007, 112, B09101. [Google Scholar] [CrossRef]
- Critelli, S.; Muto, F.; Perri, F.; Tripodi, V. Interpreting provenance relations from sandstone detrital modes, southern Italy foreland region: Stratigraphic record of the Miocene tectonic evolution. Mar. Pet. Geol. 2017, 87, 47–59. [Google Scholar] [CrossRef]
- Maesano, F.E.; Tiberti, M.M.; Basili, R. The Calabrian Arc: Three-dimensional modelling of the subduction interface. Sci. Rep. 2017, 7, 8887. [Google Scholar] [CrossRef]
- Tripodi, V.; Muto, F.; Brutto, F.; Perri, F.; Critelli, S. Neogene–Quaternary evolution of the forearc and backarc regions between the Serre and Aspromonte Massifs, Calabria (southern Italy). Mar. Pet. Geol. 2018, 95, 328–343. [Google Scholar] [CrossRef]
- Critelli, S.; Martín-Martín, M. Provenance, paleogeographic and paleotectonic interpretations of Oligocene–Lower Miocene sandstones of the western-central Mediterranean region: A review. J. Asian Earth Sci. X 2022, 8, 100124. [Google Scholar] [CrossRef]
- Macrì, P.; Spernaza, F.; Capraro, L. Magnetic fabric of Plio–Pleistocene sediments from the Crotone fore-arc basin: Insights on the recent tectonic evolution of the Calabrian Arc (Italy). J. Geodyn. 2014, 81, 67–79. [Google Scholar] [CrossRef]
- Zecchin, M.; Accaino, F.; Ceramicola, S.; Civile, D.; Critelli, S.; Da Lio, C.; Mangano, G.; Prosser, G.; Teatini, P.; Tosi, L. The Crotone Megalandslide, southern Italy: Architecture, timing and tectonic control. Sci. Rep. 2018, 8, 7778. [Google Scholar] [CrossRef]
- Zecchin, M.; Civile, D.; Caffau, M.; Critelli, S.; Muto, F.; Mangano, G.; Ceramicola, S. Sedimentary evolution of the Neogene–Quaternary Crotone Basin (southern Italy) and relationships with large-scale tectonics: A sequence stratigraphic approach. Mar. Pet. Geol. 2020, 117, 104381. [Google Scholar] [CrossRef]
- Corradino, M.; Morelli, D.; Ceramicola, S.; Scarfì, L.; Barberi, G.; Monaco, C.; Pepe, F. Active tectonics in the Calabrian Arc: Insights from the Late Miocene to Recent structural evolution of the Squillace Basin (offshore eastern Calabria). Tectonophysics 2023, 851, 229772. [Google Scholar] [CrossRef]
- Mangano, G.; Zecchin, M.; Critelli, S.; Civile, D. Tectonic evolution of the Crotone Basin (central Mediterranean): The important role of two strike-slip fault zones. Mar. Pet. Geol. 2024, 163, 106769. [Google Scholar] [CrossRef]
- Rovida, A.; Locati, M.; Camassi, R.; Lolli, B.; Gasperini, P. The Italian earthquake catalogue CPTI15. Bull. Earthq. Eng. 2020, 18, 2953–2984. [Google Scholar] [CrossRef]
- Guidoboni, E.; Ferrari, G.; Tarabusi, G.; Sgattoni, G.; Comastri, A.; Mariotti, D.; Ciuccarelli, C.; Bianchi, M.G.; Valensise, G. CFTI5Med, the new release of the catalogue of strong earthquakes in Italy and in the Mediterranean area. Sci. Data 2019, 6, 80. [Google Scholar] [CrossRef]
- Guidoboni, E.; Ferrari, G.; Mariotti, D.; Comastri, A.; Tarabusi, G.; Sgattoni, G.; Valensise, G. CFTI5Med, Catalogo dei Forti Terremoti in Italia (461 a.C.–1997) e Nell’Area Mediterranea (760 a.C.–1500) [Data Set]. Istituto Nazionale di Geofisica e Vulcanologia (INGV). 2018. Available online: https://storing.ingv.it/cfti/cfti5/ (accessed on 8 November 2025).
- Das, R.; Sharma, M.L.; Wason, H.R.; Choudhury, D.; Gonzales, G. A seismic moment magnitude scale. Bull. Seismol. Soc. Am. 2019, 109, 1542–1555. [Google Scholar] [CrossRef]
- Das, R.; Menesis, C.; Urrutia, D. Regression relationships for conversion of body wave and surface wave magnitudes toward Das magnitude scale Mwg. Nat. Hazards 2023, 117, 365–380. [Google Scholar] [CrossRef]
- Demir, A.; Palanci, M.; Kayhan, A.H. Enhanced conditional ground motion selection model considering spectral compatibility and variability of three components for multi-directional analysis. Appl. Sci. 2025, 15, 4135. [Google Scholar] [CrossRef]
- Xi, S.; Li, X.; Wan, W.; Wang, X.; Wang, H.; Hu, B. Strong ground motion prediction model for EPA in Loess Plateau of Northwestern China. Sci. Rep. 2025, 15, 23128. [Google Scholar] [CrossRef]
- Costanzo, A.; Pastori, M.; Cavaliere, A.; D’Alema, E.; Margheriti, L.; Marzorati, S.; Moretti, M.; Piccinini, D.; Anselmi, M.; Bagh, S.; et al. SISMIKO Response to the 2024 Pietrapaola Seismic Swarm in the Calabrian Upper Ionian Side. In Proceedings of the IAGA/IASPEI Joint Scientific Meeting 2025, Lisbon, Portugal, 31 August–5 September 2025. Abstract Number AS25-1181. [Google Scholar]
- Moretti, M.; Margheriti, L.; D’Alema, E.; Piccinini, D. SISMIKO: INGV operational task force for rapid deployment of seismic network during earthquake emergencies. Front. Earth Sci. 2023, 11, 1146579. [Google Scholar] [CrossRef]
- Istituto Nazionale di Geofisica e Vulcanologia (INGV). Rete Sismica Nazionale (RSN) [Data Set]. 2005. Available online: https://eida.ingv.it/en/network/IV (accessed on 8 November 2025).
- Italian Government, Presidency of the Council of Ministers, Civil Protection Department. Italian Strong Motion Network [Data Set]. 1972. Available online: https://www.fdsn.org/networks/detail/IT/ (accessed on 8 November 2025).
- Universita Della Calabria, Italy. Rete Sismica Unical [Data Set]. 1981. Available online: https://www.fdsn.org/networks/detail/IY/ (accessed on 8 November 2025).
- Danecek, P.; Pintore, S.; Mazza, S.; Mandiello, A.; Fares, M.; Carluccio, I.; Della Bina, E.; Franceschi, D.; Moretti, M.; Lauciani, V.; et al. The Italian Node of the European Integrated Data Archive. Seismol. Res. Lett. 2021, 92, 1726–1737. [Google Scholar] [CrossRef]
- European Integrated Data Archive Italia (EIDA), EIDA INGV ITALIA. Available online: https://eida.ingv.it/en/ (accessed on 8 November 2025).
- Costanzo, A.; Pastori, M.; Cavaliere, A.; D’Alema, E.; Margheriti, L.; Marzorati, S.; Moretti, M.; Piccinini, D.; Anselmi, M.; Bagh, S.; et al. INGV SISMIKO Emergency Seismic Network for Pietrapaola Sequence 2024 (Southern Italy) [Data set]. Istituto Nazionale di Geofisica e Vulcanologia (INGV). 2024. Available online: https://eida.ingv.it/en/network/3Q_2024 (accessed on 8 November 2025).
- Pastori, M.; Falcone, S.; Moschillo, R.; Cavaliere, A.; Nardone, L.; D’Ambrosio, M. SISMIKO: Strumenti operativi per la gestione delle emergenze sismiche sviluppati in ARCGIS. Rapp. Tec. INGV 2025, 499, 1–30. [Google Scholar] [CrossRef]
- Beyreuther, M.; Barsch, R.; Krischer, L.; Megies, T.; Behr, Y.; Wassermann, J. ObsPy: A Python Toolbox for Seismology. Seismol. Res. Lett. 2010, 81, 530–533. [Google Scholar] [CrossRef]
- Krischer, L.; Megies, T.; Barsch, R.; Beyreuther, M.; Lecocq, T.; Caudron, C.; Wassermann, J. ObsPy: A bridge for seismology into the scientific Python ecosystem. Comput. Sci. Discov. 2015, 8, 014003. [Google Scholar] [CrossRef]
- International Federation of Digital Seismograph Networks (FDSN), FDSN Web Services. Available online: https://www.fdsn.org/webservices/ (accessed on 8 November 2025).
- Zhu, W.; Beroza, G.C. PhaseNet: A deep-neural-network-based seismic arrival-time picking method. Geophys. J. Int. 2019, 216, 261–273. [Google Scholar] [CrossRef]
- Sugan, M.; Peruzza, L.; Romano, M.A.; Guidarelli, M.; Moratto, L.; Sandron, D.; Linares, M.P.P.; Romanelli, M. Machine learning versus manual earthquake location workflow: Testing LOC-FLOW on an unusually productive microseismic sequence in northeastern Italy. Nat. Hazards Risk 2023, 14, 2284120. [Google Scholar] [CrossRef]
- Park, Y.; Shelly, D.R. The Value of Hyperparameter Optimization in Phase-Picking Neural Networks. Seism. Rec. 2024, 4, 231–239. [Google Scholar] [CrossRef]
- Ce, J.; Lihua, F.; Liping, F.; Boren, L. Comparison of the earthquake detection abilities of PhaseNet and EQTransformer with the Yangbi and Maduo earthquakes. Earthq. Sci. 2022, 34, 425–435. [Google Scholar] [CrossRef]
- García, J.E.; Fernández-Prieto, L.M.; Villaseñor, A.; Sanz, V.; Ammirati, J.B.; Díaz Suárez, E.A.; García, C. Performance of Deep Learning Pickers in Routine Network Processing Applications. Seismol. Res. Lett. 2022, 93, 2529–2542. [Google Scholar] [CrossRef]
- Zhu, J.; Zefeng, L.; Lihua, F. USTC-Pickers: A Unified Set of seismic phase pickers transfer learned for China. Earthq. Sci. 2023, 36, 95–112. [Google Scholar] [CrossRef]
- Costanzo, A. A New Catalogue and Insights into the 2022 Adriatic Offshore Seismic Sequence Using a Machine Learning-Based Procedure. Sensors 2025, 25, 82. [Google Scholar] [CrossRef]
- Zhu, W.; McBrearty, I.W.; Mousavi, S.M.; Ellsworth, W.L.; Beroza, G.C. Earthquake Phase Association Using a Bayesian Gaussian Mixture Model. J. Geophys. Res. Solid Earth 2022, 127, e2021JB023249. [Google Scholar] [CrossRef]
- Zhu, W.; Tai, K.S.; Mousavi, S.M.; Bailis, P.; Beroza, G.C. An End-To-End Earthquake Detection Method for Joint Phase Picking and Association Using Deep Learning. J. Geophys. Res. Solid Earth 2022, 127, e2021JB023283. [Google Scholar] [CrossRef]
- Duan, L.F.; Zhao, C.P.; Du, X.Z.; Zhou, L.Q. Machine learning-based automatic construction of earthquake catalog for reservoir areas in multiple river basins of Guizhou province, China. Earthq. Sci. 2023, 36, 132–146. [Google Scholar] [CrossRef]
- Cindy, S.Y.L.; Sacha, L.; Margarita, S.; Maximilian, J.W. Deep learning phase pickers: How well can existing models detect hydraulic-fracturing induced microseismicity from a borehole array? Geophys. J. Int. 2025, 240, 535–549. [Google Scholar] [CrossRef]
- Pilot, M.; Schlindwein, V. A Practical Approach to Automatic Earthquake Catalog Compilation in Local OBS Networks Using Deep-Learning and Network-Based Algorithms. Seismol. Res. Lett. 2024, 95, 2124–2140. [Google Scholar] [CrossRef]
- Giacomuzzi, G.; Fonzetti, R.; Govoni, A.; De Gori, P.; Chiarabba, C. Causal processes of shallow and deep seismicity at Campi Flegrei caldera. Commun. Earth Environ. 2025, 6, 70. [Google Scholar] [CrossRef]
- Lomax, A.; Virieux, J.; Volant, P.; Berge-Thierry, C. Probabilistic Earthquake Location in 3D and Layered Models. In Advances in Seismic Event Location. Modern Approaches in Geophysics; Thurber, C.H., Rabinowitz, N., Eds.; Springer: Dordrecht, The Netherlands, 2000; pp. 101–134. [Google Scholar] [CrossRef]
- Tarantola, A. Inverse Problem Theory and Methods for Model Parameter Estimation; Society for Industrial and Applied Mathematics (SIAM): Philadelphia, PA, USA, 2005; pp. 57–80. [Google Scholar]
- Di Stefano, R.; Ciaccio, M.G. The lithosphere and asthenosphere system in Italy as inferred from the Vp and Vs 3D velocity model and Moho map. J. Geodyn. 2014, 82, 16–25. [Google Scholar] [CrossRef]
- Di Stefano, R.; Ciaccio, M.G. Seismic Velocity Model of P- and S-Waves for the Italian Lithosphere. Available online: https://zenodo.org/record/4263201 (accessed on 8 November 2025).
- Di Bona, M. A Local Magnitude Scale for Crustal Earthquakes in Italy. Bull. Seismol. Soc. Am. 2016, 106, 242–258. [Google Scholar] [CrossRef]
- Michele, M.; Latorre, D.; Emolo, A. An Empirical Formula to Classify the Quality of Earthquake Locations. Bull. Seismol. Soc. Am. 2019, 109, 2755–2761. [Google Scholar] [CrossRef]
- Theunissen, T.; Chevrot, S.; Sylvander, M.; Monteiller, V.; Calvet, M.; Villaseñor, A.; Benahmed, S.; Pauchet, H.; Grimaud, F. Absolute earthquake locations using 3-D versus 1-D velocity models below a local seismic network: Example from the Pyrenees. Geophys. J. Int. 2018, 212, 1806–1828. [Google Scholar] [CrossRef]
- Miller, S.A. Aftershocks are fluid-driven and decay rates controlled by permeability dynamics. Nat. Commun. 2020, 11, 5787. [Google Scholar] [CrossRef] [PubMed]
- Pezzo, G.; Billi, A.; Carminati, E.; Conti, A.; De Gori, P.; Devoti, R.; Lucente, F.P.; Palano, M.; Petracchini, L.; Serpelloni, E.; et al. Seismic source identification of the 9 November 2022 Mw 5.5 offshore Adriatic Sea (Italy) earthquake from GNSS data and aftershock relocation. Sci. Rep. 2023, 13, 11474. [Google Scholar] [CrossRef] [PubMed]
- Peña, C.; Heidbach, O.; Metzger, S.; Schurr, B.; Moreno, M.; Bedford, J.; Oncken, O.; Facenna, C. Pore-pressure diffusion controls upper-plate aftershocks of the 2014 Iquique earthquake. Nat. Commun. 2025, 16, 9474. [Google Scholar] [CrossRef] [PubMed]
- Wiemer, S.; Wyss, M. Minimum magnitude of complete reporting in earthquake catalogs: Examples from Alaska, the Western United States, and Japan. Bull. Seismol. Soc. Am. 2000, 90, 859–869. [Google Scholar] [CrossRef]
- Woessner, J.; Wiemer, S. Assessing the quality of earthquake catalogues: Estimating the magnitude of completeness and its uncertainty. Bull. Seismol. Soc. Am. 2005, 95, 684–698. [Google Scholar] [CrossRef]
- Mignan, A.; Woessner, J. Estimating the magnitude of completeness for earthquake catalogs. Available online: https://www.corssa.org/export/sites/corssa/.galleries/articles-pdf/Mignan-Woessner-2012-CORSSA-Magnitude-of-completeness.pdf_2063069299.pdf (accessed on 8 November 2025).
- Godano, C.; Petrillo, G.; Tramelli, A.; Convertito, V. The b-Value Tomography of the Calabrian Arc. Earth Space Sci. 2025, 12, e2024EA004065. [Google Scholar] [CrossRef]
- Gulia, L.; Meletti, C. Testing the b-value variability in Italy and its influence on Italian PSHA. Boll. Geofis. Teor. Appl. 2008, 49, 59–76. [Google Scholar]
- Totaro, C.; Orecchio, B.; Presti, D.; Scolaro, S.; Neri, G. Seismogenic stress field estimation in the Calabrian Arc region (south Italy) from a Bayesian approach. Geophys. Res. Lett. 2016, 43, 8960–8969. [Google Scholar] [CrossRef]
- Barberi, G.; Cosentino, M.T.; Gervasi, A.; Guerra, I.; Neri, G.; Orecchio, B. Crustal seismic tomography in the Calabrian Arc region, south Italy. Phys. Earth Planet. Inter. 2004, 147, 297–314. [Google Scholar] [CrossRef]
- Piana Agostinetti, N.; Amato, A. Moho depth and Vp/vS ratio in peninsular Italy from teleseismic receiver functions. J. Geophys. Res. 2009, 114, B06303. [Google Scholar] [CrossRef]
- Gualtieri, L.; Serretti, P.; Morelli, A. Finite-difference P wave travel time seismic tomography of the crust and uppermost mantle in the Italian region. Geochem. Geophys. Geosyst. 2013, 15, 69–88. [Google Scholar] [CrossRef]
- Piana Agostinetti, N.; Park, J.; Lucente, F.P. Mantle wedge anisotropy in Southern Tyrrhenian Subduction Zone (Italy), from receiver function analysis. Tectonophysics 2008, 462, 35–48. [Google Scholar] [CrossRef]
- Mangano, G.; Tiago, M.A.; Zecchin, M.; Civile, D.; Critelli, S. The Rossano-San Nicola Fault Zone evolution impacts the burial and maturation histories of the Crotone Basin, Calabrian Arc, Italy. Pet. Geosci. 2023, 29, 1–19. [Google Scholar] [CrossRef]
- Tansi, C.; Critelli, S.; Folino Gallo, M.; Gervasi, A.; Imbrogno, G.; La Rocca, M.; Ponte, M.; Tripodi, V.; Muto, F. Seismotectonics and landslides of the NE border of the Calabrian Arc (Southern Italy). J. Maps 2024, 20, 2347901. [Google Scholar] [CrossRef]
- Tansi, C.; Muto, F.; Critelli, S.; Iovine, G. Neogene-Quaternary strike-slip tectonics in the central Calabrian Arc (southern Italy). J. Geodyn. 2007, 43, 393–414. [Google Scholar] [CrossRef]
Disclaimer/Publisher’s Note: The statements, opinions and data contained in all publications are solely those of the individual author(s) and contributor(s) and not of MDPI and/or the editor(s). MDPI and/or the editor(s) disclaim responsibility for any injury to people or property resulting from any ideas, methods, instructions or products referred to in the content. |
© 2025 by the authors. Licensee MDPI, Basel, Switzerland. This article is an open access article distributed under the terms and conditions of the Creative Commons Attribution (CC BY) license (https://creativecommons.org/licenses/by/4.0/).