Abstract
The quality of coking coal is vital in steelmaking, impacting final product quality and process efficiency. Conventional forecasting methods often rely on empirical models and expert judgment, which may lack accuracy and scalability. Previous research has explored various methods for forecasting coking coal quality parameters, yet these conventional methods frequently fall short in terms of accuracy and adaptability to different mining conditions. Existing forecasting techniques for coking coal quality are limited in their precision and scalability, necessitating the development of more accurate and efficient methods. This study aims to enhance the accuracy and efficiency of forecasting coking coal quality parameters by employing neural networks and artificial intelligence algorithms, specifically in the context of Knurow and Szczyglowice mines. The research involves gathering historical data on various coking coal quality parameters, including a proximate and ultimate analysis, to train and test neural network models using the Group Method of Data Handling (GMDH). Real-world data from Knurow and Szczyglowice mines’ coal production facilities form the basis of this case study. The integration of neural networks and artificial intelligence techniques significantly improves the accuracy of predicting key quality parameters such as ash content, sulfur content, volatile matter, and calorific value. This study also examines the impact of these quality indicators on operational costs and highlights the importance of final indicators like the Coke Reactivity Index (CRI) and Coke Strength after Reaction (CSR) in expanding industrial reserve concepts. Model performance is evaluated using metrics such as mean absolute error (MAE), root mean square error (RMSE), and coefficient of determination (R2). The findings demonstrate the effectiveness of these advanced techniques in enhancing predictive modeling in the mining industry, optimizing production processes, and improving overall operational efficiency. Additionally, this research offers insights into the practical implementation of advanced analytics tools for predictive maintenance and decision-making support within the mining sector.
1. Introduction
In the era of Industry 4.0, artificial intelligence (AI) is crucial for addressing challenges across various sectors. Machine learning models analyze real-time data from sensors, predicting equipment failures and enabling proactive maintenance, which reduces downtime and enhances efficiency [1]. AI optimizes processes and automates tasks in manufacturing, logistics, and supply chain management, leading to cost savings and increased productivity [2,3,4].
AI-powered computer vision systems revolutionize quality control by offering precise defect detection. These systems continuously refine their performance through feedback loops, enhancing accuracy and reliability in complex production environments [5]. Real-time monitoring of visual data streams from production lines ensures consistent product quality by triggering automated responses to abnormalities [6,7].
Natural language processing (NLP) and machine learning enable businesses to analyze customer data effectively, providing personalized experiences and optimizing customer interactions [8,9]. NLP techniques analyze customer feedback, classifying sentiment to address issues proactively and maintain positive brand perception [10,11]. Machine learning models predict customer churn, helping businesses retain customers [12].
AI-driven mining processes and energy management systems optimize energy consumption and enhance efficiency and sustainability. In smart buildings, these systems adjust energy usage based on occupancy and environmental conditions, reducing waste and enhancing comfort [13]. In industrial facilities, AI predicts equipment failures and optimizes production schedules, improving productivity and minimizing environmental impact. AI-driven systems in urban environments optimize resource use, such as electricity and transportation, reducing outages and emissions [14]. However, further improvements in modeling mining processes are needed to fully leverage these advancements [15].
Despite the growing momentum of “Grid mining” as an emerging trend, its acknowledgment within the mining sector may still be limited [16]. Nonetheless, the successful integration of neural networks into mining operations demands a comprehensive approach that considers several critical aspects. This encompasses meticulous attention to data collection methodologies, preprocessing techniques, model training procedures, and domain-specific expertise. To fully harness the potential advantages offered by neural networks in optimizing operations and enhancing decision-making processes, mining companies must make strategic investments in various areas [17]. Firstly, establishing a robust data infrastructure is paramount, ensuring the availability of high-quality data necessary for training and validation. Additionally, recruiting and retaining skilled personnel with expertise in machine learning, data science, and mining operations are essential for effectively implementing and managing neural network-based systems. Furthermore, seamless integration strategies are crucial to ensure that neural network solutions complement existing workflows and systems seamlessly [18]. This involves aligning the implementation of neural networks with the specific requirements and objectives of mining operations, while also considering scalability and interoperability with other technologies. Moreover, ongoing research and development efforts are necessary to continually refine and optimize neural network models for mining applications [19,20]. This includes exploring novel architectures, algorithms, and methodologies tailored to address the unique challenges and complexities of the mining industry. In summary, while “Grid mining” and neural network integration hold promise for revolutionizing mining operations, their successful adoption requires a holistic approach encompassing data infrastructure, human resources, integration strategies, and ongoing innovation. By prioritizing these aspects, mining companies can unlock the full potential of neural networks to drive efficiency, productivity, and sustainability in their operations [21].
Essential components of intelligent mining encompass the integration of automation and robotics, both on the surface and underground, alongside the implementation of monitoring and control systems, analytics, and predictive modeling. Additionally, the effective utilization of big data is crucial for streamlining mining operations and related tasks [22,23]. Real-time monitoring using sensors, cameras, and IoT devices plays a pivotal role in facilitating proactive maintenance, early issue detection, and operational improvements [24].
Smart mining involves harnessing cutting-edge technologies such as artificial intelligence, the Internet of Things (IoT), and automation to enhance productivity, safety, and environmental stewardship within mining operations. This requires the integration of various digital systems and data-driven technologies to optimize decision-making and operational workflows [25]. The global transition towards circular economy principles necessitates a revaluation of traditional mining methodologies to ensure long-term economic and environmental sustainability.
The author addresses challenges in the mining industry by leveraging innovative AI methodologies to solve real-world problems. Previously, the author explored geological modeling, production design, and mining planning using AI systems [26]. A notable approach involves presenting mining models as comprehensive simulations controlled from a command center, enhancing accuracy with visual representations of infrastructure elements [27].
These concepts are crucial for scaling laws, modeling, and understanding complex systems. Economic parameters, such as profitability, are vital for mining operations [28,29]. The author’s work on AI-driven simulation systems for various mining operations underscores the research’s validity [30,31,32]. This work ensures conformity in establishing coal quality characteristics across different mines. Dyczko [33] analyzed data from KWK “Borynia-Zofiówka” and “Zofiówka” Mining Plant to test geological sediments as predictors of coal quality. These sediments provide valuable information about coal quality, including calorific value, ash content, and environmental impact.
Incorporating diverse viewpoints into neural networks enhances decision-making and operational efficiency in mining [34]. This approach uses a wide range of data sources to derive insights, leading to accurate predictions, better process control, and higher safety standards [35].
By analyzing geological data, neural networks optimize drilling locations, resource distribution, and geological formations. Integrating equipment status data enables predictive maintenance, minimizing downtime and optimizing asset utilization [36,37]. Operational variables such as production rates and energy consumption are also optimized, resulting in streamlined workflows and improved resource allocation. Comparing neural network analysis results between different mines reveals efficiency disparities, identifies best practices, and highlights improvement areas. Tailored technical proposals based on these findings enhance operational effectiveness and sustainability.
This study aims to use geological and technical parameters as predictors of coal quality by applying AI and neural networks. Identifying significant parameters among large datasets is crucial for optimizing mine operations. The author developed a method for calculating these parameters based on AI and neural networks. The analysis highlights the need to improve methodologies for assessing coal quality. The author reviewed existing techniques and suggested a potential correlation between Coal Reactivity Index (CRI) and Coal Strength after Reaction (CSR) characteristics, influenced by geological parameters. Geological factors significantly determine CRI and CSR values due to coal’s origin and mineral content.
2. Strategy and Policy for Management of the Production Line of a Coal and Coke Group in Terms of Testing the Quality of the Deposit Exploited and the Coke Produced
The “QUALITY Programme from Deposit to Sea”, which is central to the JSW Capital Group’s 2018 strategy, defines detailed objectives for key areas of responsibility. It aims to reduce risks and business challenges while maximizing opportunities resulting from socioeconomic changes.
The JSW Capital Group’s new strategy set goals for key areas of responsibility: reducing risks and related business challenges on one hand and maximizing opportunities from social and economic changes on the other. The implementation of the “QUALITY Programme” was made a key element of the JSW Capital Group’s business strategy. This comprises several actions to ensure uniform procedures for designing and planning production actions, deposit modeling, production schedule planning, and continuous monitoring and supervision of production quality, including
- -
- Geological databases for six mines have been built and organized.
- -
- IT tools for scheduling and deposit modeling have been implemented.
- -
- Geological models have been developed for strategic deposits, resource parts, and mining levels of all JSW CG mines.
- -
- Strategic production schedules have been developed, linked with deposit models.
- -
- A central strategic scheduling model has been developed, enabling the integration of mine schedules at the JSW CG Management Board Office level.
- -
- Plans to build a central database, aggregating deposit models and production schedules, are underway at the JSW CG Management Board Office level.
The update of the JSW Capital Group’s business strategy, initiated in early 2020, primarily aims to ensure the safety and continuity of the group’s production. This led to the adoption of necessary regulations to prevent mines from accumulating coal beyond safe levels and secure strategic storage sites. This ensures that, in situations such as rail traffic halts due to the pandemic, it will be possible to safely deposit the coal extracted when the mines’ storage sites are near 75% capacity. These activities, focused on optimizing production volume, include an ongoing analysis and monitoring of production capacity, research, and forecasting of quality and sales opportunities based on internal and external market demand (both exports and domestic sales).
The establishment of the new Quality Management Office formed part of the “Product Quality Strategy for the JSW Capital Group for 2020–2030”, adopted by the Management Board. The “Quality Management Policy for Deposit and Product Testing in the JSW Capital Group” ensures the desired level of qualitative parameters of coking coal and steam coal, as well as the rules for forecasting the qualitative parameters of steam coal [15]—see Figure 1.
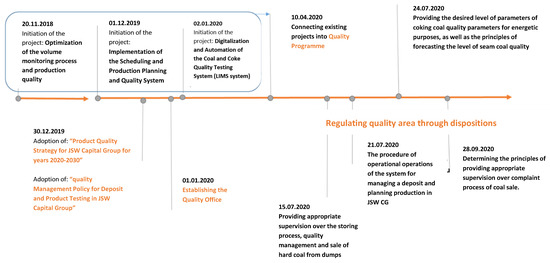
Figure 1.
Schedule of actions taken to develop proactive production control and stabilization of commercial coal parameters in JSW CG—source: [own study].
Jastrzębska Spółka Węglowa SA (JSW SA) is a Polish mining company producing coking coal and coke for energy and electricity generation. Currently four mines belong to JSW S.A.: KWK “Borynia-Zofiówka-Bzie”, KWK “Budryk”, KWK “Pniówek”, and from 1 August 2014 also KWK Knurów-Szczygłowice (Figure 2).
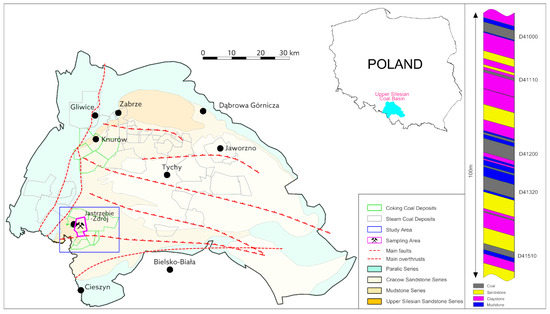
Figure 2.
The mining areas of JSW S.A. in relation to the surrounding mines (JSW S.A. materials).
These four mines belong to JSW S.A. conduct mining operations in the south-western part of the Upper Silesian Coal Basin in the vicinity of Jastrzębie Zdrój, Żory, Knurów, Mikołów, Świerklany, Suszec, Pawłowice, Mszana, Godów, Orzesze, Ornontowice, Gierałtowice, and Czerwionka-Leszczyny, covering a total area of 192.3 km2.
JSW SA has proven operational reserves of coal (JORC’s category Reserves) in the amount of 995 million tons. However, the company plans to enlarge the resource base to 1367 million tons, which will allow it to maintain a strong position in the international markets over the next 60 years. The company supplies coking coal to both domestic and foreign customers.
The author’s research shows that only the correlation of forecasts in the area of demand (the expected volume and quality of the product depend on the business cycle) and supply (extraction volumes), i.e., production and planned investments enable the fulfillment of the assumed production plans, makes it possible to achieve the greatest economic effect in the period of price increases, with simultaneous control of costs enabling remaining above the profitability threshold in the period of economic downturn [26].
3. Research Methodology
The Group Method of Data Handling (GMDH) is a data-driven modeling technique developed by the Ukrainian scientist Olexii Ivakhnenko in 1968 [38]. This method involves the creation of models based on experimental data through the identification of structural and parametric relationships. The problem of structural parametric identification, or the construction of models based on experimental data, is addressed by finding the extremum of a certain criterion among a set of different models. By doing so, GMDH facilitates the construction of accurate and robust predictive models. GMDH-based neural network models have been successfully applied to various fields, such as process modeling, time series prediction, and fault diagnosis [39,40]. These models have demonstrated superior performance over conventional neural network models in terms of prediction accuracy, robustness, and generalization capability.
These approaches were detailed in my previous articles, which also identified the parameters of coking coal for improving its quality under different mining and geological conditions. In our joint works, we have thoroughly identified the bases for our modeling and the mathematical mechanisms for forming neural connections and processing data based on their prioritization [33,40,41].
Neural network models are built on artificial neurons processing input signals, applying weights, combining them mathematically, and using an activation function to determine the output, introducing non-linearity and enabling the learning of complex patterns [42]. They consist of interconnected layers of these neurons, typically in a feedforward structure where information flows. During training, weights are adjusted through backpropagation, which minimizes prediction errors by iteratively comparing predicted and desired outputs. Neural network models use similarity theorems in artificial neurons and their connections to learn and make predictions from input data. The research methodology and methods used are detailed in [33].
The research undertaken on behalf of Knurow and Szczyglowice mines involved a comprehensive analysis, drawing comparisons with prior investigations carried out at the “Borynia-Zofiówka” mine of the Jastrzębska Spółka Węglowa SA [33]. This investigation spanned the entirety of coal mining operations, meticulously observing geological conditions from inception to implementation. The central aim of the study was to uncover intricate patterns, discern emerging trends, identify associations, and gain insightful perspectives from vast datasets. The process proved to be highly demanding computationally due to the sheer volume of data involved. To ensure the integrity of the analysis, the researchers adhered strictly to principles of random sampling [43]. This approach guaranteed that each data point had an equal likelihood of being included in the sample, thus minimizing bias. Moreover, within each distinct stratum, random sampling techniques were meticulously applied to guarantee accurate representation across all demographic groups. The analysis itself encompassed a multifaceted approach, involving both direct data collection from geological layers and meticulous surface examinations of coal quantity and quality characteristics [44].
The foundation of neural network models rests upon the artificial neuron or perceptron, a vital component designed to emulate the functions of biological neurons found in the human brain. These artificial neurons, drawing inspiration from their biological counterparts, are meticulously engineered to replicate their processes. They can receive multiple input signals, assigning varying weights to each signal, and then integrating them using mathematical operations. In managing data, the Group Method of Data Handling (GMDH) has been employed as an effective strategy. Model evaluation entails the utilization of well-established metrics including mean absolute error (MAE), root mean square error (RMSE), and coefficient of determination (R2) [45]. Following this, the aggregated weighted sum undergoes further processing through an activation function, which plays a crucial role in determining the output of the neuron. This activation function introduces non-linear characteristics to the model, thereby empowering neural networks to discern intricate patterns and correlations with precision [5,46].
Group Method of Data Handling (GMDH): GMDH-type algorithms are characterized by a methodology wherein a series of increasingly complex models are generated and assessed to identify those exhibiting the highest accuracy in forecasting outcomes on previously unseen data, commonly referred to as a validation or testing dataset. The aim is to select the model with optimal complexity. While mathematically straightforward, GMDH demonstrates alignment with contemporary data mining methodologies. Validation plays a pivotal role in identifying optimal complexity, a principle shared by many learning algorithms [47,48].
In this study, we employed four algorithms of model structure creation: Combinatorial, Stepwise Forward Selection, Stepwise Mixed Selection, and Neural Network. Since these algorithms are logically separated from data preparation procedures, we call them Core algorithms. Core algorithms perform the generation and selection of model structures. Then, model coefficients are fitted using the least squares method. Core algorithms generate models from simple to complex ones until the testing accuracy increases. Let us examine them in more detail [27,49].
Combinatorial GMDH Algorithm: The Combinatorial type of the GMDH algorithm is characterized by its approach to model structure creation, which involves systematically exploring all possible combinations of input variables to construct the most optimal model. This method exhaustively evaluates different combinations of input variables to identify the structure that best fits the data [50]. By considering all possible combinations, the Combinatorial approach aims to discover complex relationships and interactions among variables, leading to a comprehensive understanding of the underlying system [51].
Stepwise Forward Selection GMDH Algorithm: The Stepwise Forward Selection type of the GMDH algorithm constructs model structures by sequentially adding variables that contribute most significantly to the predictive performance of the model. This approach begins with an empty model and iteratively adds one variable at a time, selecting the variable that maximally improves the model’s predictive accuracy at each step. By iteratively selecting variables based on their individual contribution to the model, the Stepwise Forward Selection method aims to build parsimonious models with high predictive power [52,53]. This approach is particularly useful when dealing with large datasets with numerous potential predictor variables.
Stepwise Mixed Selection GMDH Algorithm: The Stepwise Mixed Selection type of the GMDH algorithm combines elements of both forward and backward selection techniques. It starts with an empty model and iteratively adds or removes variables based on their contribution to the model’s predictive performance. This approach evaluates the impact of adding or removing each variable while considering the overall model fit. By combining forward and backward selection strategies, Stepwise Mixed Selection aims to identify the most relevant variables while optimizing the model’s complexity [54,55]. This method is particularly effective in scenarios where both the addition and removal of variables can enhance the model’s predictive accuracy.
GMDH-Type Neural Networks: GMDH-type neural networks, also referred to as polynomial neural networks, utilize the Combinatorial algorithm to optimize neuron connections [52]. This iterative algorithm constructs layers of neurons with multiple inputs, retaining a limited set of optimally complex neurons known as the initial layer width. Subsequent layers are formed by selecting neurons from preceding layers, with each neuron applying a transfer function typically involving two variables. The exhaustive Combinatorial search selects transfer functions that best predict testing data accuracy [56,57]. While these transfer functions commonly exhibit quadratic or linear forms, customization is possible within the solver module. Despite generating numerous layers, GMDH-type networks feature sparse layer connections, often comprising only a few connections per layer. The algorithm restricts the number of neurons returned from each layer, as defined by the user, to control the continuous growth of layer width resulting from connections to previous layers [58]. Specifically, to expedite computation while minimizing potential model quality degradation, the size of each subsequent layer is halved relative to the previous layer, i.e., Nk = 0.5·Nk − 1.
The generation of new layers halts either when a new layer fails to demonstrate improved testing accuracy compared to its predecessor or when the reduction in testing error is less than 1%. Additionally, the algorithm may cease generating new layers upon reaching a predefined limit on the number of layers.
The validation criterion specifies the model selection criterion for both the Core algorithm and variable ranking. We employed the MAE (mean absolute error) criterion, as it is more resilient to outliers. The mean absolute error criterion is a metric used to evaluate the accuracy of a predictive model by measuring the average absolute difference between the actual and predicted values. This is unlike other metrics such as the Mean Squared Error (MSE), which penalizes larger errors more heavily. MAE provides a more straightforward assessment of model performance. It is particularly useful when the dataset contains outliers or when the focus is on the magnitude of errors rather than their squared values.
It is an arithmetic average of the absolute errors ei, where yi is the prediction and xi the true value.
The input variables also include the values of elementary functions of the input parameters (Table 1). This allows for an expansion of the model identification capabilities in cases where there is no correlation between the input parameters and the response function.

Table 1.
Available transformations of input parameters.
The data from both enterprises were analyzed using all four Core algorithms. The best models (in terms of minimal prediction error) will be discussed in the Results and Discussion Section.
4. Results and Discussion
The Knurow and Szczyglowice mines operational data underwent a statistical analysis to facilitate essential research endeavors. Specifically, the examination focused on assessing the impact of 18 input variables on two outcome measures, namely Coke Reactivity Index (CRI) and Coke Strength after Reaction (CSR). The dataset’s organization and composition are delineated in Table 2 and Table 3, encompassing a comprehensive collection of 1104 and 716 observations, respectively.

Table 2.
Knurow mine data structure.

Table 3.
Szczyglowice mine data structure.
The quality of coal is influenced by a multitude of parameters, ranging from mining–geological and technical–technological to socio-organizational and technical–economic factors. When using empirical statistical methods of analysis, the data sample can become too large, making it difficult to discern the influence of each parameter on the final qualitative characteristics of coking coal. This variability not only affects mine operations but also impacts coal quality, production costs, and ultimately, the final price of coal. Therefore, it is crucial to identify the most significant parameters from the vast amount of data available.
The research began by determining the pairwise correlation of each of the 18 factors potentially influencing the outcome variables CRI (Coke Reactivity Index) and CSR (Coke Strength after Reaction). By analyzing these correlations, researchers aimed to pinpoint which factors had the most substantial impact on coal quality. This initial step is vital as it helps narrow down the focus to the most relevant parameters, ensuring a more efficient and accurate analysis.
Several characteristic scatter plots illustrating these correlations are provided in Figure 3. These plots offer a visual representation of the relationships between the factors and the outcome variables. By examining these scatter plots, researchers can better understand the nature of these relationships and identify patterns that might not be apparent through numerical data alone. This visualization aids in the overall process of determining which factors are most significant in influencing the quality of coking coal.
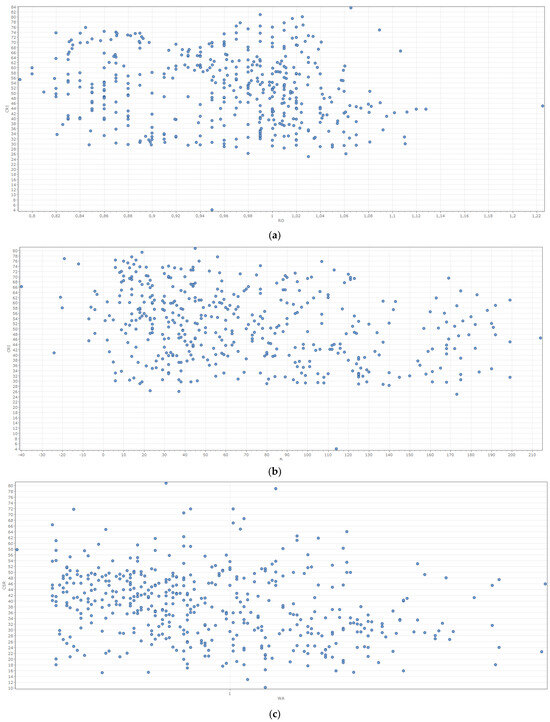
Figure 3.
Scatter plots of factors potentially influencing the outcome variables: (a) Vitrinite reflectivity (RO) vs. CRI. (b) Dilatation (B) vs. CRI. (c) Moisture content (WA) vs. CSR.
It is evident that the correlation between each individual factor and the outcome variables is practically absent. This lack of correlation makes traditional regression methods ineffective. Therefore, the utilization of GMDH-type algorithms is deemed the most suitable approach for addressing the regression task. GMDH (Group Method of Data Handling) algorithms are particularly useful in situations where complex, non-linear relationships exist between input variables and outcomes.
To establish dependencies between the factors and the outcome variables, we employed all four Core algorithms and all available elementary functions based on the input parameters. Table 1 provides a detailed overview of these functions. By leveraging the capabilities of these algorithms and functions, we aimed to create a robust analytical framework that can accurately capture the intricate relationships between the input factors and the desired outcome variables.
Subsequently, from the 16 calculated variants, we identified four optimal models that best represented these dependencies. These models are comprehensively described, highlighting their specific configurations and the rationale behind their selection. The detailed description of these models underscores the effectiveness of the GMDH-type algorithms in handling complex regression tasks where traditional methods fall short.
The best model for CRI under conditions of Knurow mine: In these studies, we employed the mean absolute error (MAE) criterion (Equation (1)) as the validation metric. As mentioned earlier, this criterion is less sensitive to outliers, which are abundant in the dataset under investigation. The optimal model (in terms of the lowest MAE criterion value) for the output variable CRI is the model constructed based on the GMDH-type neural networks:
here
CRI = 4.43687 + N17*0.372342 + N17*N38*0.00264855 + N38*0.402663;
- N38 = −6.29407 − N689*N50*0.00670978 + N50*1.46569
- N50 = −26.1857 + N787*0.558405 + N117*0.965722
- N117 = −7.54909 + N244*0.595518 + N360*0.555583
- N360 = −244.708 + N766*4.86414 − N766*N439*0.070287 + N439*4.54377
- N439 = −53.7489 + N615*1.36077 − N615*N679*0.011042 + N679*1.26885
- N679 = 136.644 − RO*102.46 + RO*S*132.456 − S*108.424
- N615 = −223.356 + RO*312.665 − RO*VT*5.79205 + VT*5.09343
- N766 = −55.4609 + CL*881.324 − CL*DA*641.85 + DA*77.2449
- N244 = 39.0134 − N416*0.557483 + N416*N637*0.0275074 − N637*0.605793
- N787 = 3176.58 − N793*62.7452 + N793*N794*1.27656 − N794*63.6156
- N794 = 53.3495 − A*0.152583 + A*CL*0.229275
- N793 = 27.2693 + I*0.725462 − I*CL*2.06961 + CL*72.6121
- N689 = −92.6231 + I*3.42976 − I*VF*0.0882767 + VF*3.89862
- N17 = −3.54623 − N413*0.31311 − N413*N54*0.00420715 + N54*1.59914
- N54 = −15.8313 + N113*0.824037 − N113*N140*0.00527827 + N140*0.763195
- N140 = 32.2807 − N637*0.51748 + N637*N249*0.0221047 − N249*0.243616
- N249 = −77.6488 + N420*1.94292 − N420*N581*0.0223688 + N581*1.73538
- N581 = −218.785 + N706*4.40046 − N706*N729*0.070827 + N729*4.52052
- N729 = 147.935 − L*11.4039 + L*DA*8.83202 − DA*74.8209
- N706 = −198.692 + RO*280.551 − RO*RI*4.15944 + RI*3.7138
- N420 = −34.7735 + N622*0.888479 + N715*0.80754
- N637 = −591.022 + N770*11.7854 − N770*N772*0.216512 + N772*11.8593
- N772 = 332.626 − VF*8.46151 + VF*A*0.306748 − A*10.2183
- N113 = 21.296 + N237*0.000518633 + N237*N271*0.0112393
- N271 = −20.0222 + N416*0.814915 + N620*0.585845
- N620 = −487.921 + N770*9.61583 − N770*N776*0.165838 + N776*9.42726
- N776 = 102.266 − VF*1.69285 + VF*CL*13.912 − CL*436.323
- N770 = 175.645 − VT*2.59827 + VT*QIA*(7.56786 × 10⁻⁵) − QIA*0.00356298
- N416 = −71.1468 + N638*1.52405 − N638*N715*0.0116272 + N715*1.48148
- N715 = 117.944 − PA*400.239 + PA*DA*242.384 − DA*44.4502
- N638 = 51.4173 − B*0.138815 + B*S*0.0910262 + S*6.19063
- N237 = 4.01568 + N739*N410*0.0135187 + N410*0.242196
- N410 = −527.005 + N622*10.6108 − N622*N753*0.191833 + N753*10.5304
- N753 = 356.755 − RO*283.511 + RO*DA*178.875 − DA*196.574
- N622 = 25.1171 + I*0.434188 + I*S*0.148567 + S*15.2296
- N739 = 47.9785 − PA*16.9067 − PA*CL*287.279 + CL*48.37
- N413 = −15.4975 + N489*0.766232 + N641*0.543963
- N641 = −630.809 + N758*12.1367 − N758*N779*0.211575 + N779*12.0469
- N779 = 104.114 − VT*0.831127 + VT*A*0.0185227 − A*1.2505
- N758 = 86.0806 + VF*DA*0.573825 − DA*44.2919
- N489 = −133.137 + N683*2.78065 − N683*N716*0.0380952 + N716*2.79005
- N716 = 63.7569 − VT*0.133417 − VT*PA*0.989567
- N683 = 87.5549 − RI*0.629352 + RI*S*0.437919 − S*18.7319.
In GMDH-based neural network architectures, the parameters N denote submodels, which are considered as the most promising candidate models from preceding layers. While certain submodels, such as N679 and N683, rely exclusively on the input data, others in subsequent layers, like N50 and N117, incorporate models generated from preceding layers. The ultimate predictive model can be expressed as a function dependent solely on the input data by iteratively substituting the submodels from prior levels into the models of subsequent levels.
The plot of actual data and model fit for CRI under conditions of the Knurow mine is represented in Figure 4.
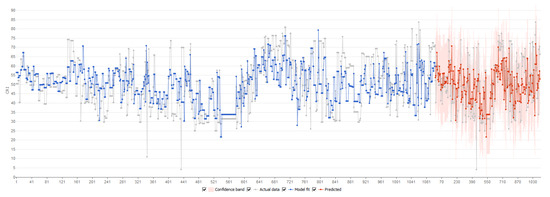
Figure 4.
Actual data and model fit for CRI indicator under conditions of Knurow mine.
Accuracy of the model: Coefficient of determination R2 = 0.71 for the training dataset and R2 = 0.63 for predicted data. Mean absolute error (Equation (1)) MAE = 7.1 for the training dataset and MAE = 7.5 for predicted data. The variation of residuals is represented in Figure 5.

Figure 5.
Variation of residuals in GMDH-based neural network model for CRI indicator.
The distribution of residuals (Figure 6) does not significantly deviate from the Gaussian normal distribution; however, outliers are noticeable in the positive direction.
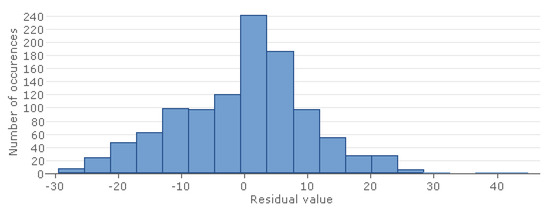
Figure 6.
Distribution of residuals in GMDH-based neural network model for CRI indicator.
To assess the significance of different factors, a methodology is employed wherein each variable in the model is individually substituted with its mean value. The resulting mean absolute error of this “new” model is then computed. The original model’s error is regarded as having a zero percent impact on the MAE, while a scenario where all variables are replaced with their means represents a 100% impact. It is worth noting that the impact can exceed 100% when variables in the model interact with each other through multiplication or squaring. Additionally, a small negative percentage may arise if a variable proves to be essentially irrelevant for the model’s predictions.
Impact on MAE is a percentage value; it is calculated as
where
- —MAE of the variable we consider;
- —zero-impact MAE;
- —MAE of a model where all variables are replaced with the mean.
The importance of factors in the GMDH-based neural network model for CRI is shown in Table 4.

Table 4.
The importance of factors for CRI under conditions of Knurow mine.
The best model for CRI under conditions of Szczyglowice mine: The optimal model for the output variable CRI is the model constructed based on the Stepwise Forward Selection algorithm:
CRI = 3.33324 + “PA, cubert”*”CL, ln”*5.68144 + “RO, cubert”*”DA, cubert”*(−17.15) + “AA, cubert”*”B, ln”*(−2.91592) + “S, cubert”*QIA*0.00215594 + “AD, cubert”*”S, ln”*(−8.85254) + “RO, ln”*M*(−1.14866) + “AA, cubert”*A*(−0.199304) + “M, cubert”*AA*(−0.219364) + “CL, cubert”*”PA, ln”*(−2.69059) + “CL, cubert”*VF*1.00491 + AA*CL*(−2.67121) + “B, cubert”*”AD, exp”*(−9.22065 × 10⁻⁵) + “AD, exp”*”WA, ln”*(−0.000564147) + “PA, cubert”*AD*0.905354 + “B, ln”*AA*0.470877 + “M, ln”*B*0.0460085 + “RO, ln”*”WA, ln”*(−59.6996) + “L, exp”*”I, exp”*(3.37535 × 10⁻²⁵) + “L, cubert”*VT*(−0.00775437) + “VT, exp”*”L, exp”*(1.04037 × 10−39) + “S, cubert”*RI*0.255253 + “RI, exp”*”AD, exp”*(7.17482 × 10−42) + AA*B*(−0.00342523) + M*PA*3.31175 + “M, cubert”*RI*(−0.217153) + “M, cubert”*AD*0.66197 + “CL, cubert”*”S, ln”*(−12.2232) + “RO, ln”*”M, ln”*(−16.3501) + “VT, exp”*”RI, exp”*(−7.55228 × 10−76) + “S, ln”*PA*18.2222 + “AD, exp”*S*(−0.000134386) + “L, ln”*M*0.32038 + “L, ln”*WA*(−2.66653) + “WA, ln”*B*0.0222349 + “VF, exp”*”WA, ln”*(−2.60599 × 10⁻¹⁶) + “AD, ln”*AA*(−0.223662) + “WA, ln”*M*0.540961 + “AA, cubert”*”PA, ln”*(−0.776974) + “I, exp”*”RI, exp”*(1.97803 × 10−55)
The plot of actual data and model fit for CRI under conditions of the Szczyglowice mine is represented in Figure 7.
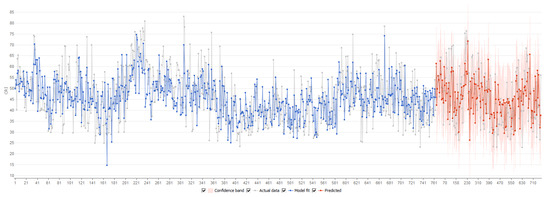
Figure 7.
Actual data and model fit for CRI indicator under conditions of Szczyglowice mine.
Model accuracy is evidenced by a coefficient of determination R2 of 0.64 for the training dataset and 0.61 for the predicted dataset. The mean absolute error (Equation (1)) is calculated as MAE = 6.3 for the training dataset and MAE = 6.5 for the predicted dataset. The distribution of residuals is depicted in Figure 8.
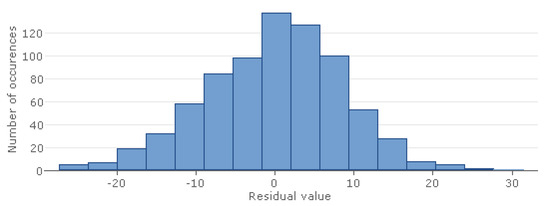
Figure 8.
Distribution of residuals in Stepwise Forward Selection model for CRI indicator.
The variation of residuals is represented in Figure 9.

Figure 9.
Variation of residuals in Stepwise Forward Selection model for CRI indicator.
The importance of factors in the GMDH-based neural network model for CRI is shown in Table 5.

Table 5.
The importance of factors for CRI under conditions of Szczyglowice mine.
The best model for CSR under conditions of the Knurow mine:
The Stepwise Mixed Selection type of the GMDH algorithm:
CSR = −65.7777 + VF*CL*(−14.666) + RI*DA*0.381513 + QIA^2*(−1.86773 × 10⁻⁷) + VT*PA*5.64385 + RO*WA*31.4244 + PA*WA*(−41.6117) + L*PA*8.82193 + PA^2*(−150.848) + L*RI*(−0.0876703) + L*DA*(−9.1726) + WA^2*13.7638 + B*DA*(−0.358887) + I*B*0.00515928 + S^2*9.88098 + S*QIA*0.000988132 + VT*RI*(−0.0531003) + VT*B*0.00750674 + S*WA*(−6.83209) + S*CL*30.2539 + PA*A*(−0.904379) + A*DA*(−4.0129) + I*PA*4.84488 + I*RI*(−0.0370694) + I*A*0.112926 + I*DA*(−1.86982) + VT*A*0.0820287 + I*WA*0.884937 + WA*(−73.2289) + PA*QIA*(−0.00944398) + RO*B*0.293627 + DA*76.7307 + RI*VF*0.112687 + L*20.8818 + QIA*DA*0.00698036 + S*DA*(−35.9121) + L^2*(−0.035367) + VT*CL*4.31171 + I*CL*3.58928 + VF*DA*(−0.697392) + QIA*WA*(−0.00112154) + L*S*(−1.15118) + SI*WA*6.88182 + SI*S*(−3.26871) + L*SI*(−0.30717) + S*VF*0.647431 + L*B*0.00715942 + RO*CL*(−304.715) + QIA*CL*0.0114572 + RI*WA*(−0.501153) + VT*S*0.146548 + B*QIA*(−5.67185 × 10⁻⁶) + RO*VF*(−3.0136) + SI*CL*(−9.16719) + B*A*0.00399875 + B*VF*(−0.0068759) + PA*DA*(−72.1308) + RO*RI*1.51287 + A*CL*(−5.12104) + PA*S*(−32.8265) + B*S*(−0.0682852) + CL*DA*144.077 + VF*A*(−0.0834917) + L*A*0.0449193 + RI*B*(−0.00237927) + A*WA*0.493542 + B^2*0.000277933 + B*WA*0.0532842 + RI*S*0.0435986
The plot of actual data and model fit for CSR under conditions of the Knurow mine is represented in Figure 10.
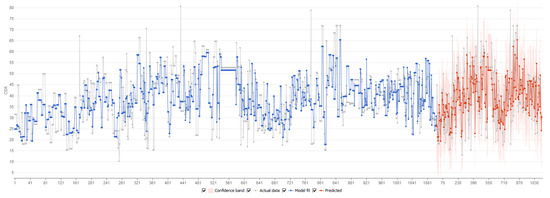
Figure 10.
Actual data and model fit for CSR indicator under conditions of Knurow mine.
Accuracy of the model: Coefficient of determination R2 = 0.75 for the training dataset and R2 = 0.71 for predicted data. Mean absolute error (Equation (1)) MAE = 6.4 for the training dataset and MAE = 6.8 for predicted data. The variation of residuals is represented in Figure 11.

Figure 11.
Variation of residuals in Stepwise Mixed Selection type of GMDH model for CSR indicator.
The distribution of residuals (Figure 12) does not significantly deviate from the Gaussian normal distribution; however, outliers are noticeable in the negative direction.
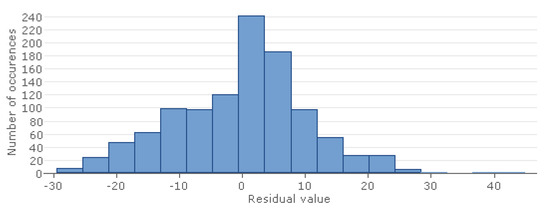
Figure 12.
Distribution of residuals in Stepwise Mixed Selection type of GMDH model for CSR indicator.
The importance of factors in the Stepwise Mixed Selection type of the GMDH model for CSR is shown in Table 6.

Table 6.
The importance of factors for CSR under conditions of Knurow mine.
The best model for CSR under conditions of the Szczyglowice mine:
For the output variable CSR, the model is constructed based on the GMDH-type neural networks:
CSR = 26.2098 − N861*3.22114 − N861*N74*0.0941202 +
+ N861^2*0.0821374 + N74*3.05763 + N74^2*0.0242668
+ N861^2*0.0821374 + N74*3.05763 + N74^2*0.0242668
- N74 = −3.56545 + N214*0.579343 + N284*0.507102
- N284 = −103.386 + N1019*4.03003 − N1019^2*0.0352553 + N465*0.846702 + N465^2*0.00207175
- N465 = −83.6646 + N680*2.70152 − N680*N950*0.0186536 − N680^2*0.0117709 + N950*1.59347
- N950 = 192.999 − “CL, exp”*182.228 + “CL, exp”*AA*2.93405 + “CL, exp”^2*43.462 − AA*3.03547
- N680 = 42.1552 − “PA, cubert”*169.297 + “PA, cubert”*RO*196.984 − RO^2*11.2773
- N1019 = −11.1938 + VT*1.70696 − VT*M*0.0407453 − VT^2*0.0131797 + M*2.04134
- N214 = −8.38972 + N531*N645*0.108997 − N531^2*0.0453461 + N645*1.34156 − N645^2*0.066103
- N645 = 15.1455 − N884*0.648457 + N884*N983*0.0395187 − N983^2*0.00839681
- N983 = −183.721 − RI*0.795209 + RI^2*0.00830849 + DA*290.321 − DA^2*85.9101
- N884 = −485.47 − “S, exp”*”VF, ln”*1.65978 + “S, exp”^2*0.454373 + “VF, ln”*352.916 − “VF, ln”^2*57.2658
- N531 = −132.083 + N808*3.76675 − N808*N833*0.0353504 − N808^2*0.0167035 + N833*2.88159 − N833^2*0.00676365
- N833 = −812.726 + “VF, ln”*548.913 + “VF, ln”*”DA, ln”*38.3895 − “VF, ln”^2*89.8965 − “DA, ln”^2*109.343
- N808 = 27.4052 − “CL, ln”*PA*53.5204 + “CL, ln”^2*2.49085 − PA^2*165.944
- N861 = −729.622 + “AA, cubert”*5.88883 + “VF, ln”*496.102 − “VF, ln”^2*79.9845.
The plot of actual data and model fit for CSR (Coke Strength after Reaction) under the conditions of the Szczyglowice mine is represented in Figure 13. This figure provides a visual comparison between the observed values and the predicted values generated by the model, offering insights into the model’s accuracy and reliability.
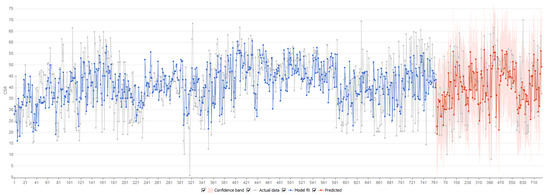
Figure 13.
Actual data and model fit for CSR indicator under conditions of Szczyglowice mine.
By examining Figure 13, one can assess how well the model aligns with the real-world data collected from the Szczyglowice mine. A close fit between the actual data points and the model’s predictions indicates that the model is effectively capturing the underlying patterns and relationships inherent in the data. This alignment is crucial for validating the model’s capability to predict CSR under similar conditions accurately.
Furthermore, any discrepancies between the actual data and the model fit can highlight areas where the model may need refinement or where additional factors might need to be considered. Such insights are invaluable for continuous improvement of predictive models, ensuring that they remain robust and applicable across various scenarios within the mining context. Figure 13 thus serves as both a validation tool and a diagnostic resource for enhancing model performance in predicting CSR.
Accuracy of the model: Coefficient of determination R2 = 0.72 for the training dataset and R2 = 0.69 for predicted data. Mean absolute error (Equation (1)) MAE = 7.1 for the training dataset and MAE = 7.6 for predicted data. The variation of residuals is represented in Figure 14.

Figure 14.
Variation of residuals in GMDH-type neural network model for CSR indicator.
The distribution of residuals (Figure 15) does not significantly deviate from the Gaussian normal distribution; however, outliers are noticeable in both negative and positive directions.
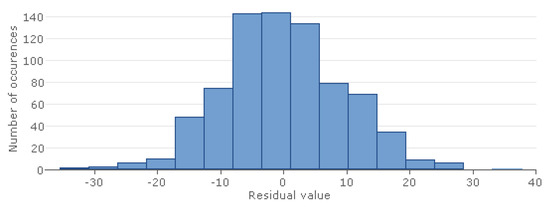
Figure 15.
Distribution of residuals in GMDH-type neural network model for CSR indicator.
The importance of factors in the GMDH-type neural network model for CSR is shown in Table 7.

Table 7.
The importance of factors for CSR under conditions of Szczyglowice mine.
The influence of input factors on the resulting indicators CRI and CSR is summarized in Table 8.

Table 8.
Top-ranked input factors and impact on the resulting indicators.
Upon scrutinizing the input factors (Table 8) from a broader perspective, it becomes evident that the VT indicator (vitrinite content) has been consistently incorporated into all formulated models. This consistency suggests a pronounced correlation between the VT indicator and the CRI (Coke Reactivity Index) and CSR (Coke Strength after Reaction) indicators. The persistent inclusion of VT in various models underscores its significance in predicting coal quality, highlighting its crucial role in the analysis.
It is noteworthy that a significant number of models exerting a considerable influence on the output variable have integrated the RO (vitrinite reflectivity) parameter. The presence of RO in these models indicates its importance in determining coal quality. Vitrinite reflectivity is a critical measure of coal’s maturity and rank, directly impacting the coke’s performance characteristics. The integration of RO into the models further emphasizes its relevance in understanding the relationships between the input factors and the desired outcomes.
In addition to VT and RO, the S (sulfur content, %) parameter also appears frequently in the models. Sulfur content is a vital factor affecting the environmental impact and quality of coal. High sulfur content can lead to undesirable emissions and lower-quality coke, making it a significant parameter in the analysis. The consistent appearance of sulfur content in the influential models highlights its critical role in predicting the CRI and CSR indicators. Together, these parameters—VT, RO, and S—form a comprehensive framework for understanding and predicting coal quality, demonstrating their substantial impact on the output variables.
5. Conclusions
Neural connections were meticulously established to cater to the specific conditions of Knurow and Szczyglowice mines, and their outcomes underwent a thorough comparison with the findings from previous research conducted for Jastrzębska Spółka Węglowa SA. This comparative analysis facilitated the comprehensive processing of statistical data gleaned from various enterprises, ultimately leading to the pinpointing of priority factors that exert significant influence on the quality indicators of final products. Influence of Input Factors on CRI and CSR: The examination of input factors reveals that the most influential factors affecting the outcome variables CRI and CSR under the conditions of the KN company are S (sulfur content, %) and vitrinite content, % (VT). It is noteworthy that the factor vitrinite content, % (VT) also exerts the greatest influence on the CRI indicator under the conditions of the SZCZ company. Regarding the CSR indicator under the conditions of the SZCZ company, the factor with the greatest impact is vitrinite reflectivity (RO), while the factor vitrinite content, % (VT) ranks second in terms of influence.
Upon evaluating the developed models, it became evident that both the CRI and CSR indicators exhibited favorable correlations with the training dataset. However, it is noteworthy that models tailored for the CRI indicator showcased superior predictive capabilities. Moreover, out of the three types of models devised, those incorporating neural network algorithms emerged as possessing the most advantageous predictive properties. This technological advancement paves the way for a noteworthy expansion of coal quality indicators and a consequential augmentation of industrial reserves, thereby effectively elongating the operational lifespan of the mine. Such innovative approaches not only facilitate a comprehensive evaluation of the final product but also establish parameters that have minimal impact on the economic indicators associated with coking coal extraction.
Drawing from the insights gleaned from the provided research, it can be conclusively stated that artificial intelligence (AI) serves as an indispensable tool within the mining industry, offering a plethora of significant benefits and advancements. Mining technologies, including but not limited to machine learning and data analytics, empower mining entities to streamline and optimize various operational processes, spanning from exploration and mineral extraction to resource estimation and equipment maintenance. Through an adept utilization of AI algorithms, mining operations can be fine-tuned to bolster efficiency, enhance productivity, and effectively address pressing environmental challenges by optimizing resource utilization. However, despite the boundless potential AI holds for the mining sector, it is imperative to acknowledge and address the array of challenges that come hand in hand with its implementation. These challenges encompass but are not limited to concerns regarding data quality and availability, the necessity for a skilled workforce adept in AI technologies, and ethical considerations surrounding its deployment. Addressing these challenges head-on will be paramount in fully harnessing the transformative potential of AI within the mining domain, ensuring its responsible and sustainable integration.
In summary, the integration of AI within the mining landscape holds the promise of revolutionizing the industry by unlocking a myriad of opportunities spanning efficiency, safety, sustainability, and productivity. Leveraging AI technologies adeptly enables mining entities to navigate the complexities of the industry amidst an ever-evolving global landscape, thereby ushering in a new era of progress and prosperity.
Suitability of GMDH-Type Algorithms: The analysis revealed that the pairwise correlation between individual factors and the outcome variables CRI and CSR was practically absent. Consequently, the utilization of GMDH-type algorithms emerged as the most appropriate approach for addressing the regression task due to their ability to handle complex relationships in the absence of significant pairwise correlations.
Model Selection Based on MAE Criterion: Employing the mean absolute error (MAE) criterion for model validation, we identified the optimal model for predicting the CRI output variable under the conditions of both Knurow and Szczyglowice mines. In both cases, the GMDH-type neural networks proved to be the most effective in minimizing prediction errors.
Characteristics of GMDH-Based Neural Network Architectures: Our analysis highlighted the significance of submodels within GMDH-based neural network architectures, wherein certain submodels relied solely on input data while others incorporated models generated from preceding layers. This iterative process allows for the construction of a predictive model dependent solely on input data, enhancing model accuracy and robustness.
Influence of Input Factors on CRI and CSR: The examination of input factors revealed the consistent incorporation of the VT indicator (vitrinite content) across all formulated models, indicating a pronounced correlation between CRI and CSR indicators and this parameter. Furthermore, the inclusion of RO (vitrinite reflectivity) and S (sulfur content, %) parameters in a significant number of models underscores their influence on the output variables. Overall, our findings underscore the efficacy of GMDH-type algorithms in addressing complex regression tasks, as well as the importance of carefully selecting input factors to improve model accuracy and predictive performance.
Funding
This research was funded by Mineral and Energy Economy Research Institute, Polish Academy of Sciences.
Data Availability Statement
Data will be available on request.
Conflicts of Interest
The author declares no conflicts of interest. The funders had no role in the design of the study; in the collection, analyses, or interpretation of data; in the writing of the manuscript; or in the decision to publish the results.
References
- Polyanska, A.; Pazynich, Y.; Mykhailyshyn, K.; Buketov, V. Energy transition: The future of energy on the base of smart specialization. Nauk. Visnyk Natsionalnoho Hirnychoho Universytetu 2023, 4, 89–95. [Google Scholar] [CrossRef]
- Jiskani, I.M.; Zhou, W.; Hosseini, S.; Wang, Z. Mining 4.0 and climate neutrality: A unified and reliable decision system for safe, intelligent, and green & climate-smart mining. J. Clean. Prod. 2023, 410, 137313. [Google Scholar] [CrossRef]
- Embaby, A.; Ismael, A.; Ali, F.A.; Farag, H.A.; Mousa, B.G.; Gomaa, S.; Elwageeh, M. An approach based on Machine Learning Algorithms, Geostatistical Technique, and GIS analysis to estimate phosphate ore grade at the Abu Tartur Mine, Western Desert, Egypt. Min. Miner. Depos. 2023, 17, 108–119. [Google Scholar] [CrossRef]
- Ospanova, A.B.; Zharkimbekova, A.T.; Kusepova, L.T.; Tokkuliyeva, A.K.; Manmuryn, M. Cloud service for protection and monitoring of computer networks. Eng. J. Satbayev Univ. 2021, 143, 222–229. [Google Scholar] [CrossRef]
- Yang, D.; Zhao, J.; Suhail, S.A.; Ahmad, W.; Kamiński, P.; Dyczko, A.; Salmi, A.; Mohamed, A. Investigating the Ultrasonic Pulse Velocity of Concrete Containing Waste Marble Dust and Its Estimation Using Artificial Intelligence. Materials 2022, 15, 4311. [Google Scholar] [CrossRef]
- Lawal, A.I.; Kwon, S. Application of artificial intelligence in rock mechanics: An overview. J. Rock Mech. Geotech. Eng. 2020, 13, 248–266. [Google Scholar] [CrossRef]
- Kamiński, P.; Dyczko, A.; Prostański, D. Virtual Simulations of a New Construction of the Artificial Shaft Bottom (Shaft Safety Platform) for Use in Mine Shafts. Energies 2021, 14, 2110. [Google Scholar] [CrossRef]
- Polyanska, A.; Pazynich, Y.; Sabyrova, M.; Verbovska, L. Directions and prospects of the development of educational services in conditions of energy transformation: The aspect of the coal industry. Polityka Energetyczna—Energy Policy J. 2023, 26, 195–216. [Google Scholar] [CrossRef]
- Kononenko, M.; Khomanko, O.; Cabana, E.; Mirek, A.; Dyczko, A.; Prostański, D.; Dychkovskyi, R. Using the methods to calculate parameters of drilling and +blasting operations for emulsion explosives. Acta Montan. Slovaca 2023, 28, 655–667. [Google Scholar] [CrossRef]
- Markevych, K.; Maistro, S.; Koval, V.; Paliukh, V. Mining sustainability and circular economy in the context of economic security in Ukraine. Min. Miner. Depos. 2022, 16, 101–113. [Google Scholar] [CrossRef]
- Pylypenko, H.M.; Pylypenko, Y.I.; Dubiei, Y.V.; Solianyk, L.G.; Pazynich, Y.M.; Buketov, V.; Smoliński, A.; Magdziarczyk, M. Social capital as a factor of innovative development. J. Open Innov. Technol. Mark. Complex. 2023, 9, 100118. [Google Scholar] [CrossRef]
- Bąba, W.; Błońska, A.; Kompała-Bąba, A.; Małkowski, Ł.; Ziemer, B.; Sierka, E.; Nowak, T.; Woźniak, G.; Besenyei, L. Arbuscular mycorrhizal fungi (AMF) root colonization dynamics of Molinia caerulea (L) Moench. in grasslands and post-industrial sites. Ecol. Eng. 2016, 95, 817–827. [Google Scholar] [CrossRef]
- Vu, T.T.; Do, S.A. Determination of the rock mass displacement zone by numerical modeling method when exploiting the longwall at the Nui Beo Coal Mine, Vietnam. Min. Miner. Depos. 2023, 17, 59–66. [Google Scholar] [CrossRef]
- Hatimah, I. Corporate Social Responsibility (CSR) Training Model. In Proceedings of the 1st International Conference on Educational Sciences, Bandung, Indonesia, 17 October 2017; pp. 135–155. [Google Scholar] [CrossRef]
- Dyczko, A. Production management system in a modern coal and coke company based on the demand and quality of the exploited raw material in the aspect of building a service-oriented architecture. J. Sustain. Min. 2023, 22, 2–19. [Google Scholar] [CrossRef]
- Sánchez, A.; Pérez, M.S.; Gueant, P.; Peña, J.M.; Herrero, P. DMGA: A Generic Brokering-Based Data Mining Grid Architecture. In Data Mining Techniques in Grid Computing Environments; John Wiley & Sons, Ltd.: Hoboken, NJ, USA, 2009; pp. 201–219. [Google Scholar] [CrossRef]
- Dodangeh, E.; Panahi, M.; Rezaie, F.; Lee, S.; Tien Bui, D.; Lee, C.-W.; Pradhan, B. Novel hybrid intelligence models for flood-susceptibility prediction: Meta optimization of the GMDH and SVR models with the genetic algorithm and harmony search. J. Hydrol. 2020, 590, 125423. [Google Scholar] [CrossRef]
- Fuchs, C. Information Ethics in the Age of Digital Labour and the Surveillance-Industrial Complex. In Information Cultures in the Digital Age; Springer VS: Wiesbaden, Germany, 2016; pp. 173–190. [Google Scholar] [CrossRef]
- Tabachenko, M.; Zhadiaieva, K.; Dyczko, A.; Cabana, E. Gas hydrates technologies in the joint concept of geoenergy usage. E3S Web Conf. 2021, 230, 01023. [Google Scholar] [CrossRef]
- Kononenko, M.; Khomenko, O.; Sadovenko, I.; Sobolev, V.; Pazynich, Y.; Smoliński, A. Managing the rock mass destruction under the explosion. J. Sustain. Min. 2023, 22, 240. [Google Scholar] [CrossRef]
- Tereshchuk, R.M.; Khoziaikina, N.V.; Babets, D.V. Substantiation of rational roof-bolting parameters. Nauk. Visnyk Natsionalnoho Hirnychoho Universytetu 2018, 1, 19–26. [Google Scholar] [CrossRef]
- Sharma, M.; Maity, T. Low-cost low power smart helmet for real-time remote underground mine environment monitoring. Wirel. Pers. Commun. 2018, 102, 149–162. [Google Scholar] [CrossRef]
- Sdvyzhkova, O.; Moldabayev, S.; Bascetin, A.; Babets, D.; Kuldeyev, E.; Sultanbekova, Z.; Amankulov, M.; Issakov, B. Probabilistic assessment of slope stability at ore mining with steep layers in deep open pits. Min. Miner. Depos. 2022, 16, 11–18. [Google Scholar] [CrossRef]
- Downes, R. Remote Control: Organisational Control and Monitoring in Distributed Teams. Ph.D Thesis, Victoria University of Wellington, Wellington, New Zealand, 2020; p. 370. [Google Scholar] [CrossRef]
- Dychkovskyi, R.; Tabachenko, M.; Zhadiaieva, K.; Cabana, E. Some aspects of modern vision for geoenergy usage. E3S Web Conf. 2019, 123, 01010. [Google Scholar] [CrossRef]
- Dyczko, A. Real-time forecasting of key coking coal quality parameters using neural networks and artificial intelligence. Rud.-Geološko-Naft. Zb. 2023, 38, 105–117. [Google Scholar] [CrossRef]
- Dychkovskyi, R.; Falshtynskyi, V.; Ruskykh, V.; Cabana, E.; Kosobokov, O. A modern vision of simulation modelling in mining and near mining activity. E3S Web Conf. 2018, 60, 00014. [Google Scholar] [CrossRef]
- Dychkovskyi, R.O.; Avdiushchenko, A.S.; Falshtynskyi, V.S.; Saik, P.B. On the issue of estimation of the coal mine extraction area economic efficiency. Nauk. Visnyk Natsionalnoho Hirnychoho Universytetu 2013, 4, 107–114. [Google Scholar]
- Gul, E. Mineral extraction and processing industries: Do they have socioeconomic benefits in a developing country scenario? Min. Miner. Depos. 2022, 16, 32–42. [Google Scholar] [CrossRef]
- Gomilanovic, M.; Tanasijevic, M.; Stepanovic, S.; Miletic, F. A Model for Determining Fuzzy Evaluations of Partial Indicators of Availability for High-Capacity Continuous Systems at Coal Open Pits Using a Neuro-Fuzzy Inference System. Energies 2023, 16, 2958. [Google Scholar] [CrossRef]
- Šapina, M. A comparison of artificial neural networks and ordinary kriging deps-maps of the lower and upper Pannonian stage border in the Bjelovar subderpression, Northen Croatia. Rud.-Geološko-Naft. Zb. 2016, 31, 75–85. [Google Scholar] [CrossRef]
- Fiket, Ž.; Saikia, B.K.; Chakravarty, S.; Medunić, G. Carbon-based raw materials play key roles in technology of the 21-st century: Indian case studies. Rud.-Geološko-Naft. Zb. 2022, 37, 15–22. [Google Scholar] [CrossRef]
- Dyczko, A. The geological modelling of deposits, production designing and scheduling in the JSW SA Mining Group. Gospod. Surowcami Miner. Miner. Resour. Manag. 2023, 4, 1–21. [Google Scholar] [CrossRef]
- Shavarskyi, I.; Falshtynskyi, V.; Dychkovskyi, R.; Akimov, O.; Sala, D.; Buketov, V. Management of the longwall face advance on the stress-strain state of rock mass. Min. Miner. Depos. 2022, 16, 78–85. [Google Scholar] [CrossRef]
- Chimunhu, P.; Topal, E.; Ajak, A.D.; Asad, W. A review of machine learning applications for underground mine planning and scheduling. Resour. Policy 2022, 77, 102693. [Google Scholar] [CrossRef]
- Polyanska, A.; Pazynich, Y.; Mykhailyshyn, K.; Babets, D.; Toś, P. Aspects of energy efficiency management for rational energy resource utilization. Rud.-Geološko-Naft. Zb. 2024, 39, 13–26. [Google Scholar] [CrossRef]
- Kononenko, M.; Khomenko, O.; Kosenko, A.; Myronova, I.; Bash, V.; Pazynich, Y. Raises advance using emulsion explosives. E3S Web Conf. 2024, 526, 01010. [Google Scholar] [CrossRef]
- Ivakhnenko, O. The Group Method of Data HandlingA Rival of the Method of Stochastic Approximation. Sov. Autom. Control 1968, 1, 43–55. [Google Scholar]
- Babets, D.; Sdvyzhkova, O.; Dyczko, A.; Gliwiński, Ł. Optimization of support parameters for reusable mining excavations based on a neuro-heuristic prognostic model. Min. Mach. 2023, 41, 200–211. [Google Scholar] [CrossRef]
- Babets, D.V.; Sdvyzhkova, O.O.; Larionov, M.H.; Tereshchuk, R.M. Estimation of rock mass stability based on probability approach and rating systems. Nauk. Visnyk Natsionalnoho Hirnychoho Universytetu 2017, 2, 58–64. [Google Scholar]
- Tymoshenko, I.E.; Dyczko, A.; Gliwiński, Ł.; Bleikher, O. Definition of Technological Parameters and Stresses in High-Speed Extraction of Thin Coal Seams. Phys. Chem. Geotechnol. 2024, 7, 35–42. [Google Scholar]
- Jiřina, M.; Jiřina, M., Jr. GMDH method with genetic selection algorithm and closing. Neural Netw. World 2013, 23, 451–464. [Google Scholar] [CrossRef][Green Version]
- Vladyko, O.; Maltsev, D.; Cabana, E.C.; Shavarskyi, I.; Dychkovskyi, R. Formation of the models of mining enterprise management. Nauk. Visnyk Natsionalnoho Hirnychoho Universytetu 2022, 3, 30–36. [Google Scholar] [CrossRef]
- Pivnyak, G.; Falshtynskyi, V.; Dychkovskyi, R.; Saik, P.; Lozynskyi, V.; Cabana, E.; Koshka, O. Conditions of Suitability of Coal Seams for Underground Coal Gasification. Key Eng. Mater. 2020, 844, 38–48. [Google Scholar] [CrossRef]
- Vladyko, O.; Maltsev, D.; Sala, D.; Cichoń, D.; Buketov, V.; Dychkovskyi, R. Simulation of leaching processes of polymetallic ores using the similarity theorem. Rud.-Geološko-Naft. Zb. 2022, 37, 169–180. [Google Scholar] [CrossRef]
- Saraswathi, K.; Tamilarasi, A. A Modified Metaheuristic Algorithm for Opinion Mining. Int. J. Comput. Appl. 2012, 58, 43–47. [Google Scholar] [CrossRef]
- Shashenko, O.M.; Sdvyzhkova, O.O.; Babets, D.V. Method of argument group account in geomechanical calculations. In Proceedings of the 12th International Symposium On Environmental Issues and Waste Management in Energy and Mineral Production—SWEMP 2010, Prague, Czech Republic, 24–26 May 2010; pp. 488–493. [Google Scholar]
- Vaishnav, V.; Vajpai, J. Load Forecasting by Group Method of Data Handling. In Proceedings of the 2019 10th International Conference on Computing, Communication and Networking Technologies (ICCCNT), Kanpur, India, 6–8 July 2019; Volume 143, pp. 23–54. [Google Scholar] [CrossRef]
- Seheda, M.S.; Beshta, O.S.; Gogolyuk, P.F.; Blyznak, Y.V.; Dychkovskyi, R.D.; Smoliński, A. Mathematical model for the management of the wave processes in three-winding transformers with consideration of the main magnetic flux in mining industry. J. Sustain. Min. 2024, 23, 20–39. [Google Scholar] [CrossRef]
- Kiani, M.; Hosseini, S.H.; Taji, M.; Gholinejad, M. Risk criteria classification and the evaluation of blasting operations in open pit mines by using the FDANP method. Min. Miner. Depos. 2021, 15, 70–81. [Google Scholar] [CrossRef]
- Madandoust, R.; Bungey, J.H.; Ghavidel, R. Prediction of the concrete compressive strength by means of core testing using GMDH-type neural network and ANFIS models. Comput. Mater. Sci. 2012, 51, 261–272. [Google Scholar] [CrossRef]
- Babets, D.; Sdvyzhkova, O.; Hapieiev, S.; Shashenko, O.; Prykhodchenko, V. Multifactorial analysis of a gateroad stability at goaf interface during longwall coal mining—A case study. Min. Miner. Depos. 2023, 17, 9–19. [Google Scholar] [CrossRef]
- Dudek, M.; Pawlewski, P. Implementation of Network Oriented Manufacturing Structures. In Agent and Multi-Agent Systems: Technologies and Applications; Lecture Notes in Computer Science; Springer: Berlin/Heidelberg, Germany, 2010; pp. 282–291. [Google Scholar] [CrossRef]
- Ebtehaj, I.; Bonakdari, H.; Zaji, A.H.; Azimi, H.; Khoshbin, F. GMDH-type neural network approach for modeling the discharge coefficient of rectangular sharp-crested side weirs. Eng. Sci. Technol. Int. J. 2015, 18, 746–757. [Google Scholar] [CrossRef]
- Dudek, M. The analysis of the low-cost flexibility corridors. In Proceedings of the 2017 IEEE International Conference on INnovations in Intelligent SysTems and Applications (INISTA), Gdynia, Poland, 3–5 July 2017; pp. 478–483. [Google Scholar] [CrossRef]
- Abdolrahimi, S.; Nasernejad, B.; Pazuki, G. Prediction of partition coefficients of alkaloids in ionic liquids based aqueous biphasic systems using hybrid group method of data handling (GMDH) neural network. J. Mol. Liq. 2014, 191, 79–84. [Google Scholar] [CrossRef]
- Lewinska, P.; Matula, R.; Dyczko, A. Integration of Thermal Digital 3D Model and a MASW (Multichannel Analysis of Surface Wave) as a Means of Improving Monitoring of Spoil Tip Stability. In Proceedings of the 2017 Baltic Geodetic Congress (BGC Geomatics), Gdansk, Poland, 22–25 June 2017. [Google Scholar] [CrossRef]
- Chen, S.; Doolen, G.; Kraichnan, R.; Wang, L. Is the Kolmogorov Refined Similarity Relation Dynamic or Kinematic? Phys. Rev. Lett. 1995, 74, 1755–1758. [Google Scholar] [CrossRef]
Disclaimer/Publisher’s Note: The statements, opinions and data contained in all publications are solely those of the individual author(s) and contributor(s) and not of MDPI and/or the editor(s). MDPI and/or the editor(s) disclaim responsibility for any injury to people or property resulting from any ideas, methods, instructions or products referred to in the content. |
© 2024 by the author. Licensee MDPI, Basel, Switzerland. This article is an open access article distributed under the terms and conditions of the Creative Commons Attribution (CC BY) license (https://creativecommons.org/licenses/by/4.0/).