
Three-Dimensional Subsurface Model of Luk-Ulo Melange Complex, Karangsambung, Indonesia: Insights from Gravity Modeling


Abstract
1. Introduction
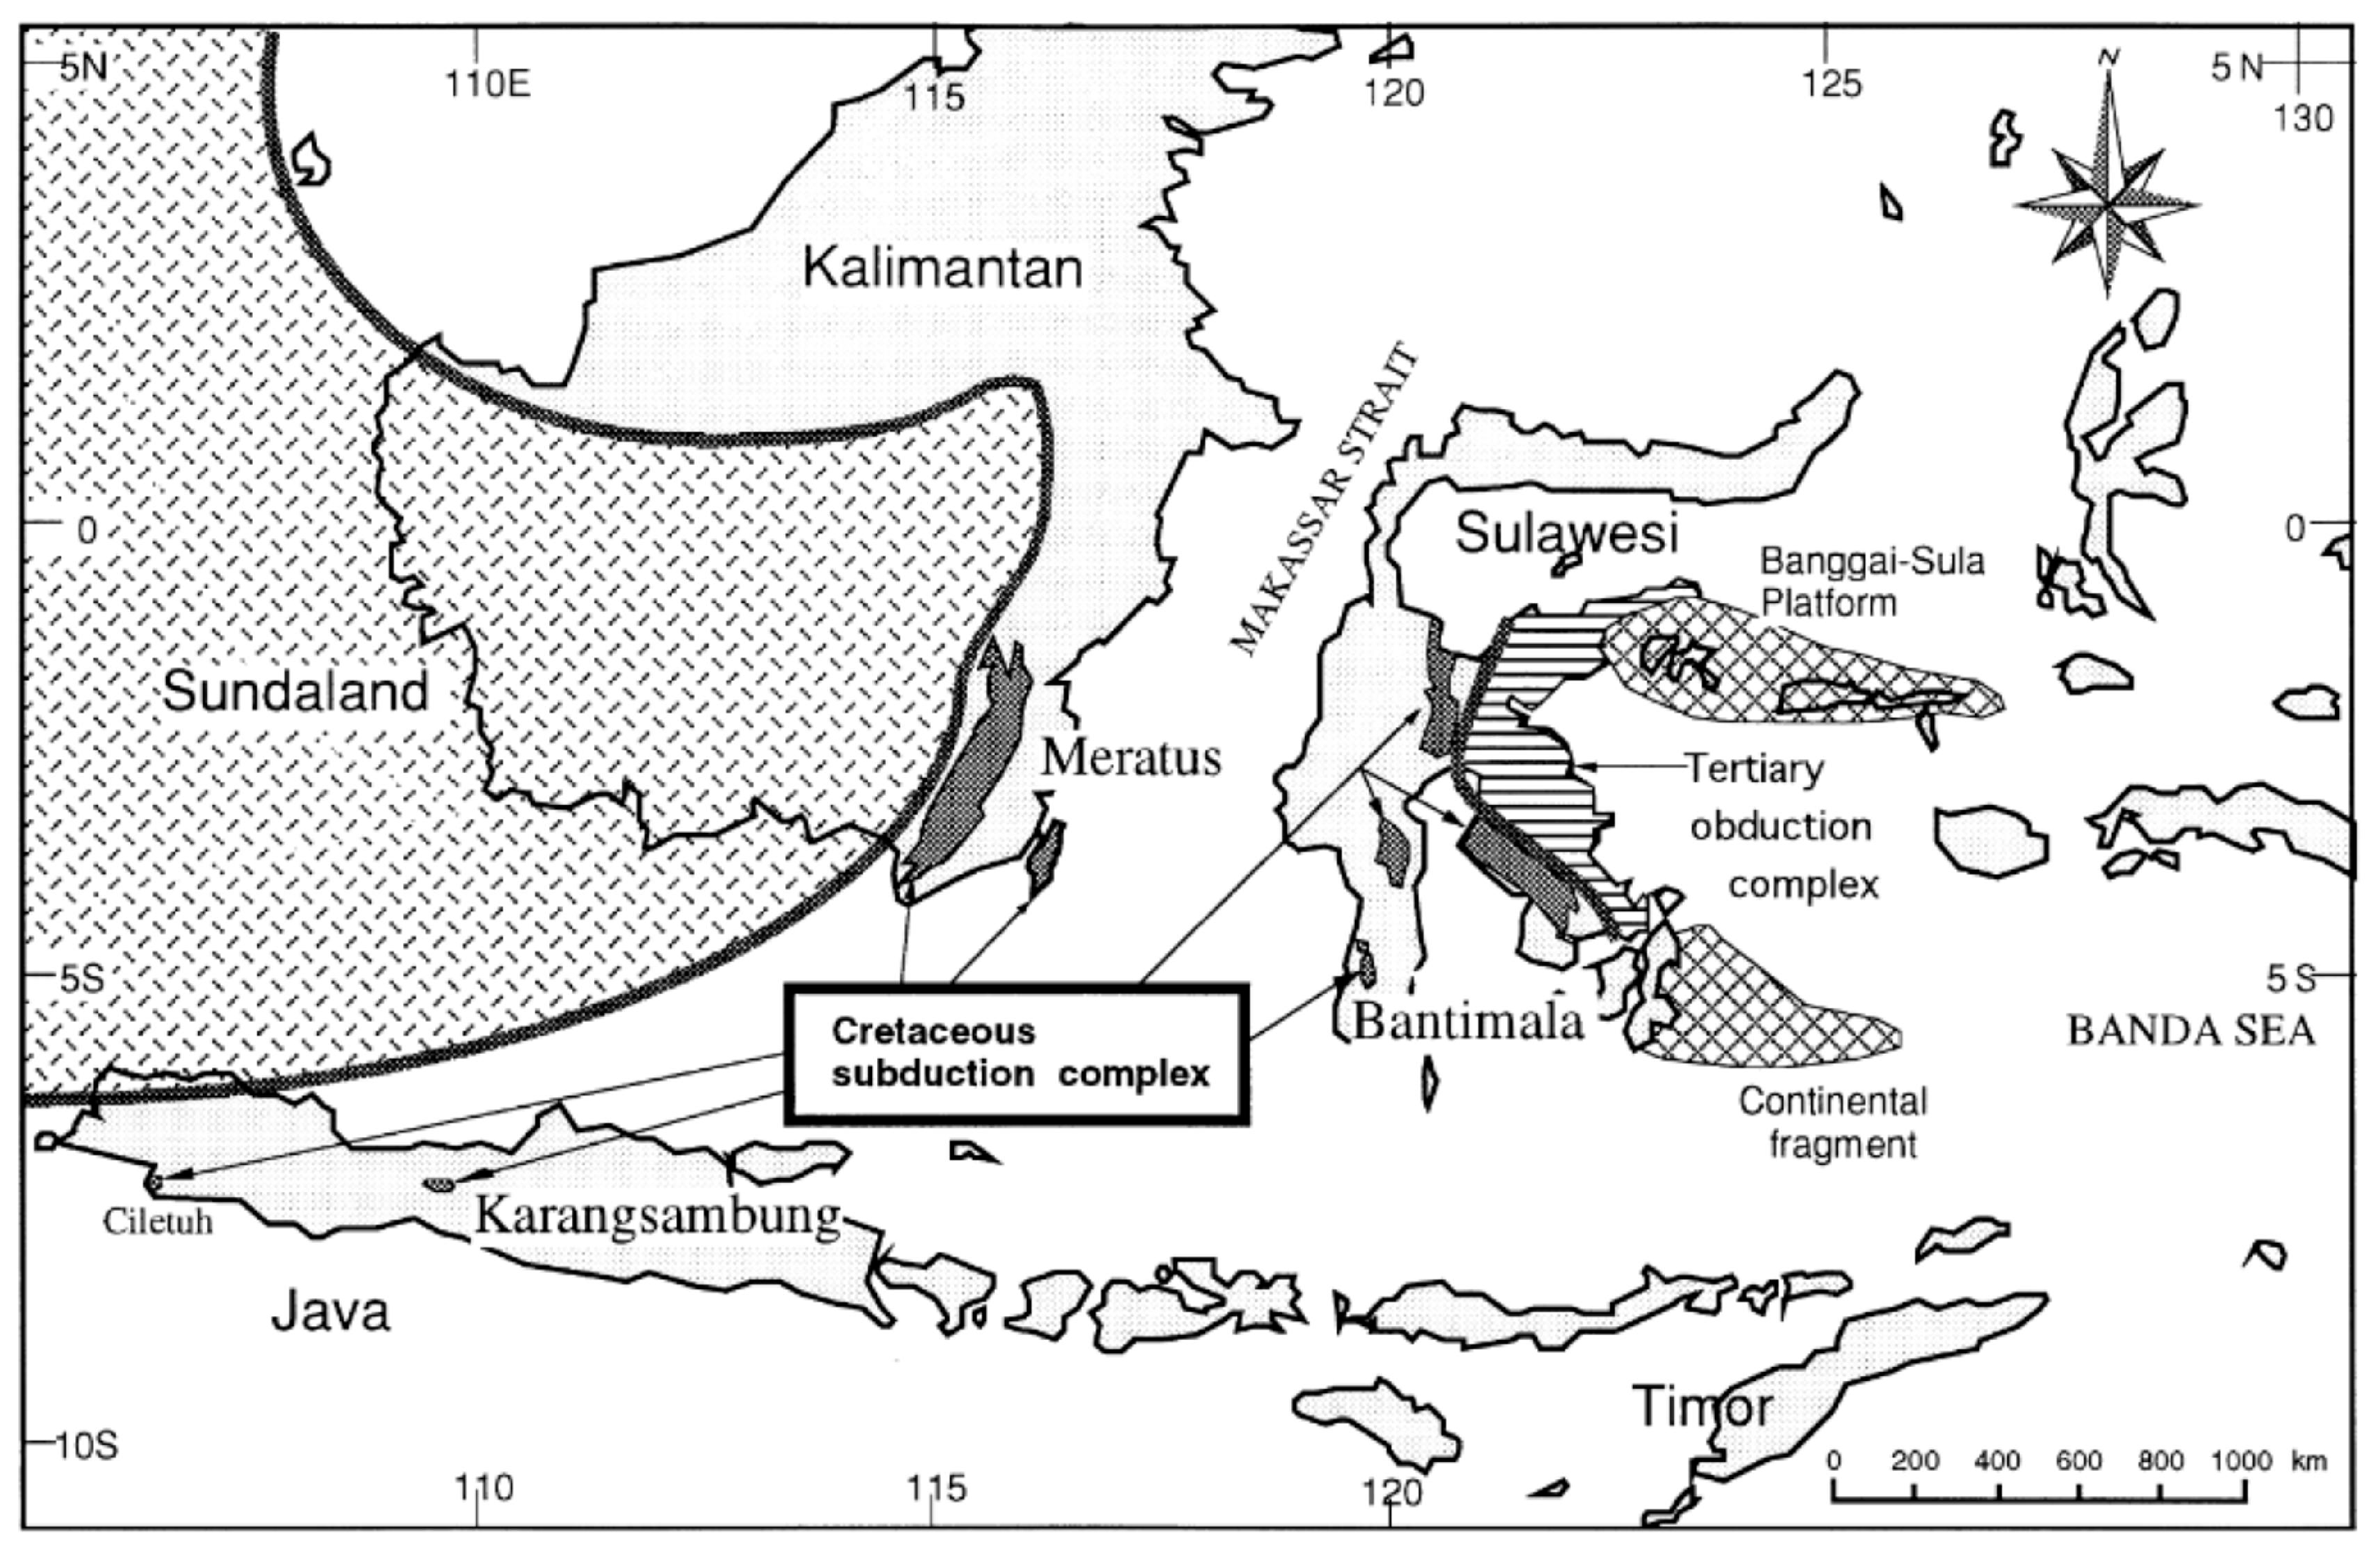
2. Geological Setting
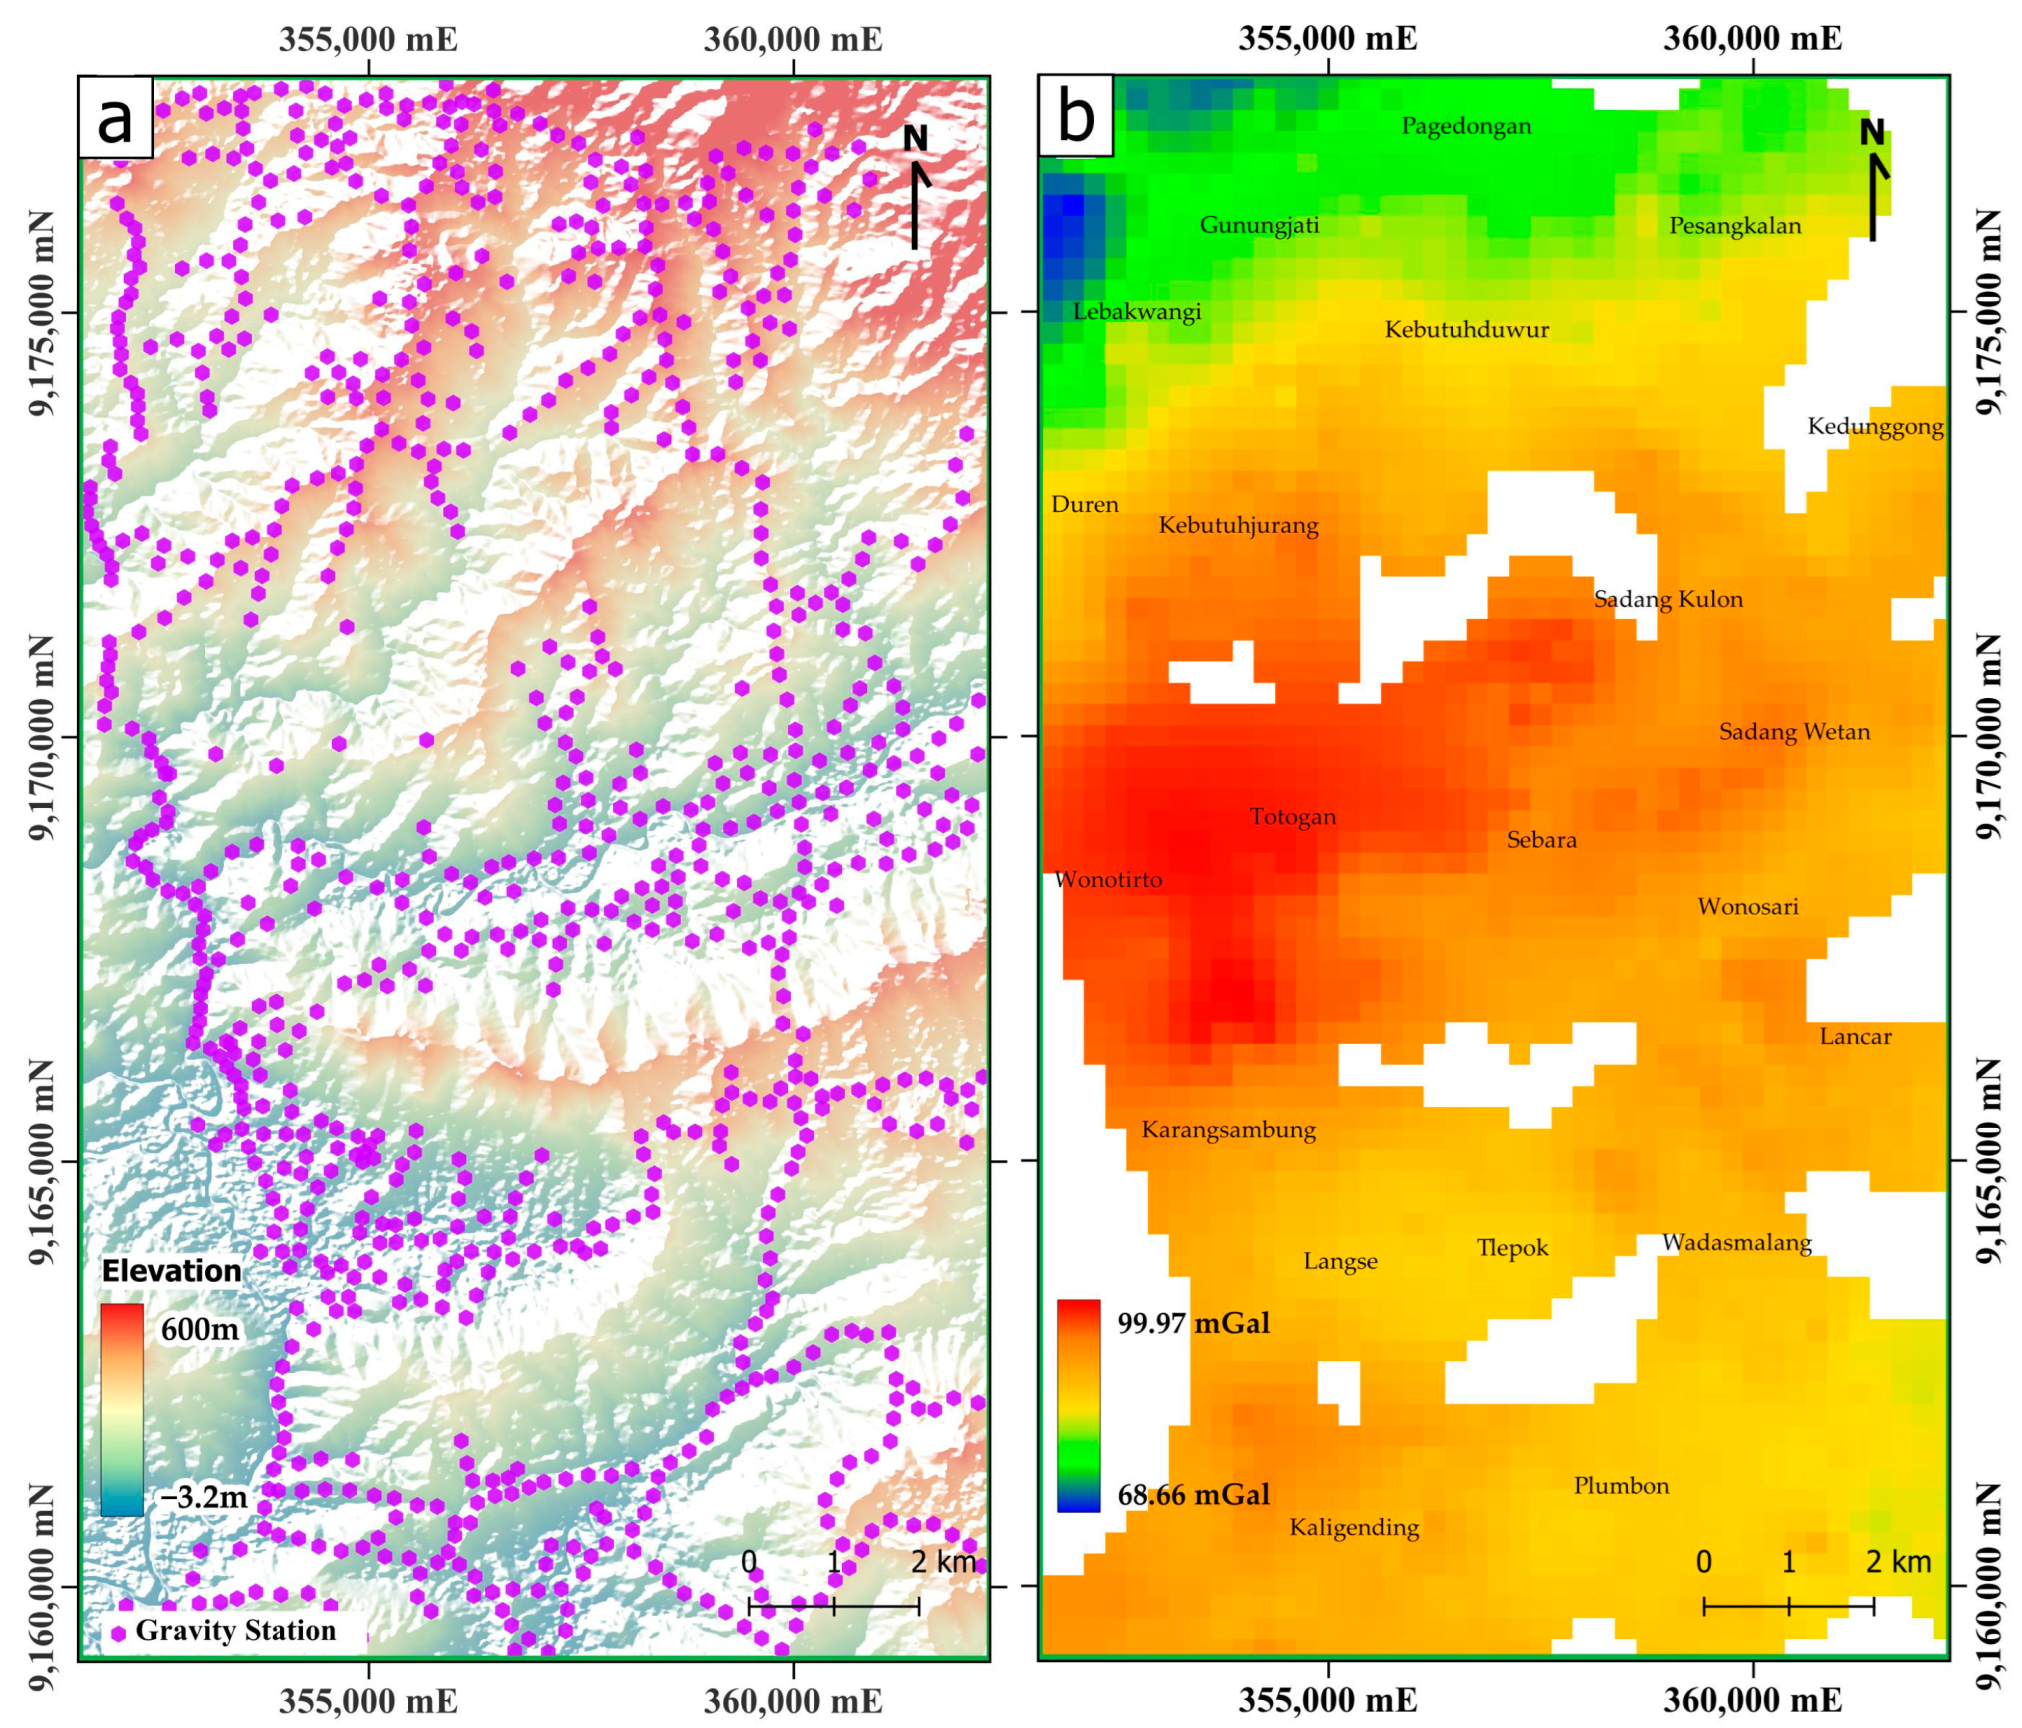
3. Data and Acquisition
4. Methodology
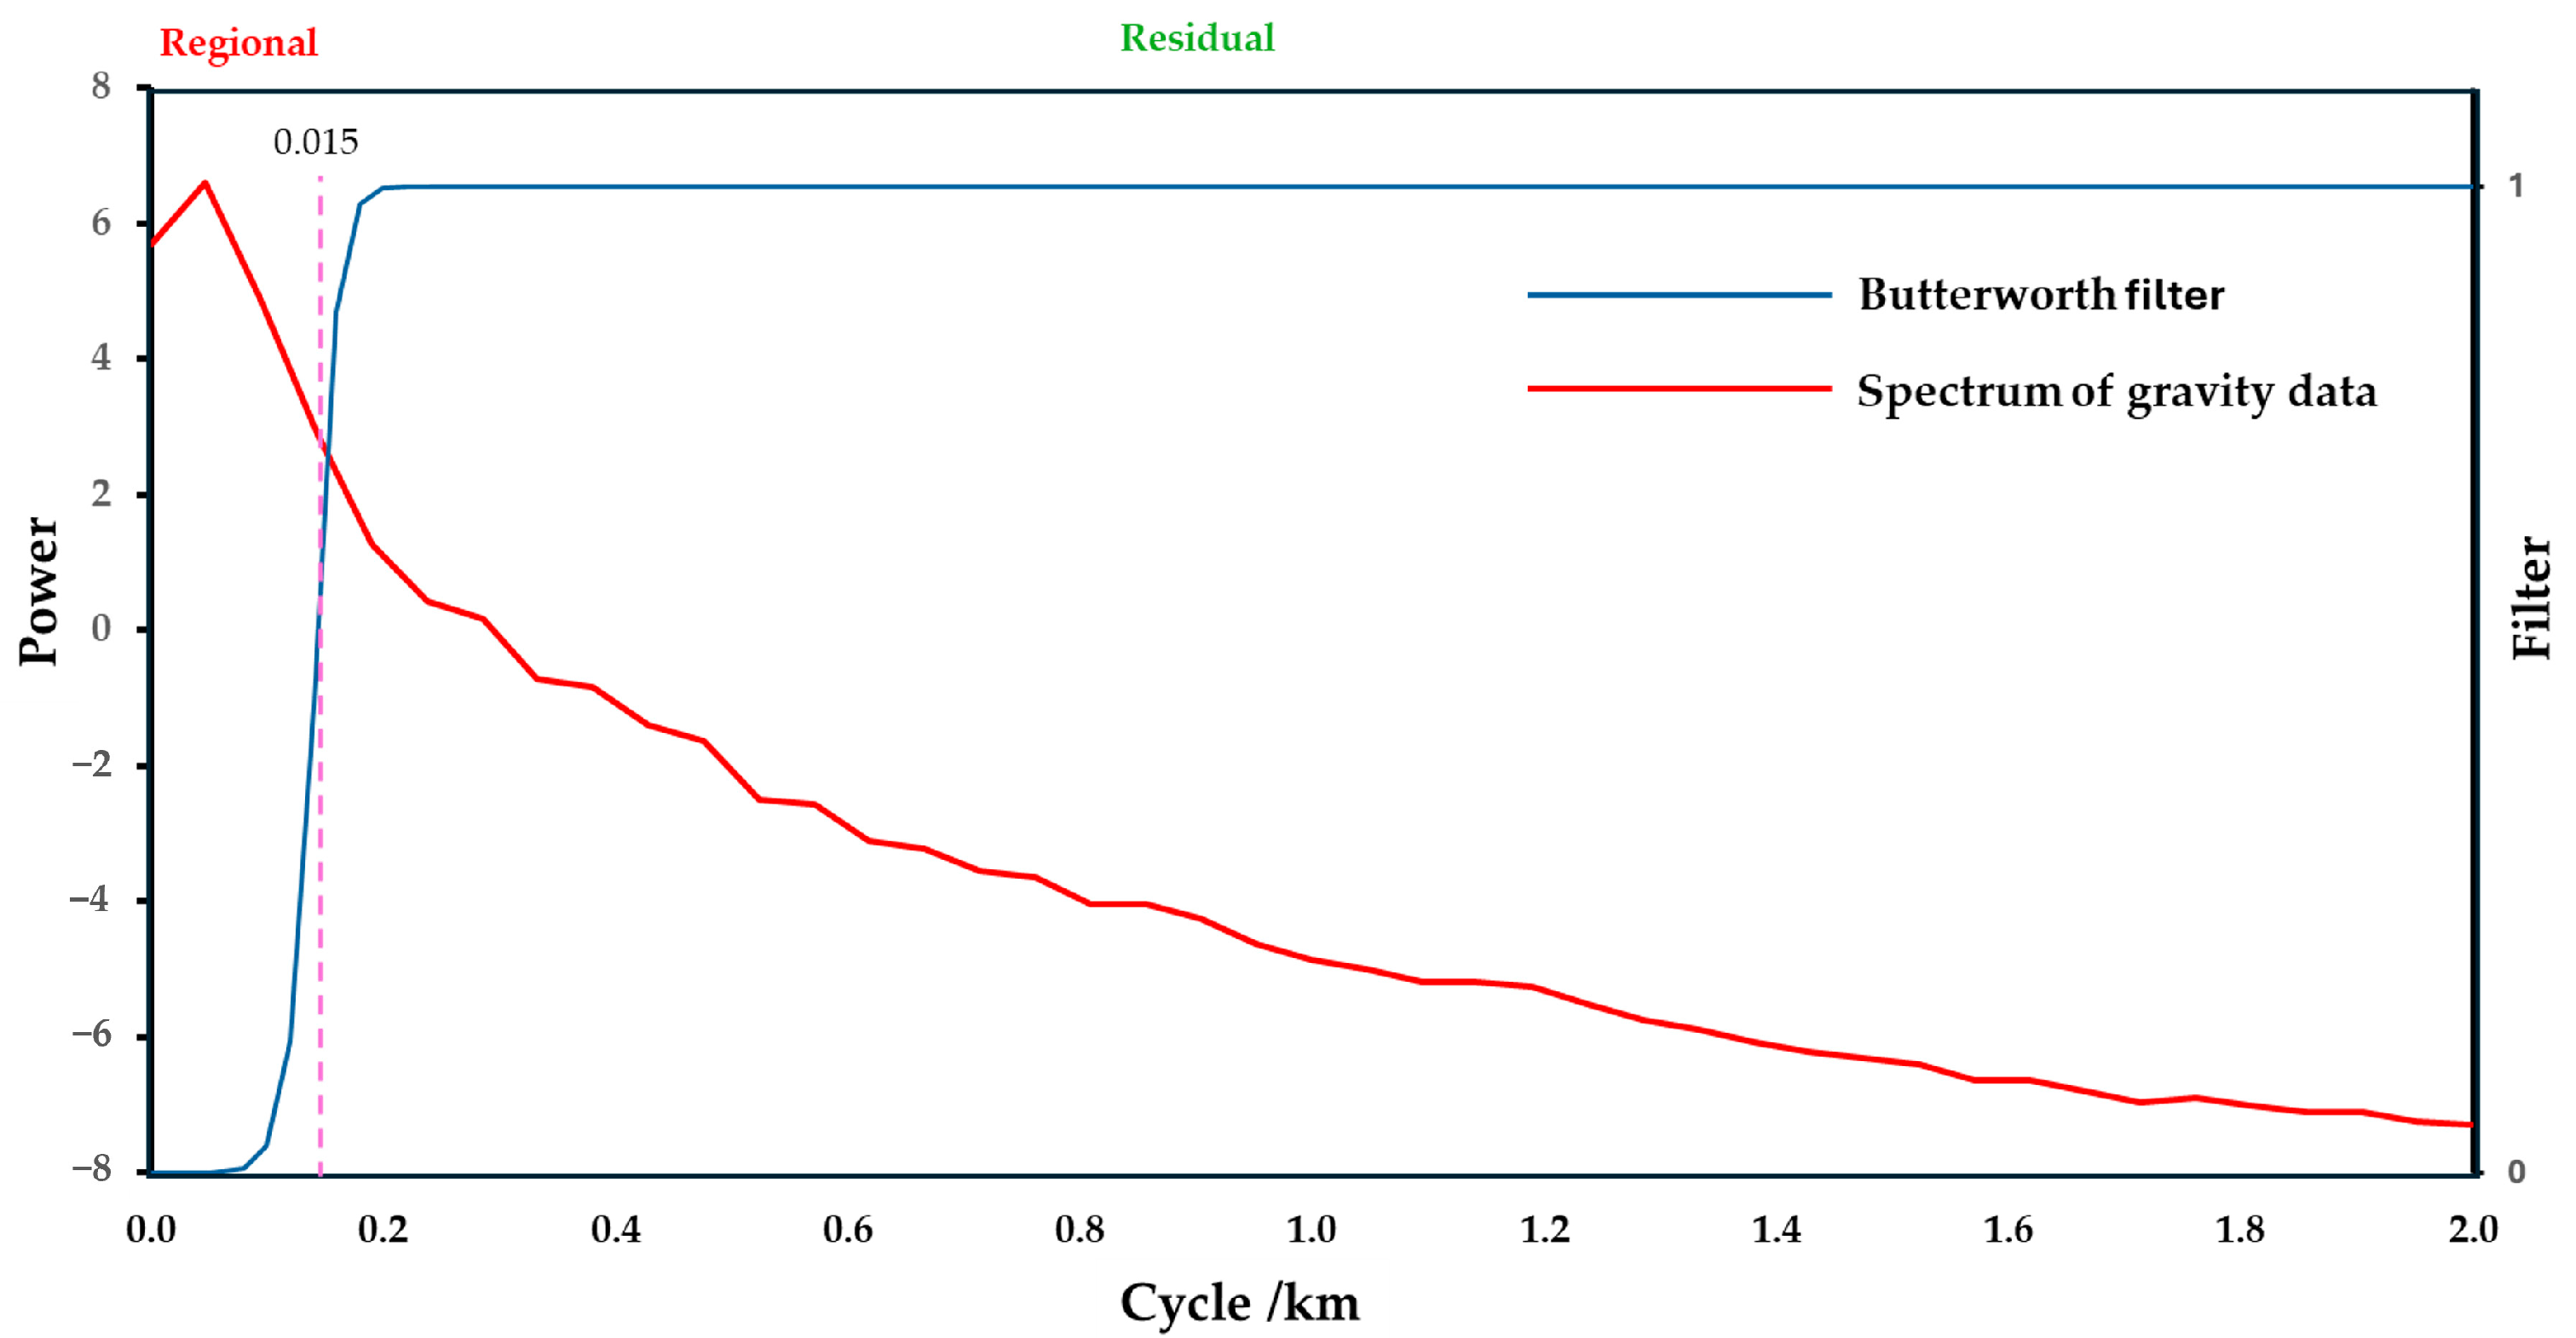
4.1. Filtering of Gravity Data
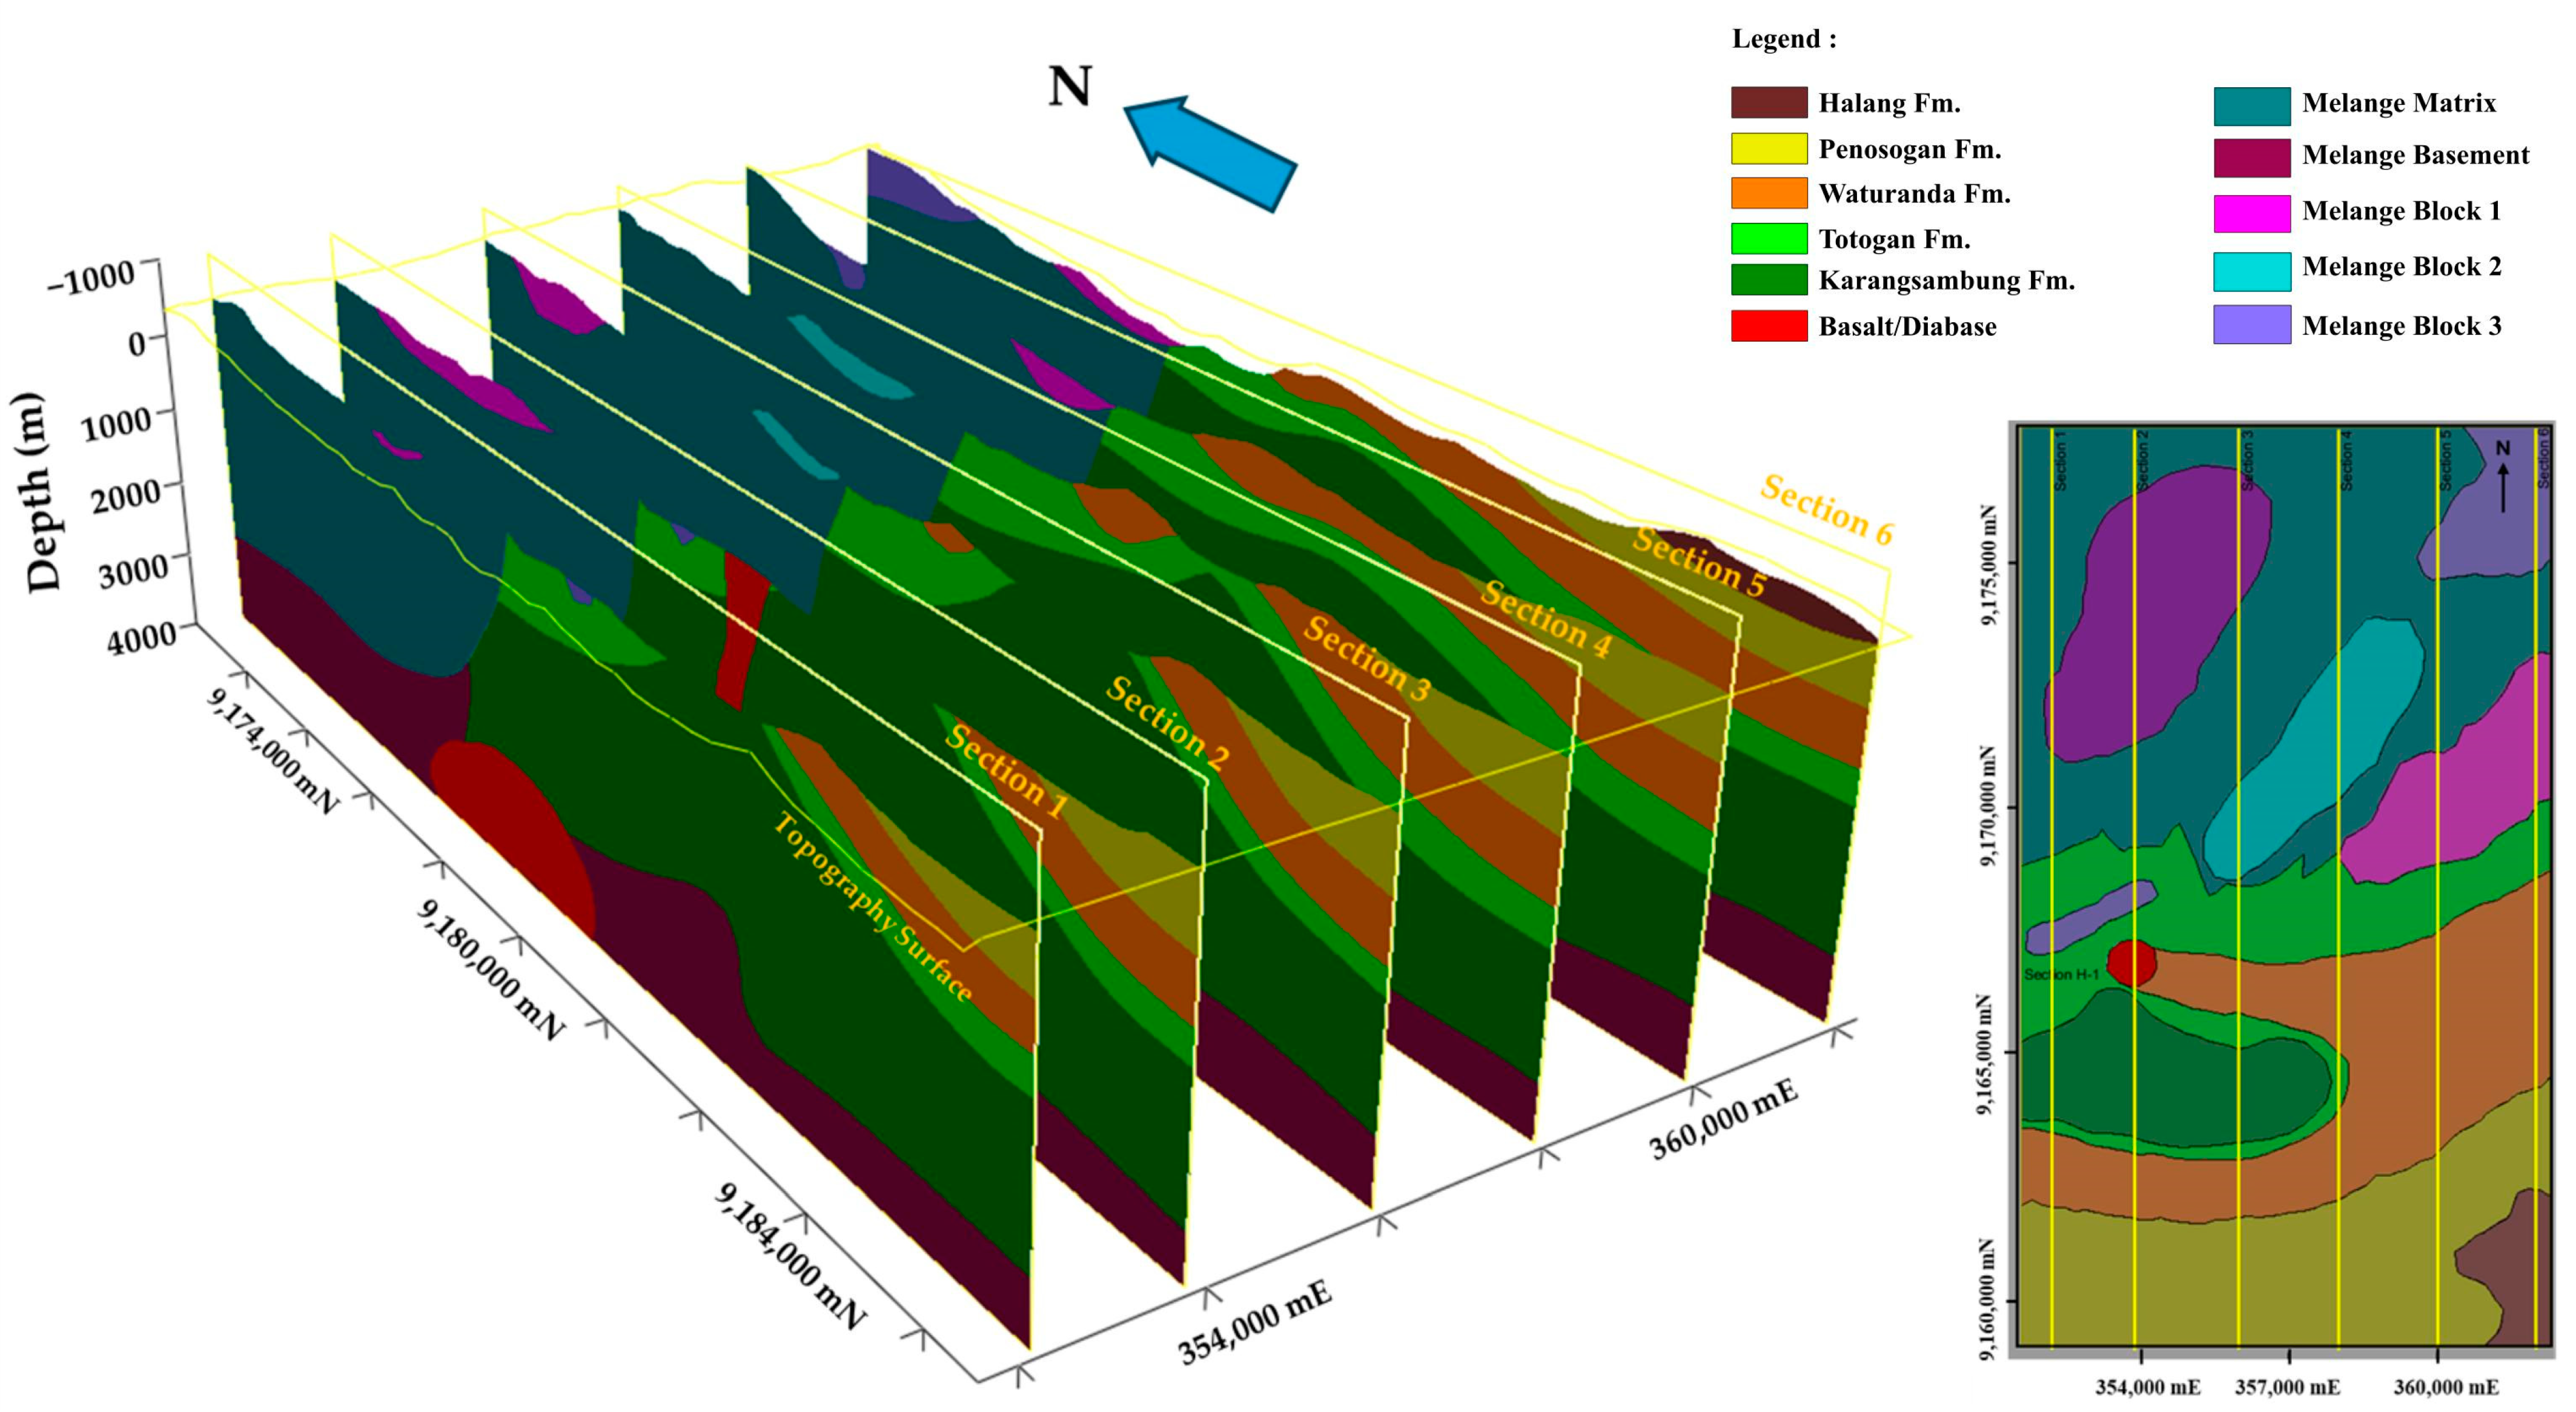
4.2. Three-Dimensional Geological Modeling
4.3. Forward Modeling and Building Optimal a Priori Model
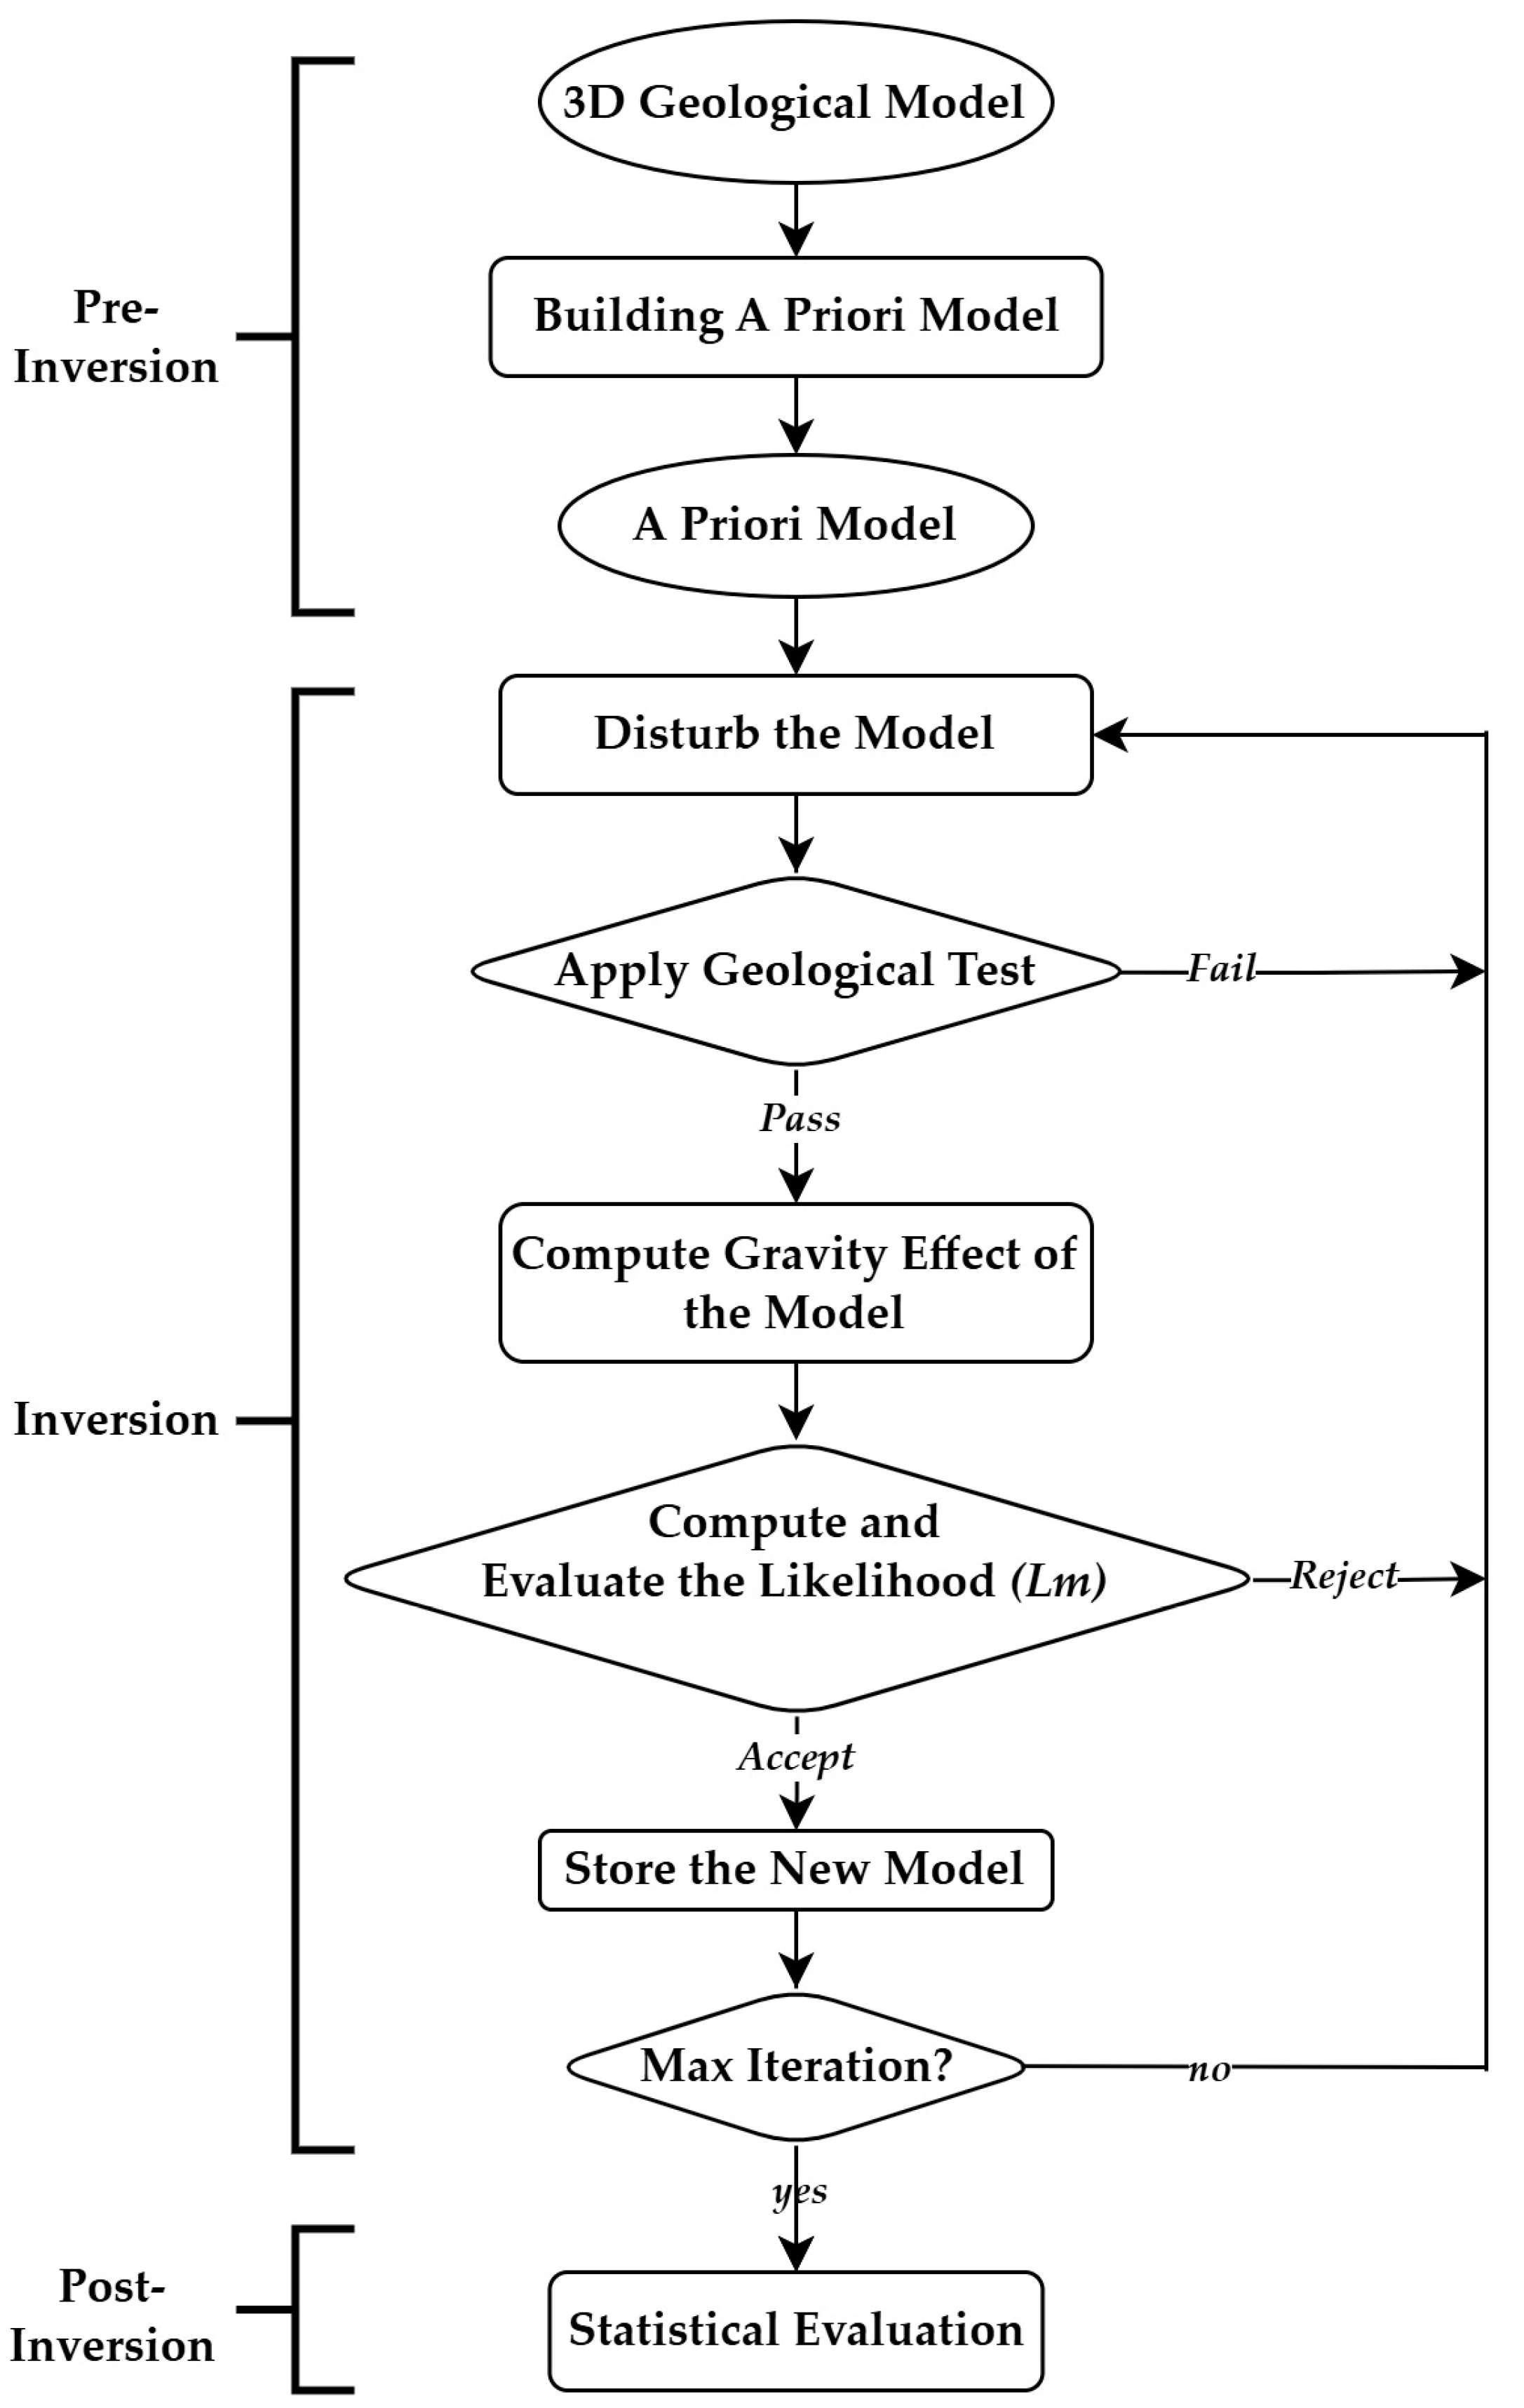
4.4. Three-Dimensional Inverse Modeling
- Development of the a priori model.
- 2.
- Discretization.
- 3.
- Parameterization.
- 4.
- Sampling and disturbing the model.
- 5.
- During each iteration, the current model is perturbed by modifying either the petrophysical properties individually or both the petrophysical properties and the lithological boundaries. In this inversion, the probability of lithological change at the formation boundary is set at 50%. The sampling method follows the approach described in [52].
- 6.
- Application of the geological test.
- 7.
- Computation of the gravity effect of the disturbed model.
- 8.
- Computation and evaluation of the likelihood of the perturbed model L(mpert).
- -
- If L(mpert) > L(mcurr), accept mpert
- -
- If L(mpert) <= L(mcurr), accept mpert with random sampling and a probability L(mpert)/L(mcurr)
- -
- If (mpert) is accepted, then store the perturbed model, set mcurr = mpert. But, if mpert is rejected, mcurr is not modified.
- 9.
- Return to step 4, and repeat the process.
5. Results
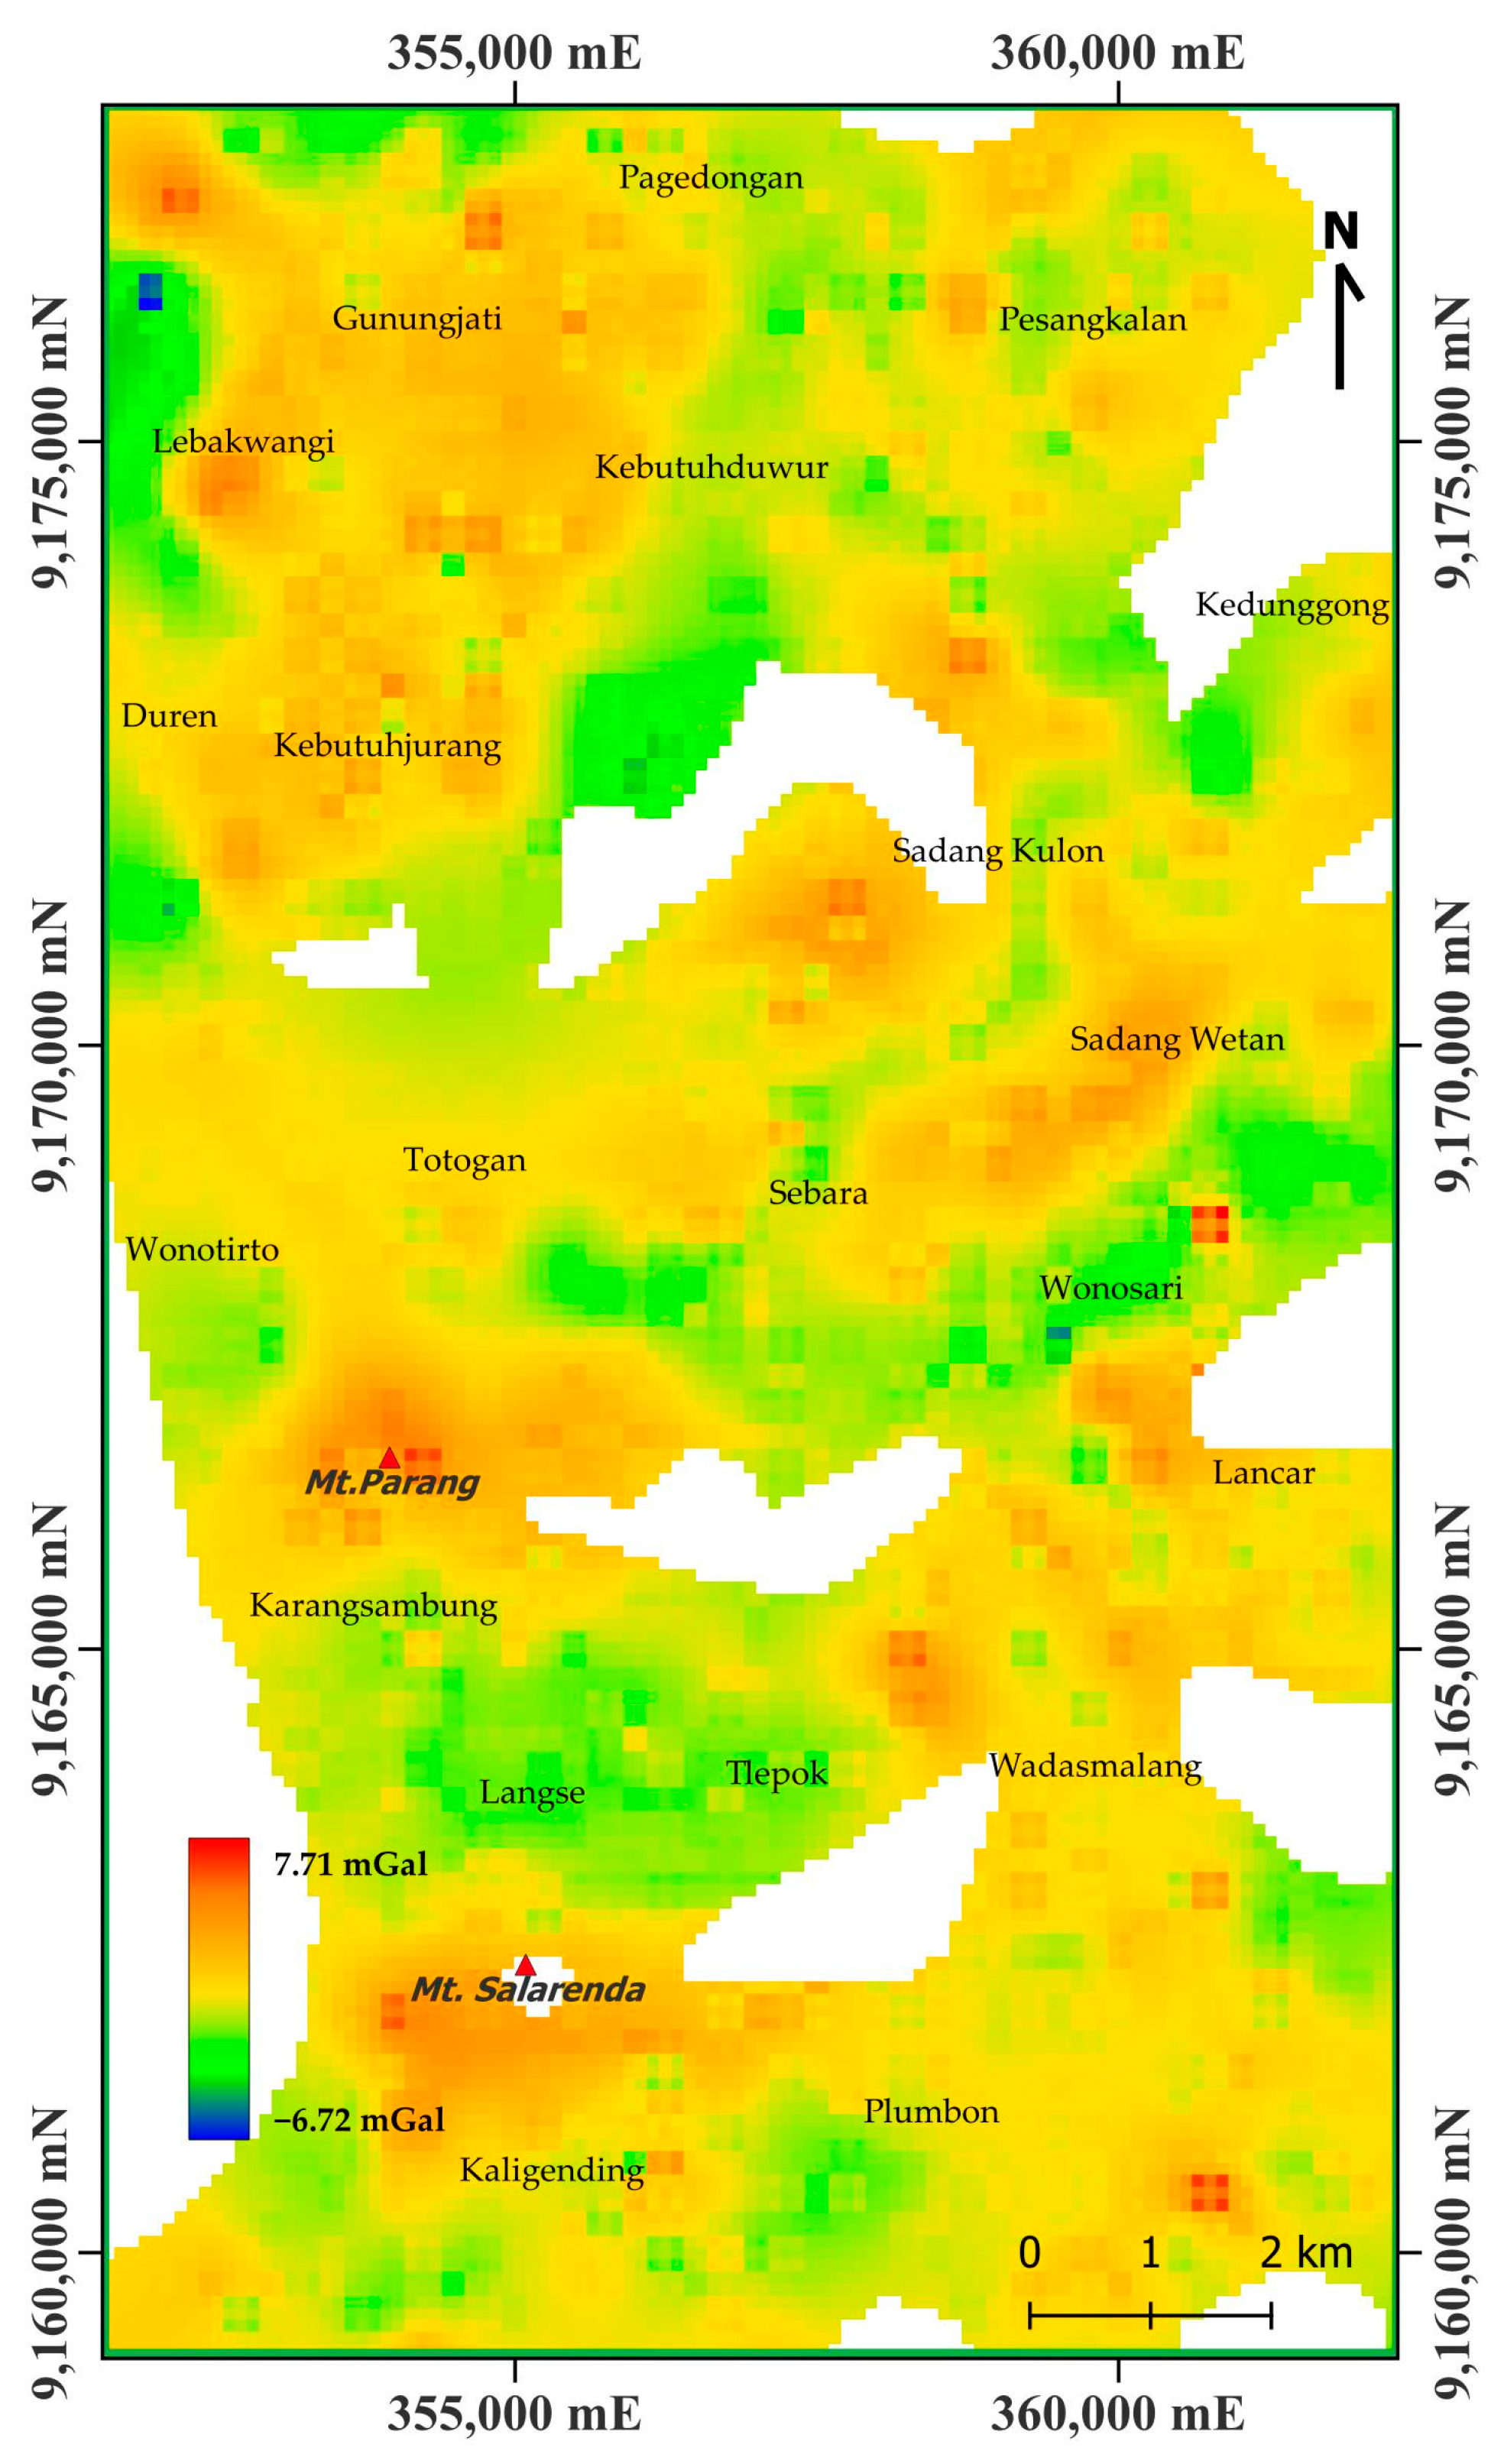
5.1. Residual Gravity Anomaly
5.2. A Piori Model
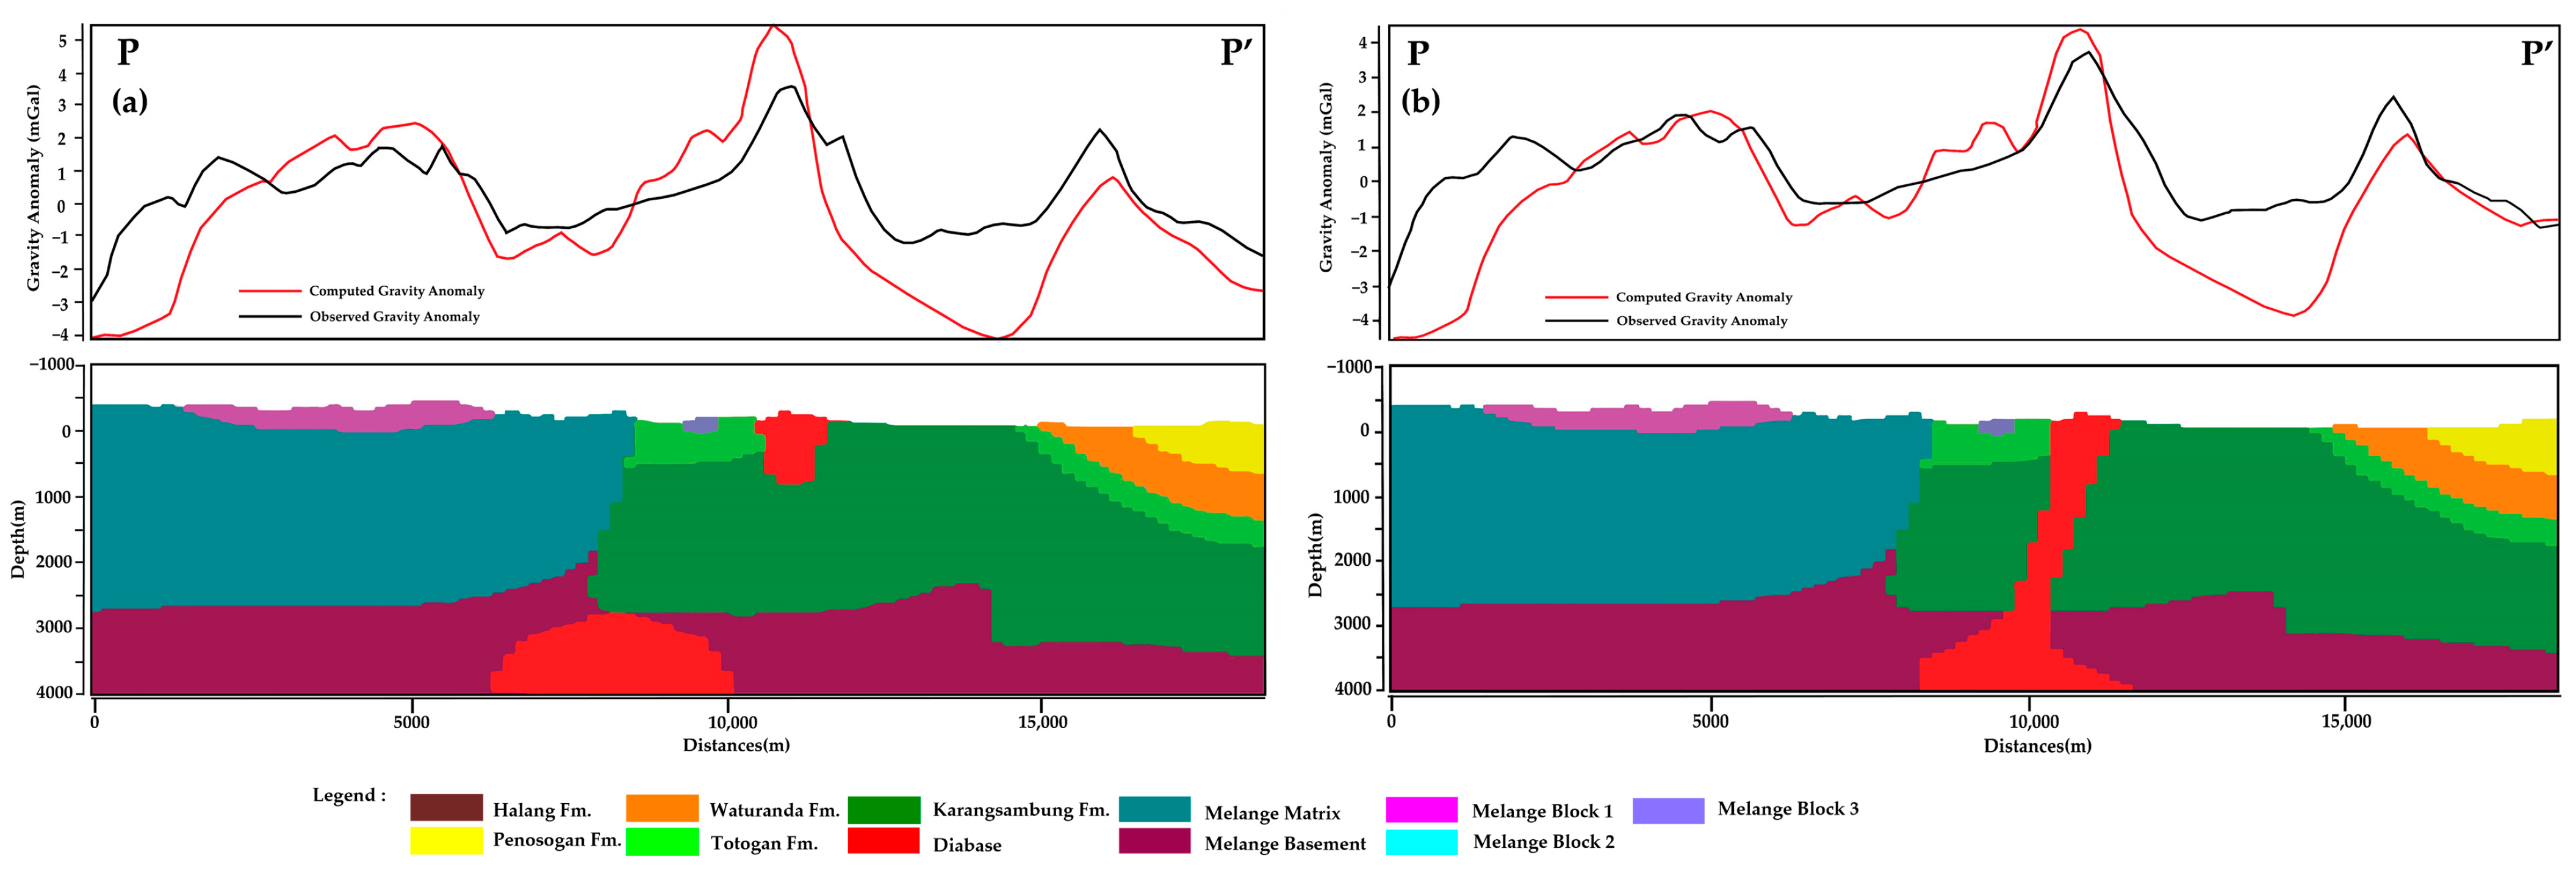
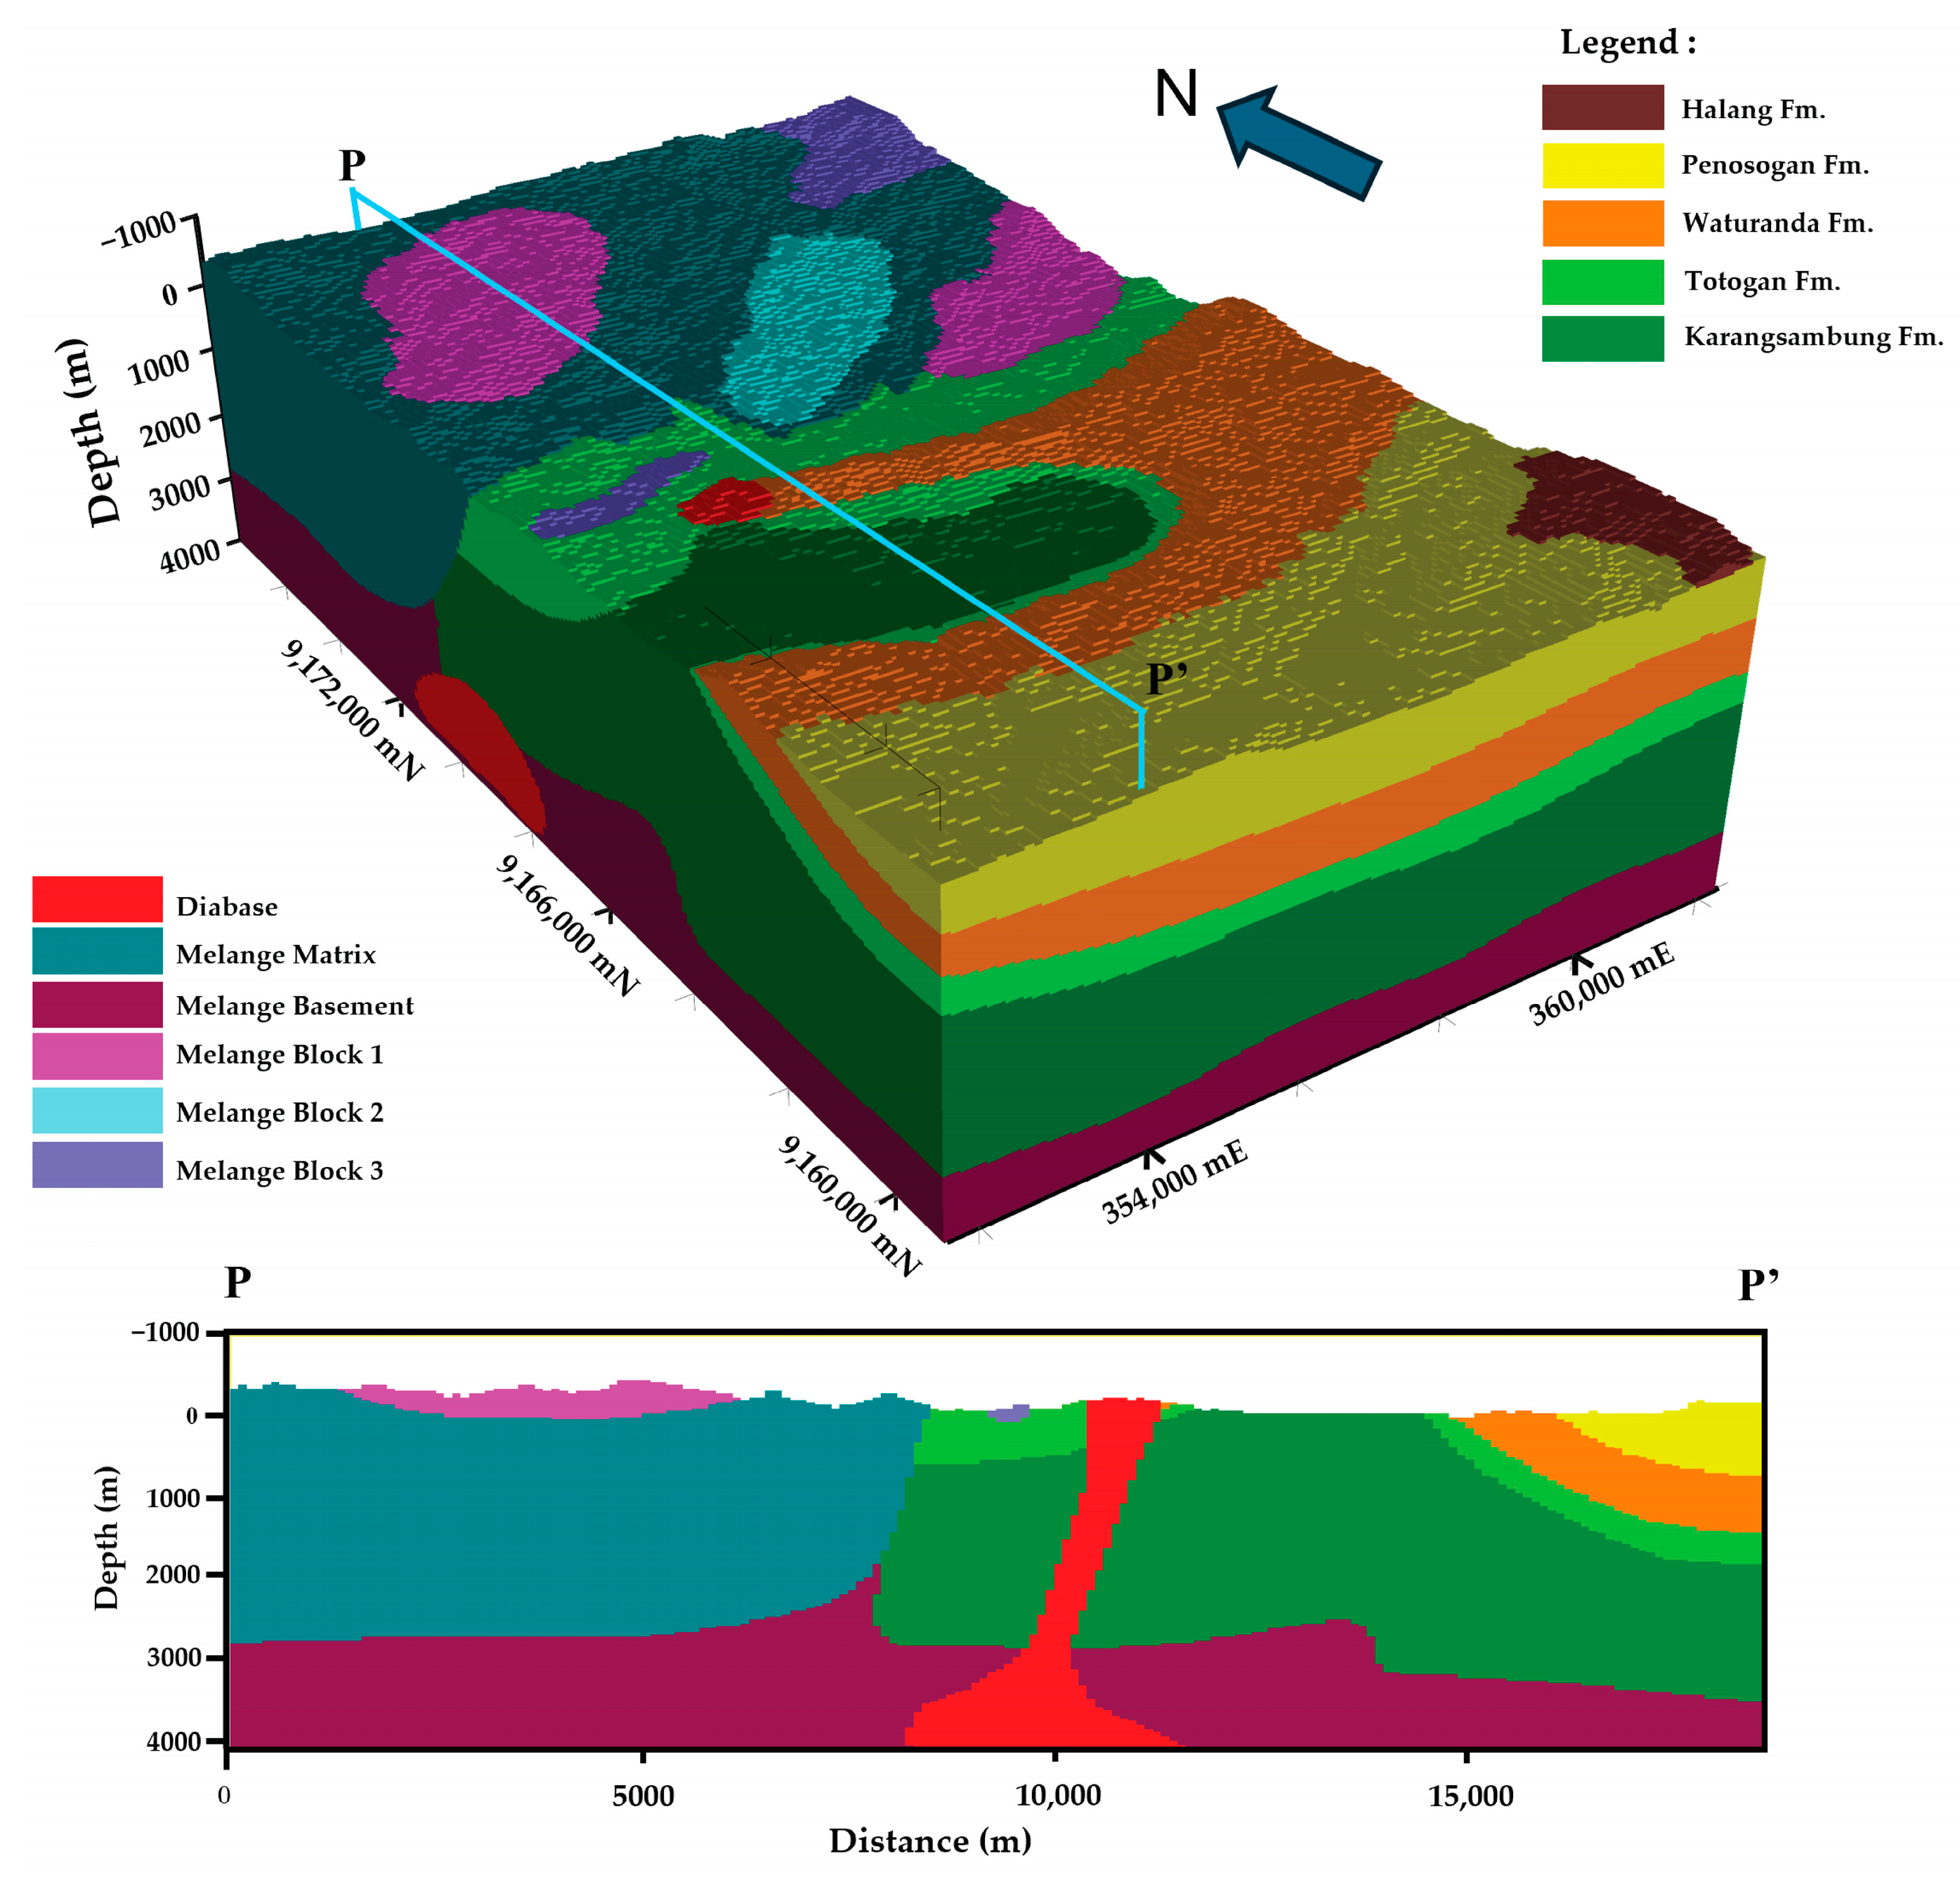
5.3. Inverted Model
6. Discussions
7. Conclusions
Author Contributions
Funding
Data Availability Statement
Acknowledgments
Conflicts of Interest
References
- Hall, R. Late Jurassic–Cenozoic Reconstructions of the Indonesian Region and the Indian Ocean. Tectonophysics 2012, 570–571, 1–41. [Google Scholar] [CrossRef]
- Hamilton, W. Tectonics of the Indonesian Region; U.S. Geological Survey Professional Paper; US Government Printing Office: Washington, DC, USA, 1979; Volume 1078. [CrossRef]
- Wakita, K. Cretaceous Accretionary–Collision Complexes in Central Indonesia. J. Asian Earth Sci. 2000, 18, 739–749. [Google Scholar] [CrossRef]
- Festa, A.; Pini, G.A.; Dilek, Y.; Codegone, G. Mélanges and Mélange-Forming Processes: A Historical Overview and New Concepts. Int. Geol. Rev. 2010, 52, 1040–1105. [Google Scholar] [CrossRef]
- Asikin, S. Evolusi Geologi Jawa Tengah Berdasarkan Teori Tektonik Dunia Yang Baru; Institut Teknologi Bandung: Bandung, Indonesia, 1974; (English Abstract Is Available). [Google Scholar]
- Wakita, K.; Miyazaki, K.; Zulkarnain, I.; Sopaheluwakan, J.; Sanyoto, P. Tectonic Implications of New Age Data for the Meratus Complex of South Kalimantan, Indonesia. Isl. Arc 1998, 7, 202–222. [Google Scholar] [CrossRef]
- Yuwono, Y.S. The Occurrence of Submarine Arc-Volcanism in the Accretionary Complex of The Luk Ulo Area, Central Java. Bull. Geol. 1997, 27, 15–26. [Google Scholar]
- Setiawan, N.I.; Yuwono, Y.S.; Sucipta, I.G.B.E. The Genesis of Tertiary “Dakah Volcanic” in Karangsambung, Kebumen, Central Java. Maj. Geol. Indones. 2011, 26, 29–44. [Google Scholar]
- Soeria-Atmadja, R.; Maury, R.C.; Bellon, H.; Pringgoprawiro, H.; Polve, M.; Priadi, B. Tertiary Magmatic Belts in Java. J. Southeast Asian Earth Sci. 1994, 9, 13–27. [Google Scholar] [CrossRef]
- Kapid, R.; Harsolumakso, A.H. Studi Nannoplakton pada Formasi Karangsambung Dan Totogan di Daerah Luk-Ulo, Kebumen Jawa Tengah. Bull. Geol. 1996, 26, 13–43, (English Abstract Is Available). [Google Scholar]
- Hayward, N.; Calvert, A.J.; Yuan, H.; Gessner, K.; Doublier, M.P. Subsurface Distribution of Granites and Greenstones in the Paleoarchean East Pilbara Terrane from 3-D Gravity Inversion. Precambrian Res. 2024, 405, 107351. [Google Scholar] [CrossRef]
- Dufréchou, G.; Harris, L.B.; Corriveau, L.; Antonoff, V. Gravity Evidence for a Mafic Intrusion beneath a Mineralized Zone in the Bondy Gneiss Complex, Grenville Province, Quebec—Exploration Implications. J. Appl. Geophys. 2011, 75, 62–76. [Google Scholar] [CrossRef]
- Nigussie, W.; Alemu, A.; Mickus, K.; Muluneh, A.A. Structure of the Upper Crust at the Axis Segmentation Stage of Rift Evolution as Revealed by Gravity Data: Case Study of the Gedemsa Magmatic Segment, Main Ethiopian Rift. J. Afr. Earth Sci. 2022, 190, 104523. [Google Scholar] [CrossRef]
- Haberland, C.; Bohm, M.; Asch, G. Accretionary Nature of the Crust of Central and East Java (Indonesia) Revealed by Local Earthquake Travel-Time Tomography. J. Asian Earth Sci. 2014, 96, 287–295. [Google Scholar] [CrossRef]
- Kamtono. Penafsiran Penampang Gaya Berat Dua Dimensi Dan Implikasinya Terhadap Kedudukan Blok-Blok Melange Luh Ulo, Karangsambung, Jawa Tengah; Institut Teknologi Bandung: Bandung, Indonesia, 1995; (English Abstract Is Available). [Google Scholar]
- Laesanpura, A.; Dahrin, D.; Sugianto, A. AMT and Gravity across praTertiary Rock Complex of Kebumen, Central Java, Indonesia. In Proceedings of the AIP Conference Proceedings, Bandung, West Java, Indonesia, 21–24 February 2017; Volume 1861, p. 030029. [Google Scholar]
- Santoso, D.; Suparka, E. Penafsiran Gaya Berat, Magnetik Dan Geologi Kompleks Melange Luh-Ulo, Jawa Tengah. J. Teknol. Miner. 1994, 1, 19–27. [Google Scholar]
- Handayani, L.; Arisbaya, I.; Mukti, M.M.; Sudrajat, Y. Determining the Origin of Volcanic Rocks in the Mélange Complex of Karangsambung Based on the Electrical Resistivity Imaging. Isl. Arc 2021, 30, e12377. [Google Scholar] [CrossRef]
- Cole, J.; Webb, S.J.; Finn, C.A. Gravity Models of the Bushveld Complex—Have We Come Full Circle? J. Afr. Earth Sci. 2014, 92, 97–118. [Google Scholar] [CrossRef]
- Barretto, J.A.L.; Dimalanta, C.B.; Yumul, G.P. Gravity Variations along the Southeast Bohol Ophiolite Complex (SEBOC), Central Philippines: Implications on Ophiolite Emplacement. Isl. Arc 2000, 9, 575–583. [Google Scholar] [CrossRef]
- Ahmady, F.N.; Santoso, D. Preliminary Gravity Study of Pre-Tertiary and Tertiary Rock in Northern Kebumen, Central Java, Indonesia. IOP Conf. Ser. Earth Environ. Sci. 2019, 318, 12007. [Google Scholar] [CrossRef]
- Beattie, D. Gravity Modeling of a Mafic-Ultramafic Association Darvel Bay, Sabah, Northern Borneo; Dalhousie University: Halifax, NS, Canada, 1986. [Google Scholar]
- Guglielmetti, L.; Comina, C.; Abdelfettah, Y.; Schill, E.; Mandrone, G. Integration of 3D Geological Modeling and Gravity Surveys for Geothermal Prospection in an Alpine Region. Tectonophysics 2013, 608, 1025–1036. [Google Scholar] [CrossRef]
- Amir, H.; Bijaksana, S.; Dahrin, D.; Nugraha, A.D.; Arisbaya, I.; Pratama, A.; Suryanata, P.B. Subsurface Structure of Sumani Segment in the Great Sumatran Fault Inferred from Magnetic and Gravity Modeling. Tectonophysics 2021, 821, 229149. [Google Scholar] [CrossRef]
- Dahrin, D.; Amir, H.; Suryanata, P.B.; Bijaksana, S.; Fajar, S.J.; Ibrahim, K.; Harlianti, U.; Arisbaya, I.; Pebrian, M.Q.; Rahman, A.A.; et al. Subsurface Structures of Sianok Segment in the GSF (Great Sumatran Fault) Inferred from Magnetic and Gravity Modeling. Front. Earth Sci. 2022, 10, 1012286. [Google Scholar] [CrossRef]
- Silver, E.A.; Joyodiwiryo, Y.; McCaffrey, R. Gravity Results and Emplacement Geometry of the Sulawesi Ultramafic Belt, Indonesia. Geology 1978, 6, 527–531. [Google Scholar] [CrossRef]
- Smyth, H.R.; Hamilton, P.J.; Hall, R.; Kinny, P.D. The Deep Crust beneath Island Arcs: Inherited Zircons Reveal a Gondwana Continental Fragment beneath East Java, Indonesia. Earth Planet. Sci. Lett. 2007, 258, 269–282. [Google Scholar] [CrossRef]
- Metcalfe, I. Tectonic Evolution of Sundaland. Bull. Geol. Soc. Malays. 2017, 63, 27–60. [Google Scholar] [CrossRef]
- Parkinson, C.D.; Miyazaki, K.; Wakita, K.; Barber, A.J.; Carswell, D.A. An Overview and Tectonic Synthesis of the Pre-Tertiary Very-High-Pressure Metamorphic and Associated Rocks of Java, Sulawesi and Kalimantan, Indonesia. Isl. Arc 1998, 7, 184–200. [Google Scholar] [CrossRef]
- Wakita, K.; Munasri; Bambang, W. Cretaceous Radiolarians from the Luk-Ulo Melange Complex in the Karangsambung Area, Central Java, Indonesia. J. Southeast Asian Earth Sci. 1994, 9, 29–43. [Google Scholar] [CrossRef]
- Sribudiyani, S.; Muchsin, N.; Ryacudu, R.; Kunto, T.; Astono, P.; Prasetya, I.; Sapiie, B.; Asikin, S.; Harsolumakso, A.H.; Yulianto, I. The Collision of the East Java Microplate and Its Implication for Hydrocarbon Occurrences in the East Java. In Proceedings of the Indonesian Petroleum Association, Jakarta, Indonesia, 14–16 October 2003. [Google Scholar]
- Kadarusman, A.; Massonne, H.J.; Van Roermund, H.; Permana, H.; Munasri, P.-T. Evolution of Eclogites and Blueschists from the Luk Ulo Complex of Central Java, Indonesia. Int. Geol. Rev. 2007, 49, 329–356. [Google Scholar] [CrossRef]
- Miyazaki, K.; Sopaheluwakan, J.; Zulkarnain, I.; Wakita, K. A Jadeite-Quartz-Glaucophane Rock from Karangsambung, Central Java, Indonesia. Isl. Arc 1998, 7, 223–230. [Google Scholar] [CrossRef]
- Suparka, E.R. Studi Petrologi dan Pola Kimia Komplek Ofiolit Karangsambung Utara, Luh Ulo, Jawa Tengah; Institut Teknologi Bandung: Bandung, Indonesia, 1988; (English Abstract Is Available). [Google Scholar]
- Asikin, S.; Handoyo, A.; Busono, H.; Gafoer, S. Geological Map of Indonesia: Kebumen Quadrangle, Central Java; Pusat Penelitian dan Pengembangan Geologi: Kota Bandung, Indonesia, 1992.
- Condon, W.H.; Pardyanto, L.; Amin, T.C.; Gafoer, S.; Samodra, H. Geological Map of Indonesia: Banjarnegara-Pekalongan Quadrangle, Central Java; Pusat Penelitian dan Pengembangan Geologi: Kota Bandung, Indonesia, 1996.
- Harsolumakso, A.H. Diabas di daerah Karangsambung, Luk Ulo, Jawa Tengah; Apakah Bentuk Kelompok Batuan Basaltik Berupa Tubuh Intrusif? In Proceedings of the Prosiding Seminar Nasional Sumberdaya Geologi, Yogyakarta, Indonesia, 20–21 September 1999. (English Abstract Is Available). [Google Scholar]
- Harsolumakso, A.H.; Noeradi, D. Deformasi Pada Formasi Karangsambung, Di Daerah Luk Ulo, Kebumen, Jawa Tengah. Bull. Geol. 1996, 26, 45–54, (English Abstract Is Available). [Google Scholar]
- Purwasatriya, E.B.; Gibran, A.K.; Rizki Aditama, M.; Waluyu, G. Sedimentologi Dan Tektonostratigrafi Formasi Halang Di Cekungan Banyumas Serta Potensinya Untuk Reservoir Hidrokarbon. J. Geol. Dan Sumberd. Miner. 2021, 22, 153–163. [Google Scholar] [CrossRef]
- Telford, W.M.; Geldart, L.P.; Sheriff, R.E. Applied Geophysics, 2nd ed.; Cambridge University Press: New York, NY, USA, 1990; Chapter 1; p. 16. [Google Scholar]
- Longman, I.M. Formulas for Computing the Tidal Accelerations Due to the Moon and the Sun. J. Geophys. Res. 1959, 64, 2351–2355. [Google Scholar] [CrossRef]
- Kane, M.F. A Comprehensive System of Terrain Corrections Using A Digital Computer. Geophysics 1962, 27, 455–462. [Google Scholar] [CrossRef]
- Nagy, D. The Prism Method for Terrain Corrections Using Digital Computers. Pure Appl. Geophys. 1966, 63, 31–39. [Google Scholar] [CrossRef]
- Buttkus, B. Spectral Analysis and Filter Theory in Applied Geophysics; Springer: Berlin/Heidelberg, Germany, 2000; ISBN 978-3-642-62943-3. [Google Scholar]
- Guillen, A.; Calcagno, P.; Courrioux, G.; Joly, A.; Ledru, P. Geological Modelling from Field Data and Geological Knowledge. Part II. Modelling Validation Using Gravity and Magnetic Data Inversion. Phys. Earth Planet. Inter. 2008, 171, 158–169. [Google Scholar] [CrossRef]
- Calcagno, P.; Chilès, J.P.; Courrioux, G.; Guillen, A. Geological Modelling from Field Data and Geological Knowledge. Part I. Modelling Method Coupling 3D Potential-Field Interpolation and Geological Rules. Phys. Earth Planet. Inter. 2008, 171, 147–157. [Google Scholar] [CrossRef]
- Holstein, H. Gravimagnetic Anomaly Formulas for Polyhedra of Spatially Linear Media. Geophysics 2003, 68, 157–167. [Google Scholar] [CrossRef]
- Plouff, D. Gravity and Magnetic Fields off Polygonal Prisms and Application to Magnetic Terrain Corrections. Geophysics 1976, 41, 727–741. [Google Scholar] [CrossRef]
- Mosegaard, K.; Tarantola, A. Monte Carlo Sampling of Solutions to Inverse Problems. J. Geophys. Res. 1995, 100, 12431–12447. [Google Scholar] [CrossRef]
- Tenzer, R.; Sirguey, P.; Rattenbury, M.; Nicolson, J. A Digital Rock Density Map of New Zealand. Comput. Geosci. 2011, 37, 1181–1191. [Google Scholar] [CrossRef]
- Bosch, M.; Guillen, A.; Ledru, P. Lithologic Tomography: An Application to Geophysical Data from the Cadomian Belt of Northern Brittany, France. Tectonophysics 2001, 331, 197–227. [Google Scholar] [CrossRef]
- Stadlober, E.; Zechner, H. The Patchwork Rejection Technique for Sampling from Unimodal Distributions. ACM Trans. Model. Comput. Simul. 1999, 9, 59–80. [Google Scholar] [CrossRef]
- Metropolis, N.; Rosenbluth, A.W.; Rosenbluth, M.N.; Teller, A.H.; Teller, E. Equation of State Calculations by Fast Computing Machines. J. Chem. Phys. 1953, 21, 1087–1092. [Google Scholar] [CrossRef]
- Ahmady, F.N. Kajian Gaya Berat Pada Kelompok Batuan Pra- Tersier Dan Tersier Di Kebumen Utara, Jawa Tengah; Institut Teknologi Bandung: Bandung, Indonesia, 2018; (English Abstract Is Available). [Google Scholar]
- Ramdhan, M.; Widiyantoro, S.; Nugraha, A.D.; Métaxian, J.P.; Rawlinson, N.; Saepuloh, A.; Kristyawan, S.; Sembiring, A.S.; Budi-Santoso, A.; Laurin, A.; et al. Detailed Seismic Imaging of Merapi Volcano, Indonesia, from Local Earthquake Travel-Time Tomography. J. Asian Earth Sci. 2019, 177, 134–145. [Google Scholar] [CrossRef]
- Ardianto, A.; Nugraha, A.D.; Afif, H.; Syahbana, D.K.; Sahara, D.P.; Zulfakriza, Z.; Widiyantoro, S.; Priyono, A.; Rosalia, S.; Saepuloh, A.; et al. Imaging the Subsurface Structure of Mount Agung in Bali (Indonesia) Using Volcano-Tectonic (VT) Earthquake Tomography. Front. Earth Sci. 2021, 9, 619587. [Google Scholar] [CrossRef]


| No | Rock Samples | N | Measured (g/cm3) | Optimized (g/cm3) | Inverted (g/cm3) | Volume Changes * (%) | Information |
|---|---|---|---|---|---|---|---|
| 1 | Luk-Ulo Melange Complex | - | - | ||||
| a. Gabbro | 3 | 2.75–2.90 | - | - | - | ||
| b. Sarpentinite | 3 | 2.63–2.78 | - | - | - | ||
| c. Phyllite | 3 | 2.59–2.70 | - | - | - | ||
| d. Melange Matrix | 2 | 2.22–2.41 | 2.36 | 2.42 ± 0.053 | 1.54 | ||
| e. Melange Block 1 | 2.79 | 2.80 ± 0.060 | −0.24 | Optimized density is estimated according to the sample of gabbro | |||
| f. Melange Block 2 | 2.65 | 2.70 ± 0.057 | −0.04 | Optimized density is estimated according to the sample of serpentinite | |||
| g. Melange Block 3 | 2.66 | 2.69 ± 0.057 | −0.02 | Optimized density is estimated according to the sample of phyllite | |||
| h. Basement | - | 2.85 | 2.85 ± 0.050 | −1.64 | |||
| 2 | Karangsambung Fm. | 2 | 2.30–2.40 | 2.37 | 2.42 ± 0.050 | 0.89 | |
| 3 | Totogan Fm. | 3 | 2.45–2.53 | 2.48 | 2.50 ± 0.070 | 0.19 | |
| 4 | Diabase | 4 | 2.68–2.85 | 2.78 | 2.77 ± 0.051 | −0.14 | |
| 5 | Waturanda Fm. | 3 | 2.40–2.68 | 2.63 | 2.62 ± 0.106 | −0.68 | |
| 6 | Panasogan Fm. | 2 | 2.42–2.56 | 2.48 | 2.35 ± 0.056 | 0.10 | |
| 7 | Halang Fm. | 2 | 2.55–2.65 | 2.62 | 2.49 ± 0.054 | 0.00 | |
| 8 | Halang Fm. | 2.63–2.74 | Purwasatriya et al. [39] |
| No | Lithology | Density Constrain | Shape Ratio | Volume Ratio | Commonality | Classification | ||||
|---|---|---|---|---|---|---|---|---|---|---|
| Mean | Std | Mean | Std | Mean | Std | Scale | Shape | |||
| 1 | Luk-Ulo Melange Complex | |||||||||
| a. Melange Matrix | 2.36 | 0.1 | 1 | 0.05 | 1 | 0.05 | 0.3 | 1 | Loose | |
| b. Melange Block 1 | 2.79 | 0.05 | 1 | 0.05 | 1 | 0.05 | 0.3 | 1 | Moderate | |
| c. Melange Block 2 | 2.65 | 0.05 | 1 | 0.05 | 1 | 0.05 | 0.3 | 1 | Moderate | |
| d. Melange Block 3 | 2.66 | 0.05 | 1 | 0.05 | 1 | 0.05 | 0.3 | 1 | Moderate | |
| e. Basement | 2.85 | 0.1 | 1 | 0.07 | 1 | 0.07 | 0.5 | 1 | Loose | |
| 2 | Karangsambung Fm. | 2.37 | 0.1 | 1 | 0.03 | 1 | 0.03 | 0.2 | 1 | Moderate |
| 3 | Totogan Fm. | 2.48 | 0.1 | 1 | 0.03 | 1 | 0.03 | 0.2 | 1 | Moderate |
| 4 | Diabase | 2.78 | 0.05 | 1 | 0.05 | 1 | 0.05 | 0.3 | 1 | Moderate |
| 5 | Waturanda Fm. | 2.63 | 0.07 | 1 | 0.05 | 1 | 0.05 | 0.2 | 1 | Moderate |
| 6 | Panasogan Fm. | 2.48 | 0.05 | 1 | 0.03 | 1 | 0.03 | 0.2 | 1 | Moderate |
| 7 | Halang Fm. | 2.62 | 0.05 | 1 | 0.02 | 1 | 0.02 | 0.2 | 1 | Strict |
Disclaimer/Publisher’s Note: The statements, opinions and data contained in all publications are solely those of the individual author(s) and contributor(s) and not of MDPI and/or the editor(s). MDPI and/or the editor(s) disclaim responsibility for any injury to people or property resulting from any ideas, methods, instructions or products referred to in the content. |
© 2024 by the authors. Licensee MDPI, Basel, Switzerland. This article is an open access article distributed under the terms and conditions of the Creative Commons Attribution (CC BY) license (https://creativecommons.org/licenses/by/4.0/).
Share and Cite
Ahmady, F.N.; Santoso, D.; Alawiyah, S.; Saepuloh, A. Three-Dimensional Subsurface Model of Luk-Ulo Melange Complex, Karangsambung, Indonesia: Insights from Gravity Modeling. Geosciences 2024, 14, 297. https://doi.org/10.3390/geosciences14110297
Ahmady FN, Santoso D, Alawiyah S, Saepuloh A. Three-Dimensional Subsurface Model of Luk-Ulo Melange Complex, Karangsambung, Indonesia: Insights from Gravity Modeling. Geosciences. 2024; 14(11):297. https://doi.org/10.3390/geosciences14110297
Chicago/Turabian StyleAhmady, Faridz Nizar, Djoko Santoso, Susanti Alawiyah, and Asep Saepuloh. 2024. "Three-Dimensional Subsurface Model of Luk-Ulo Melange Complex, Karangsambung, Indonesia: Insights from Gravity Modeling" Geosciences 14, no. 11: 297. https://doi.org/10.3390/geosciences14110297
APA StyleAhmady, F. N., Santoso, D., Alawiyah, S., & Saepuloh, A. (2024). Three-Dimensional Subsurface Model of Luk-Ulo Melange Complex, Karangsambung, Indonesia: Insights from Gravity Modeling. Geosciences, 14(11), 297. https://doi.org/10.3390/geosciences14110297