Abstract
Surfactants (i.e., solutes that reduce the surface tension of water) exist in the subsurface either naturally or are introduced to the subsurface due to anthropogenic activities (e.g., agricultural purposes, environmental remediation strategies). Surfactant-induced changes in surface tension, contact angle, density, and viscosity alter the water retention and conduction properties of the vadose zone. This research numerically investigates the effects of surfactants in the vadose zone by comparing the flow and transport of three different surfactant solutions, namely butanol, ethanol, and Triton X-100. For each surfactant case, surfactant-specific concentration-dependent surface tension, contact angle, density, and viscosity relationships were incorporated by modifying a finite element unsaturated flow and transport code. The modified code was used to simulate surfactant infiltration in the vadose zone at residual state under intermittent boundary conditions. The modelling results show that all three surfactant solutions led to unique and noteworthy differences in comparison to the infiltration of pure water containing a conservative tracer. Results indicate that surfactant infiltrations led to complex patterns with reduced vertical movement and enhanced horizontal spreading, which are a function of concentration-dependent surface tension, density, contact angle, viscosity and sorption characteristics. The findings of this research will help understanding the effects of surfactant presence in the subsurface on unsaturated flow and its possible links to future environmental problems.
1. Introduction
Surface-active agents (i.e., surfactants) can exist in subsurface either naturally (humic acid) or could be introduced anthropogenically (e.g., soil/groundwater remediation techniques, grey water use for irrigation purposes, enhanced oil recovery purposes) [1,2,3,4]. Surfactants have a special amphiphilic molecular composition (i.e., possessing both hydrophilic and hydrophobic moieties) and reduce the surface tension of water. Moreover, surfactant molecules form micelles (i.e., clusters of molecules with hydrophilic surfaces and hydrophobic cores) when the aqueous surfactant concentration reaches its critical micelle concentration (CMC) [5]. Surfactants are used in environmental clean-up strategies as wetting or foaming agents due to their enhancing effects on mobilization (due to the reduction in surface tension) and solubilization of contaminants (due to the formation of micelles) [6]. On the other hand, most perfluoroalkyl and polyfluoroalkyl substances (PFAS) show surface-active behavior and have amphiphilic properties similar to surfactants [7,8]. PFAS (also known as “forever chemicals”) can take decades to break down because of their strong and stable C–F bonds which cause them to be exceptionally resistant to degradation [9,10]. U.S. Environmental Protection Agency (EPA) announced a total of $5 billion for fiscal years 2022–2026 in grant funding to confront PFAS pollution in drinking water [11]. Additionally, there are a wide variety of organic contaminants of environmental concern (including alcohols), which have surface-active properties but are not amphiphilic [12]. Within the context of the discussion in this paper, the term surfactant will be used to include all surface-active solutes of geo-environmental interest.
Grey water (i.e., less-polluted domestic waste water excluding excreta) constitutes 60–75% of domestic wastewater [13] with surfactant concentrations that range from 0.7 to 70 mg/L [14]. As an alternative to clean water in arid or semi-arid regions, grey water is being used by households for irrigation purposes [15], commonly without proper treatment [16]. Grey water irrigation may cause reduction in hydraulic conductivity, formation of preferential flow pathways and soil water repellency [17,18,19]. As cropland expansion, industrial development, and population growth combined with climate change puts more and more pressure on water resources [20]; water scarcity will continue to be the most significant problem of our time [21] and the effects of surfactant accumulation in the subsurface will be increasingly critical in the future [6,22,23].
Even in low concentrations, the presence of surfactants in the subsurface results in decreases in the surface tension of water, and alterations in the contact angle and/or pore water density. Surfactants change the soil capillarity within the vadose zone according to Equation (1) [24].
In Equation (1), ψ is soil water pressure head, σ is surface tension, γ is effective contact angle, is density of the solution, 𝑔 is the gravitational acceleration, and 𝑟 is the effective pore radius. These surfactant-induced changes in soil capillarity reduce the water-holding capacity of the system, resulting in capillary fringe depression [25,26,27]. In unsaturated systems, surfactants’ concentration-dependent effects on surface tension and/or contact angle and density may lead to soil water pressure head differences between regions of higher surfactant concentration (lower surface tension, higher pressure) and lower surfactant concentration (higher surface tension, lower pressure) and cause “surfactant-induced unsaturated flow” which can take place even at similar water contents [28,29]. Moreover, clean water infiltration into the vadose zone with presence of surfactants results in the formation of a solute-dependent capillarity-induced focused flow (SCIFF) region, where pure water is forced to move within a single finger-patterned, highly focused, vertical flow due to being constrained by the surfactant-induced pressure gradients in the horizontal direction [30]. Since surfactants lead to a decrease in capillary forces for similar gravitational forces, one can expect a surfactant infiltration pattern with an increase in vertical seepage and a decrease in horizontal spreading, in comparison to the pure water case [31]. On the contrary, there is evidence in the literature that surfactant (butanol) infiltration into the unsaturated soils results in a significant horizontal increase with only a minor vertical decrease in the wetted zone, contradicting this simple notion of expected gravity-dominated flow [32].
Numerical modelling of surfactants in unsaturated porous media is challenging since the presence of surfactants adds complexity to the unsaturated systems, as it requires the coupling of the flow and transport processes and the dependency of soil hydraulic functions on the surfactant concentrations [33]. Some challenges and improvements on the numerical modelling for surfactant transport in porous media have been outlined by Illiano et al. (2021) [33].
Henry and Smith (2002) [34] and Henry et al. (2002) [35] investigated the surfactant (butanol) infiltration in a two-dimensional (2D) flow cell, both experimentally, and modeled these experiments numerically by implementing concentration-dependent surface tension and viscosity effects into Hydrus-2D [36]. Differences were observed between the experimental data and the numerical modelling results, which were attributed to the lack of hysteretic hydraulic functions in their numerical model [35]. Although water content reversals are generally associated with intermittent boundary conditions, the presence of surfactants causes hysteresis to occur even under monotonic flow conditions, due to the generation of capillary pressure gradients caused by the surfactant concentration-dependent surface tension and/or contact angle and density effects. Bashir et al. (2009) [37] made modifications to the hysteresis routine of Hydrus-2D [36] and simulated Henry and Smith (2002)’s laboratory experiments [34]. Numerical results of Bashir et al. (2009) showed better correlation between the experimental data and the numerical modeling results after the successful modifications to the hysteresis algorithm of Hydrus-2D. Their results show that the inclusion of hysteresis in numerical simulations played a significant role in the accurate depiction of surfactants in unsaturated flow and transport systems [28,31,37].
Three widely used surfactants were investigated in this research: (I) butanol, (II) ethanol, (III) Triton X-100 (TX-100). Low molecular-weight alcohols, such as butanol and ethanol, are commonly used for “cosolvent flushing”, a remediation technique for dense non-aqueous phase liquids (DNAPL) source zones [38,39]. Additionally, ethanol (more commonly used) and butanol can be blended with gasoline and used for alternative fuel production [40,41,42]. As the overall industrial and commercial consumption of butanol and ethanol increase, so does the risk of their spills and contamination in the environment [41,43,44]. Ethanol is fully miscible with water, whereas butanol has only a modest water solubility (7.4% weight by weight (w/w)) [42,45]. Butanol and ethanol have a low affinity to mineral surfaces and a low impact on human health [28,43]. Triton X-100 was selected as a model surfactant, since it is commonly used in commercial and industrial products, in application of agricultural pesticide formulations [46] as well as for soil washing purposes due to its excellent detergency and oil removal properties [47]. Triton X-100 is also identified as being in the range of the most toxic nonionic surfactants [48].
The numerical experiments conducted in this research examine a surfactant infiltration event, which is followed by the flushing of a surfactant-contaminated region by clean water. The concentrations of the infiltrating surfactant solutions used in numerical experiments (7% w/w butanol, pure ethanol and Triton X-100 (1 g/L)) are in accordance with the concentrations used in previous surfactant infiltration studies in the literature. Butanol has previously been used in literature as a model surfactant by many researchers at 7% w/w concentration for numerical and experimental infiltration experiments into unsaturated systems [27,28,30,35,37,49]. Denatured ethanol (95% ethanol) is reported to be the largest volume hazardous material shipped by rail [50]. As a result, accidental spills of denatured ethanol are likely to occur [51] and mostly in great quantities [50]. For example, McDowell et al. (2003) provides a description of an accidental ethanol spill case, where 19,000 gallons of denatured ethanol were released from an above-ground storage tank and ethanol concentrations continued to remain high in the monitoring wells three months after the spill (18,000 mg/L) [52]. Additionally, ethanol with concentrations 70–95% are used in surfactant (co-solvent) flushing techniques [38]. Ethanol in high concentrations is used in both experimental (95%) [43] and numerical studies (100%) [53] in the literature. Triton X-100 is commonly investigated in numerical and experimental studies for its use for soil washing and agricultural purposes in a wide range of concentrations [54,55,56], some studies have used concentrations up to one hundred times of its CMC (15 g/L) [57]. The Triton X-100 concentration (1 g/L) used in the current study is similar to the concentration used by other researchers in the infiltration experiments of Triton X-100 into unsaturated porous medium [58].
Concentration-dependent influence of butanol, ethanol, and Triton X-100 on water retention properties and their movement in unsaturated environments have been investigated separately in different experimental and numerical studies. However, to the best of the authors’ knowledge, a systematic comparison of the effects of these three surfactants on water retention and transport in the vadose zone has never been carried out in two-dimensional domains. Such a comparison is important considering some fundamental differences between these surfactants:
- (a)
- Kinematic viscosity effects: Presence of butanol and ethanol results in changes in kinematic viscosity, which impacts the unsaturated hydraulic conductivity of the porous medium, whereas Triton X-100 (1 g/L) has negligible effects. Moreover, the concentration-dependent kinematic viscosity effects of 7% w/w butanol and pure ethanol are fundamentally different from each other;
- (b)
- Density effects: Density of pure ethanol solution is significantly lower than that of pure water, therefore ethanol concentration-dependent changes in density should be considered in the numerical experiments, whereas the impacts of butanol and Triton X-100 solutions on density are negligible;
- (c)
- Contact angle effects: Triton X-100 modifies the contact angle and its concentration-dependent changes in contact angle should be considered in the water retention scaling relationship [59]. Since ethanol and butanol lead to near perfect wetting (near zero contact angle) conditions [6] even at very low concentrations, the impacts of these surfactants on contact angle do not have an influence on the equation of capillarity, according to Equation (1); and
- (d)
- Sorption effects: Butanol and ethanol have low affinity to mineral surfaces whereas Triton X-100 sorbs to soil particles.
In this research, Hydrus 2D model [36] was modified to compare the infiltration, redistribution and flushing stages of pure water with conservative tracer with three different surfactant solutions: 7% w/w butanol, pure ethanol and Triton X-100 (1 g/L). The porous medium selected for all these simulations was a fine (120-mesh) sand at its residual water content.
2. Methodology
A modified version of the Hydrus-2D [36], a two-dimensional finite element software which simulates the movement of water, heat and solute in variably saturated media, was used in the numerical experiments. Hydrus-2D [36] uses the mixed form of the Richards equation [60] to simulate water flow, as provided in Equation (2),
where is volumetric moisture content, is the time, and are indices which are from 1 to , is spatial coordinate, is pressure head, is the component of a dimensionless anisotropy tensor and K is the unsaturated hydraulic conductivity function, as provided by Equation (3).
In Equation (3), represents relative hydraulic conductivity function, and represents the saturated hydraulic conductivity. Hydrus 2D solves Equation (4) to simulate the two-dimensional solute transport during transient water flow in the vadose zone,
where is the concentration of the solute in water phase, is the sorbed phase concentration of solute , is the Darcy flux, is the bulk density, and is the hydrodynamic dispersion coefficient tensor. Equation (5) is used to calculate the hydrodynamic dispersion coefficient,
where is the free water molecular diffusion coefficient, is the liquid phase tortuosity factor, is the Kronecker delta function, is the longitudinal and is the transverse dispersivity. Hydrus 2D calculates as a function of water content by using Millington and Quirk (1961) [61] relationship (Equation (6)).
Bashir et al. (2009) [37] made modifications to the hysteresis routine of Hydrus-2D [36] to include a water content convergence criterion that improves the model convergence as well as the correct switching of hysteresis from drying to wetting and vice versa [28]. In current research, further modifications were made to the modified version [37] of Hydrus 2D [36] model by implementing the surfactant-specific concentration-dependent surface tension, contact angle, density, and viscosity functions for butanol, ethanol and Triton X-100. For the pure water with conservative tracer and the butanol cases, the numerical experiments were conducted as outlined by Bashir et al. (2018) [28].
It is important to note that surfactants might have special effects on the layered soil systems. According to Henry (2007), surfactants can adversely affect the performance of capillary barriers (i.e., by definition, consist of a fine-grained soil layer overlying a coarse-grained soil layer) [62]. Moreover, numerical solutions using the Richard equation for the modelling of variably saturated subsurface flow can exhibit stability problems at the material interfaces for multi-layered soil profiles [63]. Berardi et al. (2020) and Clément et al. (2021) address and propose solutions to this problem in two dimensional domains [64,65]. The current modified Hydrus-2D model is capable of simulating multi-layered soil profiles, however for the current study all numerical experiments are accomplished for a homogeneous soil domain.
A 120-mesh silica sand previously used by other researchers in literature [28,31,35,37], was selected as the porous medium for the numerical experiments in this study. Figure 1 shows the soil water characteristic curve (SWCC) of the sand used in the current investigation (shown in blue for pure water), which was described using the van Genuchten (1980) [66] equation (Equation (7)).
where is the volumetric water content, and are curve fitting parameters, is the saturated volumetric water content, and is the residual water content for the sand under investigation. SWCC parameters were taken as follows: = 0.270, = 0.0449, 0.0153, = 0.0214, and = 11.2 [28,31,35,37].
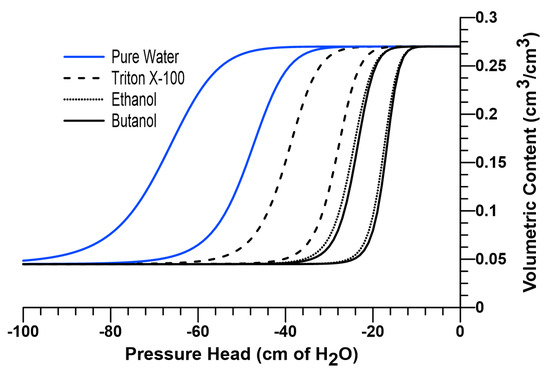
Figure 1.
Soil water characteristic curves for pure water, Triton X-100 (1 g/L), pure ethanol and 7% w/w butanol solutions.
According to Equation (1), the concentration-dependent changes in surface tension, contact angle and density affect the soil water pressure head, which can be incorporated to the van Genuchten equation by scaling the water curve along the pressure axis [65]. In other words, the soil water characteristic curve for a surfactant-wetted porous medium can be predicted by scaling (i.e., shifting) the water retention function for the same medium wetted with pure water along the pressure axis in proportion to a scaling factor, as shown in Equation (8).
In Equation (8), represents the pressure head for the pure water-wetted porous medium at , represents the pressure head at the surfactant concentration , and is the general scaling factor. Equation for is provided by Equation (9), considering the surfactant concentration-dependent changes in surface tension, contact angle, and density based on the equation of capillarity (Equation (1)).
where, is the surface tension, is the density, is the contact angle for pure water for a reference surfactant concentration of zero , and , and are the surface tension, density and contact angle at surfactant concentration . Based on the discussion above, Equation (7) can be adjusted to predict the surfactant-wetted porous medium by incorporating the general scaling factor , as given in Equation (10) [62].
Mualem (1976) [67] equation (Equation (11)) was used to calculate the unsaturated hydraulic conductivity.
In Equation (11), represents the unsaturated hydraulic conductivity, represents effective saturation which is defined as , is the saturated hydraulic conductivity, and and are curve-fitting parameters. For the numerical experiments, for the porous medium was taken as 349.9 cm/day, and was taken as 0.5. Parameter , which is equal to , was calculated as 0.9107 [28,31,35,37].
A scaled version of Mualem (1976) [67] equation (Equation (12)) can be used to consider the surfactant effects on unsaturated hydraulic conductivity since the hydraulic conductivity function is dependent on changes in kinematic viscosity [49].
In Equation (12), represents the concentration-dependent unsaturated hydraulic conductivity, is the kinematic viscosity without surfactants, is the kinematic viscosity at surfactant concentration c, and and are curve-fitting parameters as described earlier.
The details for the scaling relationships for each surfactant solution under consideration (7% w/w butanol, pure ethanol and Triton X-100 (1 g/L)) are described in the following subsections.
2.1. Butanol Scaling Relationships
Smith and Gillham (1994) [68] used Equation (13) to describe the dependence of surface tension on the concentration of butanol. Considering that the butanol concentration has negligible effect on contact angle and density, the general scaling factor is entirely dependent on the changes in surface tension.
where represents the scaling factor for 7% w/w butanol, and and are as defined earlier. In Equation (9), and are solute-dependent constants, and for butanol, they are reported as 0.365 % wt. and 0.215, respectively [28,49]. Dependence of surface tension on butanol concentration is presented in Figure 2a. The SWCC for 7% w/w butanol solution can be obtained by using Equation (10), as presented in Figure 1.
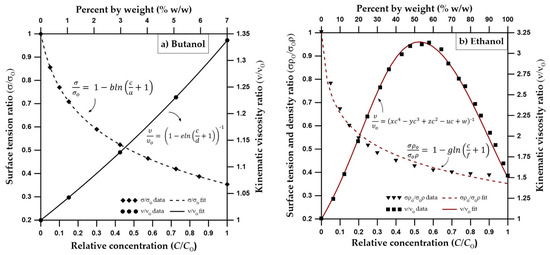
Figure 2.
(a) Dependence of surface tension and kinematic viscosity on butanol concentration based on [49,68] (surface tension and kinematic viscosity data are from [69]) (b) Dependence of surface tension, density and kinematic viscosity on ethanol concentration based on [53], surface tension data are from [70], density data from [71], viscosity data from [53].
On the other hand, Equation (14) defines the dependence of the kinematic viscosity on butanol concentration [49], as presented in Figure 2a.
In Equation (14), and are solute-dependent constants and reported as 34.49% wt. and 1.366, respectively [28,49]. Kinematic viscosity of the pure water with zero concentration of surfactants ( = 0.0) is cSt [69]. Equation (14) should be incorporated into Equation (12) to consider the 7% w/w butanol effects on unsaturated hydraulic conductivity.
Figure 2a shows the concentration-dependent surface tension and kinematic viscosity functions for butanol.
2.2. Ethanol Scaling Relationships
The scaling relationship for 7% w/w butanol solution is not directly applicable to pure ethanol because ethanol concentration-dependent impacts on density and kinematic viscosity functions are significantly different in comparison to butanol. It is also important to note that, unlike butanol (which has a modest water solubility with a 7.4% w/w concentration [42,45]), ethanol is fully miscible in water, hence can be found in much higher aqueous concentrations in comparison to butanol. Since the density of pure ethanol (0.789 g/cm3) is significantly lower than that of pure water (0.998 g/cm3) [71], the concentration-dependent density function becomes significant in the soil water pressure head scaling relationship. Therefore, in order to study the impacts of presence of ethanol on water retention, ethanol concentration-dependent functions of both surface tension and density should be considered [53]. In Equation (15), represents the scaling factor for pure ethanol, represents the density at the reference concentration , and is the density at concentration c.
By using the surface tension data reported by [70] and density data reported by [71], constants and are determined to be 0.00868 and 0.13657 for relative concentrations of 1.0. The SWCC for pure ethanol can be obtained by using Equation (10). Figure 1 also provides a comparison between the scaled SWCCs for 7% w/w butanol and pure ethanol.
The unsaturated hydraulic conductivity function is dependent on changes in kinematic viscosity, which is a function of ethanol concentration. Similar to butanol, a scaled version of the Mualem (1976) [67] equation can be used to consider the ethanol concentration effects on unsaturated hydraulic conductivity [49]. However, unlike butanol, Figure 2b shows that the dependency of kinematic viscosity on ethanol concentration is in parabolic shape. According to Figure 2b, the kinematic viscosity ratio, reaches a maximum at about 50% ethanol concentration by weight. In other words, 50% ethanol concentration will result in lower hydraulic conductivities in comparison to either pure water or pure ethanol cases.
Sciortino and Leij (2012) [53] used Equation (16) to consider the changes in kinematic viscosity due to ethanol concentration.
By using the kinematic viscosity data from Sciortino and Leij (2012) [53], constants , , , , are determined as 1.1681, 3.5749, 4.8091, 2.9825 and 1, respectively, (for relative concentrations of 1.0). Equation (16) is incorporated into Equation (12) to consider the pure ethanol effects on unsaturated hydraulic conductivity.
2.3. Triton X-100 Scaling Relationships
Triton X-100 alters the water retention properties of the vadose zone due to its concentration-dependent changes in surface tension and contact angle. Considering Equation (1), Equation (17) represents the scaling factor for Triton X-100 [59],
where represents the contact angle without surfactants, and is the contact angle at surfactant concentration c. Karagunduz et al. (2001) [59] simplified by approximating a linear scaling factor based on their experimental results for surface tension and contact angle at increasing Triton X-100 concentrations and proposed Equation (18).
In Equation (18), represents the scaling constant for Triton X-100 (which include both concentration-dependent surface tension and contact angle effects), and is the surfactant concentration. was reported as 0.0047 L/mg for Triton X-100 (for F-70 Ottawa sand) and remains equal to the CMC (150 mg/L) for concentrations above CMC, since is reported to remain constant after CMC [58,59]. The SWCC for Triton X-100 solution (1 g/L) can be obtained by incorporating into Equation (10). The scaled SWCC for Triton X-100 solution (1 g/L) is provided in Figure 1.
Unlike butanol and ethanol, sorption is an important consideration for Triton X-100, affecting its flow and transport properties. Hydrus 2D uses Equation (19) to define the Langmuir adsorption relationship,
where is adsorbed concentration, is the solution concentration, and and are solute-dependent empirical coefficients. The selected Triton X-100 concentration (1 g/L) is much greater than the concentration required for monolayer coverage of the air-water interface, which occurs near the CMC [58,72]. Based on the Karagunduz et al. (2015)’s experimental results from the batch reactor tests [58], and parameters were fitted as 0.613 and 10.65, for the relative concentrations of 1.0.
3. Modelling
A rectangular domain 680 cm wide and 550 cm high was used for the numerical experiments. These domain dimensions are similar to those used by Henry and Smith (2006) [32] and Bashir et al. (2018) [28], which were proved to be large enough to prevent extension of flow effects to the right or left boundaries, and therefore were selected and used for the numerical simulations in the current study. The initial condition of pressure head for the entire domain was set to −300 cm of head to keep the porous media near its residual moisture content. Table 1 provides a summary of the selected parameters for the Hydrus 2D model.

Table 1.
Summary of the selected parameters for the numerical model.
A variable flux source was defined at the center 1.9 cm portion of the top boundary. Finer node spacing was defined near the flux source and the spacing becomes coarser further away from the source. Left and right boundaries of the domain and the remainder of the top boundary were defined as no-flow conditions, whereas free drainage was defined for the bottom boundary. The infiltration rate () was chosen to be less than the saturated hydraulic conductivity of the porous medium in order to maintain no ponding condition at the surface. Table 2 lists the four intermittent periods defined for the variable flux boundary.
Table 2.
Applied intermittent flux boundary conditions.
Intermittent flux boundary conditions were defined to relate the current research to probable in situ conditions, where surfactant applications (due to agricultural irrigation or subsurface remediation purposes) are followed by precipitation or flushing events [28,31]. The first 24 h is the only infiltration period where a Cauchy-type solute boundary condition with a relative concentration of 1.0 was defined in the model. In other words, the infiltration of surfactant solutions (7% w/w butanol solution or pure ethanol or Triton X-100 (1 g/L)) or pure water (with conservative tracer) takes place between 0 h < 𝑡 ≤ 24 h. A redistribution period (24 h < 𝑡 ≤ 48 h) follows the solute infiltration period (0 h < 𝑡 ≤ 24 h). During the redistribution period, no infiltration takes place. Then, flushing with pure water is applied between 48 h < 𝑡 ≤ 72 h, followed by the second redistribution period (72 h < 𝑡 ≤ 96 h).
It is important to note that adsorption at the air-water interface and biodegradation are not considered in this study. Considering that the surfactants used are highly soluble in water and high surfactant concentrations are used in the numerical experiments, the adsorption at the air-water interface is not expected to be a significant mechanism considering the concentrations will remain high in the short time frame of the numerical experiments (96 h). These assumptions for the adsorption at the air-water interface for butanol, ethanol and Triton X-100 are consistent with the existing literature [35,50,58]. Biodegradation is also assumed to be negligible considering the short time frame of the numerical experiments. However, the authors would like to note that, from a general perspective, both biodegradation and adsorption at the air-water interface could play a significant role for surfactant fate and transport in the long term. For example, recent studies report that adsorption at the air-water interface can be a significant source of PFAS retention in the unsaturated soils, depending on the magnitude of the available area of the air-water interface and the specific surface activity of the given PFAS [73,74].
4. Results
To be able to better understand and compare the flow and transport of different surfactants, water content, velocity vector and concentration profiles from four numerical experiments for a) pure water containing a conservative tracer, b) butanol, c) ethanol and d) Triton X-100 are produced. The profiles at times i) 24, ii) 48, iii) 72, and iv) 96 h are at the end of the periods of i) water/surfactant infiltration, ii) redistribution, iii) water infiltration and iv) redistribution. Figure 3, Figure 4 and Figure 5 show profiles for water content, velocity vectors, and concentration in the solution phase, respectively. Velocity vectors shown in Figure 4 are located on the nodal points of the model grid and are scaled by their magnitude.
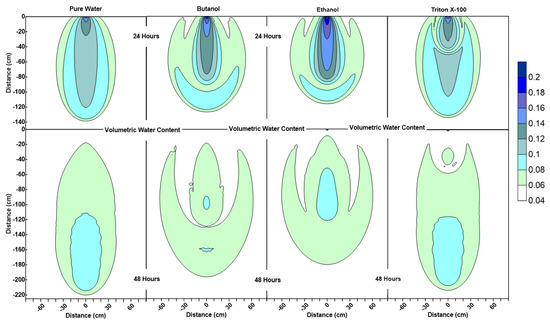
Figure 3.
Water content profiles at 24 h and 48 h for pure water, butanol, ethanol and Triton X-100 solutions.
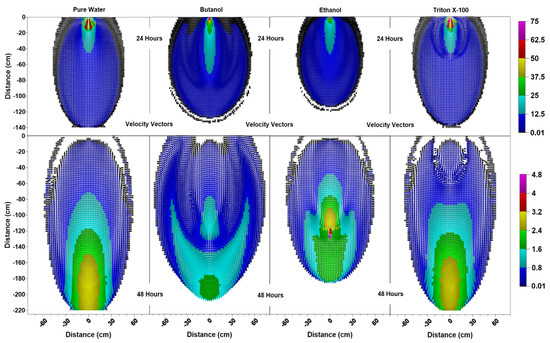
Figure 4.
Velocity vector profiles (cm/day) at 24 h and 48 h for pure water butanol, ethanol and Triton X-100 solutions.
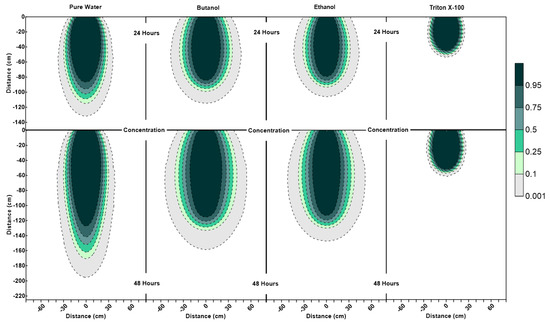
Figure 5.
Concentration profiles (for relative concentrations of 1.0) at 24 h and 48 h for pure water, butanol, ethanol and Triton X-100 solutions.
Figure 3 shows that the water content contour plots of butanol, ethanol and Triton X-100 systems are significantly different from the pure water system. It can also be observed that the profiles are different for three surfactant solutions as well. The results of this numerical experiment support the earlier observations by Henry and Smith (2006) [32] and Bashir et al. (2018) [28] that surfactant infiltration defies the simple notion that reduction in surface tension and associated lowering of capillary forces will result in enhanced vertical and reduced horizontal movement of the moisture. Figure 3 clearly shows that, for all three surfactant infiltration cases, the wetted zone has decreased in depth and enhanced horizontally at 24 h (the end of the infiltration period), albeit differently. The difference in depth and width of the wetted zone between the three surfactants is a function of concentration-dependent surface tension, contact angle, density, and viscosity effects and their sorption characteristics, as explained in the following section.
According to Figure 3, at 24 h, it is important to note that the lateral spreading as well as most of the wetted area observed in the butanol and ethanol cases occur at low volumetric water contents (0.06 < ≤ 0.08). Due to this, the remaining water for the butanol and ethanol cases is confined to a relatively small zone along the center of the profile under the point of application (x = 0 cm, 0 cm < < 90 cm), and ethanol profile has a wetter core in comparison to butanol. Figure 3 also shows that the ethanol infiltration resulted in the least vertical penetration of all cases at 24 h. Moreover, horizontal spreading is less for ethanol in comparison to butanol, which is consistent with the velocity vector profiles, where we see relatively lower magnitudes of velocity vectors for ethanol in comparison to butanol, as shown in Figure 4 at 24 h. Since the capillarity effects (SWCCs presented in Figure 1) and the concentration profiles (Figure 5) are quite similar for ethanol and butanol cases at 24 h, the differences between the two profiles (ethanol’s wetter core along the center, and less vertical and horizontal movement) can be attributed to the effect of concentration-dependent kinematic viscosity on unsaturated hydraulic conductivity (which will be discussed later in the text in more detail, when describing the velocity vector profiles at 48 h, where we see that this effect was more dominant).
Figure 3 also shows that the water content profiles of both butanol and ethanol systems show an upward-facing crescent-shaped higher water content region (0.08 < ≤ 0.1) located within a lower water content region (0.06 < ≤ 0.08), whereas pure water exhibits a more uniformly distributed water content profile at 24 h. The water content profile of Triton X-100 can be defined as a combination of the pure water and butanol/ethanol cases, where we see a “miniature” version of the water content distribution for the pure water case along the center of the profile under the point of application (x = 0 cm, 0 cm < z < 50 cm), combined with a crescent-shaped zone with higher water contents similar to the butanol/ethanol profile. However, Triton X-100 water content contour plots at 24 h show a much thicker upward-facing crescent-shaped higher water content region (0.08 < ≤ 0.1) with a wetter triangular core (0.1 < ≤ 0.12). This is attributed to the sorption characteristics of Triton X-100, which is also visible in the concentration profiles of Triton X-100 (Figure 5). Figure 5 shows that only a portion of the infiltrated Triton X-100 is available in the solution phase within the proximity of the point of application near the soil surface. Moreover, Figure 5 also shows that the concentration profiles for all systems at 24 h are consistent with their water content profiles provided in Figure 3. For example, concentration profiles of butanol and ethanol systems show increased lateral spreading with decreased vertical penetration, which reflect the water content profiles provided in Figure 3. Another important feature observed in the surfactant systems (unlike the pure water system) is the occurrence of wedge-shaped desaturated zones in the vicinity of the source on both left and right sides near the soil surface behind the wetting front. This is attributed to the fact that surfactants reduce the water-holding capacity of the porous medium. Figure 3 also shows that the depth and thickness of the desaturated zones are much shallower and thinner in the case of Triton X-100.
Figure 4 indicates that, at 24 h for surfactant systems, one can see pincers-shaped circular orientation of the velocity vectors which is caused by the irregularities due to the desaturation zones caused by the surfactant infiltration and the surfactant-induced pressure gradients. Triton X-100′s velocity vectors’ profile (Figure 4) showed a smaller zone of pincers-shaped circular orientation of the velocity vectors, in correlation with its sorption characteristics. On the other hand, pure water exhibited a more uniformly distributed velocity vector profile, where we saw vectors of higher magnitudes oriented down and outwards towards all directions from the point of application. For the pure water case, one could also see a zone of higher velocities shown in light blue (12.5 cm/day < ≤ 25 cm/day) within the zone of lower velocities shown in dark blue (0.01 cm/day (black) < ≤ 12.5 cm/day). In contrast, the wedge-shaped desaturation zones are clearly visible in Figure 4 for the butanol case at 24 h, where we saw a deeper and narrower zone of higher velocities shown in light blue within the zone of lower velocities shown in dark blue, as this zone was horizontally constrained by the desaturation zones.
The water content profiles at the end of the first redistribution period (at 48 h) in Figure 3 show that for the pure water system, one can see more vertical movement with less lateral spreading in comparison to the surfactants. Profiles for butanol and ethanol systems show an extensive lateral spreading of the wetting zone during the redistribution period in comparison to Triton X-100. This is a result of the surfactant-induced pressure gradients between the surfactant-contaminated and surfactant-free regions. Volumetric water content profile of Triton X-100 at 48 h shows similarities with both with pure water and butanol/ethanol systems. It can be observed that the vertical extent of the wetted region is similar to the pure water case, but the lateral spreading is more than that of pure water. Another difference between the water content profiles of pure water and Triton X-100 at 48 h is the shape of the drained zone, which matches with the Triton X-100 concentration profile (Figure 5). This zone is indicative of the drainage caused by the lowering of the water-holding capacity of the porous medium due to the presence of Triton X-100. These differences between Triton X-100 and the other surfactants are due to three reasons. First, the capillarity effects for Triton X-100 are less than those for butanol and ethanol as shown in Figure 1. Second, there are no concentration-dependent kinematic viscosity effects, implying that hydraulic conductivity values would be similar to that for pure water for similar water contents. Third, owing to the sorption characteristics of Triton X-100, its temporal concentration in the solution phase will be less than that for other surfactants and capillarity effects will be further muted.
The differences between the velocity vector profiles for butanol and ethanol become more distinguishable at 48 h, where one can see a larger zone of higher velocity for ethanol with larger velocity vectors at deeper depths. Figure 4 shows that the velocity vector profile for ethanol has a multi-layered single piece higher velocity zone (0.8 cm/day < ≤ 3.2 cm/day), containing vectors of highest magnitude (4 cm/day < ≤ 4.8 cm/day) towards the center (x = 0 cm, z = 120 cm). This behavior is different from the butanol case, where the higher velocity zone is divided in two parts with lower velocities due to the pincers-shaped circular orientation of the velocity vectors which is caused by the irregularities introduced by the larger wedge-shaped desaturation zones. Moreover, desaturation zones and the pincers-shaped circular orientation of the velocity vectors are less obvious for ethanol in comparison to the butanol case. Ethanol concentration contours provided in Figure 5 shows that for x = 0 cm, the ethanol concentration contour for 0.75 is located at z = 120 cm and the concentration contour for 0.5 is located at z = 125 cm. Considering that the capillarity effects (Figure 1) and the concentration profiles (Figure 5) are similar for ethanol and butanol cases, the above-mentioned differences between the two could be attributed to the effect of concentration-dependent kinematic viscosity on unsaturated hydraulic conductivity. Figure 2 indicates that for butanol, the increase in concentration resulted in a near linear increase in kinematic viscosity ratio with approximately 17% increase (1.17 times) at a relative concentration of 0.5, and approximately 34% increase (1.34 times) at a relative concentration of 1.0, in comparison to the butanol-free case. On the other hand, for ethanol, the relationship between concentration and kinematic viscosity ratio is parabolic in shape, reaching a maximum around a relative concentration of 0.5 with nearly a 220% (3.2 times) increase in kinematic viscosity ratio in comparison to the ethanol-free case, and then declining to approximately a 50% increase (1.5 times) at a relative concentration of 1.0. In other words, 50% ethanol concentration would result in lower hydraulic conductivities in comparison to either pure water or pure ethanol cases, causing zones of lower hydraulic conductivity due to mixing concentrations of ethanol and water within the advancing infiltration front and resulting in zones of lower mobility than either the antecedent water or the infiltrating ethanol solution. Beatty and Smith (2014) [75] term this phenomenon as the “sludge effect”. They also note that for field investigations, the “sludge effect” would be a more critical consideration, especially for cases of ethanol infiltration into the wettable soils at higher moisture contents, resulting in a decrease in the infiltration rate due to the mixing of soil water and infiltrating ethanol.
Figure 6, Figure 7 and Figure 8 show the volumetric water content, velocity vectors and concentration profiles at the end of the flushing (infiltration of pure water) period (at 72 h) and the second redistribution period (at 96 h).
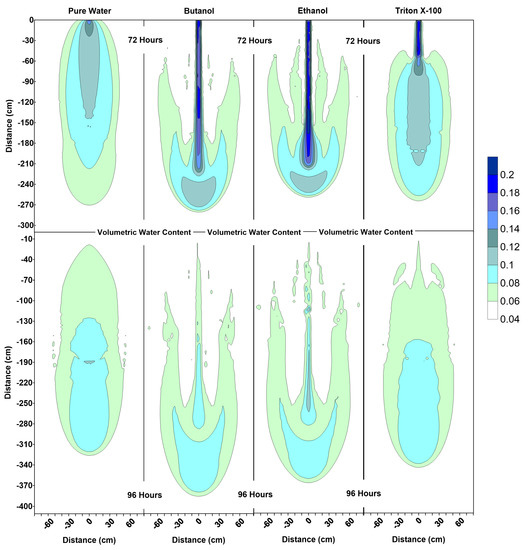
Figure 6.
Volumetric water content profiles at 72 h and 96 h for pure water, butanol, ethanol and Triton X-100 solutions.
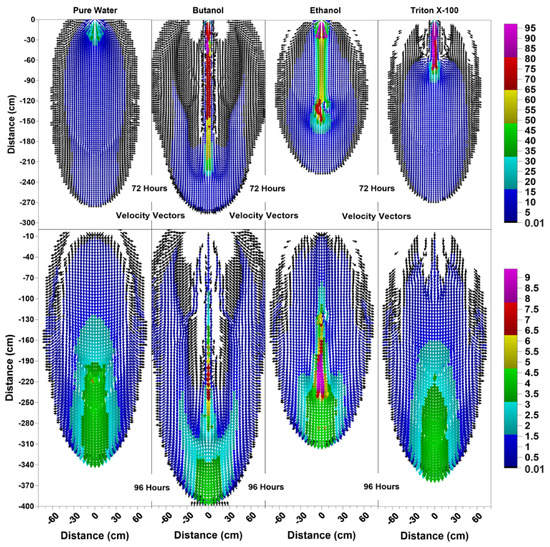
Figure 7.
Velocity vector profiles (cm/day) at 72 h and 96 h for pure water, butanol, ethanol and Triton X-100 solutions.
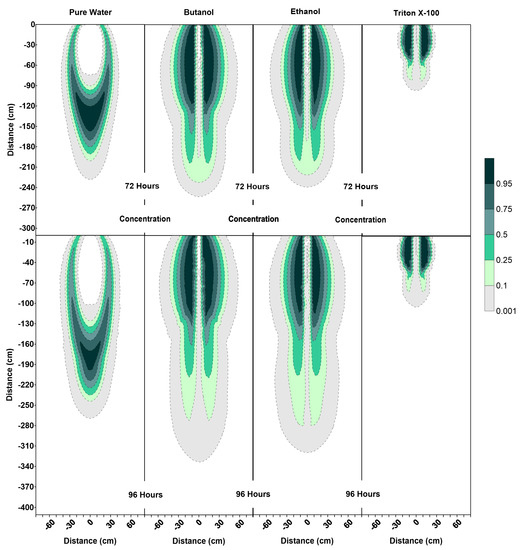
Figure 8.
Concentration profiles (for relative concentrations of 1.0) at 72 h and 96 h for pure water, butanol, ethanol and Triton X-100 solutions.
The water content profiles at 72 h and 96 h for the pure water system were similar to the pure water profiles at 24 h and 48 h, with only a slight difference in the shapes of the wetted zones, which could be attributed to the differences in initial conditions at t = 0 h and t = 48 h. On the other hand, the volumetric water content profiles for all surfactants clearly indicate the development of SCIFF [30]. These focused flow regions cause larger vertical movements of water through narrow and persistent preferential flow pathways, constraining the horizontal water movement.
For the ethanol system, the SCIFF region is stabilized by the “sludge effect”, which is responsible for slowing down the infiltrating water and resulting in a higher water content at the tip of the SCIFF, as can be seen in Figure 6. The SCIFF for ethanol, both at the tip and as a region, is wetter in comparison to the SCIFF for butanol. Moreover, water content profiles for ethanol show a wider, bulb-shaped, stabilizing zone around the base of the SCIFF region, due to the mixing at the water-ethanol interface. This zone is termed the “rind zone” by Jazwiec (2018) [43], where a similar zone was observed during the laboratory experiments of water infiltration into ethanol-contaminated sand. Moreover, according to Figure 7, the velocity vector profiles for butanol and Triton X-100 SCIFF regions show that the vector magnitudes tend to decrease with increasing depth. However, this observation does not hold true for ethanol, where we see that the velocity vector magnitudes are higher near the point of application, followed by a lower velocity SCIFF zone (30 cm < z ≤ 115 cm), then again, a higher velocity SCIFF zone (115 cm < z ≤ 150 cm), followed by a lower velocity SCIFF zone (150 cm < z ≤ 170 cm). These behaviors can again be explained by the afore-mentioned “sludge effect” caused by the nonlinearity between the ethanol concentration and kinematic viscosity relationship.
It can also be observed that the SCIFF region for Triton X-100 is much shorter (due to its sorption characteristics) in comparison with the ethanol and butanol systems. Figure 8 shows that after the flushing period (at 72 h) for the pure water system, a circular zone with the solute concentrations less than the 0.001 (0 ≤ < 0.001) can be observed directly below the point source of application. However, for the surfactant systems, this is not the case. The concentration profiles in Figure 8 clearly show that the infiltration of clean water in surfactant-contaminated systems is less successful at flushing the surfactants out of the system, with most of the surfactant still present at shallower depths. Although a relatively clean zone (0.001 ≤ < 0.1) is observed along the SCIFF regions, these zones are very narrow, due to being constrained by the surfactant-induced pressure gradients in the horizontal direction.
Figure 6 indicates that at 96 h (at the end of the second redistribution period), increased vertical water movement can be observed for surfactants, when compared to the pure water case. At 96 h, it is important to note the vertical movement in the concentration profile of the pure water system (Figure 8), where most of the conservative tracer had moved to a 120 cm depth. This is in contrast to the movement in the concentration for the surfactant systems, where a higher amount of surfactant still resides near the soil surface. This behavior is more pronounced for the Triton X-100, where the concentration profiles are very similar for 72 h and 96 h (Figure 8), and the surfactant plume has only been able to penetrate to a 90 cm depth (around one third of penetration that is experienced by butanol and ethanol), due to sorption. It is also important to note that there are differences between the velocity vector profiles for butanol and ethanol systems (Figure 7), although the concentration profiles for the two surfactants (Figure 8) appear to be quite similar. For the ethanol system, a longer and thicker higher velocity zone can be observed between the depths of 150 cm < z ≤ 170 cm, which again is an indication of the “sludge effect”.
These results clearly show that clean water infiltration from a line source after field applications of surfactants (for either agricultural or remediation purposes) will not be able to flush out the surfactants from the system.
5. Conclusions
In this study, numerical modeling was performed to compare the flow and transport characteristics of three surfactants (butanol, ethanol and Triton X-100) with pure water and a conservative tracer under non-monotonic flux boundary conditions. Numerical experiments were carried out using a modified version [37] of Hydrus 2D [36] and further modifications were made to the Hydrus 2D model by implementing the surfactant-specific concentration-dependent surface tension, contact angle, density, and viscosity functions. Modelling results were significantly different for all three surfactant infiltration events into an unsaturated sand at residual water content, in comparison to the infiltration of pure water with conservative tracer into the same porous medium with identical initial conditions.
The results of this study indicate that numerical modeling of flow and transport of surfactants in unsaturated environments requires consideration and implementation of surfactant-specific concentration-dependent effects on surface tension, contact angle, density, and viscosity effects. This can only be accomplished by coupling the flow and transport processes where water retention and conduction is a function of surfactant concentration. In general, in comparison to the infiltration of pure water containing a conservative tracer, the infiltration of surfactants will lead to complex patterns with reduced vertical and enhanced horizontal spreading. The reduction in vertical movement and enhanced horizontal spreading is expected to be surfactant-specific and a function of concentration-dependent surface tension, density, contact angle, viscosity, and sorption characteristics. Sorption is expected to mute the concentration-dependent surfactant effects owing to the availability of surfactant concentration in the aqueous phase. Adsorption at the air-water interface and biodegradation were not considered in this numerical study considering the short time frame of the numerical experiments. However, both adsorption at the air-water interface and biodegradation could be significant for long term considerations for surfactants in the vadose zone.
Specific to the surfactants considered in this research, the results from the first infiltration period (0 h < 𝑡 ≤ 24 h) show that the surfactants led to a shallower and wider wetted region in comparison to the surfactant-free system. Profiles after the first redistribution period (24 h < 𝑡 ≤ 48 h) indicate that the presence of surfactants in the subsurface caused enhanced lateral spreading of the wetting zone and the solute plume. Moreover, the nonlinearity of ethanol’s concentration-dependent kinematic viscosity function causes the “sludge effect”, which is a result of the zones of lower mobility where the mixing concentrations of ethanol had a higher kinematic viscosity in comparison to the pure water and the pure ethanol, leading to a relatively lower hydraulic conductivity zone within the advancing infiltration front. The “sludge effect” causes sudden changes in the magnitudes of the velocity vectors due to the introduction of zones of relatively lower or higher mobility caused by the changes in kinematic viscosity due to mixing concentrations of ethanol. On the other hand, sorption plays an important role for Triton X-100 and led to a smaller solute plume near the point of application.
Profiles for water flushing and redistribution periods (48 h < 𝑡 ≤ 96 h) show the important impacts of the solute-dependent capillarity-induced focused flow (SCIFF), where the water flow is confined within a narrow preferential pathway with enhanced movement in the vertical direction but was hindered in the horizontal direction [30,31]. Although water flushing was successful at moving the conservative solute away from the vicinity of the point source, for surfactant cases this was not the case. After the water flushing and redistribution periods, significant amount of surfactants were still found to reside near the soil surface and water infiltration was not able to flush the surfactants out from the system due to the “short-circuiting” of the vadose zone caused by SCIFF [30]. Results from the numerical experiments also show that the surfactant accumulation profiles are a function of the surfactant-specific sorption characteristics, as well as the surfactant-specific concentration-dependent effects on surface tension, density, contact angle and kinematic viscosity. The consideration of the “sludge effect” is important during the water flushing and redistribution periods for the ethanol case, where abrupt changes in the magnitudes of velocity vectors were observed within the SCIFF region. On the other hand, the results for Triton X-100 were dominated by its sorption characteristics. The accumulation of Triton X-100 in shallower depths led to a much shorter SCIFF region in comparison to the butanol and ethanol systems.
The impacts of the accumulation of the surfactants near the soil surface in the vicinity of the point source of application can be significant for the unsaturated porous media, from both a hydrogeological and geotechnical perspective [28]. Future pure water infiltration events might lead to the formation of additional SCIFF regions, which would cause water to move quickly and vertically while reducing the water availability in the root zone [28,30]. Moreover, mechanical properties of the unsaturated soils can also change due to the presence of surfactants [6]; for example, there is evidence in literature that butanol causes reductions in the tensile strength of the soils [76].
All the above-mentioned changes observed due to the presence of surfactants in the subsurface show the importance of considering the surfactant-specific concentration effects on surface tension, density, contact angle and kinematic viscosity as well as the sorption characteristics, in order to make accurate predictions of the surfactant flow and transport in unsaturated soils. The findings of this study are beneficial to understand how different surfactants might affect the unsaturated systems, as well as the effects of greywater irrigation and environmental remediation strategies using surfactants in the vadose zone.
Author Contributions
Conceptualization, S.B. and R.B.; methodology, S.B. and R.B.; investigation, S.B. and R.B.; writing—original draft preparation, S.B.; writing—review and editing S.B. and R.B.; visualization, S.B. and R.B.; supervision, R.B.; funding acquisition, R.B. All authors have read and agreed to the published version of the manuscript.
Funding
This research was funded by the Natural Sciences and Engineering Research Council of Canada (NSERC) through the Discovery Grant program to 2nd Author.
Data Availability Statement
Data for the conducted simulations is available upon reasonable request to the corresponding author.
Acknowledgments
We would like to thank two anonymous reviewers for their helpful comments and suggestions, which has improved the focus and quality of this manuscript.
Conflicts of Interest
The authors declare no conflict of interest.
References
- Hardie, A.G.; Madubela, N.; Clarke, C.E.; Lategan, E.L. Impact of Powdered and Liquid Laundry Detergent Greywater on Soil Degradation. J. Hydrol. 2021, 595, 126059. [Google Scholar] [CrossRef]
- Khandoozi, S.; Sharifi, A.; Riazi, M. Chapter 3—Enhanced Oil Recovery Using Surfactants. In Chemical Methods; Hemmati-Sarapardeh, A., Schaffie, M., Ranjbar, M., Dong, M., Li, Z., Eds.; Enhanced Oil Recovery Series; Gulf Professional Publishing: Oxford, UK, 2022; pp. 95–139. ISBN 978-0-12-821931-7. [Google Scholar]
- Misra, R.K.; Sivongxay, A. Reuse of Laundry Greywater as Affected by Its Interaction with Saturated Soil. J. Hydrol. 2009, 366, 55–61. [Google Scholar] [CrossRef]
- Paria, S. Surfactant-Enhanced Remediation of Organic Contaminated Soil and Water. Adv. Colloid Interface Sci. 2008, 138, 24–58. [Google Scholar] [CrossRef] [PubMed]
- Olkowska, E.; Ruman, M.; Polkowska, Ż. Occurrence of Surface Active Agents in the Environment. J. Anal. Methods Chem. 2014, 2014, 1–15. [Google Scholar] [CrossRef] [PubMed]
- Boduroglu, S.; Bashir, R. Review of Capillary Rise Experiments for Surface-Active Solutes in the Subsurface. Geotechnics 2022, 2, 706–730. [Google Scholar] [CrossRef]
- Zeng, J.; Brusseau, M.L.; Guo, B. Model Validation and Analyses of Parameter Sensitivity and Uncertainty for Modeling Long-Term Retention and Leaching of PFAS in the Vadose Zone. J. Hydrol. 2021, 603, 127172. [Google Scholar] [CrossRef]
- Organisation for Economic Co-operation and Development (OECD). Toward a New Comprehensive Global Database of Per- and Polyfluoroalkyl Substances (PFASs): Summary Report on Updating the OECD 2007 List of Per- and Polyfluoroalkyl Substances (PFASs); Organisation for Economic Co-operation and Development: Paris, France, 2018. [Google Scholar]
- Bouazza, A. Interaction between PFASs and Geosynthetic Liners: Current Status and the Way Forward. Geosynth. Int. 2021, 28, 214–223. [Google Scholar] [CrossRef]
- Lyu, X.; Li, Z.; Wang, D.; Zhang, Q.; Gao, B.; Sun, Y.; Wu, J. Transport of Perfluorooctanoic Acid in Unsaturated Porous Media Mediated by SDBS. J. Hydrol. 2022, 607, 127479. [Google Scholar] [CrossRef]
- The White House Briefing Room Fact Sheet: Biden-Harris Administration Combatting PFAS Pollution to Safeguard Clean Drinking Water for All Americans. Available online: https://www.whitehouse.gov/briefing-room/statements-releases/2022/06/15/fact-sheet-biden-harris-administration-combatting-pfas-pollution-to-safeguard-clean-drinking-water-for-all-americans/ (accessed on 1 August 2022).
- Henry, E.J.; Smith, J.E. Surfactant-Induced Flow Phenomena in the Vadose Zone: A Review of Data and Numerical Modeling. Vadose Zo. J. 2003, 2, 154–167. [Google Scholar] [CrossRef]
- Abu-Ghunmi, L.; Zeeman, G.; Fayyad, M.; Van Lier, J.B. Grey Water Treatment Systems: A Review. Crit. Rev. Environ. Sci. Technol. 2011, 41, 657–698. [Google Scholar] [CrossRef]
- Wiel-Shafran, A.; Ronen, Z.; Weisbrod, N.; Adar, E.; Gross, A. Potential Changes in Soil Properties Following Irrigation with Surfactant-Rich Greywater. Ecol. Eng. 2006, 26, 348–354. [Google Scholar] [CrossRef]
- Misra, R.K.; Patel, J.H.; Baxi, V.R. Reuse Potential of Laundry Greywater for Irrigation Based on Growth, Water and Nutrient Use of Tomato. J. Hydrol. 2010, 386, 95–102. [Google Scholar] [CrossRef]
- Gross, A.; Shmueli, O.; Ronen, Z.; Raveh, E. Recycled Vertical Flow Constructed Wetland (RVFCW)—A Novel Method of Recycling Greywater for Irrigation in Small Communities and Households. Chemosphere 2007, 66, 916–923. [Google Scholar] [CrossRef] [PubMed]
- Maimon, A.; Gross, A.; Arye, G. Greywater-Induced Soil Hydrophobicity. Chemosphere 2017, 184, 1012–1019. [Google Scholar] [CrossRef]
- Travis, M.J.; Weisbrod, N.; Gross, A. Accumulation of Oil and Grease in Soils Irrigated with Greywater and Their Potential Role in Soil Water Repellency. Sci. Total Environ. 2008, 394, 68–74. [Google Scholar] [CrossRef]
- Travis, M.J.; Wiel-Shafran, A.; Weisbrod, N.; Adar, E.; Gross, A. Greywater Reuse for Irrigation: Effect on Soil Properties. Sci. Total Environ. 2010, 408, 2501–2508. [Google Scholar] [CrossRef]
- Liu, W.; Liu, X.; Yang, H.; Ciais, P.; Wada, Y. Global Water Scarcity Assessment Incorporating Green Water in Crop Production. Water Resour. Res. 2022, 58, e2020WR028570. [Google Scholar] [CrossRef]
- Organisation for Economic Co-operation and Development (OECD). Water Resources Allocation; OECD Studies on Water; OECD: Paris, France, 2015; ISBN 9789264229624. [Google Scholar]
- Kurrey, R.; Mahilang, M.; Deb, M.K.; Shrivas, K. Analytical Approach on Surface Active Agents in the Environment and Challenges. Trends Environ. Anal. Chem. 2019, 21, e00061. [Google Scholar] [CrossRef]
- Mousavi, S.A.; Khodadoost, F. Effects of Detergents on Natural Ecosystems and Wastewater Treatment Processes: A Review. Environ. Sci. Pollut. Res. 2019, 26, 26439–26448. [Google Scholar] [CrossRef]
- Bear, J. Interfacial Tension and Capillary Pressure. In Dynamics of Fluids in Porous Media; American Elsevier Publishing Company: New York, NY, USA, 1972; pp. 441–457. ISBN 0-486-65675-6. [Google Scholar]
- Henry, E.J.; Smith, J.E.; Warrick, A.W. Surfactant Effects on Unsaturated Flow in Porous Media with Hysteresis: Horizontal Column Experiments and Numerical Modeling. J. Hydrol. 2001, 245, 73–88. [Google Scholar] [CrossRef]
- Bashir, R.; Smith, J.E.; Stolle, D. The Effect of Ionic Strength on Surfactant-Induced Unsaturated Flow. Can. Geotech. J. 2011, 48, 644–654. [Google Scholar] [CrossRef]
- Bashir, R.; Smith, J.E.; Stolle, D. Surfactant-Induced Unsaturated Flow: Instrumented Horizontal Flow Experiment and Hysteretic Modeling. Soil Sci. Soc. Am. J. 2008, 72, 1510–1519. [Google Scholar] [CrossRef]
- Bashir, R.; Smith, J.E.; Stolle, D. Surfactant Flow and Transport in the Vadose Zone: A Numerical Experiment. Environ. Geotech. 2018, 7, 361–372. [Google Scholar] [CrossRef]
- Henry, E.J.; Smith, J.E.; Warrick, A.W. Solubility Effects on Surfactant-Induced Unsaturated Flow through Porous Media. J. Hydrol. 1999, 223, 164–174. [Google Scholar] [CrossRef]
- Smith, J.E.; Henry, E.J.; Bashir, R. Solute-Dependent Capillarity-Induced Focused Flow during Infiltration into Alcohol-Contaminated Soil. Vadose Zo. J. 2011, 10, 403–411. [Google Scholar] [CrossRef]
- Boduroglu, S.; Bashir, R. Numerical Experiments on Flow and Transport of Various Surfactant Solutions in the Vadose Zone. In Proceedings of the GeoEdmonton, Edmonton, AB, Canada, 23–26 September 2018; September The Canadian Geotechnical Society: Edmonton, AB, Canada, 2018. [Google Scholar]
- Henry, E.J.; Smith, J.E. Numerical Demonstration of Surfactant Concentration-Dependent Capillarity and Viscosity Effects on Infiltration from a Constant Flux Line Source. J. Hydrol. 2006, 329, 63–74. [Google Scholar] [CrossRef]
- Illiano, D.; Pop, I.S.; Radu, F.A. Iterative Schemes for Surfactant Transport in Porous Media. Comput. Geosci. 2021, 25, 805–822. [Google Scholar] [CrossRef]
- Henry, E.J.; Smith, J.E. The Effect of Surface-Active Solutes on Water Flow and Contaminant Transport in Variably Saturated Porous Media with Capillary Fringe Effects. J. Contam. Hydrol. 2002, 56, 247–270. [Google Scholar] [CrossRef]
- Henry, E.J.; Smith, J.E.; Warrick, A.W. Two-Dimensional Modeling of Flow and Transport in the Vadose Zone with Surfactant-Induced Flow. Water Resour. Res. 2002, 38, 16–33. [Google Scholar] [CrossRef]
- Simunek, J.; Sejna, M.; Van Genuchten, M. The HYDRUS-2D Software Package for Simulating the Two-Dimensional Movement of Water, Heat, and Multiple Solutes in Variably-Saturated Media. Version 2.0; U.S. Salinity Laboratory, Agricultural Research Service, U.S. Department of Agriculture: Riverside, CA, USA, 1999. [Google Scholar]
- Bashir, R.; Smith, J.E.; Henry, E.J.; Stolle, D. On the Importance of Hysteresis in Numerical Modeling of Surfactant-Induced Unsaturated Flow. Soil Sediment Contam. 2009, 18, 264–283. [Google Scholar] [CrossRef]
- Pennell, K.D.; Cápiro, N.L.; Walker, D.I. Surfactant and Cosolvent Flushing. In Chlorinated Solvent Source Zone Remediation; Springer: New York, NY, USA, 2014; pp. 353–394. ISBN 978-1-4614-6921-6. [Google Scholar]
- Alazaiza, M.Y.D.; Copty, N.K.; Abunada, Z. Experimental Investigation of Cosolvent Flushing of DNAPL in Double-Porosity Soil Using Light Transmission Visualization. J. Hydrol. 2020, 584, 124659. [Google Scholar] [CrossRef]
- Karimi, K.; Tabatabaei, M.; Sárvári Horváth, I.; Kumar, R. Recent Trends in Acetone, Butanol, and Ethanol (ABE) Production. Biofuel Res. J. 2015, 2, 301–308. [Google Scholar] [CrossRef]
- Vuong, K.H. Modeling the Fate of Groundwater Contaminants Resulting from Leakage of Butanol-Blended Fuel. Master’s Thesis, Department of the Air Force, Air Force Institute of Technology, Air University, Wright-Patterson Air Force Base, Montgomery County, OH, USA, 2010. [Google Scholar]
- Harvey, B.G.; Meylemans, H.A. The Role of Butanol in the Development of Sustainable Fuel Technologies. J. Chem. Technol. Biotechnol. 2011, 86, 2–9. [Google Scholar] [CrossRef]
- Jazwiec, A. Focused Flow during Water Infiltration into Ethanol Contaminated Unsaturated Porous Media. Master’s Thesis, McMaster University, Hamilton, ON, Canada, 2018. [Google Scholar]
- Nelson, D.K.; Lapara, T.M.; Novak, P.J. Effects of Ethanol-Based Fuel Contamination: Microbial Community Changes, Production of Regulated Compounds, and Methane Generation. Environ. Sci. Technol. 2010, 44, 4525–4530. [Google Scholar] [CrossRef]
- Bashir, R. Quantification of Surfactant-Induced Unsaturated Flow in the Vadose Zone. Ph.D. Thesis, McMaster University, Hamilton, ON, Canada, 2007. [Google Scholar]
- Jho, E.H.; Yun, S.H.; Thapa, P.; Nam, J. Changes in the Aquatic Ecotoxicological Effects of Triton X-100 after UV Photodegradation. Environ. Sci. Pollut. Res. 2021, 28, 11224–11232. [Google Scholar] [CrossRef] [PubMed]
- Befkadu, A.A.; Chen, Q. Surfactant-Enhanced Soil Washing for Removal of Petroleum Hydrocarbons from Contaminated Soils: A Review. Pedosphere 2018, 28, 383–410. [Google Scholar] [CrossRef]
- Abu-Ghunmi, L.; Badawi, M.; Fayyad, M. Fate of Triton X-100 Applications on Water and Soil Environments: A Review. J. Surfactants Deterg. 2014, 17, 833–838. [Google Scholar] [CrossRef]
- Smith, J.E.; Gillham, R.W. Effects of Solute Concentration-Dependent Surface Tension on Unsaturated Flow: Laboratory Sand Column Experiments. Water Resour. Res. 1999, 35, 973–982. [Google Scholar] [CrossRef]
- Shaw’s Environmental and Infrastructure Group. Large Volume Ethanol Spills—Environmental Impacts & Response Options; Prepared for Commonwealth of Massachusetts Department of Environmental Protection: Boston, MA, USA, 2011. [Google Scholar]
- Freitas, J.G.; Barker, J.F. Denatured Ethanol Release into Gasoline Residuals, Part 2: Fate and Transport. J. Contam. Hydrol. 2013, 148, 79–91. [Google Scholar] [CrossRef]
- McDowell, C.J.; Buscheck, T.; Powers, S.E. Behavior of Gasoline Pools Following a Denatured Ethanol Spill. Groundwater 2003, 41, 746–757. [Google Scholar] [CrossRef]
- Sciortino, A.; Leij, F.J. Numerical Investigation of the Impact of Ethanol on Flow in the Vadose Zone. Ground Water 2012, 50, 883–894. [Google Scholar] [CrossRef] [PubMed]
- Deitsch, J.J.; Smith, J.A. Effect of Triton X-100 on the Rate of Trichloroethene Desorption from Soil to Water. Environ. Sci. Technol. 1995, 29, 1069–1080. [Google Scholar] [CrossRef] [PubMed]
- Gitipour, S.; Narenjkar, K.; Farvash, E.S.; Asghari, H. Soil Flushing of Cresols Contaminated Soil: Application of Nonionic and Ionic Surfactants under Different PH and Concentrations. J. Environ. Health Sci. Eng. 2014, 12, 129. [Google Scholar] [CrossRef]
- Li, X.; Wu, B.; Zhang, Q.; Liu, Y.; Wang, J.; Xu, D.; Li, F.; Ma, F.; Gu, Q. Effects of Soil Properties on the Remediation of Diesel-Contaminated Soil by Triton X-100-Aided Washing. Environ. Sci. Pollut. Res. 2020, 27, 23323–23330. [Google Scholar] [CrossRef]
- Rodríguez-Cruz, M.S.; Sánchez-Martín, M.J.; Sánchez-Camazano, M. Enhanced Desorption of Herbicides Sorbed on Soils by Addition of Triton X-100. J. Environ. Qual. 2004, 33, 920–929. [Google Scholar] [CrossRef] [PubMed]
- Karagunduz, A.; Young, M.H.; Pennell, K.D. Influence of Surfactants on Unsaturated Water Flow and Solute Transport. Water Resour. Res. 2015, 51, 1977–1988. [Google Scholar] [CrossRef]
- Karagunduz, A.; Pennell, K.D.; Young, M.H. Influence of a Nonionic Surfactant on the Water Retention Properties of Unsaturated Soils. Soil Sci. Soc. Am. J. 2001, 65, 1392–1399. [Google Scholar] [CrossRef]
- Richards, L.A. Capillary Conduction of Liquids through Porous Mediums. J. Appl. Phys. 1931, 1, 318–333. [Google Scholar] [CrossRef]
- Millington, R.J.; Quirk, J.P. Permeability of Porous Solids. Trans. Faraday Soc. 1961, 57, 1200–1207. [Google Scholar] [CrossRef]
- Henry, E.J. Analytical and Numerical Modeling Assessment of Capillary Barrier Performance Degradation Due to Contaminant-Induced Surface Tension Reduction. J. Geotech. Geoenvironmental Eng. 2007, 133, 231–236. [Google Scholar] [CrossRef]
- Bashir, R.; Stolle, D.F.; Smith, J.E. Flux-Based Alternative Formulation for Variably Saturated Subsurface Flow. J. Hydrol. Eng. 2007, 12, 501–512. [Google Scholar] [CrossRef]
- Berardi, M.; Difonzo, F.; Lopez, L. A Mixed MoL–TMoL for the Numerical Solution of the 2D Richards’ Equation in Layered Soils. Comput. Math. Appl. 2020, 79, 1990–2001. [Google Scholar] [CrossRef]
- Clément, J.-B.; Golay, F.; Ersoy, M.; Sous, D. An Adaptive Strategy for Discontinuous Galerkin Simulations of Richards’ Equation: Application to Multi-Materials Dam Wetting. Adv. Water Resour. 2021, 151, 103897. [Google Scholar] [CrossRef]
- van Genuchten, M.T. Closed-Form Equation for Predicting the Hydraulic Conductivity of Unsaturated Soils. Soil Sci. Soc. Am. J. 1980, 44, 892–898. [Google Scholar] [CrossRef]
- Mualem, Y. A New Model for Predicting the Hydraulic Conductivity of Unsaturated Porous Media. Water Resour. Res. 1976, 12, 513–522. [Google Scholar] [CrossRef]
- Smith, J.E.; Gillham, R.W. The Effect of Concentration-dependent Surface Tension on the Flaw of Water and Transport of Dissolved Organic Compounds: A Pressure Head-based Formulation and Numerical Model. Water Resour. Res. 1994, 30, 343–354. [Google Scholar] [CrossRef]
- Smith, J.E. The Effect of Solute Concentration Dependent Surface Tension on Vadose Zone Flow and Transport. Ph.D. Thesis, University of Waterloo, Waterloo, ON, Canada, 1995. [Google Scholar]
- Vazquez, G.; Alvarez, E.; Navaza, J.M. Surface Tension of Alcohol + Water from 20 to 50 °C. J. Chem. Eng. Data 1995, 40, 611–614. [Google Scholar] [CrossRef]
- Khattab, I.S.; Bandarkar, F.; Fakhree, M.A.A.; Jouyban, A. Density, Viscosity, and Surface Tension of Water+ethanol Mixtures from 293 to 323K. Korean J. Chem. Eng. 2012, 29, 812–817. [Google Scholar] [CrossRef]
- Rosen, M.J.; Kunjappu, J.T. Adsorption of Surface-Active Agents at Interfaces: The Electrical Double Layer. In Surfactants and Interfacial Phenomena, 5th ed.; John Wiley & Sons, Inc.: Hoboken, NJ, USA, 2012; pp. 40–66. ISBN 9781118228920. [Google Scholar]
- Silva, J.A.K.; Šimůnek, J.; McCray, J.E. A Modified HYDRUS Model for Simulating PFAS Transport in the Vadose Zone. Water 2020, 12, 2758. [Google Scholar] [CrossRef]
- Silva, J.A.K.; Šimůnek, J.; McCray, J.E. Comparison of Methods to Estimate Air-Water Interfacial Areas for Evaluating PFAS Transport in the Vadose Zone. J. Contam. Hydrol. 2022, 247, 103984. [Google Scholar] [CrossRef]
- Beatty, S.M.; Smith, J.E. Infiltration of Water and Ethanol Solutions in Water Repellent Post Wildfire Soils. J. Hydrol. 2014, 514, 233–248. [Google Scholar] [CrossRef]
- Jindal, P.; Sharma, J.; Bashir, R. Effect of Pore-Water Surface Tension on Tensile Strength of Unsaturated Sand. Indian Geotech. J. 2016, 46, 276–290. [Google Scholar] [CrossRef]


Disclaimer/Publisher’s Note: The statements, opinions and data contained in all publications are solely those of the individual author(s) and contributor(s) and not of MDPI and/or the editor(s). MDPI and/or the editor(s) disclaim responsibility for any injury to people or property resulting from any ideas, methods, instructions or products referred to in the content. |
© 2023 by the authors. Licensee MDPI, Basel, Switzerland. This article is an open access article distributed under the terms and conditions of the Creative Commons Attribution (CC BY) license (https://creativecommons.org/licenses/by/4.0/).