Article

Surface Water and Groundwater Suitability for Irrigation Based on Hydrochemical Analysis in the Lower Mayurakshi River Basin, India

1
Department of Geography, Aliah University, 17 Gorachand Road, Park Circus, Kolkata 700014, India
2
PG Department of Geography, Raja NL Khan Women’s College, Vidyasagar University, Midnapore 721102, India
3
Laboratorio de Geografía Física, Escuela de Geografía, Universidad de Costa Rica, San Pedro 2060, Costa Rica
4
Department of Chemistry, Aliah University, IIA/27 New Town, Kolkata 700160, India
*
Author to whom correspondence should be addressed.
Geosciences 2022, 12(11), 415; https://doi.org/10.3390/geosciences12110415
Submission received: 17 September 2022 / Revised: 19 October 2022 / Accepted: 8 November 2022 / Published: 10 November 2022
(This article belongs to the Collection Early Career Scientists’ (ECS) Contributions to Geosciences)

Abstract

:
The present work investigates the hydrochemical properties of the surface and groundwater of the Mayurakshi River Basin (India) for assessing their irrigation suitability with respect to irrigation hazards. The study involves 72 water samples classified as 48 surface water samples (pre-monsoon: 24; post-monsoon: 24) and 24 groundwater samples (pre-monsoon:12; post-monsoon: 12). Regarding the specific irrigation hazard, percent of sodium and soluble sodium percentage have demonstrated the groundwater vulnerability to sodium while the surface water is observed to be free from this kind of hazard. Similar findings have also been retained for magnesium hazard and the potential salinity hazard. Moreover, regarding the seasonality of the hazards, the post-monsoon season has depicted a higher level of irrigation hazards compared to the pre-monsoon season. The study found that the general evolution of groundwater hydrochemistry and the suitability of water for irrigation are principally governed by carbonate weathering, sand mining, stone crushing, and the development of brick kiln industries. Our methodology can be a good example for similar contexts, especially in developing and tropical countries.

1. Introduction

The study of river and groundwater quality from the perspective of irrigation suitability has become highly significant for achieving sustainable agricultural development through effective policy framing because soil health and crop production are determined by the quality of irrigation water delivered [1]. Therefore, for achieving a higher agricultural return with minimum environmental effect, researchers across the world are continuously addressing the issues related to the irrigation water quality of surface and groundwater [2,3]. Numerous guidelines for irrigation water quality have been developed in this area. Using electrical conductivity (EC) and total dissolved solids (TDS) as an example, the U.S. Salinity Laboratory Staff (USSL) has developed a standard that categorises irrigation water quality for agricultural use [4]. A recommendation based on water salinity has also been made by the Food and Agriculture Organization (FAO) [5]. A standard for the reuse of wastewater for irrigation has been established by the World Health Organization (WHO). Furthermore, numerous methodological approaches such as the irrigation water quality index (IWQI) and FUZZY-AHP have also been found for assessing irrigation water quality [6]. In recent decades, addressing the ionic hazards in irrigation through sodium adsorption ratio (SAR), percent Na (%Na), residual sodium carbonate (RSC), soluble sodium percentage (SSP), magnesium hazard (MH), permeability index (PI), potential salinity (PS) is noteworthy [7,8]. For example, ref. [9] addressed the irrigation water quality of Qinling Mountain region, China using SAR, PI, RSC, and %Na and explained the geochemical processes responsible for irrigation hazards. Moreover, groundwater in the Northwest China region, investigated by [10], exhibits that ~60% of water samples are unsuitable for irrigation as per USSL and Wilcox diagrams and values of the Kelly ratio. Jassas et al. [11] also used the same methods for addressing the groundwater suitability for irrigation in Al-Khazir Gomal Basin (Northern Iraq) and observed that all the water samples, in terms of SAR, are suitable for irrigation. Ghazaryan et al. [12] suggested the monitoring of Tarin River water for resolving the problem of high salt concentration and augmenting irrigation efficiency. In India, agriculture is the dominant sector of the economy, and about 63.25 million ha net area comes under irrigation, of which 62% is from tube wells and other wells, about 26% from the canal, about 3% from tanks, and about 9% from other sources [13]. Therefore, studies in this direction have also been conducted in many regions of India [7,14,15,16,17,18] and other countries [3,19,20,21]. For example, ref. [4] investigated the saline intrusion into groundwater and the agricultural distress in the coastal region of West Bengal. Sarkar et al. [22] identified magnesium hazard as a key issue for irrigation in the Gangetic region of West Bengal. Additionally, addressing groundwater quality in the same direction in the other parts of India is also noteworthy [23,24]. In addition, many studies have also investigated the surface water quality for irrigation. For example, ref. [1] explored the surface water quality of the Churni river for irrigation use. Hoque et al. [25] observed the deteriorating irrigation water quality of the Damodar River due to the continuous mixing of urban and industrial effluents.
Mayurakshi River Basin (MRB) offers huge fertile agricultural land where the cultivation of kharif (a summer season crop) and rabi crops (a winter season crop) require intensive irrigation water from the river and groundwater. There are seven major irrigation canals made for accessing river water for agriculture ((1) Mayurakshi–Dwarka Main Canal, (2) Dwarka–Brahmani Main Canal, (3) Brahmani North Main Canal, (4) Mayurakshi–Bakreshwar Main Canal, (5) Bakreshwar Kopai Main Canal, (6) Kopai South Main Canal and (7) Bakreshwar Branch Canal). Three districts of West Bengal, i.e., Birbhum (2209 km2), Murshidabad (806 km2), and Bardhhaman (897 km2) have benefited from the seven major irrigation canals [26]. Moreover, agriculture in this region is heavily dependent on groundwater supply. Therefore, the quality of the river and groundwater has become a significant factor in achieving higher agricultural returns [27]. The surface and groundwater of MRB have been studied from different perspectives. For example, ref. [28] detected the fluoride contamination areas in the Mayurakshi river basin. Das et al. [29] addressed the arsenic problem in groundwater in the lower Mayurakshi river basin. Pal et al. [30] identified the water deficit areas in this river basin. However, the suitability of surface and groundwater for irrigation in the MRB has not been evaluated in previous works. Therefore, the assessment of the river and groundwater for irrigation suitability in the MRB needs special attention for the development of agriculture. Hence, we aim to (1) trace the spatial and temporal variations in hydrochemistry of river and groundwater, (2) find out the suitability of river and groundwater for irrigation, and (3) assess the factors and mechanisms governing irrigation suitability of water.

2. Materials and Methods
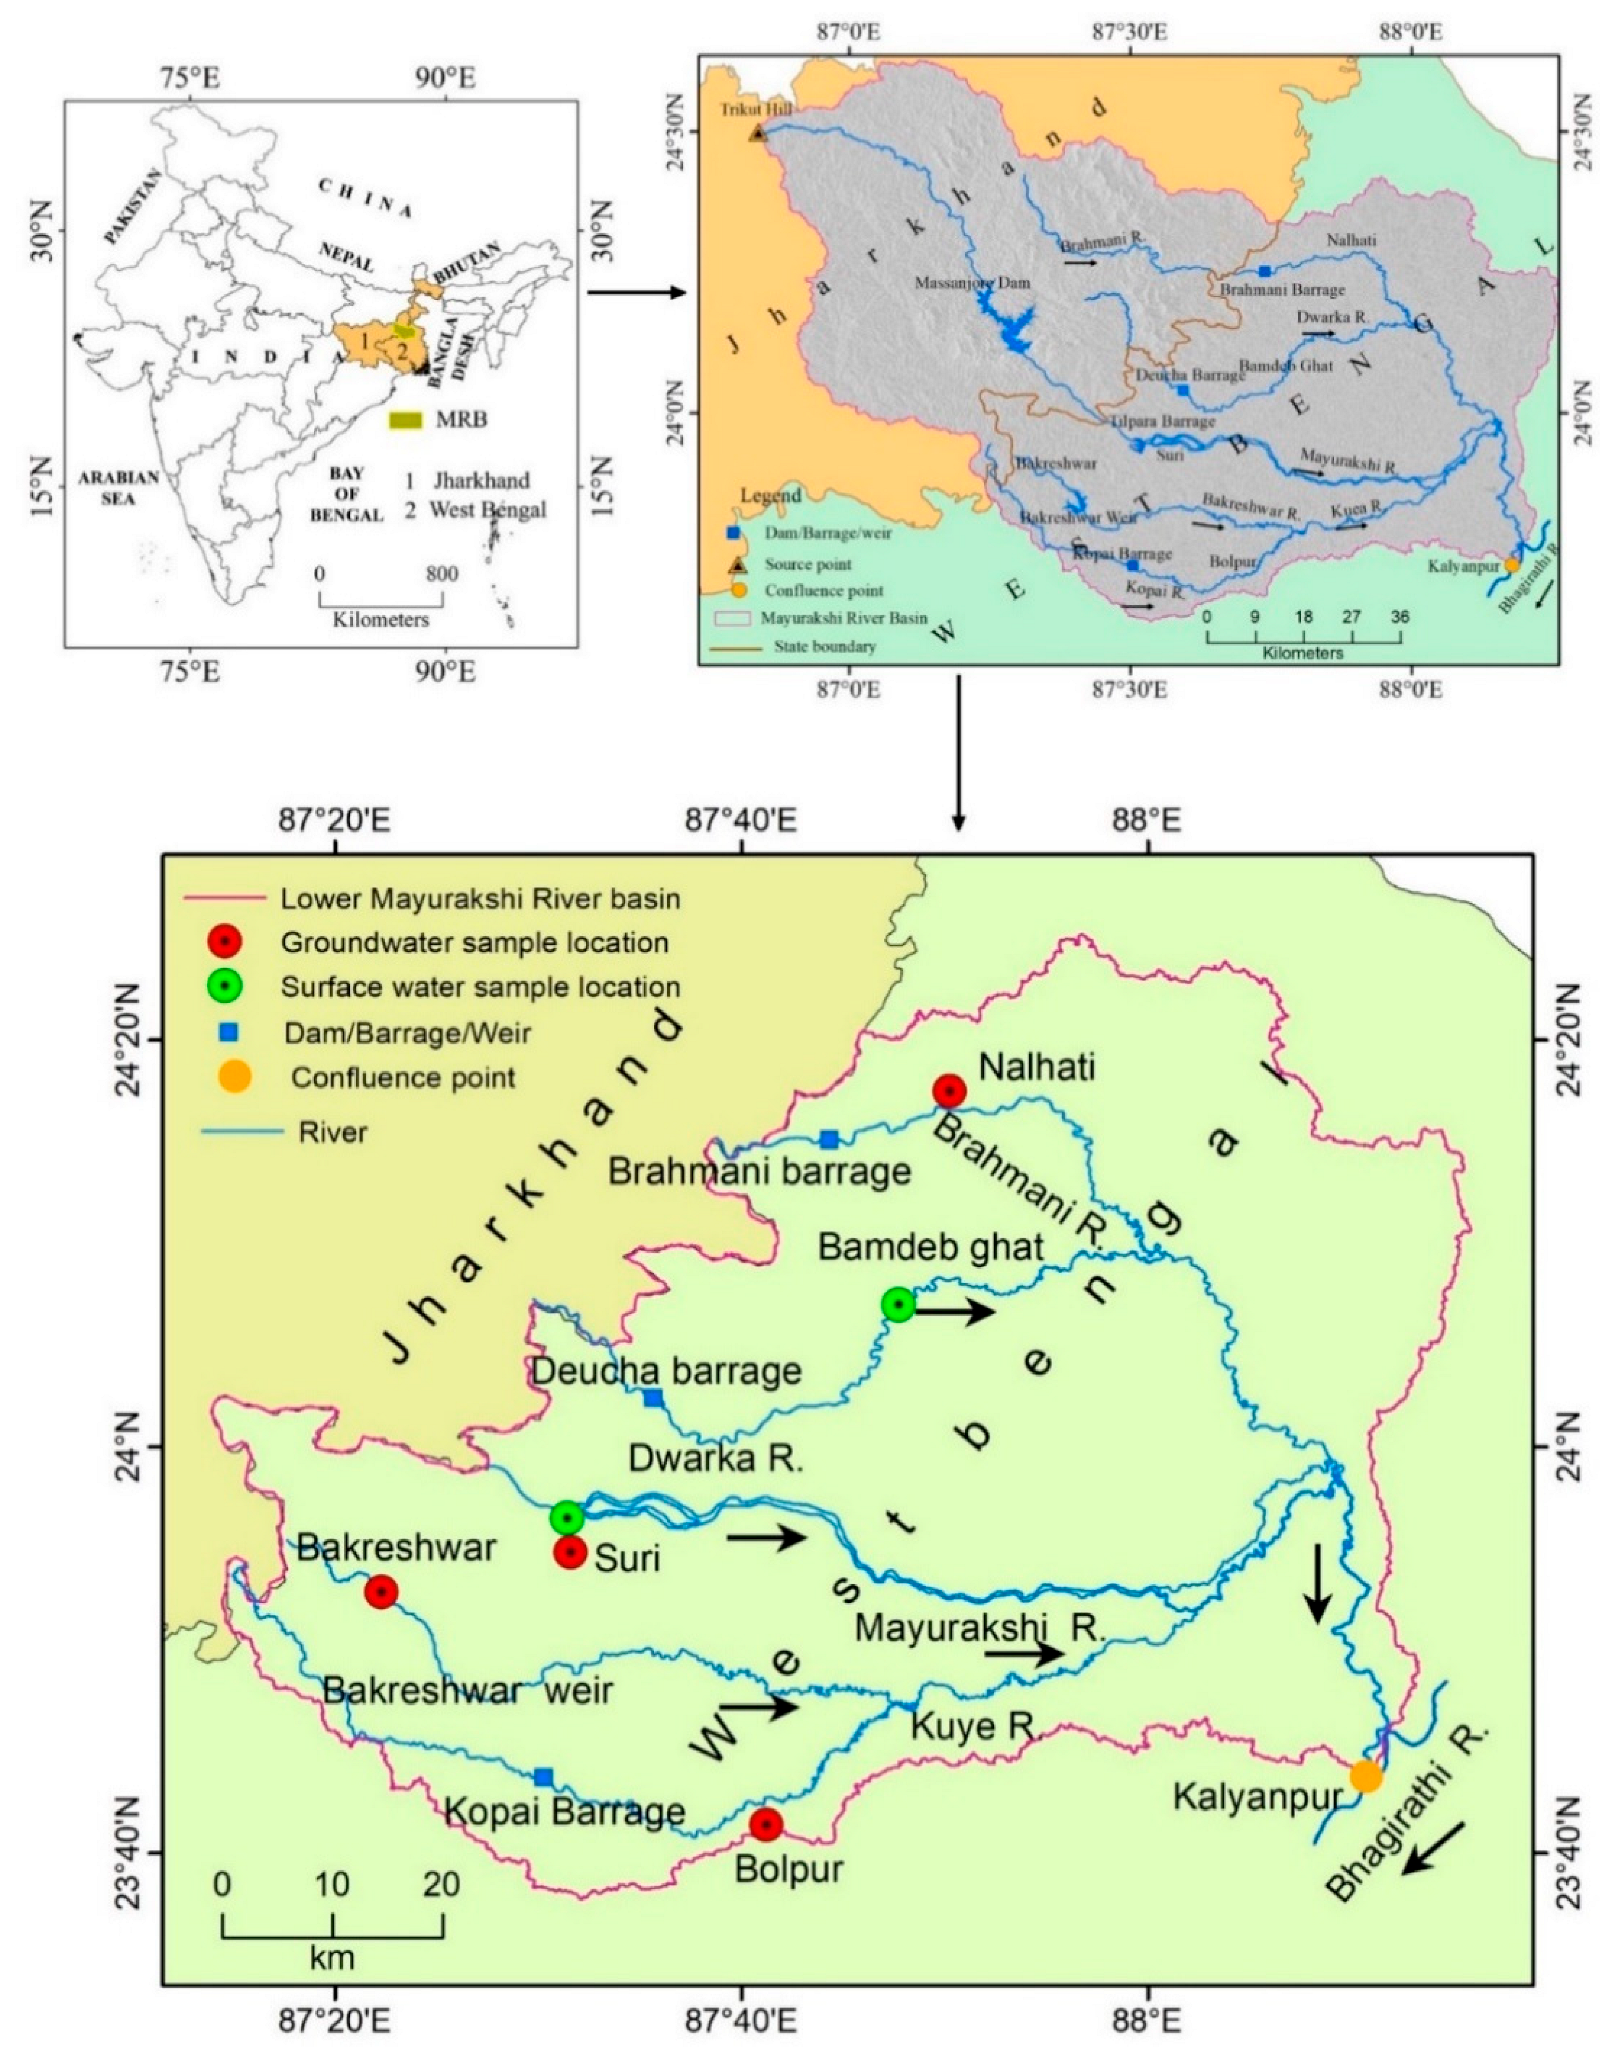
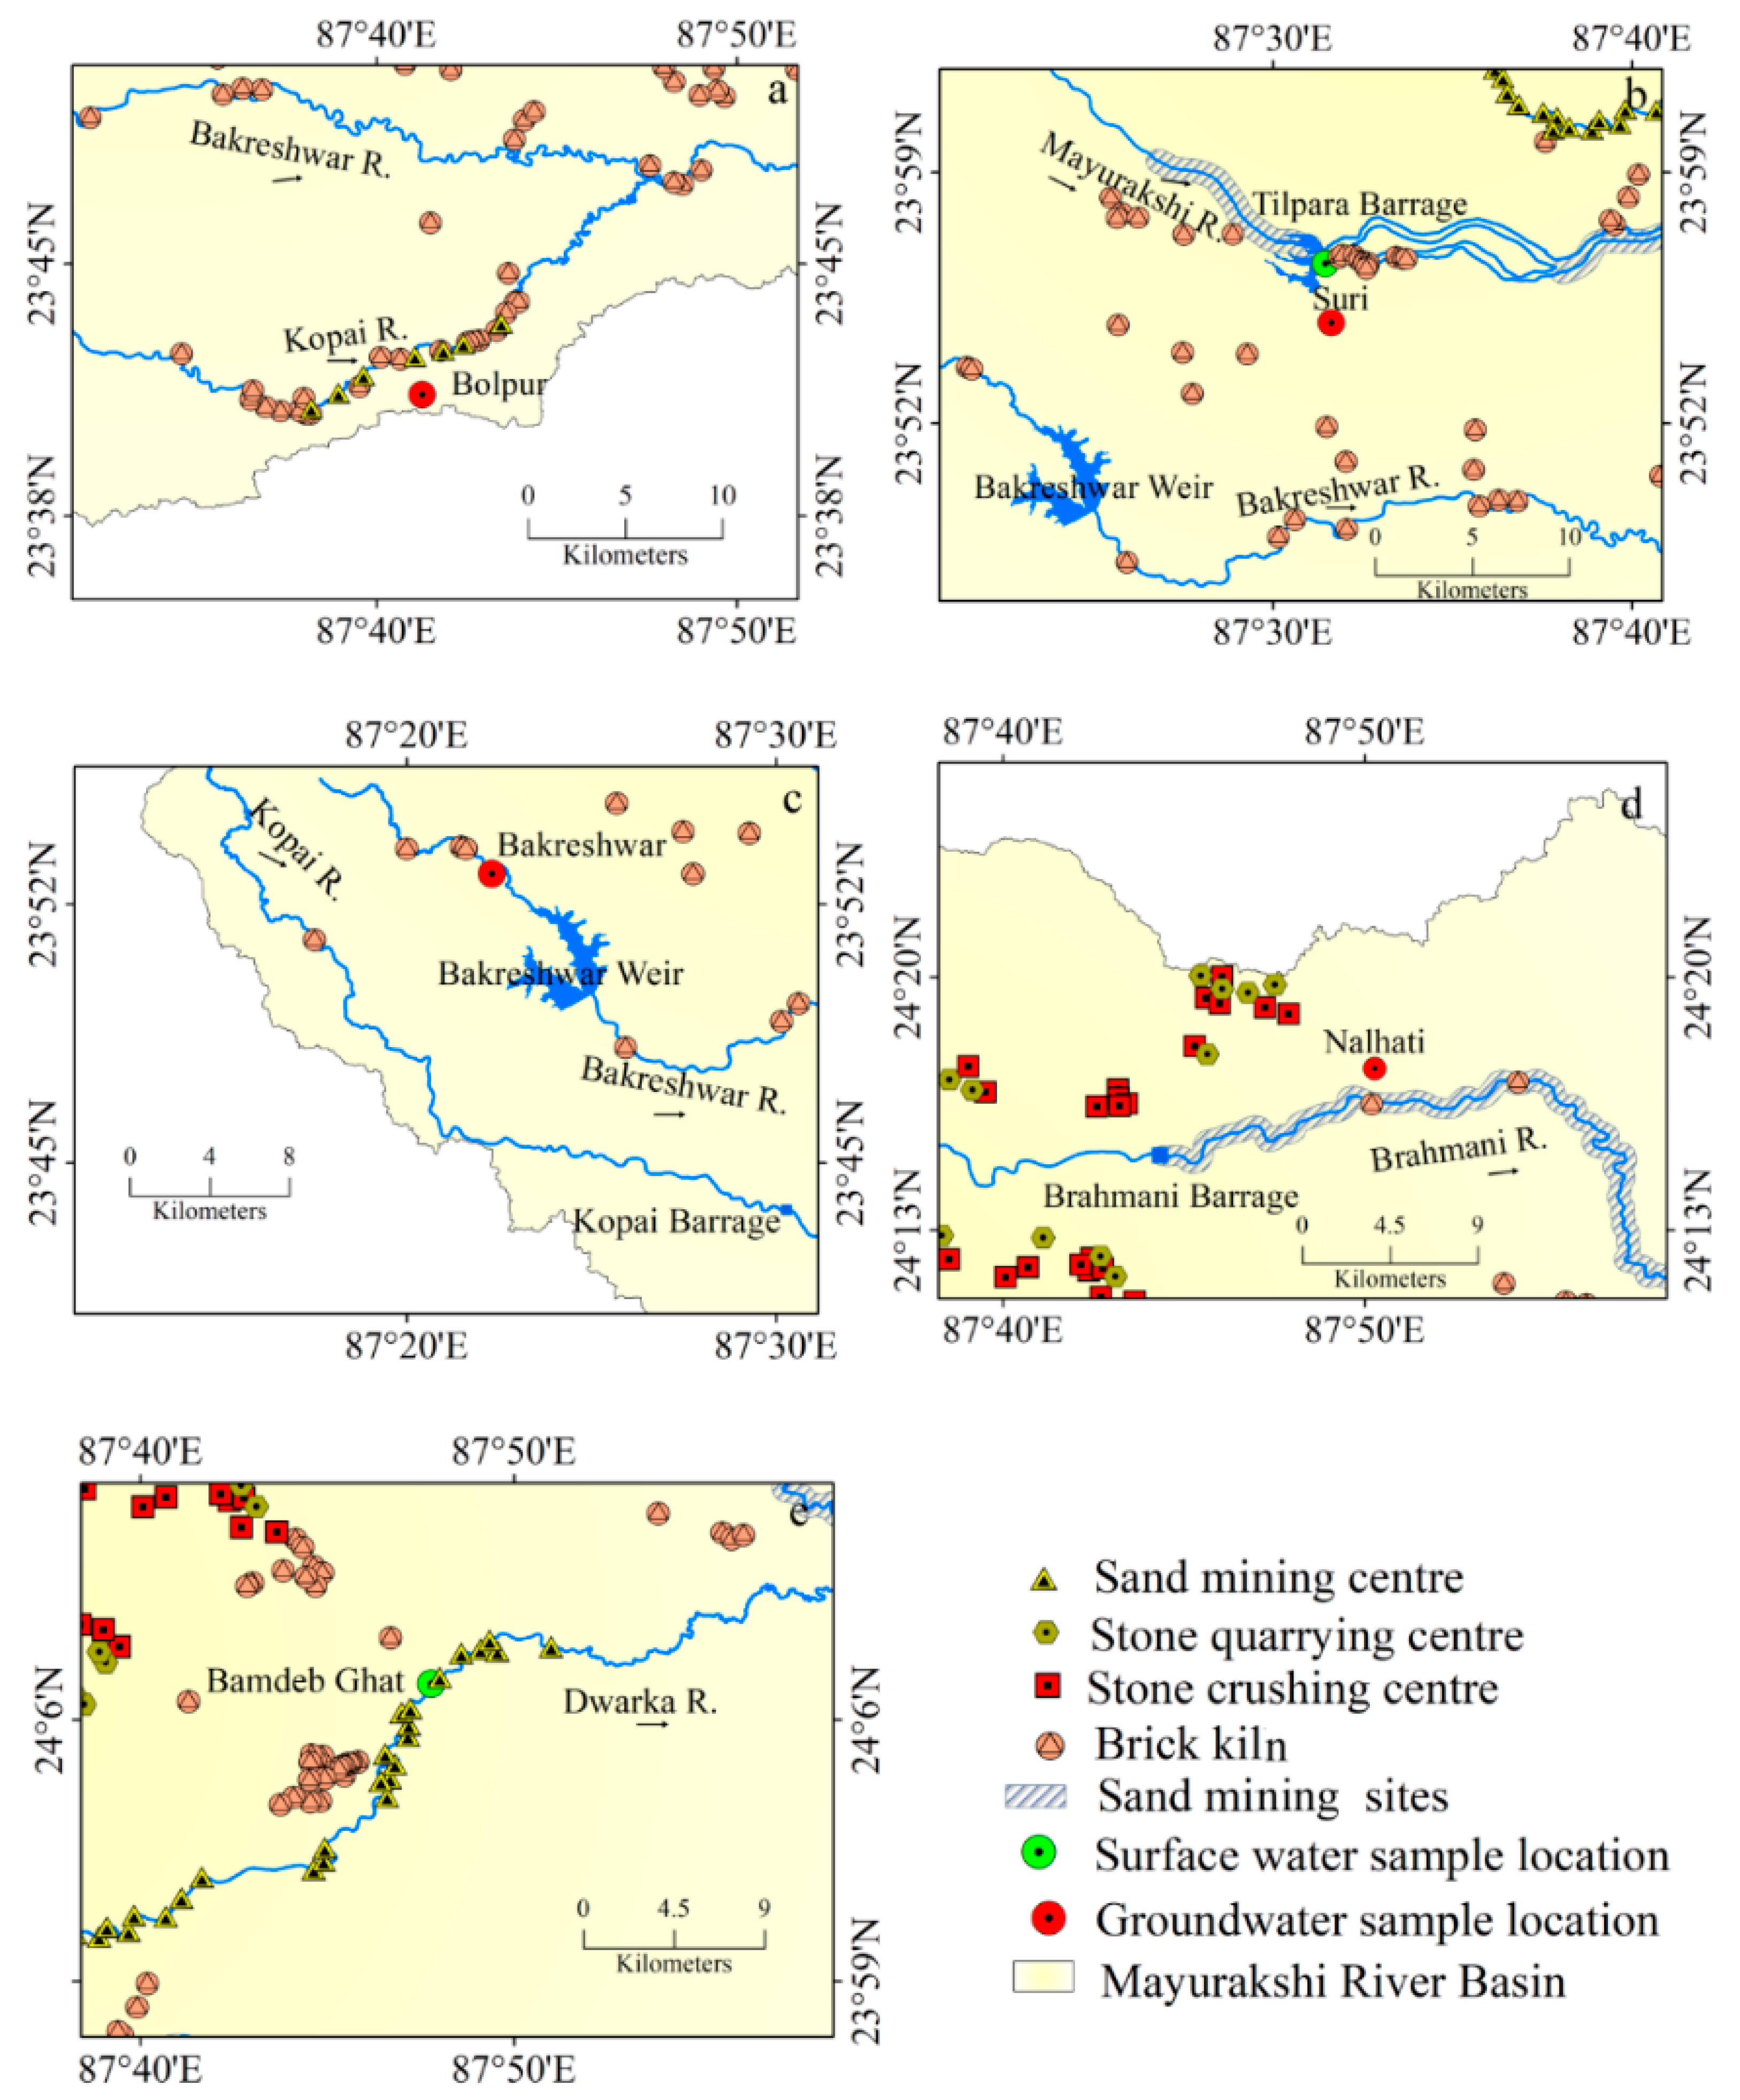
2.1. Study Area

The Mayurakshi and its two tributaries, the Dwarka to the north and the Kuea to the south, constitute the Mayurakshi river basin (MRB). The MRB covers an area of 9596 km2 and stretches from 23°37′43″ N to 24°37′36″ N and 86°50′16″ E to 88°15′52″ E (4260 km2 in Jharkhand and 5336 km2 in West Bengal). The Mayurakshi River originates from Trikut Hill, close to Deoghar, Jharkhand (24°29′53″ N, 86°50′12″ E), and flows for about 250 km before meeting the Bhagirathi River at Kalyanpur [31]. The study area chosen is the West Bengal portion of the lower Mayurakshi River basin (Figure 1).
The upper portion of the basin is composed of basaltic traps intermixed with coarse lateritic soil with sandy and sandy loam texture [32]. These soils are weakly aggregated with low water holding capacity. However, the middle portion is a part of the Rarh terrain, composed of a typical transported lateritic alluvium. The soil types of the lower MRB are clay loam, clay, and loam with high water holding capacity [33]. The deposition of Dharwanian sediments is observed at the upper part of MRB followed by Hercynian orogeny that occurred during the Cambrian to Silurian period. The vast portion of the upper part of the basin is characterized by granitic gneiss while the middle part of the MRB exhibits lateritic soil and hard clay. However, the lower part is characterized by the deposition of recent alluvium [33]. In the era of Anthropocene, the hydro-geomorphological characteristics of the rivers in the MRB are drastically altered by five dams and barrages (Brahmani barrages on Brahmani River, Deucha barrages on Dwarka River, Massanjore dam and Tilpara barrages on Mayurakshi River, and Bakreshwar weir on Kuea River). Moreover, the surface water quality of the basin is influenced by major anthropogenic interventions such as the effluents from a brick kiln, flying ashes from stone crushing centers, and chemicals from agricultural drainage, while the groundwater quality is influenced by major geological formations. In the lower MRB, agriculture is the dominant LULC, where the livelihood of ~90% of people depends upon agriculture [34]. Groundwater is the principal source of irrigation water in this region. However, during the monsoon season, when rivers get sufficient discharge from monsoonal rainfall, river lift irrigation is widely practiced for agriculture. Therefore, investigating the suitability of available water resources for irrigation in this region is inevitable for optimum crop production and sustainable agriculture.

2.2. Sample Design and Data Collection

The present study follows a systematic sampling design framed to portray the nature of surface water (river) and groundwater suitability for irrigation purposes in the lower MRB. Thus, two available monitoring stations for surface water (Suri on Mayurakshi River and Sadhak Bam Deb Ghat on Dwarka River) and four available monitoring stations (Bolpur, Bakreshwar, Nalhati, and Suri) for groundwater have been taken into consideration. The water quality data of the selected monitoring stations have been accessed from the West Bengal Pollution Control Board [35]. All the water quality data considered for the present study were sampled from 2017 to 2019, using a judgmental sampling technique to better reflect the hydrochemical parameters of water samples. The water samples were tested by the WBPCB. The pH of water samples was tested by pH meter. Moreover, the concentrations of cations in water samples were measured following the flame atomic absorption spectrometer (FAAS) method, while the spectrophotometric method was followed for measuring the concentration of anions. A total of 72 water samples were considered, of which 48 were surface water (pre-monsoon or pre-mon:24, post-monsoon or post-mon: 24) and 24 were groundwater samples (pre-mon:12, post-mon: 12). Samples were collected in both the pre-mon and post-mon seasons for detecting seasonal variations in irrigation water quality. For groundwater, April is considered as pre-mon and October as post-mon, while regarding surface water, February, March, April, and May are considered as pre-mon, and October, November, December, and January as post-mon, depending upon the availability of data (Table 1). In addition, Sentinel 2B tiles no. T45QWG and T45QXG (31 March 2019), Google Earth images from 2019 (9 January, 10 January, 28 March, 19 November 2019) and the 30 m Shuttle Radar Topographic Mission (SRTM) Digital Elevation Model (DEM) are also used in this study.

2.3. Methods of Data Analysis

2.3.1. Ion Balance Error and Reliability of the Data

The concentration of cations (positive ions) and anions (negative ions) must be equal according to the principle of electroneutrality [36], which is popularly known as ion balancing. Regarding the validation of surface water and groundwater, ion balancing is an important tool. For the calculation of the ion balance error (IBE), each ion concentration is measured in mEq/L. Following [36], IBE has been measured using Equation (1).
%   Ion   balance   error = c a t i o n s a n i o n s c a t i o n s + a n i o n s × 100
IBE within the limit of ±10% is considered as reliable data for hydrochemical assessment [1]. The average IBE in the present analysis is 9.4%, which is well within the reliable limit. However, out of the total samples considered for the present investigations, 86% (n = 62) samples are within the ±10% IBE. Only 14% of samples (n = 10), especially located around the hot spring area, exhibit the IBE beyond the ideal limit (Table S1). We considered these samples also because of the unavailability of other data in this region.

2.3.2. Measuring the Irrigation Hazards

The present study intends to assess the suitability of water for irrigation based on sodium hazard, salinity hazard, and magnesium hazard. The relative concentration of sodium with respect to other ions in irrigation water is measured for sodium hazard. The higher concentration of Na+ when placed in soil pore space brings about sodium hazard, leading to a lessening of the binding capacity of clay particles, swelling clay platelet, and soil dispersion, responsible for reduced soil permeability. The most commonly used indices for this hazard are Na%, sodium SAR, and SSP, which are expressed using Equations (2)–(4) (Table 2). In addition to the sodium hazard, the magnesium hazard signifies the relative concentration of Mg2+ to Ca2+, as expressed using Equation (5). Though Mg2+ is an essential plant nutrient, exceeding concentration alters the soil quality and affects the agricultural returns. Moreover, the salinity hazard is detected through the EC, TDS, Cl, and SO42− present in water and the USSL classification of water for agricultural use. In addition, the salinity hazard has been measured using the potential salinity (PS) index as mentioned in Equation (6).

2.3.3. Saturation Index

Different processes are responsible for groundwater, as well as surface water hydrochemistry, and rock–water interaction is one of them. Mineral weathering affects water hydrochemistry and with the help of saturation index (SI), rock weathering can be estimated [40]. The SI can be measured with the help of Equation (7).
SI = K I A P K S P
where KIAP stands for ions activity product for a mineral reaction and KSP implies the solubility product of that mineral. The PHREEQC software (v. 3.3.7) is very useful for calculating the SI of minerals in the water [41]. The SI value portrays the nature of water and mineral chemical equilibrium with water–rock interaction. SI < 0 suggests the unsaturated state where the minerals are continuously weathered by the groundwater or surface water; similarly, SI >0 states the supersaturated state when the minerals start to precipitate. Moreover, SI close to 0 indicates the equilibrium states of the mineral phase.

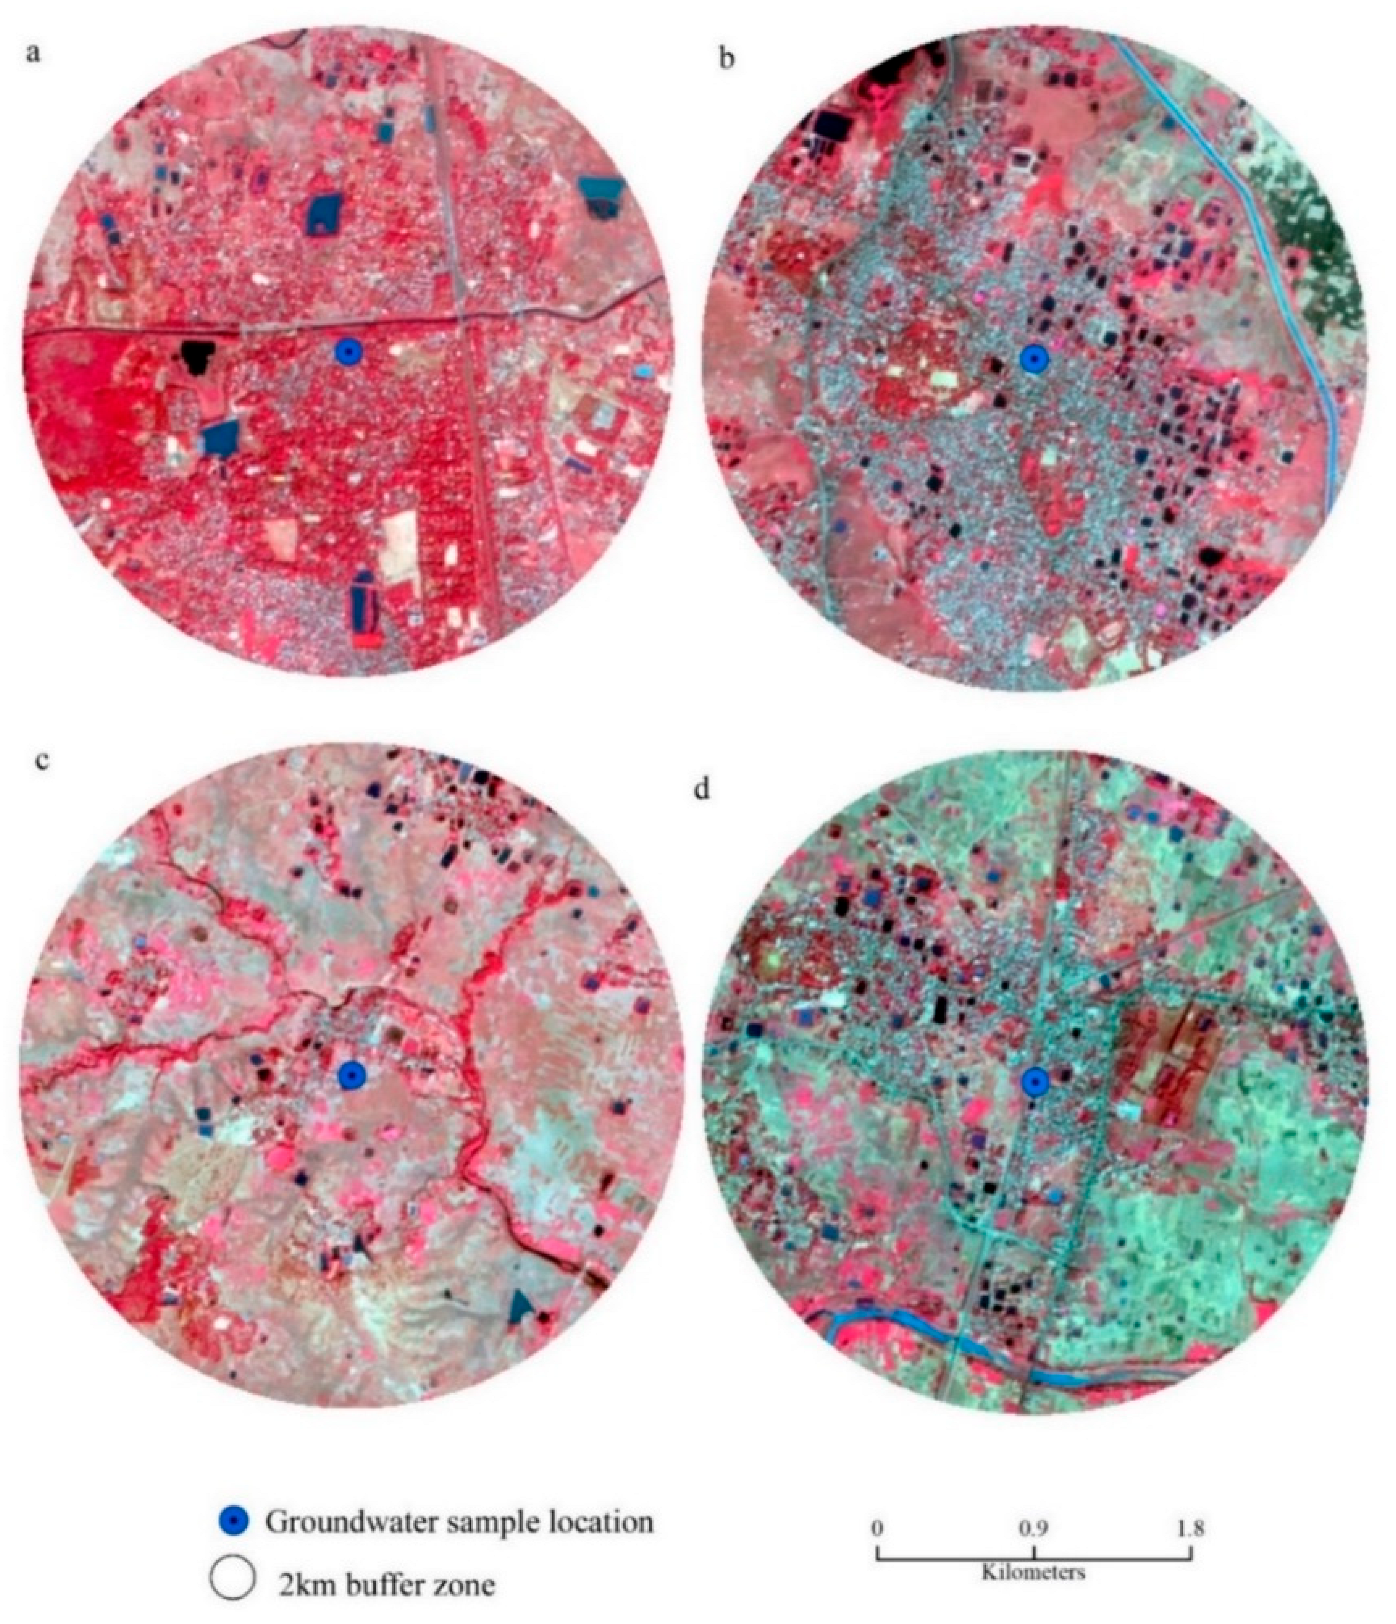
2.3.4. Processing of Geospatial Data

For assessing the role of land use and land cover (LULC) on the surface and groundwater, sentinel images were processed with the help of ArcGIS software (v. 10.4). After LULC maps were prepared, a 2 km buffer zone was demarcated around every groundwater station to illustrate the possible drivers controlling the hydrochemical characteristics of both the surface and groundwater.

2.3.5. Analysis of Variance (ANOVA)

The ANOVA is a test that indicates variations among and between the groups of distribution [42]. The “F statistic” is typically used to compare the difference between groups to the difference within each group [43]. A one-way ANOVA was used in the current investigation to identify any significant differences between the surface and groundwater parameters that might affect irrigation dangers. Equations (8)–(12) have been used to calculate it.
F = M S T M S E
M S T = S S T p 1
S S T = n x x ¯ ^ 2
M S E = S S E N p
  S S E = n 1 S ^ 2
where F denotes the ANOVA coefficient, MST is mean squares treatment, MSE is mean squares error, SST is the sum of squares due to treatment, p is the number of populations, n is the number of samples in a particular population, SSE is the sum of squares due to error, S is the standard deviation of samples, and N is the total samples.

3. Results

3.1. General Hydrochemistry

3.1.1. Temperature, pH and EC

The temperature recorded for both the groundwater and surface water samples are within the normal range (groundwater: about 24 °C during both pre and post-mon; surface water: 29 °C during pre-mon and 24 °C during post-mon). However, at Bakreshwar station it is excessively high (about 68 °C during pre-mon and 62 °C during post-mon) due to the presence of hot springs. The pH of surface water ranges from 7.45 to 7.96 during pre-mon and 7.45 to 7.88 in post-mon. Regarding groundwater, it ranges from 6.08 to 9.36 during pre-mon and 6.52 to 9 during post-mon. The pH of Bakreshwar is remarkably higher (8.95: pre-mon, 8.75: post-mon). Except for Bakreshwar, the average pH of groundwater is lower than the surface water (during pre-mon 7.19 for groundwater and 7.74 for surface water, while during post-mon it is 7.21 for groundwater and 7.63 for surface water. Electrical conductivity is measured to trace the level of salinity in both drinking and irrigation water. Regarding surface water, the mean values of EC for post and pre-mon are recorded as 213.57 µS/cm and 321.56 µS/cm, respectively (Table 3), while for groundwater the value of EC ranges between 1168 µS/cm (Nalhati) to 434 µS/cm (Bolpur) during post-mon and 1233 µS/cm (Nalhati) to 528 µS/cm (Bolpur) during pre-mon (Table S2). The value of kurtosis for both surface water and groundwater is less than 3 and it is leptokurtic.

3.1.2. Cation Chemistry

The major cations of surface and groundwater are Ca2+, Mg2+, Na+, and K+. The mean concentrations of Ca2+ in surface water for both the pre and post-mon seasons are very close to each other, i.e., 26.89 mg/L and 26.63 mg/L, respectively (Table 3). The concentration of Ca2+ ranges from 34.68 mg/L in Pre-mon and 36.38 mg/L in post-mon in Bamdeb Ghat to 19.09 mg/L in pre-mon and 16.89 mg/l in post-mon in Suri. In addition, for groundwater, the mean concentration of Ca2+ is 26.63 mg/L, ranging from 2.31 mg/L (Bakreshwar) during post-mon to 153.84 mg/L (Bolpur) during the same season. Therefore, the average calcium value suggests that, with the exception of the groundwater at Bolpur, the concentration of calcium is below the desired range (120 mg/L) for irrigation. The concentration of Na+ is higher in the groundwater than that in surface water. Regarding surface water Na+ ranges from 65 mg/L (Bamdeb Ghat in pre-mon) to 10 mg/L (Suri in post-mon). The Na+ concentration in groundwater is maximum for Bakreshwar, which ranges from 140.2 mg/L (pre-mon) to 108.26 mg/L (post-mon) (Table S2). The average sodium readings for the majority of the samples indicate that the sodium concentration is higher than the recommended level for irrigation (50 mg/L). The excess concentration of Na+ increases the soil hardness and the soil becomes impervious, which decreases the permeability [1]. The maximum concentration of Mg2+ regarding surface water is recorded as 19.44 mg/L in Bamdeb Ghat during pre-mon and the minimum in Suri (5.93 mg/L in pre-mon) (Table S2). For groundwater, it is found minimum in Bakreshwar (0.89 mg/L in post-mon to 11.52 mg/L in pre-mon) but the mean concentration of groundwater is 21.37 mg/L during post-mon and 22.53 mg/L during pre-mon. The concentration of K+ is less compared to the other cations. The K+ concentration is higher for surface water than groundwater. The mean concentrations of K+ in surface water are 4.18 mg/L and 5.61 mg/L during post- and pre-mon, respectively, while they are 4.48 mg/L and 2.9 mg/L for groundwater. Few samples exhibit magnesium and potassium concentrations that are greater than the levels that are advised for irrigation (Mg2+ < 24 mg/L and K+ < 10 mg/L).

3.1.3. Anion Chemistry

The major anions of surface and groundwater are Cl, SO42−, PO43−, and NO3, where Cl- is predominantly present for both the surface and groundwater. The statistical summary of all the anions has been presented in Table 3 and Table 4. The quality of irrigation water is divided into five categories based on the content of Cl: very good (0 to 142), good (143–249), usable (250–426), useful with caution (427–710), and dangerous (>710) [44]. About 67% of groundwater samples during pre-mon fall into the very good and 33% into the good categories, and all surface water samples during pre- and post-mon fall into the very good category. In addition, when it comes to post-mon, 59%, 33%, and 8%, respectively, fall into the very good, good, and usable categories. The average SO42− content in the surface water is 9.68 mg/L during the pre-mon and 14.52 mg/L during the post-mon. In addition, the SO42− concentration in groundwater varies from 3.73 mg/L in Bolpur in the post-mon to 84.86 mg/L in Suri in the pre-mon, with the mean concentration over the two seasons being 41.04 mg/L and 33.22 mg/L, respectively. (Table 4). All the samples of both the groundwater and surface water belong to very good conditions for the use of irrigation purposes. The mean concentration of PO43− regarding groundwater is 0.07 mg/L for post-mon and 0.03 mg/L for pre-mon, while for surface water it ranges from 0.04 mg/L to 0.07 mg/L for post-mon and 0.05 mg/L to 0.09 mg/L for pre-mon. The nitrate concentration is very much less for both the surface (0.07 mg/L to 0.27 mg/L) and groundwater (0.15 mg/L to 1.18 mg/L).

3.2. Irrigation Hazards

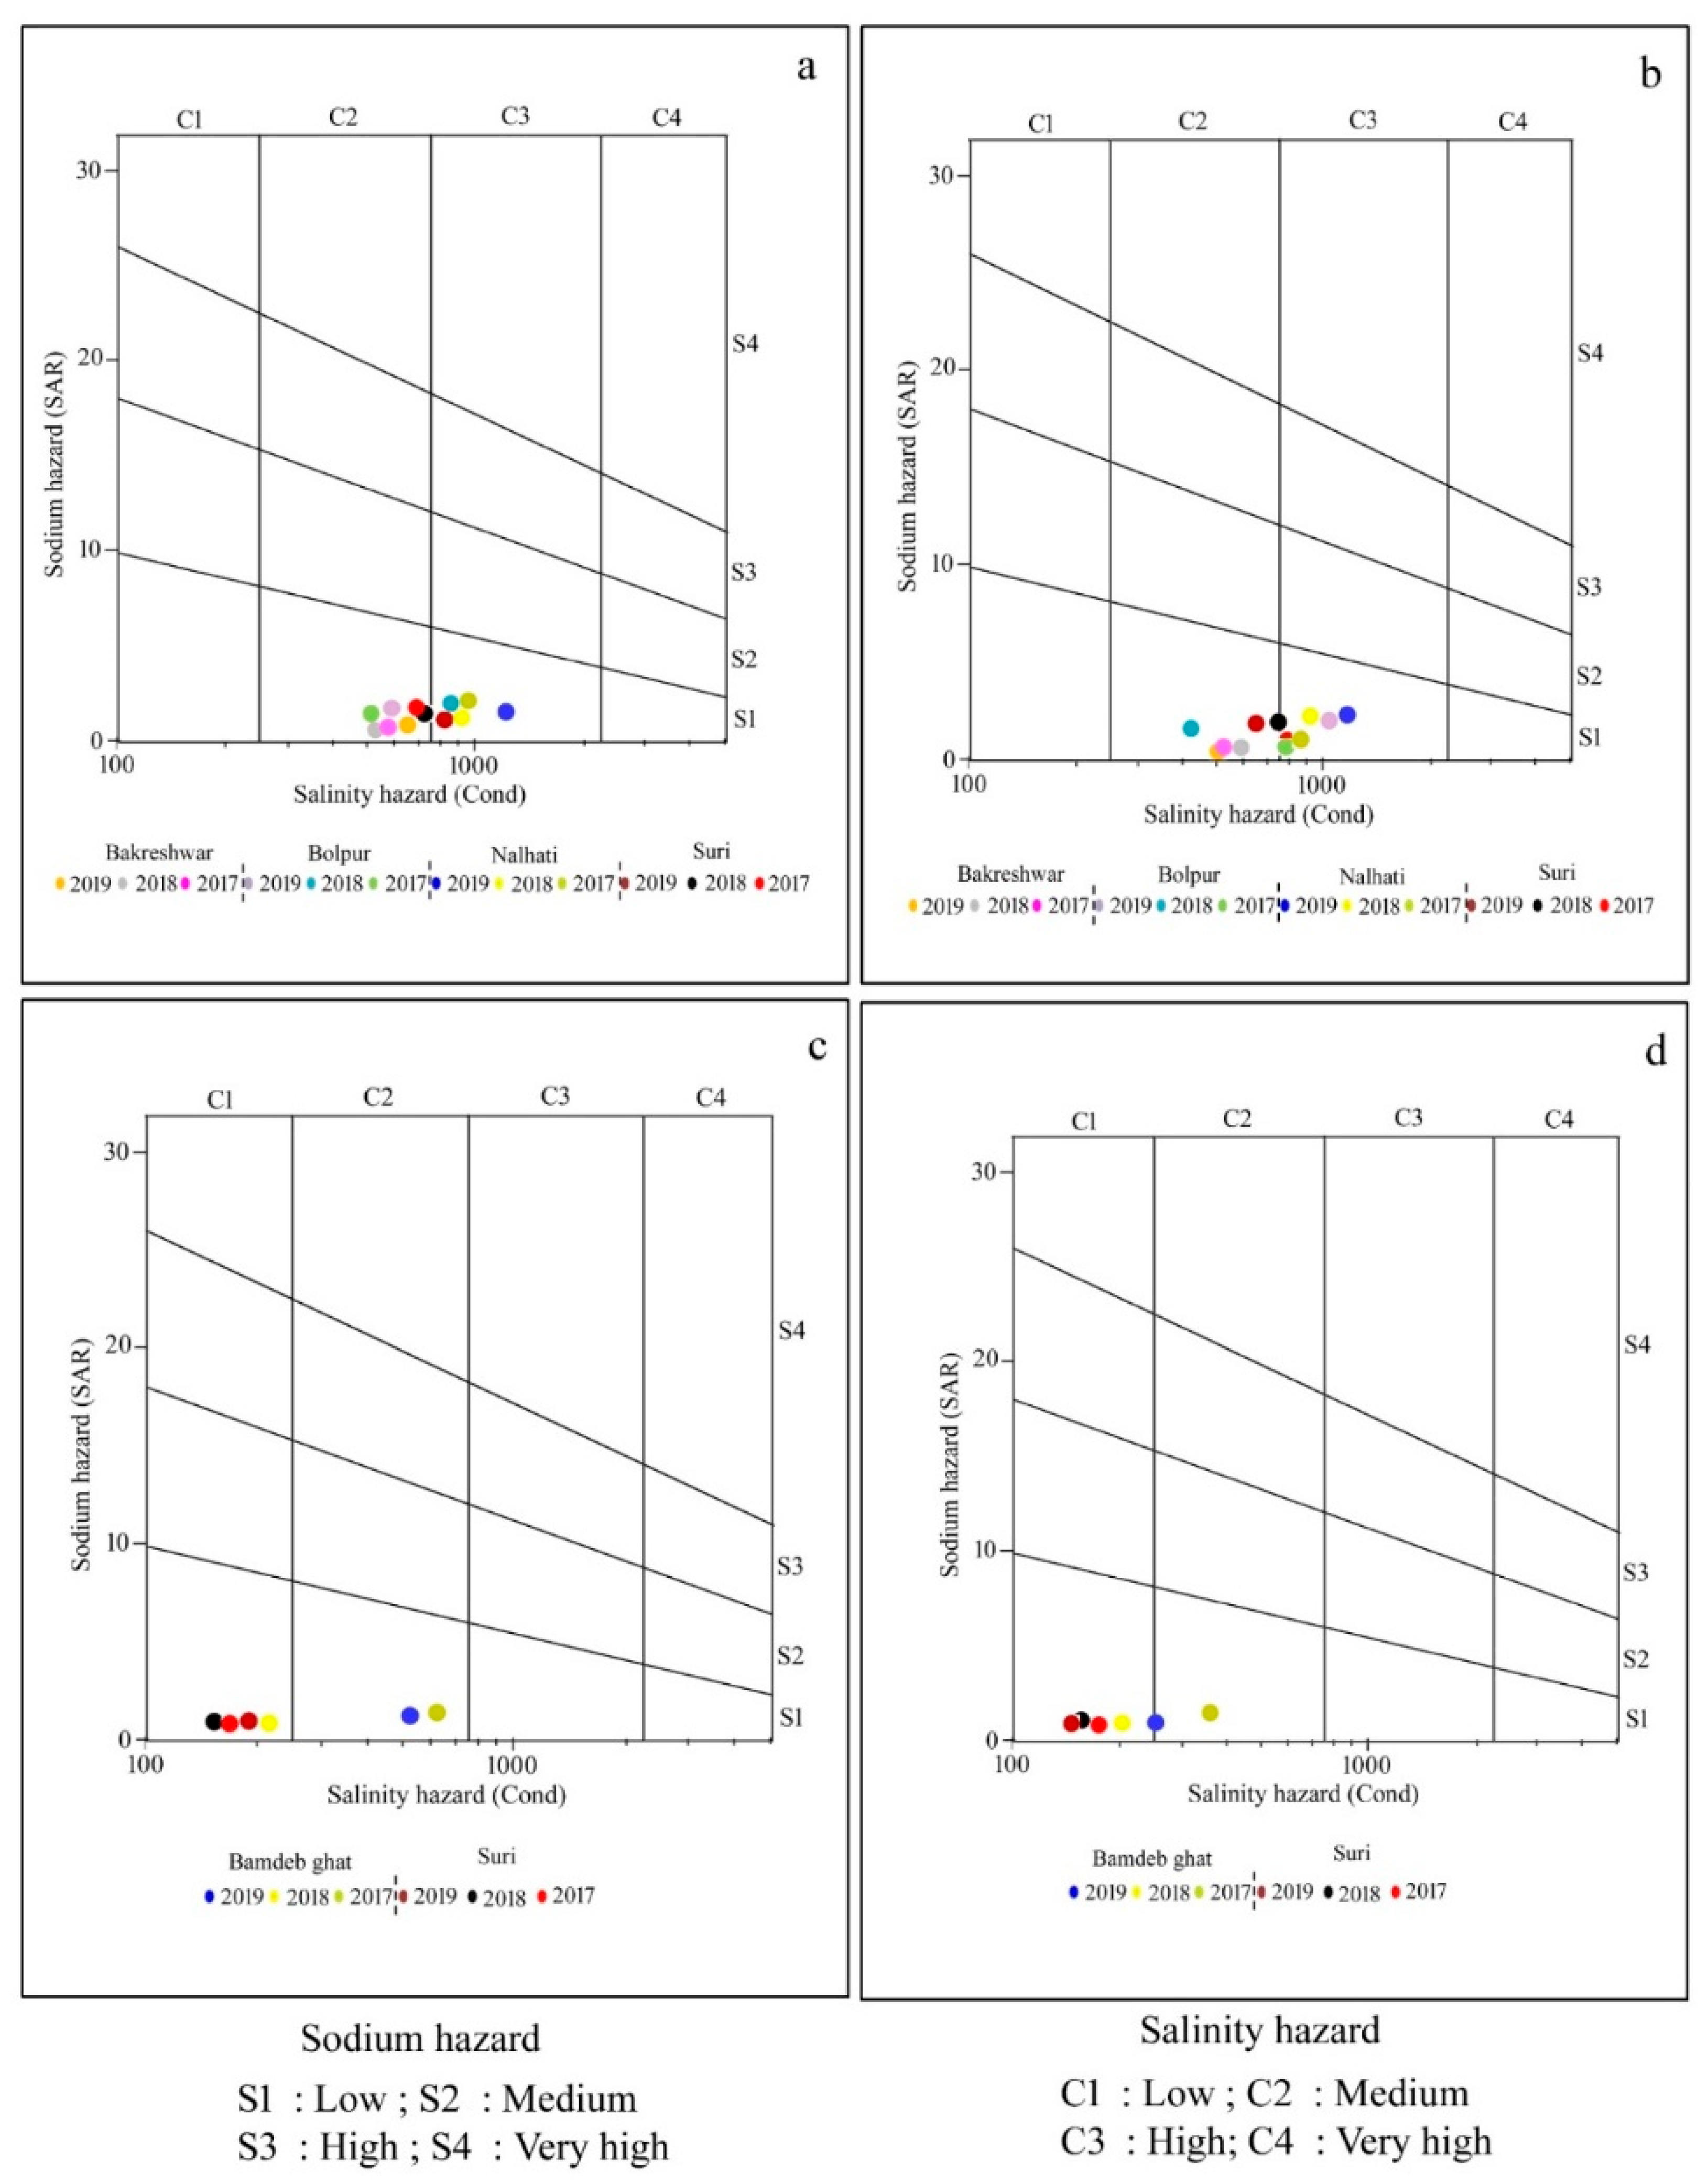
3.2.1. Sodium Hazard

The plant–soil system is badly affected by the elevated concentration of Na+ in irrigation water. The high concentration of Na+ reduces the rate of infiltration and the plant is deprived of a sufficient supply of water. In the case of clay-rich soil, the concentration of Na+ is more severe, i.e., for kaolinitic soil the problem is less but for montmorillonite soil it is severe. The sodicity hazard is measured with the help of % Na, SAR, and SSP.
  • Percent Sodium
The index value of %Na is divided into five categories, i.e., excellent (<20), good (20–40), permissible (40–60), doubtful (60–80), and unsuitable (>80) where 25% of the sample of groundwater during post-mon comes under unsuitable while 25% and 42% of the samples during pre-mon belong to the excellent and good category, respectively. During post-mon, the groundwater at Bakreshwar is doubtful to unsuitable but during pre-mon, it is under the permissible to doubtful category. In the Wilcox diagram, about 42% of the pre-mon groundwater samples belong to the excellent to the good category, 25% sample to permissible to doubtful category and 33% to good to permissible category (Figure 2a). In addition, 42% of the post-mon groundwater samples belong to goods to permissible post-mon, 25% sample to doubtful to unsuitable category and 25% to excellent to good category (Figure 2b; Table 5). Regarding surface water, all the samples during pre- and post-mon belong to the excellent to good category (Figure 2c,d).
  • Sodium adsorption ratio
In order to determine whether irrigation water is appropriate for use in agriculture, while taking into consideration EC as salinity and SAR as a sodicity hazard, USSL proposed a diagram. C1 (250), medium (250–750), high (750–2250), and extremely high (>2250) are the four categories based on the EC. The SAR values are further classified into four groups: S1 (<10) as low, S2 (10–18) as a medium, S3 (18–26) as high, and S4 (>26) as very high sodium hazard (Figure 3a–d).
The USSL diagram shows that 58.33% of the groundwater samples collected during the pre-mon period fall into the C2S1 category, which denotes medium salinity and low sodicity hazard and may be appropriate for irrigation if moderate leaching has taken place. In addition, 41.67% of samples fall into the C3S1 category, which denotes high salinity but low sodicity, while in the post-mon, 50% of samples fall into the C2S1 group and another 50% fall into the C3S1 category (Figure 3a,b). Regarding surface water, 67% of samples taken before and during the monsoon fell into the C1S1 category, indicating a risk from both low salinity and low sodicity (Figure 3c–d; Table 5).
  • Soluble sodium percentage
All surface water samples tested have SSP values that indicate they all are appropriate for irrigation. In addition, 75% of pre-mon groundwater samples fall into the category of being appropriate for irrigation, while the remaining samples fall into the unsuitable category.
Similar results have been found for the post-mon season, where 66.67% of the groundwater sample are appropriate for irrigation, while the remaining samples are not. In Bakreshwar, the SSP value is >88 during post-mon and >75 during pre-mon which indicates high sodium concentration with respect to magnesium and calcium concentration (Table 5 and Table S1).

3.2.2. Salinity Hazard

Salinity hazards can be determined with the help of the EC and TDS concentration in the surface and groundwater. The salinity of surface water ranges from low to medium while the groundwater has medium to high salinity (Table 6). Considering the EC of the surface water, ~66% of the post and pre-mon samples exhibit low salinity hazard, while the rest of the samples portray medium salinity hazards. Furthermore, 58% and 41% of the groundwater samples of post and pre-mon seasons, respectively, indicate a high salinity hazard while the rest of the samples represent a medium salinity hazard. Considering the TDS concentration of groundwater, a similar trend has been observed as retained for EC. Moreover, the TDS of surface water reveals that 66% of both the post and pre-mon samples belong to low salinity hazards while the rest of the samples come to the medium salinity hazard. Furthermore, the maximum EC of surface water is recorded for Bamdeb Ghat during pre-mon (639.7 µS/cm) while the minimum is recorded for Suri during post-mon (147.8 µS/cm). In addition, the highest saline groundwater is recorded for Nalhati (1233 µS/cm in pre-mon). The PS of surface water ranges from 0.27 (Suri in pre-mon) to 2.12 (Bamdeb Ghat in pre-mon). The maximum value of PS of groundwater is recorded for Nalhati (8.11) during post-mon and minimum in Bolpur (0.74) during post-mon. Therefore, the PS value reflects that the surface water is less saline than groundwater.

3.2.3. Magnesium Hazard

An excess amount of Mg2+ over Ca2+ decreases the quality of irrigation water. Irrigation with a high concentration of Mg2+ not only alters the chemical properties of soil making it more alkaline but also damages the soil structure. It also decreases crop yields. For the present study, 58% of the groundwater samples for both the pre-mon and post-mon seasons are suitable for agricultural use while the surface water of both seasons portrays that 83% of samples are suitable for irrigation. The MH values range from 2.94 (Bolpur in post-mon) to 55.36 (Nalhati in pre-mon).

3.3. Relative Suitability of Surface Water and Groundwater for Irrigation

ANOVA has been run on five hazard indices to assess whether there is a statistically significant difference or not in irrigation suitability between the samples of surface and groundwater. Considering 1 degree of freedom and 0.05 significance level, all the indices except the PS index portray no significant differences between surface and groundwater (p = 0.06 for SAR, p = 0.29 for %Na, p = 0.22 for SSP, p = 0.97 for MR, p = 0.0 for PS). Moreover, while looking at the locational differences among the six monitoring stations, the ANOVA at 5 degrees of freedom and 0.05 significance level portrays that the character of all the indices except MH statistically differ from one location to another (p = 0.48 for MH and p = 0 for other indices). Therefore, it could be argued that though every location portrays the irrigation water quality differently, there is no statistically significant difference between the surface and groundwater.

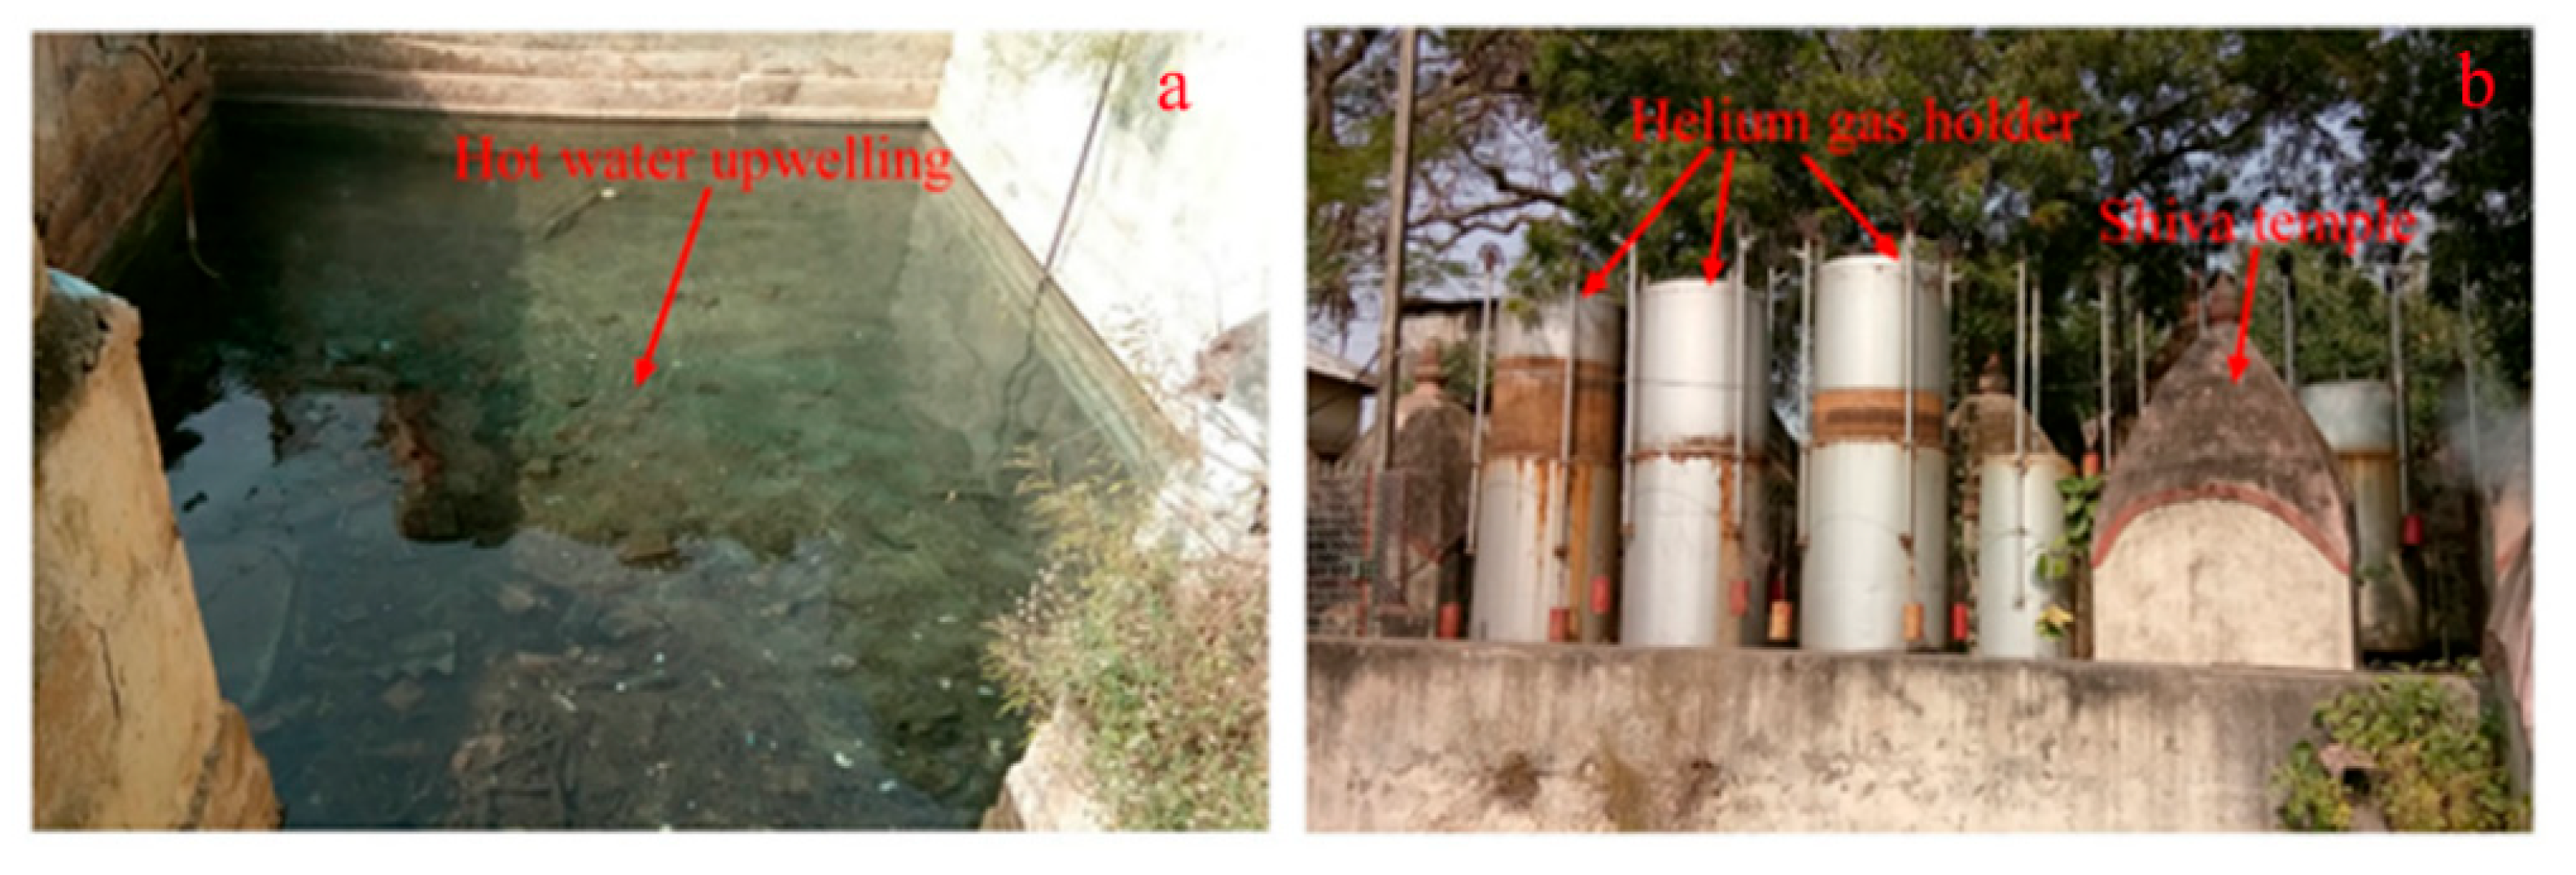
3.4. Spatio–Temporal Variation of Water Quality: Factors and Mechanisms

The surface and groundwater quality in the MRB exhibits the presence of significant spatial and seasonal variations. Furthermore, concerning the irrigation hazards, surface water is observed as relatively more suitable than groundwater. The variations and significant differences in irrigation water quality are triggered by both the physical processes and anthropogenic activities [43]. Therefore, this telltale pattern warrants a succinct analysis from the perspective of physical processes and anthropogenic factors influencing the evolution of surface and groundwater chemistry [22].
In order to comprehend the hydrochemical facies of a study region, Piper tri-linear diagrams [45] are widely used. The majority of samples are distributed in the diamond-shaped fields: 9, 5, and 7, showing a prevalence of mixed calcium bicarbonate and sodium chloride types (Figure 4). Additionally, regardless of where they were collected, many samples were of the HCO3 and Cl types, which implies that weathering of carbonate minerals is the primary factor affecting the chemistry of groundwater. Gypsum dissolution and evaporation are also significant processes for this type of groundwater. Regarding the left-hand triangle, the majority of the samples fall into zones B and D, indicating the presence of additional influencing factors. For instance, ion exchange and the dissolution of minerals containing sodium raise the concentration of Na+ in groundwater while lowering that of Ca2+ and Mg2+, changing the water’s chemical type from Ca2+ type to Na+ type and mixed type. Regarding the left-hand triangle, the majority of the samples fall into zones B and D, demonstrating that they are unaffected by gypsum’s dissolution and evaporation.
The eminent scholars have thoroughly investigated the geological setting and groundwater conditions in this region. According to [46], the stratigraphic successions in this region and surroundings are Archaean, Gondwana, Tertiary, and Recent (Table 7). Archaean rocks are present in the south-western portions of the region and its surroundings, while the northern and northwestern portions of the region and its surroundings are where the Rajmahal basaltic traps are exposed. Eastern and southern portions of the area are largely covered with older alluvium from the Upper Tertiary to Lower Quaternary. Older alluvium, with laterite and lateritic soil underneath, covers the majority of the uplands. In the region’s far east, there is recent alluvium made up of alternating layers of sand, silt, and clay of Upper Quaternary (Figure 5). Therefore, the fracture zone of the Rajmahal rocks, alluvium, and weathered debris all contain groundwater with different capacities. In the pre- and post-monsoon seasons, the piezometric surface ranges from 27.49 to 67.59 m and 27.82 to 71.71 m, respectively, with respect to mean sea level (MSL).
Therefore, the investigation of the physical processes, and rock–water interactions in this geo-hydrological setting is vital to understating the evolution of groundwater hydrochemistry [43,47]. In the present study, rock–water interaction has been examined in terms of molar ratio, saturation indices, and Gibbs plot. For understanding the rock–water interaction in the aquifer and the dominant weathering processes involved in the evolution of groundwater chemistry, many researchers have discussed the molar ratio of different ions (Figure 6a–d) [18,48]. In the molar ratio of Na+ and Cl, the value 1 indicates halite weathering while >1 represents the predominance of Na+ over Cl, indicating the presence of silicate weathering [43,49]. In the current investigation, it was discovered that 29% of the groundwater samples had Na+/Cl values greater than 1, proving that silicate weathering is to blame for raising the Na+ content in groundwater. The similar findings observed in this region by [43] had been explained by a mix of mechanisms, including silicate weathering, ion exchange, together with minor evaporation. Theoretically, the ratio of Ca2+ and HCO3 ions released into groundwater from calcite dissolution, ranges from 1:1 to 1:2, depending on the quantity of atmospheric CO2 present in the processes. The majority of the samples in the present investigation are plotted above the 1:1 line, as seen in Figure 6d, indicating a relative abundance of HCO3. The groundwater samples are all exhibited along the 1:1 line in Figure 6c, with some of them shifting to the left of the 1:1 line, indicating that the cation exchange has taken place but that calcite, dolomite, and gypsum dissolutions are still the main reactions occurring in the groundwater system. Moreover, the existence of carbonate weathering is indicated by the molar ratio of Ca2+ and SO42− being greater than 1 [9]. In the current investigation, the ratio of Ca2+ to SO42− in 83% of the groundwater samples is larger than 1, indicating the dissolution of carbonates like calcite (CaCO3) and dolomite (MgCa(CO3)2).
The values of the saturation index of every mineral truly represent the actual phenomena of rock–water interaction and their contribution to the evolution of groundwater hydrochemistry. All the values of SI of halite for groundwater are observed in the negative range, indicating that Na+ and Cl- are continuously dissolving into the water due to the influence of both the silicate and carbonate weathering (Table S3). Moreover, SI values of gypsum for groundwater portray the antagonistic scenario that, irrespective of all the seasons, only 30% of the samples record SI < 0, indicating the dissolution of gypsum into groundwater. The dissolution of gypsum into groundwater is the result of the reaction of CaSO4·2H2O = Ca2+ + SO42− + 2H2O, which adds calcium and sulphate to water [30]. Furthermore, ~70 of the ground samples representing the precipitation of gypsum. Regarding anhydrite, 55% of the groundwater samples represent the dissolution status (SI < 0). The study [50] estimated the calcium flux rate from anhydrite dissolution. The positive correlations of TDS with SI of sylvite (r2 = 0.7442 for pre-mon surface water; 0.1565 post-mon surface water; 0.1464 for Pre-mon groundwater; 0.1368 post-mon groundwater) gypsum (r2 = 0.5477 for pre-mon surface water; 0.1258 post-mon surface water; 0.2495 for pre-mon groundwater; 0.4999 post-mon groundwater), and anhydrite (r2 = 0.5436 for pre-mon surface water; 0.1314 post-mon surface water; 0.2468 for pre-mon groundwater; 0.5364 post-mon groundwater) (Figure 7a–c and Figure 8a,b). Moreover, the Gibbs plots of anion suggest that the groundwater in this area is significantly controlled by the rock–water interaction (Figure 7d). The LULC also has strong relationships with surface and groundwater quality. In the study, Bolpur, Suri, Nalhati, and Bakreshwar have different LULCs, such as hot springs and helium extraction, and urban, industrial, and agricultural areas which affect the groundwater quality in various ways (Figure 9a–d).
The physicochemical characteristics of the Bakreshwar groundwater differ remarkably from other groundwater stations. A very high average concentration of Na+ (112 mg/L), pH (8.85), has been noticed, while the concentration of Mg2+ (3.5 mg/L) is very much less (Table S2). The average temperature of Bakreshwar groundwater was recorded (65 °C) while it is about 25 °C for other stations. This may be because of the presence of hot springs. This place covers seven hot springs (Agnikund, Ksharkund, Bhairabkund, Baitarinikund, Saubhagyakund, Suryakund, Brahmakund). The helium extracted from the main spring Agni Kund also has a potential impact on irrigation water quality (Figure 10a,b) [51].
The groundwater at Nalhati portrays a high concentration of Cl with a high salinity hazard. The mining of sand, stone quarrying, and crushing in MRB (Figure 9d and Figure 11a–e) induce the mixing of silicate minerals in the groundwater aquifers, which is supposed to be the important factor controlling the magnitude of silicate weathering.
Regarding surface water, Suri is more suitable than Sadhak Bamdeb Ghat station for irrigation purposes. The stretches of Dwarka River between Tarapith and Sadhak Bamdeb Ghat (~1.5 km) are identified as a polluted stretch by the River Rejuvenation Committee of West Bengal [52]. The discharge of effluents from industrial and domestic wastewater into the river has made the surface unsuitable for irrigation.

4. Discussion

Succinctly, the current study showed that groundwater is more vulnerable to salinity and sodicity risk than surface water. This makes the water unsuitable for agriculture, as excessive sodium concentration may lead to decreasing permeability of irrigation water for agriculture and soil [43]. According to the U.S. Salinity Laboratory Staff’s assessment of irrigation, for instance, 41.67% of groundwater samples have significant salinity concerns, compared to 33% for surface water. The study findings are also supported by Sarkar and Islam’s research, which focused on the Ganga Delta region’s West Bengal region (the neighbouring region of the present study). They stated that 15% of the groundwater samples had a high salinity risk. Additionally, a general pattern of the salinity intensity threat gradually migrating towards the coastline region (Bay of Bengal) has been noticed in another research study. As an illustration, ref. [43] discovered that high salinity was a problem in about 51% of the groundwater samples. The same issues are reported throughout the rest of the world and in other parts of India. For instance, ref. [53] found that the problem of high salinity was present in around 30% of the groundwater samples in Delhi’s rural districts. A similar observation had also been reported in many other parts of India, for example, refs. [44,54,55] in Tamil Nadu all made similar observations and reported them. According to a study by [56], the majority of groundwater in South Eastern Tunisia cannot be used for irrigation due to its high salt concentration, unless specific salinity management measures are taken. Additionally, the same issues were reported by [57] in Iran, ref. [58] in China, and [11] in Northern Iraq.
The nature of water quality and the evolution of groundwater hydrochemistry are principally governed by geogenic processes and anthropogenic processes. The carbonate weathering in the study area is attributed to the geogenic process. The research of [59] revealed that the presence of Cratonic sediment from the Chotanagpur plateau is responsible for carbonate weathering. Soluble rocks, e.g., dolostone, limestone, gypsum, and anhydrite are dissolved by water and alter the hydrochemical properties of groundwater [50]. The saturation indices indicate the continuous dissolution of halite, gypsum, and anhydrite and thereby influencing the concentration of cations and anions in groundwater [40,60]. These findings are consistent with our present study findings. Apart from the geogenic process, the anthropogenic interventions in the form of the LULC dynamics greatly alter the hydrochemistry and water quality for irrigation. For example, ref. [61] showed that urban land agricultural land, and industrial land negatively affect the groundwater while forest cover positively affects the groundwater quality. The studies [62,63] observed significant differences in the physicochemical properties between the thermal spring water and the groundwater. Moreover, groundwater hydrochemistry is also greatly controlled by the presence of the hot springs. In the present study, we found that the water sample surrounding the Bakreshwar hot spring exhibits an elevated concentration of Na+, pH, and a lesser concentration of Mg+. Our study findings are supported by [63,64,65]. Furthermore, it is also observed that the surrounding areas of hot springs are not used for agricultural practice, as is also found in the present case.
The higher salt concentration may be due to extreme anthropogenic activities such as extensive sand mining [66]. Stone quarrying and crushing, and also brick kiln industries are also prevalent in the study area. A similar phenomenon has also been reported by the work of [67], which observed the concentration of sodium, chloride, and sulphate near the sand and gravel pits in the United States of America (USA). Moreover, the brick kiln industries in this region have significantly affected the quality of the groundwater for irrigation through the leaching of pollutants into the groundwater reservoir [68]. The few groundwater samples of the post-mon season are observed as unsuitable for irrigation, which indicates the effect of monsoonal rainfall on the mixing of anthropogenic pollutants with the groundwater through the leaching process during post-mon [69]. The location of sand mining centers near Bamdeb Ghat increases the salt concentration in the river water. The significant difference in river discharge between the pre-mon and post-mon seasons river is also a responsible factor inducing the seasonal variation of irrigation water quality of the surface water.
The present study, addressing the surface and groundwater quality for irrigation and their seasonal and spatio-temporal variation in the MRB, is a pioneering effort. Therefore, this study has brought about an acquaintance with both the surface and groundwater resources of MRB from the perspective of agricultural use. Moreover, the study also provides a detailed account of the governing process of groundwater hydrochemistry. The study has also focused on the influence of anthropogenic activities (stone crushing, stone quarrying, sand mining, and brick kiln) on irrigation water. Therefore, the analytical contents of the study would help the regional planners to introduce an effective and integrated plan for the management and conservation of surface and groundwater.

5. Conclusions

Based on detailed observations of hydrogeochemical characteristics, the surface and groundwater in the study area depict that the majority of the water samples are suitable for irrigation in agriculture. However, the groundwater has been observed less suitable for irrigation compared to the surface water. Though anthropogenic activities have also been detected (such as extensive sand mining, stone quarrying, and crushing and brick kiln industries) for influencing the quality of the surface and groundwater, the geological formation (rock–water interaction) is found to play a vital role to control the groundwater hydrochemistry.
The index-based outcomes of the irrigation water quality of the study area have become useful for decision-making processes. For example, groundwater in the MRB is relatively unsuitable due to higher salt concentration and, therefore, it is suggested that a few measures are essential to reduce the level of salinity before use. The study also helps select crops based on the nature of irrigation water quality. Stone crushing, stone quarrying, sand mining, and brick kilns affect the irrigation water extensively. Therefore, the local government and decision-makers may effectively regulate human activities regarding the types of fuels used in the brick kiln or the heavy metals mixing with river water or groundwater through the recharge of the shallow aquifer. In addition, the study helps to develop an awareness in the local government about the nature and extent of anthropogenic water pollution and take actions to reduce the level of water pollution, minimize the risk of crop production, and achieve bumper and sustainable agricultural return for the long term. The controlled anthropogenic interventions may reduce surface and groundwater contamination in the future to sustain agricultural production.

Supplementary Materials

The following supporting information can be downloaded at: https://www.mdpi.com/article/10.3390/geosciences12110415/s1, Table S1: Spatial and temporal variation of irrigation hazards, Table S2: Spatial and temporal variation of EC, Mg and Na, Table S3: Spatial and temporal variation of saturation indices of different minerals.

Author Contributions

Conceptualization, S.G. and A.I.; methodology, S.G., B.S., A.I. and H.A.R.G.; writing original manuscript, S.G., B.S. and A.I.; software, S.G., A.I. and H.A.R.G.; formal analysis, S.G. and B.S.; writing—review and editing, A.I., A.Q.-R. and P.K.S.; supervision, A.I. All authors have read and agreed to the published version of the manuscript.

Funding

The first author received financial support for this study from the University Grants Commission, Government of India (UGC ref. no. 3469/(NET-DEC. 2018) awarded to the first author to complete her PhD research work.

Data Availability Statement

The datasets used and/or analyzed during the current study are available from the corresponding author on reasonable request.

Acknowledgments

The authors acknowledge the West Bengal Water Pollution Control Board (WBPCB), which provides information on water quality available for free public use. For his help with the fieldwork, the authors are especially grateful to Arnab Sen, a former student of Visva-Bharati, Shantiniketan.

Conflicts of Interest

The authors declare no conflict of interest.

References

  1. Sarkar, B.; Islam, A. Assessing the suitability of water for irrigation using major physical parameters and ion chemistry: A study of the Churni River, India. Arab. J. Geosci. 2019, 12, 637. [Google Scholar] [CrossRef]
  2. Ayers, R.S.; Westcot, D.W. Water Quality for Agriculture; Food and Agriculture Organization of the United Nations: Rome, Italy, 1985; Volume 29. [Google Scholar]
  3. Yidana, S.M.; Banoeng-Yakubo, B.; Akabzaa, T.M. Analysis of groundwater quality using multivariate and spatial analyses in the Keta basin, Ghana. J. Afr. Earth Sci. 2010, 58, 220–234. [Google Scholar] [CrossRef]
  4. Sarkar, B.; Islam, A.; Majumder, A. Seawater intrusion into groundwater and its impact on irrigation and agriculture: Evidence from the coastal region of West Bengal, India. Reg. Stud. Mar. Sci. 2021, 44, 101751. [Google Scholar] [CrossRef]
  5. Jeong, H.; Kim, H.; Jang, T. Irrigation water quality standards for indirect wastewater reuse in agriculture: A contribution toward sustainable wastewater reuse in South Korea. Water 2016, 8, 169. [Google Scholar] [CrossRef] [Green Version]
  6. Simsek, C.; Gunduz, O. IWQ index: A GIS-integrated technique to assess irrigation water quality. Eniron. Monit. Assess. 2007, 128, 277–300. [Google Scholar] [CrossRef]
  7. Ravikumar, P.; Somashekar, R.K.; Angami, M. Hydrochemistry and evaluation of groundwater suitability for irrigation and drinking purposes in the Markandeya River basin, Belgaum District, Karnataka State, India. Eniron. Monit. Assess. 2011, 173, 459–487. [Google Scholar] [CrossRef]
  8. Wilcox, L. Classification and Use of Irrigation Waters (Circular No. 969); United States Department of Agriculture: Washington, DC, USA, 1955. Available online: https://ia803201.us.archive.org/10/items/classificationus969wilc/classificationus969wilc.pdf (accessed on 9 May 2020).
  9. Li, P.; Zhang, Y.; Yang, N.; Jing, L.; Yu, P. Major ion chemistry and quality assessment of groundwater in and around a mountainous tourist town of China. Expo. Health 2016, 8, 239–252. [Google Scholar] [CrossRef]
  10. Li, P.; He, S.; He, X.; Tian, R. Seasonal hydrochemical characterization and groundwater quality delineation based on matter element extension analysis in a paper wastewater irrigation area, northwest China. Expo. Health 2018, 10, 241–258. [Google Scholar] [CrossRef]
  11. Jassas, H.; Merkel, B. Assessment of hydrochemical evolution of groundwater and its suitability for drinking and irrigation purposes in Al-Khazir Gomal Basin, Northern Iraq. Environ. Earth Sci. 2015, 74, 6647–6663. [Google Scholar] [CrossRef]
  12. Ghazaryan, K.; Chen, Y. Hydrochemical assessment of surface water for irrigation purposes and its influence on soil salinity in Tikanlik oasis, China. Environ. Earth Sci. 2016, 75, 383. [Google Scholar] [CrossRef]
  13. Annual Report 2020–2021. In Directorate of Economics and Statistics; Department of Agriculture, Cooperation and Farmers Welfare, Government of India: Kolkata, India, 2018.
  14. Khan, H.H.; Khan, A.; Ahmed, S.; Perrin, J. GIS-based impact assessment of land-use changes on groundwater quality: Study from a rapidly urbanizing region of South India. Environ. Earth Sci. 2011, 63, 1289–1302. [Google Scholar] [CrossRef]
  15. Majumdar, D.; Gupta, N. Nitrate pollution of groundwater and associated human health disorders. Indian J. Environ. Health 2000, 42, 28–39. [Google Scholar]
  16. Shi, X.; Wang, Y.; Jiao, J.J.; Zhong, J.; Wen, H.; Dong, R. Assessing major factors affecting shallow groundwater geochemical evolution in a highly urbanized coastal area of Shenzhen City, China. J. Geochem. Explor. 2018, 184, 17–27. [Google Scholar] [CrossRef]
  17. Sunitha, V.; Sudarshan, V.; Reddy, B.R. Hydrogeochemistry of groundwater, Gooty area, Anantapur district, Andhra Pradesh, India. Pollut. Res. 2005, 24, 217. [Google Scholar]
  18. Wang, P.; Yu, J.; Zhang, Y.; Liu, C. Groundwater recharge and hydrogeochemical evolution in the Ejina Basin, northwest China. J. Hydrol. 2013, 476, 72–86. [Google Scholar] [CrossRef]
  19. Disli, E. Hydrochemical characteristics of surface and groundwater and suitability for drinking and agricultural use in the Upper Tigris River Basin, Diyarbakır–Batman, Turkey. Environ. Earth Sci. 2017, 76, 500. [Google Scholar] [CrossRef]
  20. Fulazzaky, M.A. Water quality evaluation system to assess the status and the suitability of the Citarum river water to different uses. Environ. Monit. Assess. 2010, 168, 669–684. [Google Scholar] [CrossRef]
  21. Rasouli, F.; Pouya, A.K.; Cheraghi, S.A.M. Hydrogeochemistry and water quality assessment of the Kor–Sivand Basin, Fars province, Iran. Environ. Monit. Assess. 2012, 184, 4861–4877. [Google Scholar] [CrossRef]
  22. Sarkar, B.; Islam, A. Assessing the suitability of groundwater for irrigation in the light of natural forcing and anthropogenic influx: A study in the Gangetic West Bengal, India. Environ. Earth Sci. 2021, 80, 807. [Google Scholar] [CrossRef]
  23. Kumar, S.K.; Rammohan, V.; Sahayam, J.D.; Jeevanandam, M. Assessment of groundwater quality and hydrogeochemistry of Manimuktha River basin, Tamil Nadu, India. Environ. Monit. Assess. 2009, 159, 341–351. [Google Scholar] [CrossRef]
  24. Jeevanandam, M.; Kannan, R.; Srinivasalu, S.; Rammohan, V. Hydrogeochemistry and groundwater quality assessment of lower part of the Ponnaiyar River Basin, Cuddalore district, South India. Environ. Monit. Assess. 2007, 132, 263–274. [Google Scholar] [CrossRef]
  25. Hoque, M.; Islam, A.; Sarkar, B.; Saha, U. Assessing the surface and bottom river water quality for irrigation: A study of Damodar River, India. Int. J. Energy Water Resour. 2022, 1–18. [Google Scholar] [CrossRef]
  26. DPR for Improvement of Embankments and Ancillary Works in Kandiandother Adjoining Areas of District of Murshidabad; Kandi Final Report; Irrigation and Waterways Directorate, Govt. of West Bengal: Kolkata, India, 2012.
  27. Beltrán, J.M. Irrigation with saline water: Benefits and environmental impact. Agric. Water Manag. 1999, 40, 183–194. [Google Scholar] [CrossRef]
  28. Sikdar, P.K.; Dey, S.; Ghosal, U.; Chakraborty, S. Development and Management of Base Flow of a Sand-dominated Alluvial Aquifer of a Large Ephemeral River for Drinking Water Supply in Semi-arid and Fluoride Affected Areas: Example of the River Mayurakshi, Birbhum District, West Bengal, India. J. Geol. Soc. India 2019, 94, 249–259. [Google Scholar] [CrossRef]
  29. Das, D.; Samanta, G.; Mandal, B.K.; Chowdhury, T.R.; Chanda, C.R.; Chowdhury, P.P.; Basu, G.K.; Chakraborti, D. Arsenic in groundwater in six districts of West Bengal, India. Environ. Geochem. Health 1996, 18, 5–15. [Google Scholar] [CrossRef]
  30. Pal, S.; Mahato, S.; Giri, B.; Pandey, D.N.; Joshi, P.K. Quantifying monthly water balance to estimate water deficit in Mayurakshi River basin of Eastern India. Environ. Dev. Sustain. 2021, 23, 15986–16014. [Google Scholar] [CrossRef]
  31. Islam, A.; Deb Barman, S. Drainage basin morphometry and evaluating its role on flood-inducing capacity of tributary basins of Mayurakshi River, India. SN Appl. Sci. 2020, 2, 1087. [Google Scholar] [CrossRef]
  32. Islam, A.; Deb Barman, S.; Islam, M.; Ghosh, S. Role of Human Interventions in the Evolution of Forms and Processes in the Mayurakshi. In Anthropogeomorphology of Bhagirathi-Hooghly River System in India, 1st ed.; Das, B.C., Ghosh, S., Eds.; CRC Press: Boca Raton, FL, USA; London, UK; New York, NY, USA, 2020; Volume 1, pp. 135–188. [Google Scholar]
  33. Chakrabarti, B. A Geomorphological Analysis of the Mayurakshi River Basin. Ph.D. Thesis, The University of Burdwan, Bardhaman, India, 9 May 1985. [Google Scholar]
  34. Islam, A.; Ghosh, S. Economic transformation in the wake of flood: A case of the lower stretch of the Mayurakshi River Basin, India. Environ. Dev. Sustain. 2021, 23, 15550–15590. [Google Scholar] [CrossRef]
  35. WBPCB. Water Quality Information System. Department of Environment. Government of West Bengal. 2020. Available online: http://emis.wbpcb.gov.in/waterquality/showwqprevdatachoosedist.do (accessed on 28 May 2020).
  36. Nag, S.K.; Das, S. Quality assessment of groundwater with special emphasis on irrigation and domestic suitability in Suri I & II blocks, Birbhum district, West Bengal, India. India Am. J. Water Resour. 2014, 2, 81–98. [Google Scholar]
  37. Richards, L.A. Diagnosis and Improvement of Saline and Alkaline Soils; United States Salinity Laboratory Staff, United States Department of Agriculture: Washington, DC, USA, 1954. Available online: https://www.ars.usda.gov/ARSUserFiles/20360500/hb60_pdf/hb60complete.pdf (accessed on 12 June 2020).
  38. Todd, D.K. Groundwater Hydrology, 3rd ed.; John Wiley & Sons: Hoboken, NJ, USA, 1959; p. 535. [Google Scholar]
  39. Szabolcs, I. The influence of irrigation water of high sodium carbonate content on soils. Agrokémia Talajt. 1964, 13, 237–246. Available online: http://real.mtak.hu/id/eprint/96046 (accessed on 20 August 2020).
  40. Zhang, B.; Zhao, D.; Zhou, P.; Qu, S.; Liao, F.; Wang, G. Hydrochemical characteristics of groundwater and dominant water–rock interactions in the Delingha Area, Qaidam Basin, Northwest China. Water 2020, 12, 836. [Google Scholar] [CrossRef] [Green Version]
  41. Parkhurst, D.L.; Appelo, C.A.J. User’s Guide to PHREEQC (Version 2) a Computer Program for Speciation, Batch-Reaction, One-Dimensional Transport, and Inverse Geochemical Calculations: U.S Geological Survey Water-Resources Investigations Report 99-4259. 1999. Available online: https://pubs.er.usgs.gov/publication/wri994259 (accessed on 21 October 2018).
  42. Fisher, R.A. 014: On the” Probable Error” of a Coefficient of Correlation Deduced from a Small Sample. 1921. Available online: https://hekyll.services.adelaide.edu.au/dspace/bitstream/2440/15169/1/14.pdf (accessed on 20 June 2020).
  43. Sarkar, B.; Islam, A.; Das, B.C. Role of declining discharge and water pollution on habitat suitability of fish community in the Mathabhanga-Churni River, India. J. Clean. Prod. 2021, 326, 129426. [Google Scholar] [CrossRef]
  44. Amalraj, A.; Pius, A. Assessment of groundwater quality for drinking and agricultural purposes of a few selected areas in Tamil Nadu South India: A GIS-based study. Sustain. Water Resour. Manag. 2018, 4, 1–21. [Google Scholar] [CrossRef]
  45. Piper, A.M. A Graphic Procedure in the Geochemical Interpretation of Water Analysis; United States Geological Survey: Washington, DC, USA, 1953.
  46. Mukherjee, B.; Rao, M.G.; Karunakaran, C. Genesis of kaolin deposits of Birbhum, West Bengal, India. Clay Miner. 1969, 8, 161–170. [Google Scholar] [CrossRef]
  47. Jannat, J.N.; Khan, M.S.I.; Islam, H.T.; Islam, M.S.; Khan, R.; Siddique, M.A.B.; Varol, M.; Tokatli, C.; Pal, S.C.; Islam, A.; et al. Hydro-chemical assessment of fluoride and nitrate in groundwater from east and west coasts of Bangladesh and India. J. Clean. Prod. 2022, 372, 133675. [Google Scholar] [CrossRef]
  48. Li, P.; Wu, J.; Qian, H. Assessment of groundwater quality for irrigation purposes and identification of hydrogeochemical evolution mechanisms in Pengyang County, China. Environ. Earth Sci. 2013, 69, 2211–2225. [Google Scholar] [CrossRef]
  49. Zhu, B.; Wang, X.; Rioual, P. Multivariate indications between environment and ground water recharge in a sedimentary drainage basin in northwestern China. J. Hydrol. 2017, 549, 92–113. [Google Scholar] [CrossRef]
  50. Kaufmann, G.; Gabrovšek, F.; Romanov, D. Dissolution and precipitation of fractures in soluble rock. Hydrol. Earth Syst. Sci. Discuss. 2016, 1–30. Available online: https://hess.copernicus.org/preprints/hess-2016-372/ (accessed on 15 August 2020).
  51. Chandrasekharam, D. Geothermal energy resources of India-Country update. In Proceedings of the World Geothermal Congress, Kyushu-Tohoku, Japan, 28 May–10 June 2000. [Google Scholar]
  52. CPCB. Action Plan for Rejuvenation of River Dwarka Birbhum. Nodal Agency Public Health Engineering Directorate Department of Public Health Engineering Government of West Bengal West Bengal. 2020. Available online: https://www.wbpcb.gov.in/writereaddata/files/Action%20Plan%20for%20River%20Dwarka.pdf (accessed on 20 December 2020).
  53. Alam, M.; Rais, S.; Aslam, M. Hydrochemical investigation and quality assessment of ground water in rural areas of Delhi, India. Environ. Earth Sci. 2012, 66, 97–110. [Google Scholar] [CrossRef]
  54. Arumugam, K.; Elangovan, K. Hydrochemical characteristics and groundwater quality assessment in Tirupur region, Coimbatore district, Tamil Nadu, India. Environ. Geol. 2009, 58, 1509–1520. [Google Scholar] [CrossRef]
  55. Brindha, K.; Kavitha, R.J.E.E.S. Hydrochemical assessment of surface water and groundwater quality along Uyyakondan channel, south India. Environ. Earth Sci. 2015, 73, 5383–5393. [Google Scholar] [CrossRef]
  56. Alaya, M.B.; Saidi, S.; Zemni, T.; Zargouni, F. Suitability assessment of deep groundwater for drinking and irrigation use in the Djeffara aquifers (Northern Gabes, south-eastern Tunisia). Environ. Earth Sci. 2014, 71, 3387–3421. [Google Scholar] [CrossRef] [Green Version]
  57. Golchin, I.; Azhdary Moghaddam, M. Hydro-geochemical characteristics and groundwater quality assessment in Iranshahr plain aquifer, Iran. Environ. Earth Sci. 2016, 75, 53. [Google Scholar] [CrossRef]
  58. Xu, P.; Feng, W.; Qian, H.; Zhang, Q. Hydrogeochemical characterization and irrigation quality assessment of shallow groundwater in the Central-Western Guanzhong Basin, China. Int. J. Environ. Res. Public Health 2019, 16, 1492. [Google Scholar] [CrossRef] [Green Version]
  59. Mukherjee, A.; Fryar, A.E. Deeper groundwater chemistry and geochemical modeling of the arsenic affected western Bengal basin, West Bengal, India. Appl. Geochem. 2008, 23, 863–894. [Google Scholar] [CrossRef]
  60. Yuan, J.; Xu, F.; Deng, G.; Tang, Y.; Li, P. Hydrogeochemistry of shallow groundwater in a karst aquifer system of Bijie City, Guizhou Province. Water 2017, 9, 625. [Google Scholar] [CrossRef] [Green Version]
  61. He, S.; Li, P.; Wu, J.; Elumalai, V.; Adimalla, N. Groundwater quality under land use/land cover changes: A temporal study from 2005 to 2015 in Xi’an, northwest China. Hum. Ecol. Risk Assess. 2020, 26, 2771–2797. [Google Scholar] [CrossRef]
  62. Majumdar, N.; Majumdar, R.K.; Mukherjee, A.L.; Bhattacharya, S.K.; Jani, R.A. Seasonal variations in the isotopes of oxygen and hydrogen in geothermal waters from Bakreshwar and Tantloi, Eastern India: Implications for groundwater characterization. J. Asian Earth Sci. 2005, 25, 269–278. [Google Scholar] [CrossRef]
  63. Majumdar, N.; Mukherjee, A.L.; Majumdar, R.K. Mixing hydrology and chemical equilibria in Bakreshwar geothermal area, Eastern India. J. Volcanol. Geotherm. Res. 2009, 183, 201–212. [Google Scholar] [CrossRef]
  64. Chaudhuri, H.; Maji, C.; Seal, K.; Pal, S.; Mandal, M.K. Exploration of geothermal activity using time series analysis of subsurface gases data from Bakreswar hot springs area, eastern India. Arab. J. Geosci. 2018, 11, 324. [Google Scholar] [CrossRef]
  65. Singh, H.K.; Chandrasekharam, D.; Trupti, G.; Singh, B. Geochemical characteristics of Bakreswar and Tantloi geothermal province, India. In Proceedings of the World Geothermal Congress, Melbourne, Australia, 19–25 April 2015; pp. 1–5. [Google Scholar]
  66. Haritash, A.K. Hydrogeochemical characterization and suitability appraisal of groundwater around stone quarries in Mahendragarh, India. Environ. Earth Sci. 2018, 77, 252. [Google Scholar] [CrossRef]
  67. Peckenham, J.M.; Thornton, T.; Whalen, B. Sand and gravel mining: Effects on groundwater resources in Hancock county, Maine, USA. Environ. Geol. 2009, 56, 1103–1114. [Google Scholar] [CrossRef]
  68. Khalid, S. An assessment of groundwater quality for irrigation and drinking purposes around brick kilns in three districts of Balochistan province, Pakistan, through water quality index and multivariate statistical approaches. J. Geochem. Explor. 2019, 197, 14–26. [Google Scholar] [CrossRef]
  69. Kumarasamy, P.; Dahms, H.U.; Jeon, H.J.; Rajendran, A.; James, R.A. Irrigation water quality assessment—An example from the Tamiraparani river, Southern India. Arab. J. Geosci. 2014, 7, 5209–5220. [Google Scholar] [CrossRef]
Figure 1. Location of the study area.
Geosciences 12 00415 g001
Figure 2. Wilcox diagram representing the suitability of water for irrigation: (a) groundwater samples of pre-mon season; (b) groundwater samples of post-mon season; (c) surface water samples of pre-mon season; (d) surface water samples of post-mon season and groundwater in pre- and post-mon periods for irrigation.
Geosciences 12 00415 g002
Figure 3. USSL classification of surface and groundwater samples for irrigation: (a) groundwater samples of pre-mon season; (b) groundwater samples of post-mon season; (c) surface water samples of pre-mon season; (d) surface water samples of post-mon season.
Geosciences 12 00415 g003
Figure 4. Piper tri-linear diagram showing the hydrochemical facies of the study area.
Geosciences 12 00415 g004
Figure 5. Litho–stratigraphic formation of the study area governing the hydrochemical evolution of the study area. Source: [46].
Geosciences 12 00415 g005
Figure 6. Scatter plots showing the correlation of major cations/anions to discriminate the geochemical processes. (a) Na+ vs. Cl, (b) Ca2+ vs. SO42−, (c) (SO42− + HCO3) vs. (Ca2+ + Mg2+), (d) Ca2+ vs. HCO3.
Geosciences 12 00415 g006
Figure 7. Plots of the saturation indices with selected minerals versus TDS or ion concentration. (a) Anhydrite vs TDS. (b) Gypsum vs TDS. (c) Sylvite vs TDS (notes: all trendlines are linear trendlines). (d) Gibbs plot representing the dominant processes involved in the hydrochemical evolution of groundwater.
Geosciences 12 00415 g007aGeosciences 12 00415 g007b
Figure 8. Spatio–temporal variation of saturation indices: (a) groundwater; (b) surface water (Notes: blue box indicates anhydrite, the red box indicates gypsum, the yellow box sylvite, and the green box halite, the solid box is in the pre-mon season, and the box with the black line is the post-mon season).
Geosciences 12 00415 g008
Figure 9. LULC of surrounding areas of the source of groundwater: (a) Bolpur, (b) Suri, (c) Bakreshwar, (d) Nalhati.
Geosciences 12 00415 g009
Figure 10. (a) Agni kunda hot spring. (b) Helium gas holder (Source: Field Photographs, 2021).
Geosciences 12 00415 g010
Figure 11. Anthropogenic activities around the sample location: (a) Bolpur, (b) Suri, (c) Bakreshwar, (d) Nalhati, (e) Bamdeb Ghat.
Geosciences 12 00415 g011
Table 1. Dates of surface and groundwater samples.
Surface Water
SuriSuri (Contd.)Sadhak Bam Deb GhatSadhak Bam Deb Ghat (Contd.)
Pre-MonPost-MonPre-MonPost-MonPre-MonPost-MonPre-MonPost-Mon
08 May 201910 Jan. 201920 Mar. 201801 Nov. 201808 May 201910 Jan. 201920 Mar. 201801 Nov. 2018
04 Apr. 201917 Oct. 201913 Feb. 201811 Dec. 201804 Apr. 201917 Oct. 201913 Feb. 201811 Dec. 2018
19 Mar. 201922 Nov. 201904 May 201717 Jan. 201719 Mar. 201922 Nov. 201904 May 201717 Jan. 2017
07 Feb. 201920 Dec. 201913 Apr. 201726 Oct. 201707 Feb. 201920 Dec. 201913 Apr. 201726 Oct. 2017
18 May 201817 Jan. 201822 Mar. 201723 Nov. 201718 May 201817 Jan. 201822 Mar. 201723 Nov. 2017
10 Apr. 201804 Oct. 201814 Feb. 201713 Dec. 201710 Apr. 201804 Oct. 201814 Feb. 201713 Dec. 2017
Groundwater
BolpurNalhatiSuriBakreshwar
Pre-MonPost-MonPre-MonPost-MonPre-MonPost-MonPre-MonPost-Mon
04 Apr. 201918 Oct. 201804 Apr. 201917 Oct. 201904 Apr. 201917 Oct. 201904 Apr. 201917 Oct. 2019
11 Apr. 201805 Oct. 201810 Apr. 201804 Oct. 201811 Apr. 201805 Oct. 201810 Apr. 201804 Oct. 2018
12 Apr. 201726 Oct. 201713 Apr. 201725 Oct. 201712 Apr. 201726 Oct. 201712 Apr. 201726 Oct. 2017
Source: [35].
Table 2. Indices for measuring the irrigation hazards.
Irrigation HazardsAcronymEquationsRangeWater ClassReferences
Sodium hazards% Na Na + +   K +     100 Ca 2 + +   Mg 2 + +   Na + +   K + (2)<20Excellent[8]
20–40Good
40–60Permissible
60–80Doubtful
>80Unsuitable
SAR Na + ½ Ca 2 + +   Mg 2 + (3)<10Excellent[37]
10–18Good
18–26Doubtful
>26Unsuitable
SSP Na + × 100 Ca 2 + +   Mg 2 + +   Na + (4)<50Suitable[38,39]
>50Unsuitable
Magnesium hazards MH Mg 2 + × 100 Ca 2 + +   Mg 2 + (5)<50Suitable
>50Unsuitable
Salinity hazardsPS Cl +   ½ SO 4 2 (6)<3Excellent to Good[4]
3–5Good to injurious
>5Injurious to unsatisfactory
Table 3. Descriptive statistics of physicochemical parameters of surface water.
ParametersPre-MonPost-Mon
Mean ± SDRange (Min–Max)KurtosisSkewnessMean ± SDRange (Min–Max)KurtosisSkewness
pH7.75 ± 0.27.45–7.96−0.75−0.537.64 ± 0.177.45–7.88−1.710.13
EC (µS/cm)321.56 ± 215.17160.08–639.7−1.451213.57 ± 78.54147.83–3531.391.37
Ca2+ (mg/L)26.89 ± 14.2416.8–53.22.321.6726.63 ± 18.3915.68–63.635.42.3
Mg2+ (mg/L)12.14 ± 4.835.93–19.44−0.360.449.38 ± 2.016.13–11.640.07−0.72
Na+ (mg/L)27.77 ± 20.4511.5–652.051.522.29 ± 9.4710–35.33−1.030.05
K+ (mg/L)5.61 ± 4.311.75–13.251.511.254.18 ± 1.672.25–6.37−2.060.21
Cl (mg/L)41.71 ± 41.516.95–112.310.361.2524.31 ± 11.2613.67–38.22−2.350.4
SO42− (mg/L)9.68 ± 1.887.02–11.98−1.24−0.4214.52 ± 6.207.7–23.55−1.240.7
TDS (mg/L)188.11 ± 117.67101.5–340−1.880.93137.5 ± 40.5994–203.50.190.71
PO43− (mg/L)0.06 ± 0.020.05–0.092.311.540.05 ± 0.010.04–0.072.771.57
NO3 (mg/L)0.17 ± 0.050.11–0.23−1.85−0.560.17 ± 0.080.07–0.27−1.84−0.21
Table 4. Descriptive statistics of physicochemical parameters of groundwater.
ParametersPre-MonPost-Mon
Mean ± SDRange (Min–Max)KurtosisSkewnessMean ± SDRange (Min–Max)KurtosisSkewness
pH 7.63 ± 1.096.08–9.36−1.150.087.60 ± 0.886.52–9−1.430.3
EC (µS/cm)758.73 ± 210.58528.3–12330.770.95767.33 ± 225.97434–1168−0.790.25
Ca2+ (mg/L)44.47 ± 22.6210.4–80−1.01−0.1555.25 ± 53.132.31–153.84−0.220.99
Mg2+ (mg/L)22.53 ± 14.211.92–51.520.240.4621.37 ± 19.840.89–55.68−1.330.54
Na+ (mg/L)52.83 ± 33.1819.3–140.23.951.865.46 ± 38.828–140−0.11.14
K+ (mg/L)2.9 ± 2.061–70.251.274.48 ± 2.662–100.51.32
Cl (mg/L)126.34 ± 53.9446.79–246.441.080.9137.79 ± 68.6124.95–274.520.050.43
SO42− (mg/L)41.04 ± 21.3317.4–84.86−0.30.7633.22 ± 15.43.73–55.380.16−0.78
TDS (mg/L)541.17 ± 213.79264–10883.361.45528.17 ± 176.06290–814−0.820.53
PO43− (mg/L)0.03 ± 0.010.02–0.04−1.520.070.07 ± 0.060.02–0.18−0.271.14
NO3 (mg/L)0.74 ± 0.320.15–1.18−0.81−0.470.56 ± 0.280.19–1−1.32−0.04
Table 5. Classification of surface water and groundwater based on irrigation index.
ParametersRangeWater ClassGroundwaterSurface Water
Pre-MonPost-MonPre-MonPost-Monsoon
(% of Samples)(% of Samples)(% of Samples)(% of Samples)
% Na [8]<20Excellent2533.3300
20–40Good41.672583.3366.67
40–60Permissible8.338.3316.6733.33
60–80Doubtful8.338.3300
>80Unsuitable16.672500
SAR [38]<10Excellent100100100100
10–18Good0000
18–26Doubtful0000
>26Unsuitable0000
SSP [39]<50Suitable7566.67100100
>50Unsuitable2533.3300
MH [40]<50Suitable58.3358.3383.3383.33
>50Unsuitable41.6641.6616.6716.67
PS [4]<3Excellent to Good252583.33100
5-MarGood to injurious58.3333.3316.670
>5Injurious to unsatisfactory16.6741.6700
Table 6. Irrigation water quality classes for salinity hazard according to USDA.
Classes for Salinity Hazard Degree of Irrigation HazardEC µS/cmGroundwaterSurface WaterTDS mg/LGroundwaterSurface WaterPotential Harm and Appropriate Control for Irrigation Water Use
Pre-MonPost-MonPre-MonPost-Mon Pre-MonPost-MonPre-MonPost-Mon
(% of Samples)(%of Samples)(% of Samples)(%of Samples)(% of Samples)(%of Samples)(% of Samples)(%of Samples)
C1Low<2500066.6766.67<1500066.6766.67Minimum salinity risk; optional management
C2Medium 251–75058.3341.6733.3333.33150–50041.6741.6733.3333.33Medium salinity risk; more management is required; salt-sensitive crops may suffer harm.
C3High751–225041.6758.3300500–150058.3358.3300Crops with a limited tolerance to salinity to suffer damage; irrigation requires quality water.
C4Very high2250–50000000>15000000The management of salt-tolerant plants, adequate soil drainage, and excessive irrigation for leaching is necessary to prevent damage to crops with limited tolerance for salinity.
Based on [19].
Table 7. Stratigraphic sequence in the Birbhum area.
FormationAge
Alluvium laterites and lateritic gravel with silicified fossil woodRecent
Clay beds ferruginous and feldspathic sandstonesTertiary
Rajmahal trapsMiddle Jurassic
Flaggy shales, clays and compact sandstones (Dubrajpur beds)Lower Jurassic
Sandstones, shales with coal seams (Barakar Series)Permian (Gondwana)
Unconformity
Granites, Granite-gneisses, biotite-schists, calc-granulites with quartz and pegmatite veinsArchaean
Source: [46].
Publisher’s Note: MDPI stays neutral with regard to jurisdictional claims in published maps and institutional affiliations.

