Abstract
Seasonal variations of water temperature, electric conductivity, and oxygen isotope and chemical composition of shallow groundwaters and river waters were determined in the Sho River alluvial fan, western Toyama Prefecture, Japan, to examine groundwater heat utilization for indoor climate control. Samples were collected at 31 sites every 2 months for 1 year and at 11 representative sites monthly. In addition, the results of monthly precipitation amount and oxygen isotope composition of precipitation collected within the region during the same period were also taken into account. The sources of the shallow groundwaters are a mixture of river water and precipitation. The contribution of precipitation to groundwater is generally small along the Sho River but reaches as much as 80% along the Oyabe River and in the south and west of the alluvial fan. Though the origin of the groundwater differs regionally, water temperature is fixed at around 15 °C throughout the year in the northern part of the alluvial fan, and open-type ground source heat pump systems can be used for cooling and heating there, if adequate quantitative aquifer properties (exploitable groundwater amounts) are present.
1. Introduction
In Toyama Prefecture, Japan, a large amount (more than 150 million tons/year) of groundwater flows from the mountains (~3000 m in altitude) to the Sea of Japan within 100 km [1]. Most rivers in Toyama Prefecture have the highest hydraulic gradient in Japan. Because the water temperature of shallow groundwater in Toyama is approximately 15 °C throughout the year (Toyama Prefecture, 2006), groundwater can be used as a heat source for indoor climate control of houses and industry, using the temperature difference between air and groundwater. Geothermal heat pumps (ground source heat-pump systems; GSHP) effectively use groundwater as a source for indoor climate control and melting snow on roads. In summer, groundwater that is cooler than the atmospheric temperature can be used to cool houses. In contrast, groundwater is warmer than the atmospheric temperature in winter. In this system, the water temperature, quality, and mode of water movement are important parameters for groundwater use. A constant groundwater supply is required for long-term use of a GSHP device.
The quality of groundwater is also important to maintain high heat exchange efficiency during operation. Geothermal heat pumps are generally divided into two types: open and closed. In the closed type, a heat exchange facility is installed by drilling a well, and underground heat is recovered by passing heat-containing fluid through a U-shaped pipe. For the open type, groundwater is pumped from the ground and used directly. Therefore, this second type can be used only where there is groundwater in sufficient exploitable amounts. Water quality is changed by the return of groundwater to the ground, and the problem of chemical precipitation (scale) in the heat exchanger must be considered. However, the open-type has the advantages of more efficient recovery of geothermal heat and lower initial costs [2,3,4].
There are many studies of water movement in alluvial fans [5,6,7,8,9,10,11,12]. Recently, several reports have been published on the chemical characteristics of groundwater in Japan for the purpose of using groundwater heat [13,14,15,16,17,18,19]. There also has been research on the environmental influence on water quality and water temperature changes in reinjected groundwater after heat extraction [20,21,22,23,24,25,26]. In the vast Sho River alluvial fan, there are two major rivers, the Sho and Oyabe Rivers (Figure 1), that flow from Nanto City into the Sea of Japan via Takaoka City in the north. There are previous reports on the state of recharge and groundwater flow in the Sho River alluvial fan based on stable isotope and chemical components [5,27,28]. Recently, Iwatake et al. [15] reported a linear relationship between δD and δ18O values for groundwater and river water in the region and posited that groundwater originated as a mixture of Sho and Oyabe River waters and precipitation in varying proportions. The δD and δ18O values for groundwater vary from −47‰ to −65‰ and from −8.1‰ to −10.6‰, respectively. The range of variation in δD and δ18O values is smaller for the Sho River than for the Oyabe River, and the Sho River originates from higher elevations. Iwatake et al. [15] also analyzed the chemical composition of groundwater collected in August 2011 and showed that groundwater is enriched in Ca2+ and HCO3− by dissolution of carbonate rocks. They evaluated this area for the applicability of GSHP and the degree of scale creation by chemical components such as iron and calcium carbonate. However, these previous studies discussed single sampling results and did not provide detailed seasonal variations over a year. It has been reported that the flow rate of groundwater in the middle reaches of the Sho River is as fast as 10 to 13 m/day [5], suggesting that seasonal variation is large in the Sho River alluvial fan.
The aim of this study is to examine annual seasonal variations of groundwater flow patterns in the Sho River alluvial fan and to select suitable areas for open-type GSHP for industrial and domestic use. In the northern Sho River alluvial fan, groundwater has been used for industry, melting snow on roads, and drinking. Excessive extraction of groundwater in the past resulted in land subsidence, causing permanent damage. Such land subsidence has been reported elsewhere, and correlations between groundwater level and changes in surface morphology have also been studied [29]. Therefore, the ultimate goal is to apply GSHP, which uses groundwater heat, not only to indoor climate control and winter agricultural production but also to environmental conservation. Samples were taken every month or every two months for a year, and the geochemical characteristics of groundwater in the target area were determined by analyzing oxygen isotope and chemical composition. The possibility of using groundwater for heat was also explored by selecting areas suitable for open-type GSHP.
2. Outline of the Sho River Alluvial Fan
The Sho River alluvial fan is located in the western part of Toyama Prefecture and spans the Tonami plain in the central part of the fan (Figure 1a). Two big rivers, Sho and Oyabe, flow through the fan. Takaoka city is located in the northern part of the fan and Nanto City in the southern part. A geologic map of the area is shown in Figure 1a [30]. The study area consists of coarse-grained andesitic breccia derived from the surrounding mountains and hills. There are coarse layer deposits in the upper and central areas of the fan. In addition, two or three clay layers are present at the end of the fan around Takaoka [15]. Quaternary unconsolidated or semi-consolidated sediments are distributed on the alluvial plain and fan. They form aquifers containing abundant groundwater. In Toyama Prefecture, approximately 150 million tons of groundwater per year flow approximately 100 km from mountain ranges (with altitudes of 3000 m) to the coast. The Sho and Oyabe River basins have rich groundwater resources, and therefore, 70% of the groundwater in Toyama Prefecture exists in this area [1].

Figure 1.
(a) Geological map of the study area [1]. (b) Average daily air temperature and precipitation at Takaoka City [31].
The minimum and maximum air temperatures are 0 °C in winter and 35 °C in summer with an average temperature of 13.4 °C along the Japan Sea in northern Central Japan [31] (Figure 1b). A large amount of snow falls in winter. Annual precipitation is 3200 mm at Shirakawa (Figure 1a), where the Sho River originates, and 2300 mm in the Takaoka area (ocean side) [1]. There is a small amount of precipitation (rain) in summer, but more than 80 mm/day sometimes falls (Figure 1b). The Sho River alluvial fan is surrounded by mountains, and the southern part is in a mountainous region (Figure 2). Underground temperatures become nearly constant below depths of approximately 10 m and are 1 °C to 2 °C higher than annual mean air temperature over the land. Underground water temperatures are commonly close to average air temperatures [32,33,34,35,36]. On the basis of these factors, the groundwater temperature in the study area is estimated to be 14 °C to 15 °C.
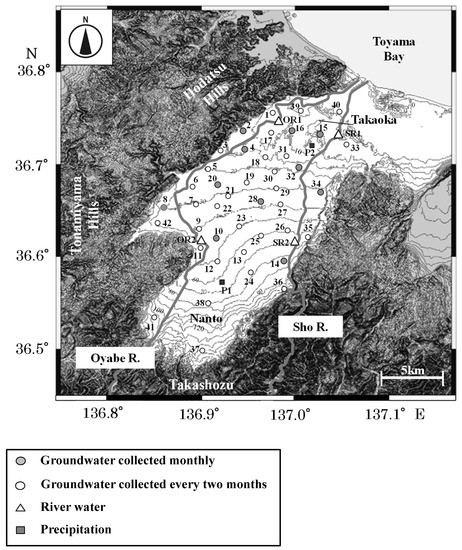
Figure 2.
Location of water samples in Sho River alluvial fan. The contour intervals are 10 m.
3. Sample Locality and Analytical Procedures
The study area and water sampling sites are detailed in Table 1 and Figure 2. Since April 2012, groundwater samples have been collected monthly at 11 representative sites, and once every 2 months at another 31 sites for a year (Table 2, Table 3, Table 4, Table 5, Table 6, Table 7, Table 8, Table 9, Table 10 and Table 11). River water was sampled 11 times a year in the upper and lower areas of the Sho and Oyabe Rivers (Figure 1b, Table 12). Within this region, Okakita et al. [37] measured precipitation at two observation stations (P1 and P2 in Figure 1b) every month in the same time frame as this study (May 2012 to May 2014), and their data were used in this study. Most groundwater samples were collected from wells. Depths of groundwater wells are up to 100 m, but water levels at the sampling sites were not known, even by the owners. Water samples were collected in 250 and 100 mL plastic bottles for dissolved chemical components and stable isotope ratio after washing three times with sample water. Because the groundwater and river water samples were colorless and transparent, filtration and acid treatment were not carried out in the field. Water temperature, pH, electric conductivity (EC), and oxidation–reduction potential (ORP) were measured at the sampling site using a thermometer (YI Chun waterproof digital thermometer, China), a pH meter (TOA HM-31P, Japan), an EC meter (TOA CM-31P, Japan), and an ORP meter (TOA RM-30P, Japan), respectively.

Table 1.
Sample sites for groundwater and river water in the Sho River alluvial fan.
Table 2.
Water temperature, pH, electric conductivity (EC), oxidation–reduction potential (ORP), and δ18O composition for groundwater samples in the Sho River alluvial fan on 2 April 2012.
Table 3.
Water temperature, pH, electric conductivity (EC), oxidation–reduction potential (ORP), chemical, and δ18O composition for groundwater samples in the Sho River alluvial fan on 24 April to 1 May 2012.
Table 4.
Water temperature, pH, electric conductivity (EC), oxidation–reduction potential (ORP), and δ18O composition for groundwater samples in the Sho River alluvial fan on 29 May 2012.
Table 5.
Water temperature, pH, electric conductivity (EC), oxidation–reduction potential (ORP), chemical, and δ18O composition for groundwater samples in the Sho River alluvial fan on 23 June to 26 June 2012.
Table 6.
Water temperature, pH, electric conductivity (EC), oxidation–reduction potential (ORP), and δ18O composition for groundwater samples in the Sho River alluvial fan on 1 August 2012.
Table 7.
Water temperature, pH, electric conductivity (EC), oxidation–reduction potential (ORP), chemical, and δ18O composition for groundwater samples in the Sho River alluvial fan on 23 August to 28 August 2012.
Table 8.
Water temperature, pH, electric conductivity (EC), oxidation–reduction potential (ORP), and δ18O composition for groundwater samples in the Sho River alluvial fan on 3 October 2012.
Table 9.
Water temperature, pH, electric conductivity (EC), oxidation–reduction potential (ORP), chemical, and δ18O composition for groundwater samples in the Sho River alluvial fan on 30 October to 1 November 2012.
Table 10.
Water temperature, pH, electric conductivity (EC), oxidation–reduction potential (ORP), chemical, and δ18O composition for groundwater samples in the Sho River alluvial fan on 13 December to 21 December 2012.
Table 11.
Water temperature, pH, electric conductivity (EC), oxidation–reduction potential (ORP), and δ18O composition for groundwater samples in the Sho River alluvial fan on 31 January 2013.
Table 12.
Water temperature, pH, electric conductivity (EC), oxidation–reduction potential (ORP), chemical, and δ18O composition for groundwater samples in the Sho River alluvial fan on 5 March to 8 March 2013.
The oxygen isotope (δ18O) composition was determined by a sector mass spectrometer (VG Optima) after pretreatment with CO2–H2O isotope exchange equilibrium [38] at 25 °C. The results were reported relative to V-SMOW with an analytical precision of ±0.1‰. The major anion components (Cl−, NO3−, and SO42−) were measured using ion chromatography (Metrohm 761 Compact IC). Cation (Na+, K+, Ca2+, and Mg2+) analysis was conducted using an atomic absorption spectrophotometer. Alkalinity was measured using the pH 4.8 acid titration method. The SiO2 concentration was measured by the molybdenum-yellow colorimetric method using an absorption photometer (Shimazu UV-VIS Spectrophotometer). The charge balance of the obtained main chemical components was within 5%, and the analytical error of the measured value was roughly ±5%.
4. Results and Discussion
The results obtained in this study are shown in Table 2, Table 3, Table 4, Table 5, Table 6, Table 7, Table 8, Table 9, Table 10, Table 11, Table 12 and Table 13 and in Figure 3, Figure 4, Figure 5, Figure 6, Figure 7, Figure 8, Figure 9, Figure 10 and Figure 11, where the sample location numbers correspond to those in Table 1 and Figure 1b.
Table 13.
Water temperature, pH, EC, oxidation–reduction potential (ORP), and δ18O composition for river water samples in the Sho River alluvial fan.
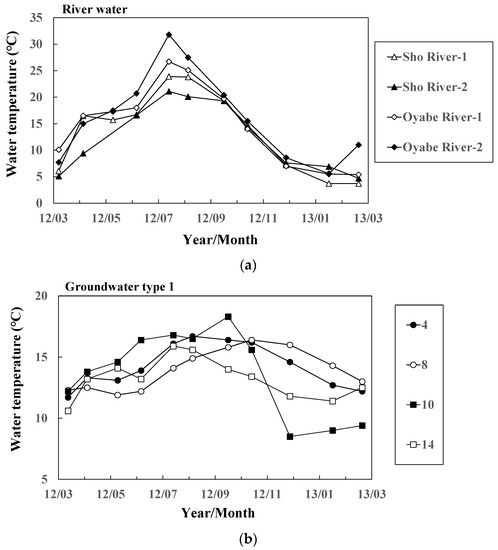
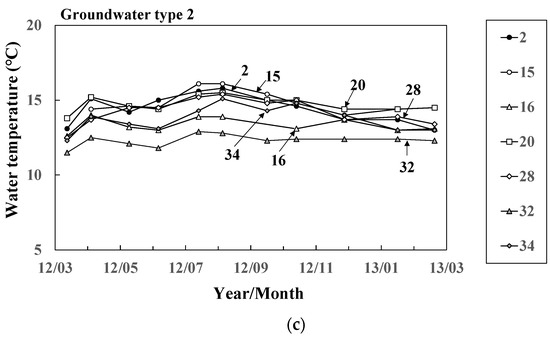
Figure 3.
Seasonal variation of water temperature of (a) river water and groundwater ((b) Types 1 and (c) 2 at 11 representative sites.
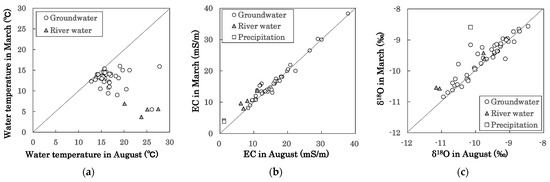
Figure 4.
(a) Temperature, (b) EC, and (c) δ18O difference for groundwater and river water between August and March. The broken lines indicate constant values throughout a year at each sampling site.
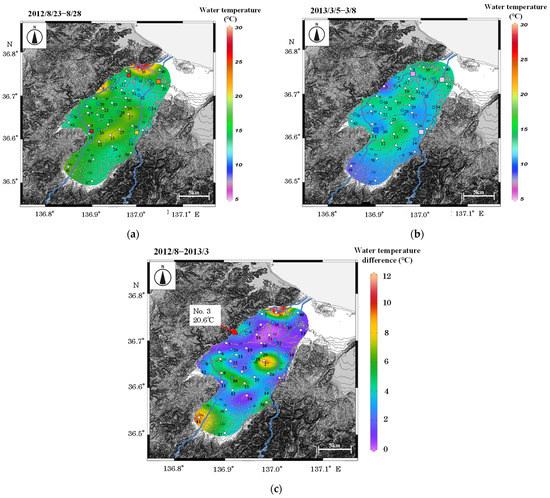
Figure 5.
Contour map of groundwater temperature in (a) 2012/8/23–8/28 and (b) 2013/3/5–3/8. (c) Water temperature differences between 2012/8 and 2013/3. Temperatures of river water are shown by color of the squares.
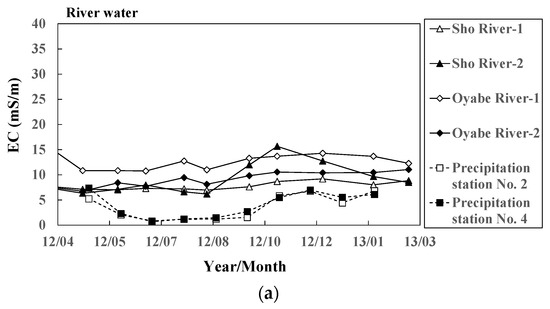
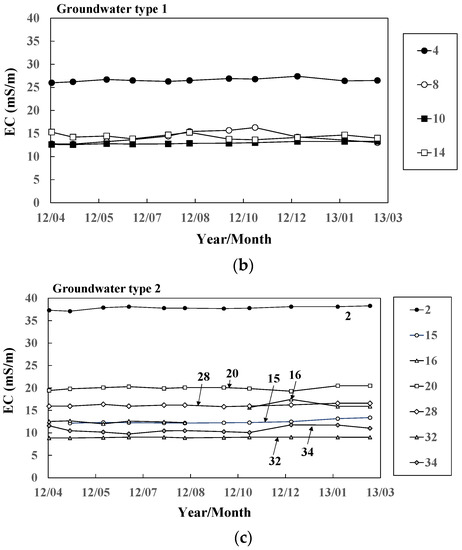
Figure 6.
Seasonal variation of electric conductivity in (a) river water and groundwater ((b) Types 1 and (c) 2) at 11 representative sites.
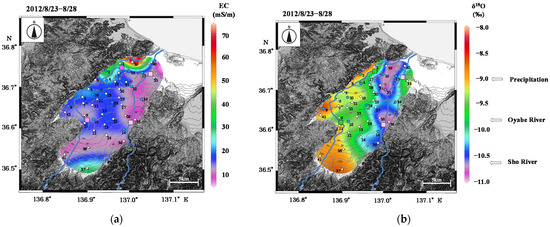
Figure 7.
Contour maps of (a) EC and (b) δ18O for groundwater samples in August 2012.
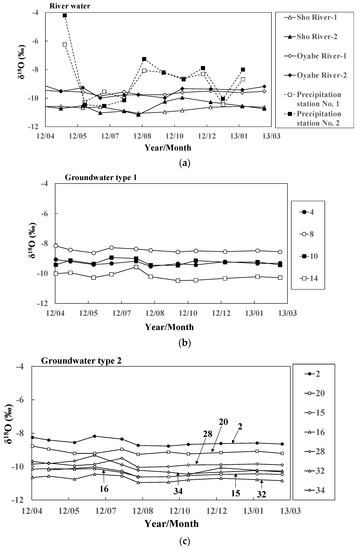
Figure 8.
Seasonal variations of δ18O values for (a) river water and groundwater ((b) Types 1 and (c) 2) at 11 representative sites.
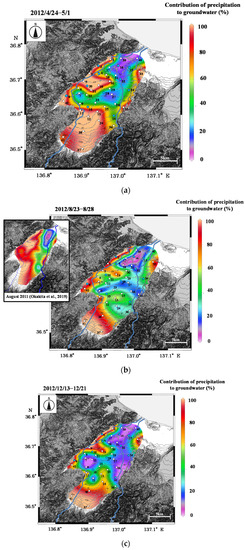
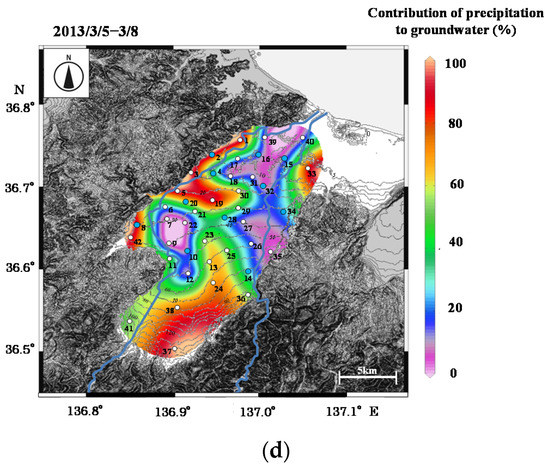
Figure 9.
Contour maps of contribution of precipitation to groundwater in (a) 2012/4/24–5/1, (b) 2012/8/23–8/28, (c) 2012/12/13–12/21, and (d) 2013/3/5–5/8. In Figure 9b, a contour map in August 2011 is also shown, which was modified from Okakita et al. [37].
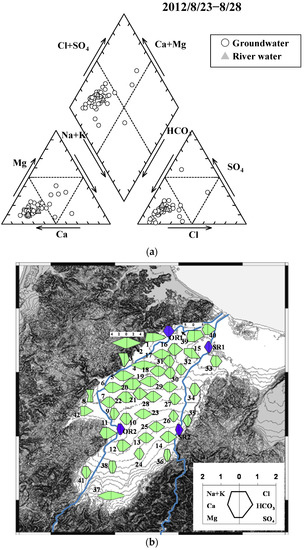
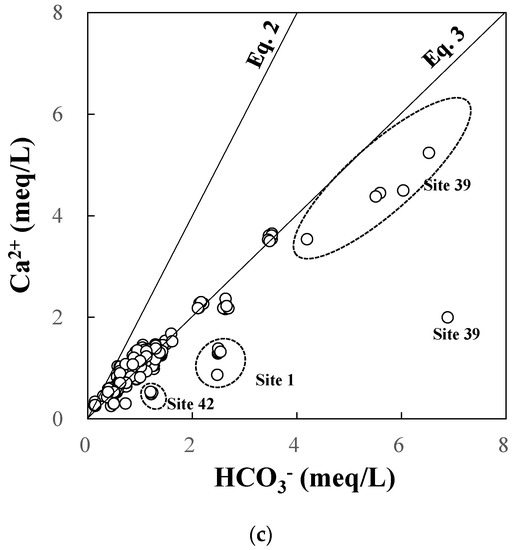
Figure 10.
(a) Piper and (b) Stiff diagrams of groundwater and river water. (c) HCO3− vs. Ca2+. Solid lines correspond to Equations (2) and (3) in the text. Gray and black colors correspond to groundwater and river water, respectively.
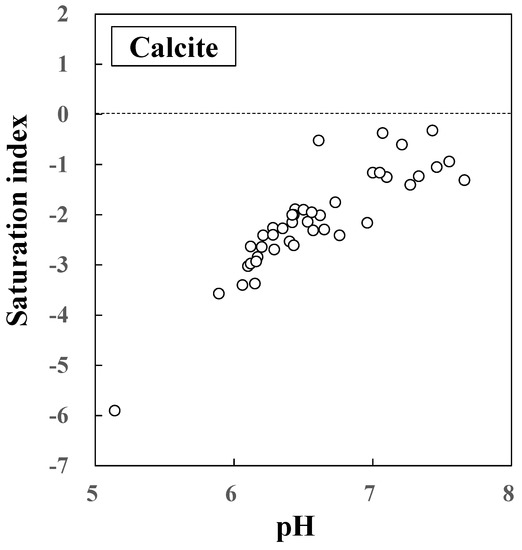
Figure 11.
Saturation index of CaCO3 (Calcite) component in the groundwater.
4.1. Seasonal Variation of River and Groundwater Temperature
River water temperatures show seasonal variations, reaching over 30 °C in summer and dropping to about 5 °C in winter (Figure 3a). This change is linked to the air temperature variation, but the water temperature in the Sho River is about 10 °C lower than that in the Oyabe River in summer. This is judged to be due to the fact that the catchment area of the Sho River is a mountain with a high elevation.
Water temperature variation of 11 representative groundwater samples collected monthly for 1 year are shown in Figure 3b,c. On the basis of water temperature variations, groundwater behavior similar to the rivers, with high temperature in summer and low temperature in winter, was arbitrarily designated as Type 1, and groundwater with little variation throughout the year was designated as Type 2 (Figure 3b,c). Groundwater sites corresponding to Type 1 are Sites 4, 8, 10, and 14, with the first three along the Oyabe River and the other on the Sho River (Figure 1b). The water temperature of Type 2 groundwater fluctuates within the range of ±2 °C per year (Figure 3c). The month with maximum water temperature of the Type 1 groundwater varies from region to region. Sample Sites 4 and 14 are in August at the same time as river water, and Sites 8 and 10 are around October (Figure 3b). The latter two groundwaters are thought to have sprung up several months after they infiltrated into the ground, whether they originated in river water or precipitation. Type 2 groundwater has constant water temperature throughout a year, but the mean value varies in the range of 12–16 °C, with no regional differences (Figure 3c). The annual average air temperature in Takaoka City is 13.4 °C [31].
Underground temperatures are generally constant throughout the year at depths of 10 m or more, which will generally match the annual average temperature of the area [32,33,34,35,36]. As a result, groundwater with a residence time of 1 year or more will be close to the average air temperature value in that area. Therefore, it is possible to infer the residence time of groundwater by comparing groundwater and river water temperatures to air temperature. Water temperature is an important tracer for investigating groundwater flow. Figure 4a illustrates the temperature differences of groundwater and river water across the region between (August 2012) and winter (March 2013). More than one-third of the groundwater in the study area plotted far from the line in Figure 4a and some groundwater (Nos. 3, 27, and 41) have approached river water values. The sample No. 39 was struck farther away from the other groundwater samples and showed peculiar values of 28 °C in summer and 15 °C in winter. This point is located near the coastal area near the Hodatsu Hills. These indicate that residence time is shorter as samples approach the composition of river water. The distributions of groundwater temperatures during summer and winter and the differences between them are shown in Figure 5. The temperature of river water is shown by the color of the squares. The difference in groundwater temperature between summer and winter was within 6 °C, except in some sites, and especially within 2 °C in the lower reaches of the Sho River (Figure 5c). The water temperature variations are larger at Sites 3, 39, 41, and 27 than for the other groundwater sites. The former two sites are located along the Hodatsu Hills and Sites 27 and 41 are located in the central and southern regions, respectively. In particular, considering that the temperature difference at Site 3 is as much as 20.6 °C (Figure 5c), this indicates that precipitation gushes out as groundwater as soon as it infiltrates underground. In contrast, the residence time of groundwater in the areas with no significant temperature differences is estimated to be almost 1 year. Such groundwater is distributed from the central area to the northern area of the alluvial fan, except for Sites 3, 27, and 39.
4.2. Seasonal Variation of Groundwater EC
The EC value of groundwater, regardless of whether it originates from precipitation or river water, is expected to increase as the residence time increases due to the reaction with surrounding rocks after infiltration into the ground. Therefore, EC values are also a good indicator of residence time. There are two precipitation observation sites in the study area, and EC values of precipitation were below 6 mS/m throughout the year. EC values tend to increase in winter [37], when precipitation mainly comes from air masses originating in mainland China. Winter precipitation is more acidic and rich in SO42− than precipitation in summer (Okakita et al., 2019). The EC value of river water is higher than that of precipitation and also tends to rise slightly in winter (Figure 6a), reflecting the contribution of groundwater. Precipitation in the study area infiltrates into the ground and becomes Ca2+–HCO3− type [15] groundwater by reaction with surrounding rocks before flowing out to the river.
Types 1 and 2 groundwaters had almost constant EC throughout the year (Figure 4b and Figure 6b,c), with values that were comparable to or higher than river water (10 ± 5 mS/m). In particular, the water temperature of the groundwater in Type 1 shows seasonal variation, but the EC value is constant. Figure 7a shows the distribution of groundwater EC values in the study area. EC values of groundwater along the Sho River and in the southern region are low. In contrast, Sites 2 and 39 in the northern region show high values. These two sites are located along the Oyabe River and close to the Hodatsu Hills (Figure 1b). In particular, groundwater at Site 39 has a high EC value of about 60 mS/m and is enriched in Na+–Ca2+–Cl−, suggesting that fossil seawater may have contributed to the EC value (Table 3, Table 5, Table 7, Table 9 and Table 10).
4.3. Seasonal Variation of Groundwater δ18O
The river waters of the Sho and Oyabe Rivers had approximately constant δ18O values throughout a year, and no significant difference was found between upstream and downstream sampling points of the same river (Figure 8a). Both Sho and Oyabe Rivers are the first-class rivers in Japan and have high flow rates. It has been reported in previous studies that the δ18O value of river water is constant throughout the year [5,8]. This may be due to the fact that groundwater with a long residence time gushes into the river water, and although the δ18O value changes temporarily during heavy rains, it shows a similar value during steady-state conditions [5,8]. On the other hand, in the southern part of the study area, it was reported that the δ18O values of the Oyaba and Sho River waters differed by about 0.5‰ and 1.5‰, respectively, between summer and winter [17], and it can be concluded that the river water near the mountainous area is more susceptible to the influence of precipitation, while the influence is less in the plain area. The δ18O value for the Sho River was approximately 1‰ lower than that of the Oyabe River. This is a result of the fact that the Sho and Oyabe Rivers originate from mountains with the altitude of 1625 m and 1572 m and flow to the ocean 115 km and 68 km away, respectively. The Sho River’s catchment area is a mountainous area stretching from Toyama to Gifu Prefectures (average elevation; 1020 m), while the Oyabe River’s catchment area is a low mountainous and hilly area (average elevation; 260 m) in the western and southern part of the Tonami Plain. [5,15]. The mean δ18O values for the Sho River and Oyabe River are −10.7‰ and −9.6‰, respectively. At two observation stations in the study area, Okakita et al. [37] reported monthly precipitation δD and δ18O for two years starting from May 2012, and the δ18O value changes are shown in Figure 8a. The annual weighted average of δ18O values considering precipitation amount is −9.0‰. Iwatake et al. [15] reported a good correlation between δD and δ18O of groundwater with δD = 8δ18O + 20. Hence, only δ18O values are analyzed and discussed in this study.
The δ18O values for groundwater are approximately constant throughout the year, varying between −11‰ and −8‰ with no differences between Types 1 and 2 (Figure 8b,c). Figure 7b shows the distribution of δ18O values in August 2012. Groundwater with low δ18O values is distributed along the Sho River and values rise as distance from the river increases (Figure 7b). As shown in the legend of Figure 7b, the δ18O values of the Oyabe River are intermediate between those of precipitation falling on the Hodatsu Hill and Sho River water, and the same result is obtained from the δD-δ18O diagram by Iwatake et al. [15]. Therefore, it is difficult to determine whether the groundwater around the Oyabe River is formed by seepage water from the Oyabe River water or a mixture of precipitation from the Hodatsu Hill and river water from the Sho River. Figure 7b also shows the δ18O values (green squares) of the summer river water of the Oyabe River, but the areas of high river water infiltration are not clear. This trend is also observed in the results of the analysis of the geographical distribution of the δ18O values of groundwater collected every two months (not shown as a figure). This suggests that the groundwater around the Oyabe River is likely to be formed mainly by a mixture of precipitation and Sho River water, although some areas may be contributed by seepage water from the Oyabe River. Based on these results, we assumed that the groundwater in the Sho River alluvial fan is a mixture of precipitation and Sho River water and that the calculation of the contribution of precipitation assumes that there is little evaporation during the infiltration of precipitation into the ground. The mixing ratio was examined using the δ18O values obtained in this study. The contribution of precipitation to groundwater is shown in Equation (1).
Percent contribution (%) = (δ18O groundwater − δ18O river water)/(δ18O precipitation − δ18O river water) × 100
The δ18O values for precipitation and river water were set as −9.0‰ and −10.7‰, respectively, which are the annual weighted averages [37] at observation site P1 (Figure 1b) and for Sho River water in this study, respectively (Table 12). The percentages of precipitation in groundwater during four seasons (April, August, and December 2012 and March 2013) are shown in Figure 9. The contribution of precipitation to groundwater varies widely from region to region, with more than 80% in the southern region, consistent with the results of Mori et al. (2020), and eastern areas of the study area and in the western part of the Oyabe River. In contrast, it ranges from 10% to 60% in other regions, and it was 20% or less in the region near the Sho River where river water infiltrates. The percentage of precipitation in groundwater varies with the season, and especially in southern regions, the contribution is higher in winter. Iwatake et al. [15] collected groundwater at almost the same site as our sampling in August 2011 and determined δ18O values. Okakita et al. (2019) used the weighted average values of precipitation and the average values of river water to show variations in the contribution ratio of precipitation (the inset of Figure 9b shows an illustration from Okakita et al. [37] with some additions and modifications). In this study, the average measured value was set as the river water value, and it agreed with the value used by Okakita et al. [37]. Compared with the results of this study, the percentage of precipitation in groundwater in 2011 was as high as 70% or more in the western part of the study area and changed over the course of a year. This suggests that even if the water temperature is almost constant throughout the year, the percentage of precipitation in Sho River water changes.
4.4. Chemical Composition of Groundwater
The major chemical constituents of the groundwater and river water are presented in Table 2, Table 3, Table 4, Table 5, Table 6, Table 7, Table 8, Table 9, Table 10 and Table 11 and in Figure 10. The Piper [39] and Stiff diagrams [40] of the samples collected in August 2012 are shown in Figure 10. Most of the groundwater showed Ca2+–HCO3− type, which is similar to the composition of groundwater in the Toyama alluvium fan [41] near the study area. The relationship between Ca2+ + Mg2+ and HCO3− concentration in groundwater is shown in Figure 10c. These data represent all the groundwater samples collected in this study for one year, and as Iwatake pointed out, there is a positive correlation between them. The two straight lines in the Figure 10c show Equations (2) and (3), and most of the water samples showed compositions between these lines. This is interpreted to mean that the mixture of precipitation and river water is taking up atmospheric CO2 in some places and dissolving carbonate minerals in the strata. The hydrolysis and dissolution reactions of limestone to form dissolved bicarbonate and calcium ions can be described elsewhere [9,41,42].
CaCO3 + H2O = Ca2+ + HCO3− + OH−
If CO2 is available from the atmosphere and/or decomposition of organic matter, the equations are.
CaCO3 + H2O +CO2 = Ca2+ + 2 HCO3−
From the line of Equation (2), there is groundwater with enriched HCO3− concentration (Sites 1, 39, and 42), but these are most likely due to ion-exchange reactions with clay minerals and other materials after the reaction with limestone, and Ca2+ was replaced with Na+ and K+. The same point has been made in the Toyama fan area [41]. Among these, the groundwater at Site 39 is of Na+·Ca2+·Mg2+–Cl−·HCO3− type, with Na+ and Cl– concentrations more than 10 times higher than other areas (the highest EC value in this study; Figure 7a). The Na/Cl and Ca/Cl molar ratios in the groundwater at No.39 are 0.76–0.89 and 0.24–0.77, respectively. The Na/Cl ratio is close to the present seawater value (0.86), but the Ca/Cl ratio is unusually high compared to the seawater value (0.02). This Ca-rich water is most likely of fossil seawater origin. Seasonal variation is also observed more pronounced than in other sites (Figure 10c). From these results, it is likely that this groundwater is mixed with fossil seawater and the dilution by precipitation or river water is changing seasonally.
The groundwater at Sites 1 and 42 has similar HCO3– concentration to other groundwaters but is slightly rich in Na+ and K+, Mg2+. These groundwaters are located west of the Oyabe River and are close to mountainous areas, so it is assumed that atmospheric CO2 or CO2-rich groundwater of organic origin is infiltrating into the ground. The increase in Mg concentration may also reflect the reaction with basic or ultrabasic rocks in the region.
4.5. Groundwater Flow in the Sho River Alluvial Fan and Heat Utilization
To use GSHP safely, water movement and groundwater quality are important parameters. In particular, the use of open-type GSHP is recommended in areas with high groundwater flow, such as the Sho River alluvial fan, as it is inexpensive. In this case, groundwater must be abundant and have a stable temperature. There are seasonal variations in the groundwater temperatures in the southern area, namely, warm in summer and cold in winter. Because the temperature differences between the groundwater temperature and air temperature are small, indoor heating and cooling using open-type GSHPs cannot be used. Although higher initial costs are involved, it is considered that closed-type heat pumps can extract heat at a constant temperature by using a well drilled to a depth of greater than 10 m and without using groundwater.
When an open-type GSHP is used, groundwater is pumped, and heat is exchanged on the ground. Accordingly, CaCO3 (calcite), FeOOH, and Fe(OH)3 scales may precipitate in the heat exchangers and pipes. The possibility of scale precipitation in groundwater of the Sho River alluvial fan was studied by calculating the saturation degree of scale components. In this study, the saturation degree (SI) of CaCO3 (calcite) was determined for the groundwater for August (Figure 11). The SI was defined using the following equation and calculated using a PhreeqC code [43]:
where Q is the activity product calculated using the chemical analysis value for the groundwater and K is the equilibrium constant of the mineral (solubility product). When SI was less than 0, mineral precipitation did not take place because the groundwater was undersaturated in terms of minerals. When SI was greater than 0, mineral precipitation can take place owing to supersaturation. The results showed that groundwater is undersaturated with respect to calcium carbonate. Iwatake et al. [15] discussed the scales of calcite and Fe compounds including deep groundwater in the Sho River area, and above pH 7.5, some groundwater is oversaturated with respect to calcite. As for Fe, it is pointed out that the groundwater is oversaturated with FeOOH, although the Fe concentration is low (2.4–3.0 μg/L) in all areas. At Kawada Industry Co., Ltd., which is Site P1 (Figure 1b) from which precipitation was collected, an open-type GSHP has been introduced and has operated for several years using groundwater. At this location, the saturation index of goethite was also positive, the formation of iron scale was confirmed in the GSHP of Kawada Kogyo Co., Ltd., and the groundwater filter was periodically cleaned [44].
(SI) = log (Q/K)
In the Sho River alluvium fan area, more than 120 million tons/year of groundwater are pumped for snowmelt, and there is enough groundwater to cover it [1]. Therefore, this paper considered to classify regions suitable for open-type GSHP and regions more suitable for closed-type than open-type GSHP (Figure 12). For the selection of regions suitable for the open-type GSHP, we chose regions where water temperature fluctuations were within ±2 °C throughout the year and where problems such as scaling (deposition of carbonate minerals) did not occur (Region A in Figure 12). As a second candidate, we chose regions where the temperature difference between water temperature and air temperature was not large due to the large water temperature fluctuations, but where the groundwater level was expected to be stable, so that the open-type GSHP was determined to be feasible (Region B). The use of closed-type GSHPs near Hodatsu Hill in the southern and western regions looks promising due to scale issues and large groundwater fluctuations throughout the year (Region C).
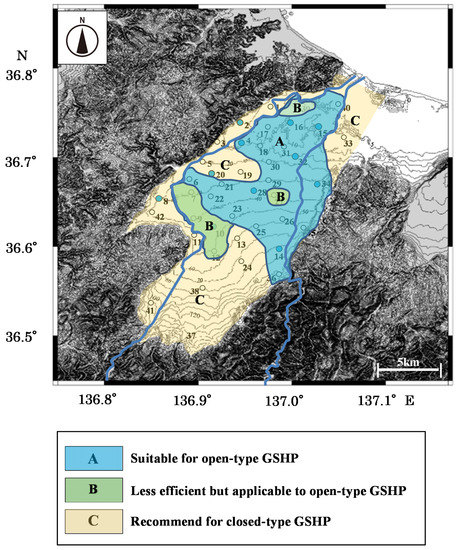
Figure 12.
A map showing the study area where open-type ground source heat-pump systems (GSHPs) are recommended. Region A—suitable for open-type GSHP; Region B—less efficient to applicable to open-type GSHP; Region C—recommend for closed-type GSHP.
5. Conclusions
The Sho River alluvium fan area in Toyama Prefecture is saturated with groundwater, and the use of inexpensive open-type GSHP has been proposed. Previous studies measured the chemical and isotope composition of groundwater and river water at one site and discussed the hydrology. In this study, samples were collected monthly at 11 sites and bimonthly at 31 sites to investigate seasonal changes in chemical and oxygen isotope compositions. The results showed that the groundwater is mainly formed by the mixing of Sho River water and precipitation, but fluctuates seasonally. As a suitable site for an open-type GSHP, we selected an area where the annual water temperature is almost constant and calcium carbonate scale does not precipitate. Since the Sho River alluvium fan area has abundant groundwater, it is judged that these areas can be used for efficient groundwater heat utilization, indoor heating, greenhouse cultivation, and land breeding for fisheries.
Author Contributions
Investigation, K.I., A.U.; writing—original draft preparation, K.I.; writing—review and editing, A.U. All authors have read and agreed to the published version of the manuscript.
Funding
This research received no external funding.
Acknowledgments
The authors wish to thank members of the Geochemical Laboratory of the University of Toyama for their kind advice and cooperation during this study, especially J. Zhang, M. Kusakabe, K. Horikawa, and N. Okakita. The authors would like to thank the academic editors and the anonymous reviewers for their critical, kind, and constructive comments which have helped us tremendously to improve the manuscript.
Conflicts of Interest
The authors declare no conflict of interest.
References
- Toyama Prefecture. Groundwater Guidelines Toyama; Toyama Prefecture: Toyama, Japan, 2006; 29p, Available online: http://www.pref.toyama.jp/cms_pfile/00001661/00066924.pdf (accessed on 21 August 2021). (In Japanese)
- Andritsos, N.; Karabelas, A.J. Calcium carbonate scaling in a plate heat exchanger in the presence of particles. J. Heat Mass Transf. 2003, 46, 4613–4627. [Google Scholar] [CrossRef]
- Lei, C.; Peng, Z.; Day, T.; Yan, X.; Bai, X.; Yuan, C. Experimental observation of surface morphology effect on crystallization fouling in plate heat exchangers. Int. Commun. Heat Mass Transf. 2011, 38, 25–30. [Google Scholar] [CrossRef]
- Wang, Y.; Wong, K.L.; Liu, Q.; Jin, Y.; Tu, J. Improvement of energy efficiency for an open-loop surface water source heat pump system via optimal design of water-intake. Energy Build. 2012, 51, 93–100. [Google Scholar] [CrossRef]
- Mizutani, Y.; Oda, M. Stable isotope study of ground water recharge and movement in the Shogawa Fan, Toyama. Chikyu-Kagaku 1982, 17, 1–9, (In Japanese with English abstract). [Google Scholar]
- Li, F.; Pan, G.; Tang, C.; Zhang, Q.; Yu, J. Recharge source and hydrogeochemical evolution of shallow groundwater in a complex alluvial fan system, southwest of North China Plain. Environ. Geol. 2008, 55, 1109–1122. [Google Scholar] [CrossRef]
- Hidalgo, M.C.; Cruz-Sanjulian, C. Groundwater composition, hydrochemical evolution and mass transfer in a regional detrital aquifer (Baza basin, southern Spain). Appl. Geochem. 2001, 16, 745–758. [Google Scholar] [CrossRef]
- Mizutani, Y.; Satake, H.; Yamabe, A.; Miyachi, H.; Mase, N.; Yamamura, K. Hydrogen and oxygen isotope ratios of groundwaters in shallow aquifers beneath the alluvial fan. J. Groundw. Hydrol. 2001, 43, 3–11, (In Japanese with English abstract). [Google Scholar] [CrossRef][Green Version]
- Chkirbene, A.; Tsujimura, M.; Charef, A.; Tanaka, T. Hydro-geochemical evolution of groundwater in an alluvial aquifer: Case of Kurokawa aquifer, Tochigi prefecture, Japan. Desalination 2009, 246, 485–495. [Google Scholar] [CrossRef]
- Yuan, R.; Song, X.; Zhang, Y.; Han, D.; Wang, S.; Tang, C. Using major ions and stable isotopes to characterize recharge regime of a fault-influenced aquifer in Beiyishui River Watershed, North China Plain. J. Hydrol. 2011, 405, 512–521. [Google Scholar] [CrossRef]
- Vanderzalm, J.L.; Jeuken, B.M.; Wischusen, J.D.H.; Pavelic, P.; Le Gal La Salle, C.; Knapton, A.; Dillon, P.J. Recharge sources and hydrogeochemical evolution of groundwater in alluvial basins in arid central Australia. J. Hydrol. 2011, 397, 71–82. [Google Scholar] [CrossRef]
- Tsuchihara, T.; Yoshimoto, S.; Ishida, S.; Imaizumi, M. Classification of recharge sources of groundwater in a paddy dominant alluvial fan based on geochemical and isotopic analyses. Bull. Natl. Inst. Rural. Eng. 2011, 211, 21–34, (In Japanese with English abstract). [Google Scholar]
- Takizawa, T. Underground heat utilization technology 8: Water quality measures for underground heat utilization. J. Jpn. Soc. Groundw. 2011, 53, 401–409, (In Japanese with English abstract). [Google Scholar]
- Ioka, S.; Muraoka, H.; Marui, A.; Ikawa, R. Evaluation of groundwater quality for an open-system geothermal heat pump system in the Pacific coast area of Aomori Prefecture. J. Geotherm. Soc. Jpn. 2013, 35, 111–117, (In Japanese with English abstract). [Google Scholar]
- Iwatake, K.; Mizoguchi, T.; Tomiyama, S.; Zhang, J.; Satake, H.; Ueda, A. Geochemical study of groundwater in the Sho river fan, Toyama Pre fecture for heat usage by geothermal heat pump. Geochem. J. 2013, 47, 577–590. [Google Scholar] [CrossRef]
- Yamada, Y.; Ueda, A. Geochemical hydrological analysis of subsurface water system of Sabae Basin, Fukui Prefecture for heat utilization. Chikyukagaku 2018, 52, 73–94, (In Japanese with English abstract). [Google Scholar]
- Mori, H.; Ogawa, Y.; Ueda, A. Geochemical and hydraulic analysis of groundwater for heat utilization around Sakuragaike in Nanto City, Toyama Prefecture, Japan. Environ. Earth Sci. 2020, 79, 483. [Google Scholar] [CrossRef]
- Okano, O.; Konishi, A.; Kita, A.; Ueda, A. Geochemical study for utilization of groundwater heat by open heat pump system in northern Okayama and Akaiwa city areas with low precipitation in Japan. Groundw. Sustain. Develop. 2020, 12, 100494. [Google Scholar] [CrossRef]
- Matsuura, T.; Tebakari, T.; Oda, A.; Ueda, A. Flow characteristics of artesian groundwater in coastal area of Kurobe River Basin, Toyama Prefecture, by long-term and spatial observation of water temperature and electric conductivity. Groundw. Sustain. Develop. 2021, 13, 100555. [Google Scholar] [CrossRef]
- Hartog, N.; Drijver, B.; Dinkla, I.; Bonte, M. Field assessment of the impacts of aquifer thermal energy storage (ATES) systems on chemical and microbial groundwater composition. In Proceedings of the European Geothermal Conference, Pisa, Italy, 3–7 June 2013. [Google Scholar]
- Saito, T.; Komatsu, T. Influence of geothermal heat pump on underground environment. J. Jpn. Soc. Groundw. 2014, 56, 15–25, (In Japanese with English abstract). [Google Scholar]
- Park, Y.; Kim, N.; Lee, J.-Y. Geochemical properties of groundwater affected by open loop geothermal heat pump systems in Korea. Geosci. J. 2015, 19, 515–526. [Google Scholar] [CrossRef]
- García-Gil, A.; Epting, J.; Garrido, E.; Vázquez-Suñé, E.; Lázaro, J.M.; Navarro, A.S.; Huggenberger, H.; Calvo, M.A.M. A city scale study on the effects of intensive groundwater heat pump systems on heavy metal contents in groundwater. Sci. Total Environ. 2016, 572, 1047–1058. [Google Scholar] [CrossRef]
- Gjengedal, S.; Stenvik, L.A.; Storli, P.-T.S.; Ramstad, R.K.; Hilmo, B.O.; Frengstad, B.S. Design of groundwater heat pump systems. Principles, tools, and strategies for controlling gas and precipitation problems. Energies 2019, 12, 3657. [Google Scholar] [CrossRef]
- Pophillat, W.; Bayer, P.; Teyssier, E.; Blum, P.; Attard, G. Impact of groundwater heat pump systems on subsurface temperature under variable advection, conduction and dispersion. Geothermics 2020, 83, 101721. [Google Scholar] [CrossRef]
- Pratiwi, A.S.; Trutnevyte, E. Life cycle assessment of shallow to medium-depth geothermal heating and cooling networks in the State of Geneva. Geothermics 2021, 90, 101988. [Google Scholar] [CrossRef]
- Kato, S.; Mizutani, Y.; Uchida, T.; Iida, C. Geochemical study of ground water systems in the Shogawa Fan, Toyama. Chikyu-Kagaku 1984, 18, 29–35, (In Japanese with English abstract). [Google Scholar]
- Mizutani, Y.; Satake, H.; Takashima, H. Tritium age of groundwaters from the Shogawa fan, Toyama. Chikyu-Kagaku 1987, 21, 49–54, (In Japanese with English abstract). [Google Scholar]
- Chen, C.; Wang, C.; Hsu, Y.; Yu, S.; Kuo, L. Correlation between groundwater level and altitude variations in land subsidence area of the Choshuichi Alluvial Fan, Taiwan. Engineer. Geol. 2010, 115, 122–131. [Google Scholar] [CrossRef]
- Geological Survey of Japan (Ed.) AIST 1/200,000 Japan Seamless Geological Survey; National Institute of Advanced Industrial Science and Technology: Tokyo, Japan, 2015.
- Japan Meteorological Agency past Weather Data (Fushiki, Toyama Prefecture). 2020. Available online: http://www.data.jma.go.jp/obd/stats/etrn/index.php?prec_no=55&block_no=47606&year=2012&month=&day=&view= (accessed on 10 June 2021).
- Yamamoto, T. Water temperature of groundwater. In Groundwater. Hydrology; Kyoritsu Shuppan: Tokyo, Japan, 1992; pp. 139–152. (In Japanese) [Google Scholar]
- Bartolino, J.R. The Rio Grande—Competing demands for a desert river. In Heat as a Tool for Studying the Movement of Ground Water Near Streams; Stonestrom, D.A., Constantz, J., Eds.; USGS Circular 1260; USGS: Reston, VA, USA, 2003; pp. 8–16. [Google Scholar]
- Bartolino, J.R.; Niswonger, R.G. Numerical Simulation of Vertical Ground-Water Flux of the Rio Grande from Ground-Water Temperature Profiles, Central New Mexico; US Department of the Interior, USGS: Albuquerque, NM, USA, 1999; Volume 99, p. 4212.
- Sekiya, K. Vertical distribution of groundwater temperature and its change—Approach to groundwater flow- Niigata. J. Appl. Geol. Res. 2003, 61, 19–25, (In Japanese with English abstract). [Google Scholar]
- Hanova, J.; Dowlatabadi, H. Strategic GHG reduction through the use of ground source heat pump technology. Environ. Res. Lett. 2007, 2, 044001. [Google Scholar] [CrossRef]
- Okakita, N.; Iwatake, K.; Hirata, A.; Ueda, A. Contribution of precipitation to groundwater flow systems in three major alluvial fans in Toyama Prefecture, Japan: Stable-isotope characterization and application to the use of groundwater for urban heat exchangers. Hydrologeol. J. 2019, 27, 345–362. [Google Scholar] [CrossRef]
- Epstein, S.; Mayeda, T. Variation of the 18O/16O ratio in natural waters. Geochim. Cosmochim. Acta 1953, 4, 213–224. [Google Scholar] [CrossRef]
- Piper, A. A graphic procedure in the geochemical interpretation of water-analyses. Trans. Amer. Geophy. Union 1944, 25, 914–928. [Google Scholar] [CrossRef]
- Stiff, H.A., Jr. The interpretation of chemical water analysis by means of patterns. J. Pet. Technol. 1951, 3, 15–16. [Google Scholar] [CrossRef]
- Hirata, H.; Yoo, S.-Y.; Iwatake, K.; Tebakari, T.; Okakita, N.; Zhang, J.; Ueda, A. Geochemical study and fluid flow simulation of a groundwater system in Toyama and Joganji alluvial fans, central Japan, and assessment of suitability for heat utilization. Geothermics 2020, 93, 102073. [Google Scholar] [CrossRef]
- Appelo, C.A.J.; Postma, D. Geochemistry, Groundwater and Pollution; CRC Press: Boca Raton, FL, USA, 2005; ISBN 9780415364287. [Google Scholar]
- Parkhurst, D.L.; Appelo, C.A.J. Users guide to PHREEQC (Version2)–A computer program for speciation, batch-reaction, one-dimensional transport, and inverse geochemical calculations. Water-Resour. Investig. Rep. 1999, 99, 312. [Google Scholar]
- Kushida, K.; Katsumata, M.; Shimizu, R.; Kawada, S.; Ueda, A. Open geothermal heat pump system: An example of a geothermal heat pump system in Nanto, Toyama Pref. Jpn. Geotherm. Soc. 2011, 27. (In Japanese) [Google Scholar]
Publisher’s Note: MDPI stays neutral with regard to jurisdictional claims in published maps and institutional affiliations. |
© 2021 by the authors. Licensee MDPI, Basel, Switzerland. This article is an open access article distributed under the terms and conditions of the Creative Commons Attribution (CC BY) license (https://creativecommons.org/licenses/by/4.0/).