Next Article in Journal
Search for Ancient Selection Traces in Faverolle Chicken Breed (Gallus gallus domesticus) Based on Runs of Homozygosity Analysis
Previous Article in Journal
Assessment of Common Hematologic Parameters and Novel Hematologic Ratios for Predicting Piroplasmosis Infection in Horses
 
 
Due to scheduled maintenance work on our database systems, there may be short service disruptions on this website between 10:00 and 11:00 CEST on June 14th.
Article

Mitochondrial PCGs Provide Novel Insights into Subspecies Classification, Codon Usage and Selection of Cervus canadensis Distributed in Qinghai and Gansu, China

1
State Key Laboratory for Molecular Biology of Special Economic Animals, Institute of Special Animal and Plant Sciences, Chinese Academy of Agricultural Sciences, Changchun 130112, China
2
College of Animal Science and Technology, Gansu Agricultural University, Lanzhou 730070, China
3
Guangdong Chimelong Group, Guangzhou 511400, China
*
Author to whom correspondence should be addressed.
These authors contributed equally to this work.
Animals 2025, 15(10), 1486; https://doi.org/10.3390/ani15101486
Submission received: 15 April 2025 / Revised: 17 May 2025 / Accepted: 18 May 2025 / Published: 20 May 2025
(This article belongs to the Section Animal Genetics and Genomics)

Simple Summary

This study aimed to clarify the taxonomic status of Cervus canadensis distributed in Qinghai and Gansu, China, and to characterize the mitogenome of the populations. We analyzed 89 individuals of Cervus canadensis from five geographic populations in Qinghai and Gansu. Phylogenetic trees grouped the 89 individuals into the subspecies C. c. kansuensis. Analyses of mitochondrial PCGs revealed the biases of nucleotide composition and codon usage in mitogenomes of these populations. Furthermore, our findings confirmed that natural selection plays a critical role in shaping these biases. This work provides the first comprehensive analysis of mitochondrial characteristics in C. c. kansuensis, establishing basic data for further studies on mitogenomes of Cervus elaphus (Linnaeus, 1758).

Abstract

Although Cervus elaphus (Linnaeus, 1758) has been well studied, the subspecific taxonomy of Cervus canadensis populations in Qinghai and Gansu, China, is still controversial, and the mitochondrial characteristics of Cervus elaphus (Linnaeus, 1758) remain incompletely understood. We assembled 89 mitogenomes of C. canadensis from five geographical populations across Qinghai and Gansu. Phylogenetic analysis confirmed that the 89 individuals are taxonomically classified as C. c. kansuensis. Nucleotide compositions showed a higher abundance of adenine and cytosine compared to guanine and thymine in both complete mitogenomes and mitochondrial PCGs. Codon usage analysis revealed a strong preference towards A-ending codons (68.04% of over-represented codons, RSCU > 1.6) in mitochondrial PCGs, with systemic avoidance of G-ending codons (53.30% of unused codons, RSCU = 0). The CAMs of 13 PCGs are reported for the first time. Furthermore, the ENC plot showed that the codon usage of all PCGs was biased except for gene ATP8. The PR2 bias plot showed that gene ND6 exhibited bias towards T3 and G3, whereas the other genes preferred A3 and C3. Both the ENC-plot and PR2 bias plot suggested that natural selection played an important role in the forces driving codon usage bias in mitochondrial PCGs. Our results demonstrate the subspecific status of C. canadensis distributed in Qinghai and Gansu as C. c. kansuensis, and provide insights into the mitochondrial characteristics of C. c. kansuensis. The mitogenome sequences assembled in this study provide valuable data for further understanding of the Cervus elaphus (Linnaeus, 1758) mitogenome.

1. Introduction

In past decades, Cervus elaphus (Linnaeus, 1758) has been a subject of prolonged taxonomic debate, attracting widespread attention from researchers [1,2,3,4,5,6]. The currently acknowledged taxonomic consensus is that the genus Cervus comprises three red deer species: Cervus elaphus, Cervus canadensis and Cervus hanglu [6,7,8,9]. Following the consensus, there are seven subspecies of C. canadensis distributed in China (C. c. wallichi, C. c. macneilli, C. c. kansuensis, C. c. songaricus, C. c. sibiricus, C. c. xanthopygus and C. c. alashanicus (also named as C. c. alxaicus)) [7,10,11,12,13], of which, C. c. kansuensis is distributed across Qinghai, Gansu, and northern Sichuan, and C. c. macneilli is endemic to western Sichuan and eastern Xizang. However, the IUCN Red List of Threatened Species (https://www.iucnredlist.org) recognizes only five subspecies of C. canadensis distributed in China (C. c. wallichi, C. c. macneilli, C. c. sibiricus, C. c. xanthopygus and C. c. alashanicus), wherein populations from Qinghai and Gansu are taxonomically grouped under C. c. macneilli. Therefore, further research is needed to clarify the subspecies status of C. canadensis distributed in Qinghai and Gansu.
A mitogenome is characterized by its small size, conserved structure, rapid evolutionary rate, maternal inheritance and exceptionally limited recombination [14,15,16,17,18], and they have been widely used in studies of origin and evolution, genetic diversity and phylogeny [3,6,7,9,19]. Generally, the complete mitogenome of vertebrates is circular and contains 22 tRNA genes, 13 protein-coding genes (PCGs), 2 rRNA genes and 1 control region [20]. Mitochondrial protein-coding sequences have been identified not only as essential tools for studying mitochondrial gene expression and functional regulation but also as valuable resources in characterizing mitochondrial features [21,22]. Previous studies have shown that the mitogenome of Cervus elaphus (Linnaeus, 1758) exhibits typical genome organization, comprising 37 genes and one control region [12,13,23,24,25,26,27,28,29]. However, few studies on the mitogenome of Cervus elaphus (Linnaeus, 1758) have been carried out, and its characteristics remain incompletely elucidated.
In this study, we collected 89 C. canadensis samples from five geographic populations across Qinghai and Gansu, China, and successfully assembled their complete mitogenomes. To clarify the subspecific status of these populations, phylogenetic trees were constructed using mitochondrial sequences under multiple schemes. Then, a series of analyses based on mitochondrial PCGs were performed to investigate the mitochondrial characteristics. Our results not only illustrated the subspecific status of C. canadensis distributed in Qinghai and Gansu, but also provided novel insights into the characteristics of mitochondrial genes in C. c. kansuensis. Furthermore, the 89 complete mitogenomes generated in this study significantly expand the mitochondrial genomic database for Cervus elaphus (Linnaeus, 1758), providing an essential data resource for future phylogenetic analysis and the mitochondrial characterization of Cervus elaphus (Linnaeus, 1758).

2. Materials and Methods

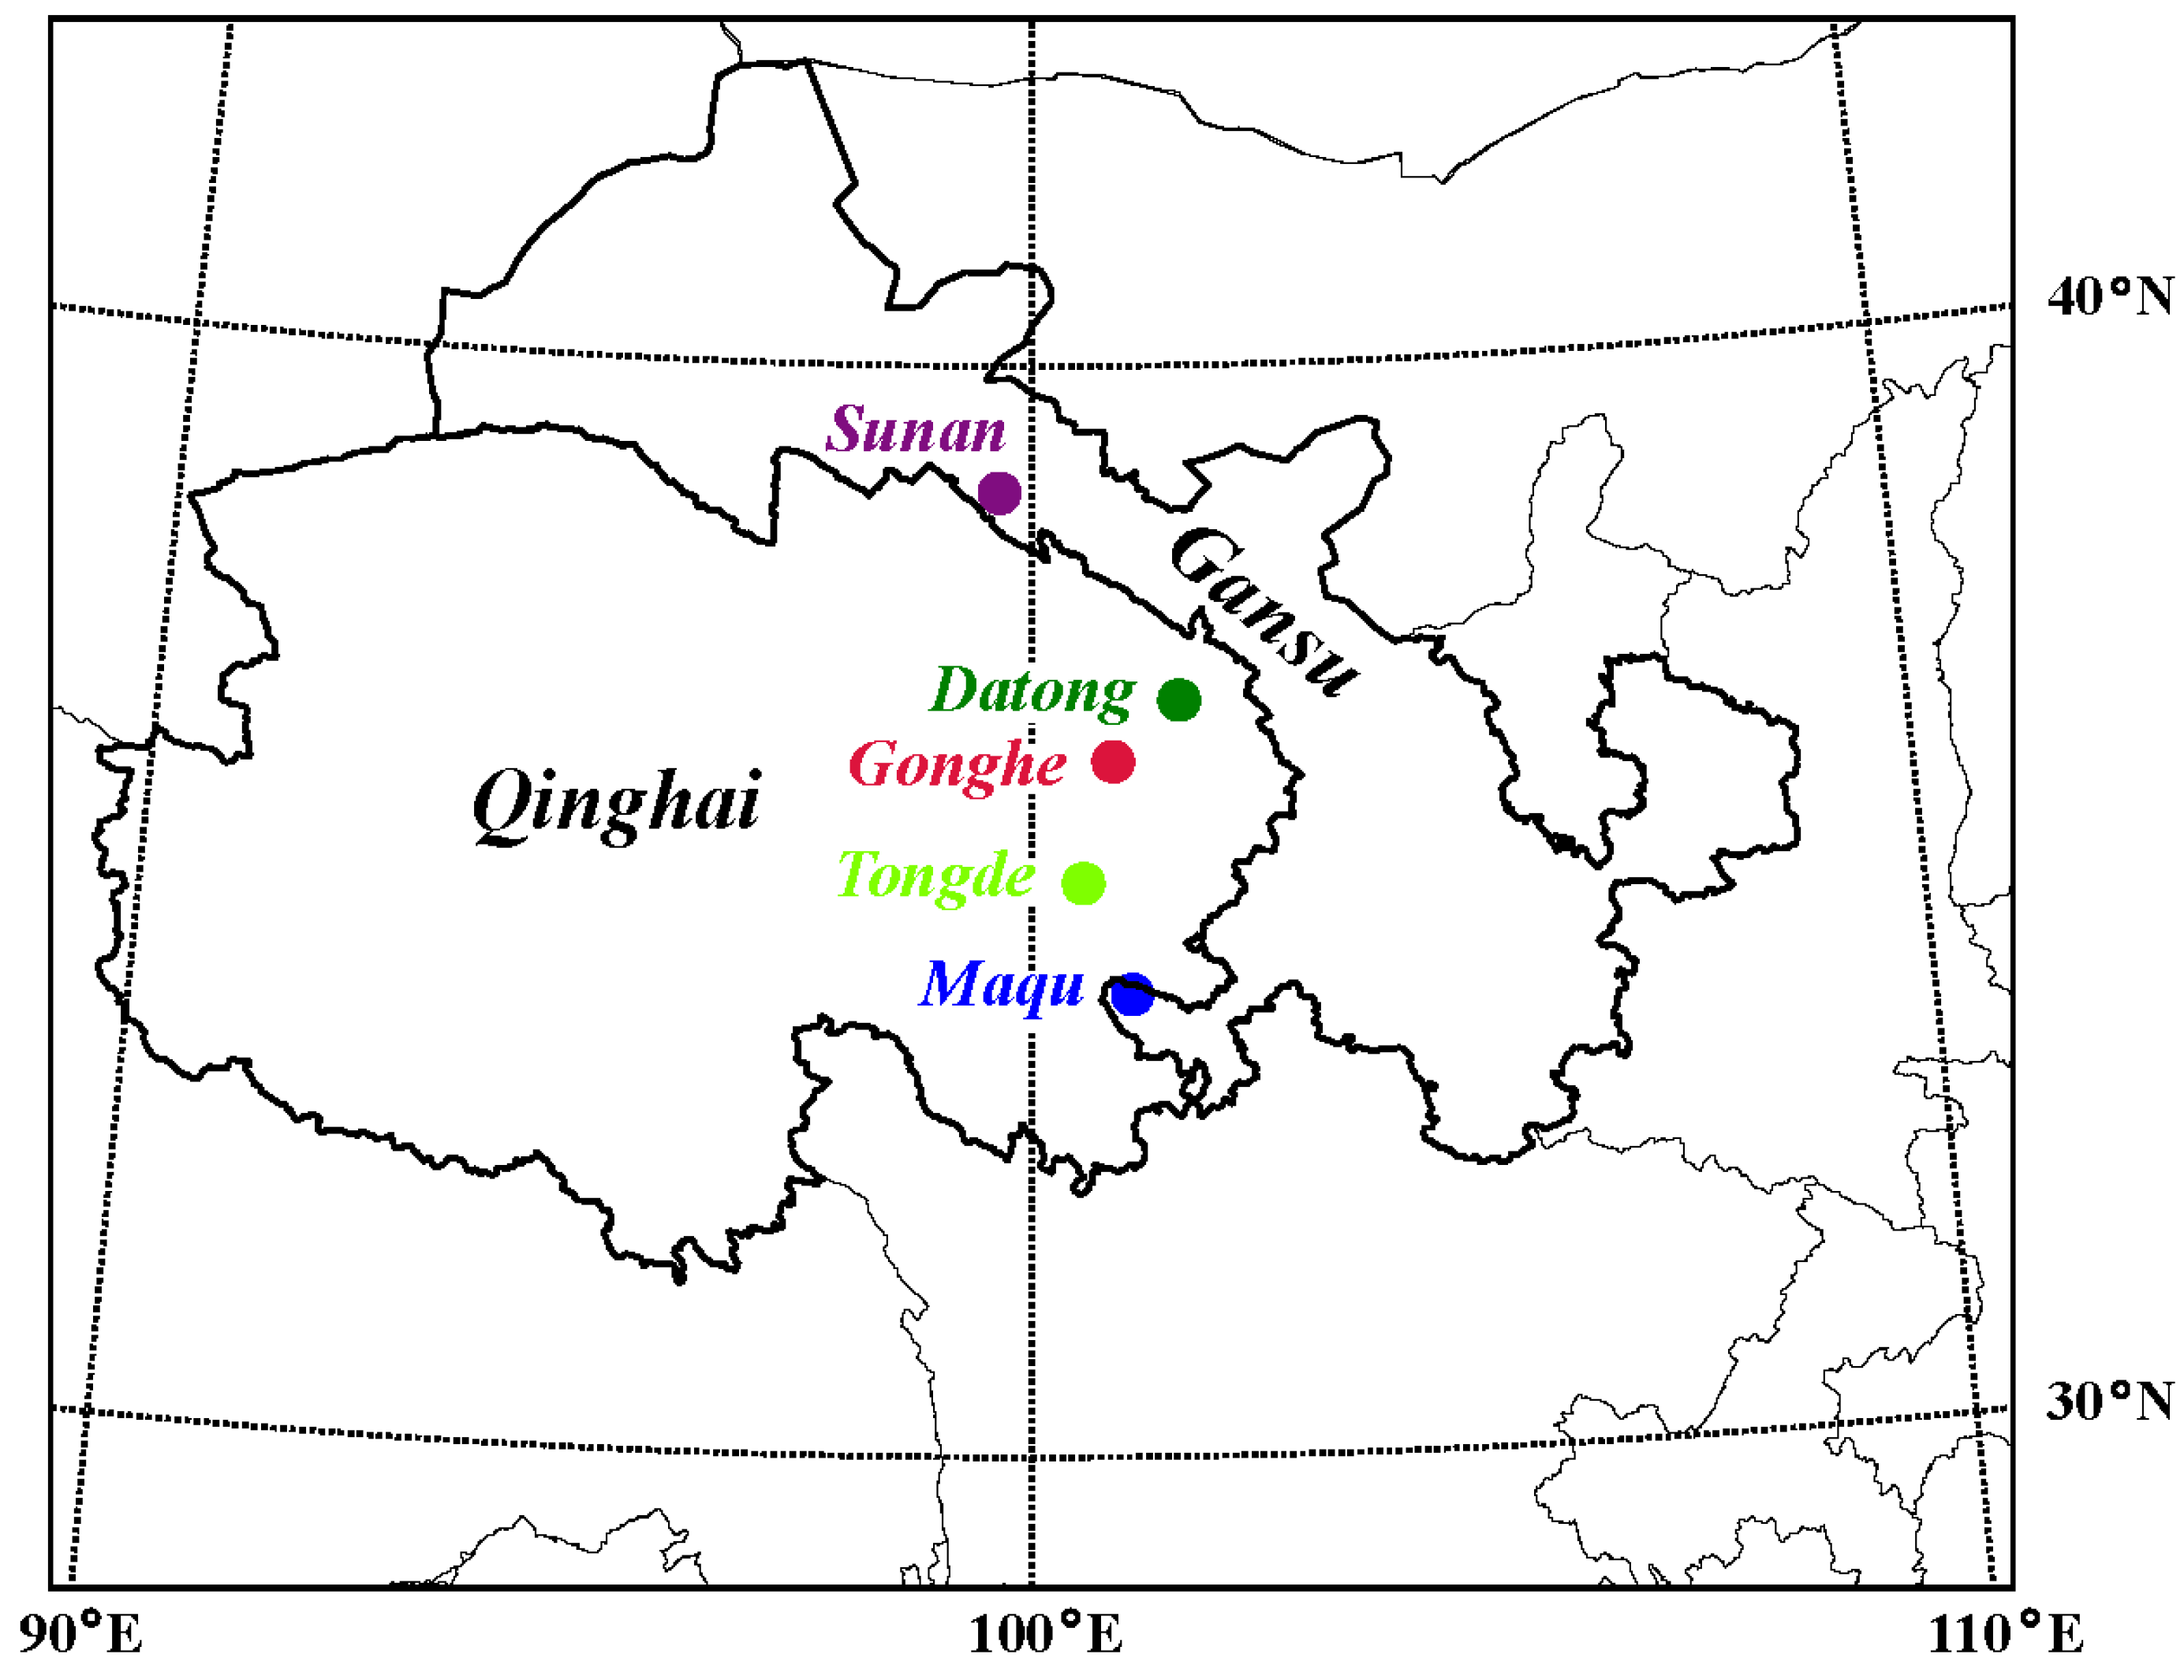
2.1. Sample Collection, DNA Extraction and Sequencing

Overall, 89 samples of C. canadensis from five geographic populations in Qinghai and Gansu, China, were collected (Figure 1): 23 from Gonghe county (Gonghe), 20 from Sunan Yugur Autonomous County (Sunan), 30 from Maqu county (Maqu), 10 from Tongde county (Tongde) and 6 from Datong Hui and Tu Autonomous County (Datong). Among the 89 samples, 23 frozen velvet antlers (from Gonghe) and 26 ossified antlers (20 from Sunan, 6 from Tongde) were obtained from local farmers; the remaining 40 intravenous blood samples (10 from Datong, 30 from Maqu) were collected from anesthetized deer (Table 1). All animal study protocols were approved by the Animal Care and Use Committee of the Chinese Academy of Agricultural Sciences (approval number: ISAPSAEC-2024-034). Genomic DNA was extracted for each sample with FastPure® Cell/Tissue DNA Isolation Mini Kit (Nanjing Vazyme Biotech Co., Ltd., Nanjing, China) following the standard protocol. DNA was sequenced on the Novaseq 6000 Platform of Illumina (Illumina, San Diego, CA, USA) with a PE150 sequencing method. The process of DNA sequencing took place at the Tianjin Sequencing Center, Novogene Biotech Co., Ltd., Beijing, China.

2.2. Mitochondrial Genome Assembly and Annotation

Raw reads sequenced were filtered using fastp v0.23.2 [30] to remove unqualified reads. Then, the filtered reads were mapped to the reference sequence downloaded from NCBI (Accession Number: NC_039923; Subspecies: C. c. kansuensis). Read mappings were conducted by BWA v0.7.15 [31]. SAM and BAM files were processed using samtools v1.15.1 [32], including the extraction of mapped reads and the transition of BAM to Fastq. Mitogenomes were assembled using MITObim v1.9.1. MITOS v2.1.5 [33] and MitoZ v3.5 [34] was used to identify gene features. Reference data refseq89m (https://zenodo.org/records/4284483, accessed on 29 December 2023) was used for the MITOS process and the “Chordata” clade was specified for the MitoZ process.

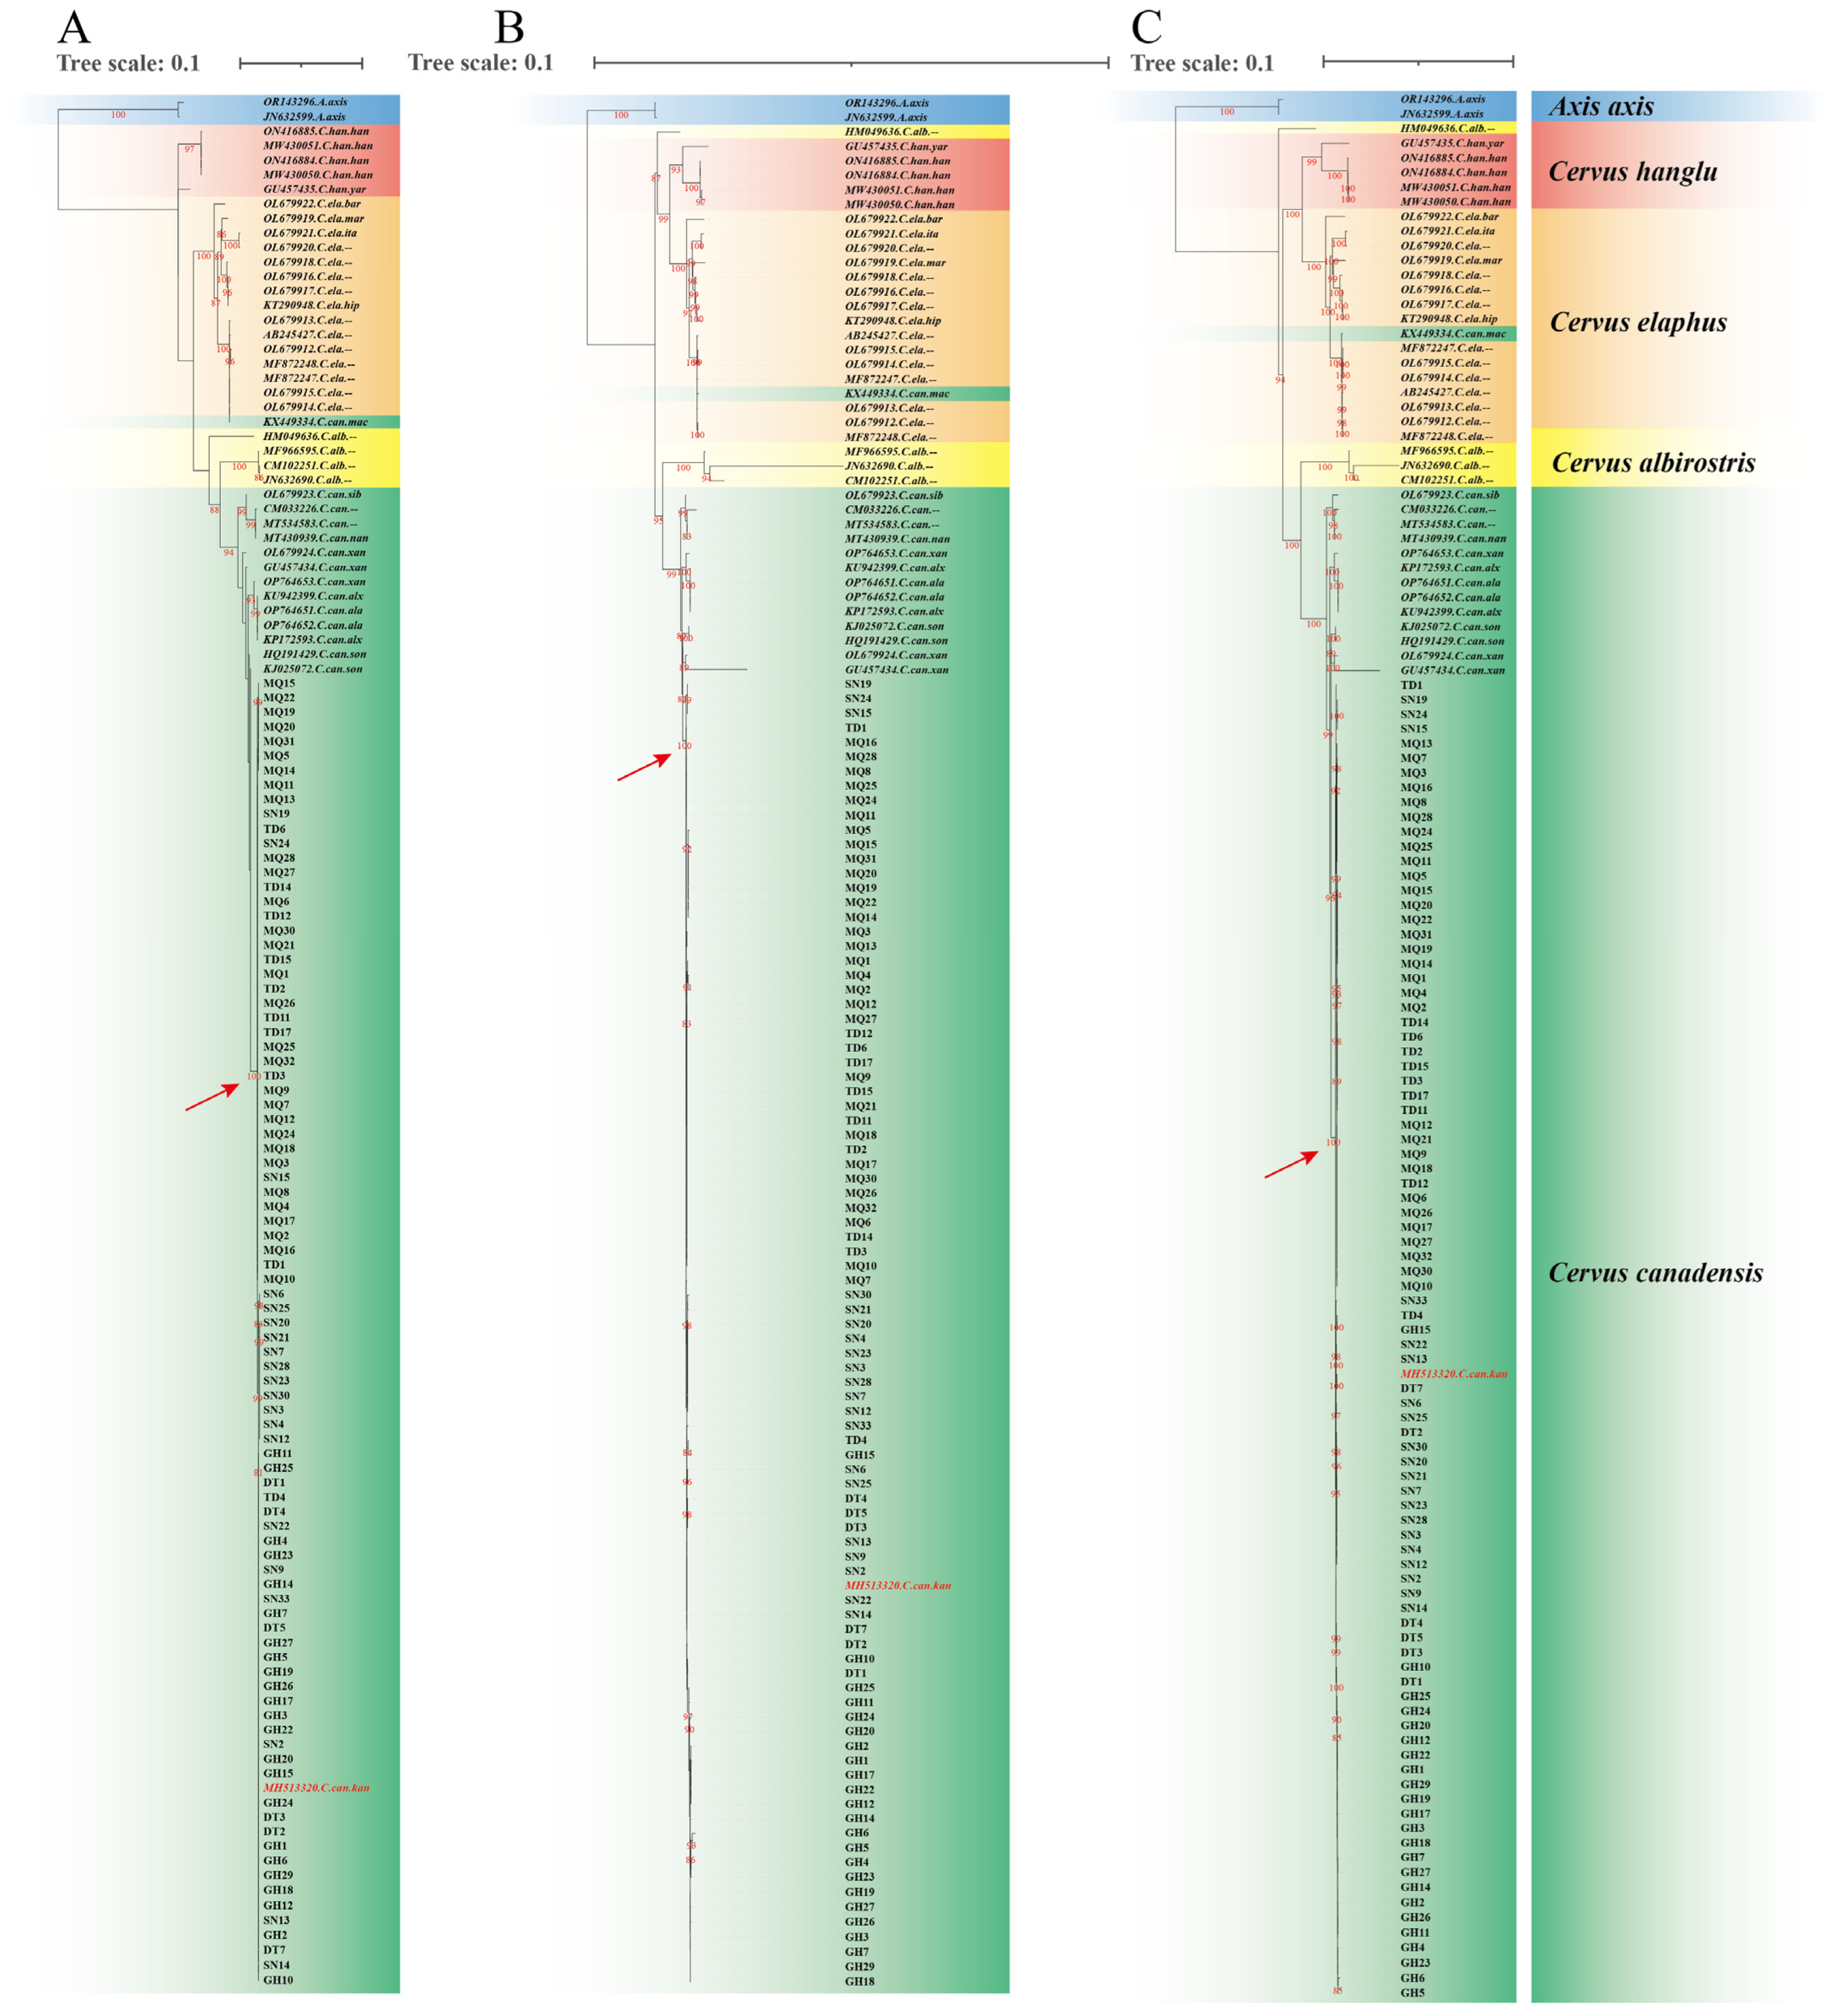
2.3. Phylogenetic Analysis

In total, thirty-nine complete mitogenomes covering seven subspecies of C. canadensis, four subspecies of C. elaphus, two subspecies of C. hanglu, and four individuals of C. albirostris downloaded from NCBI were used to investigate the phylogeny of the 89 C. canadensis individuals. Two sequences of Axis axis (JN632599 and OR143296) were used as an outgroup (Table 2). Phylogenetic analyses were performed using a maximum-likelihood method under three analytical schemes [35,36]: (1) CYTB, nucleotide alignment of gene CYTB; (2) PCGs_nt12, nucleotide alignment of concatenated 13 PCGs with the first two codon positions; (3) PCGs, nucleotide alignment of concatenated 13 PCGs. Phylogenetic trees were calculated using IQ-TREE v2.2.2.6 [37]. The best-fit model for each alignment was estimated using the ModelFinder algorithm [38] as implemented in IQ-TREE v2.2.2.6. Branch support was evaluated with ultrafast bootstrap approximation [39] for 1000 replicates. Resultant trees were visualized using Interactive Tree of Life (iTOL, https://itol.embl.de, accessed on 12 November 2024).

2.4. Analysis of Mitochondrial Characteristics

Sequence alignments were performed using megacc v10.2.6 [41] with the MUSCLE Codon Alignment pattern. Nucleotide composition and the relative synonymous codon usage (RSCU) were calculated using MEGA v10.2.6 [41]. Skew values of PCGs were calculated using Formula (1) [42]:
AT-skew = (AT)/(A + T); GC-skew = (GC)/(G + C),
where A, T, G, and C represent the nucleotide frequencies of A, T, G, and C, respectively. The values for the effective number of codons (ENCs) were calculated using CodonW v1.4.4 (https://sourceforge.net/projects/codonw, accessed on 21 January 2024). To generate the standard curve in ENC-plot, GC3 values from 0 to 1 with an interval of 0.001 were used to compute the corresponding expected ENC values using Formula (2) [22]:
ENC = 2 + GC3 + 29/[GC32 + (1 − GC3)2].
GC3 represents the GC content of genes in its third codon positions. Parity Rule 2 (PR2) biases were analyzed using four-fold degenerate codons of PCGs. The extraction of four-fold degenerate codons and the statistics for the nucleotide composition of four-codon sequences were performed using Python (v3.8.6) scripts. A vertebrate mitochondrial genetic codon table was specified in all the related processes above.

3. Results and Discussion

3.1. Genome Composition and Organization

A total of 89 mitogenomes were assembled in this study. The length of these genomes varies from 16,428 bp to 16,450 bp, with GC content from 37.75 to 37.91%, showing a common feature of AT bias in mammalian mitogenomes [43]. The positive AT-skew values and negative GC-skew values indicated that adenine was more abundant than thymine, and cytosine was more abundant than guanine in the mitogenomes of the 89 individuals [44] (Table S1).
As previously described in several studies [12,23,25,26,27], the typical 37 genes and one control region were identified in each of the mitogenomes analyzed. The gene features were highly conserved across the 89 individuals: only 1 rRNA (rrnL), 2 tRNA (trnI and trnH), 1 PCG (ND5) and the control region exhibited a variation in length. Among the 13 PCGs, incomplete stop codons are commonly reported in gene COX3 (TA-), ND3 (T--/TA-) and ND4 (T--) [12,23,25,26,27]. In this study, while the typical incomplete stop codon (T--) in gene ND4 was observed, all 89 mitogenomes exhibited complete stop codons in both gene COX3 (TAG) and ND3 (TAG) (Table 3).

3.2. Phylogeny of Cervus canadensis

Mitochondrial sequences have been extensively used for phylogenetic studies of Cervinae [2,4,6,8,45], with the currently acknowledged taxonomy of Cervus elaphus (Linnaeus, 1758) being proposed on the basis of mitochondrial phylogenetic analyses [6]. In this study, we performed phylogenetic analysis using 41 complete mitogenomes downloaded from the NCBI and 89 newly assembled C. canadensis mitogenomes. According to the Bayesian information criterion, the best-fit models for CYTB, PCGs_nt12 and PCGs were HKY + F + G4, TPM2u + F + R2 and TPM2u + F + R2, respectively. The phylogenetic trees constructed using three schemes produced basically the same topologies (Figure 2). The 89 mitogenomes formed a well-supported clade (100% bootstrap) with C. c. kansuensis (MH513320), as indicated by red arrows, while being distinct from C. c. macneilli (KX449334). This result suggests the classification of 89 sampled individuals from five geographic populations across Qinghai and Gansu as C. c. kansuensis. The sequence KX449334 was derived from western Sichuan, the typical distribution area of C. c. macneilli [10,11]. Both our results and prior research [7] demonstrate clear different phylogeny between KX449334 and MH513320, supporting C. c. kansuensis and C. c. macneilli as different subspecies. However, future studies incorporating more comprehensive sampling across their distribution regions and additional molecular markers would further validate this taxonomic conclusion.

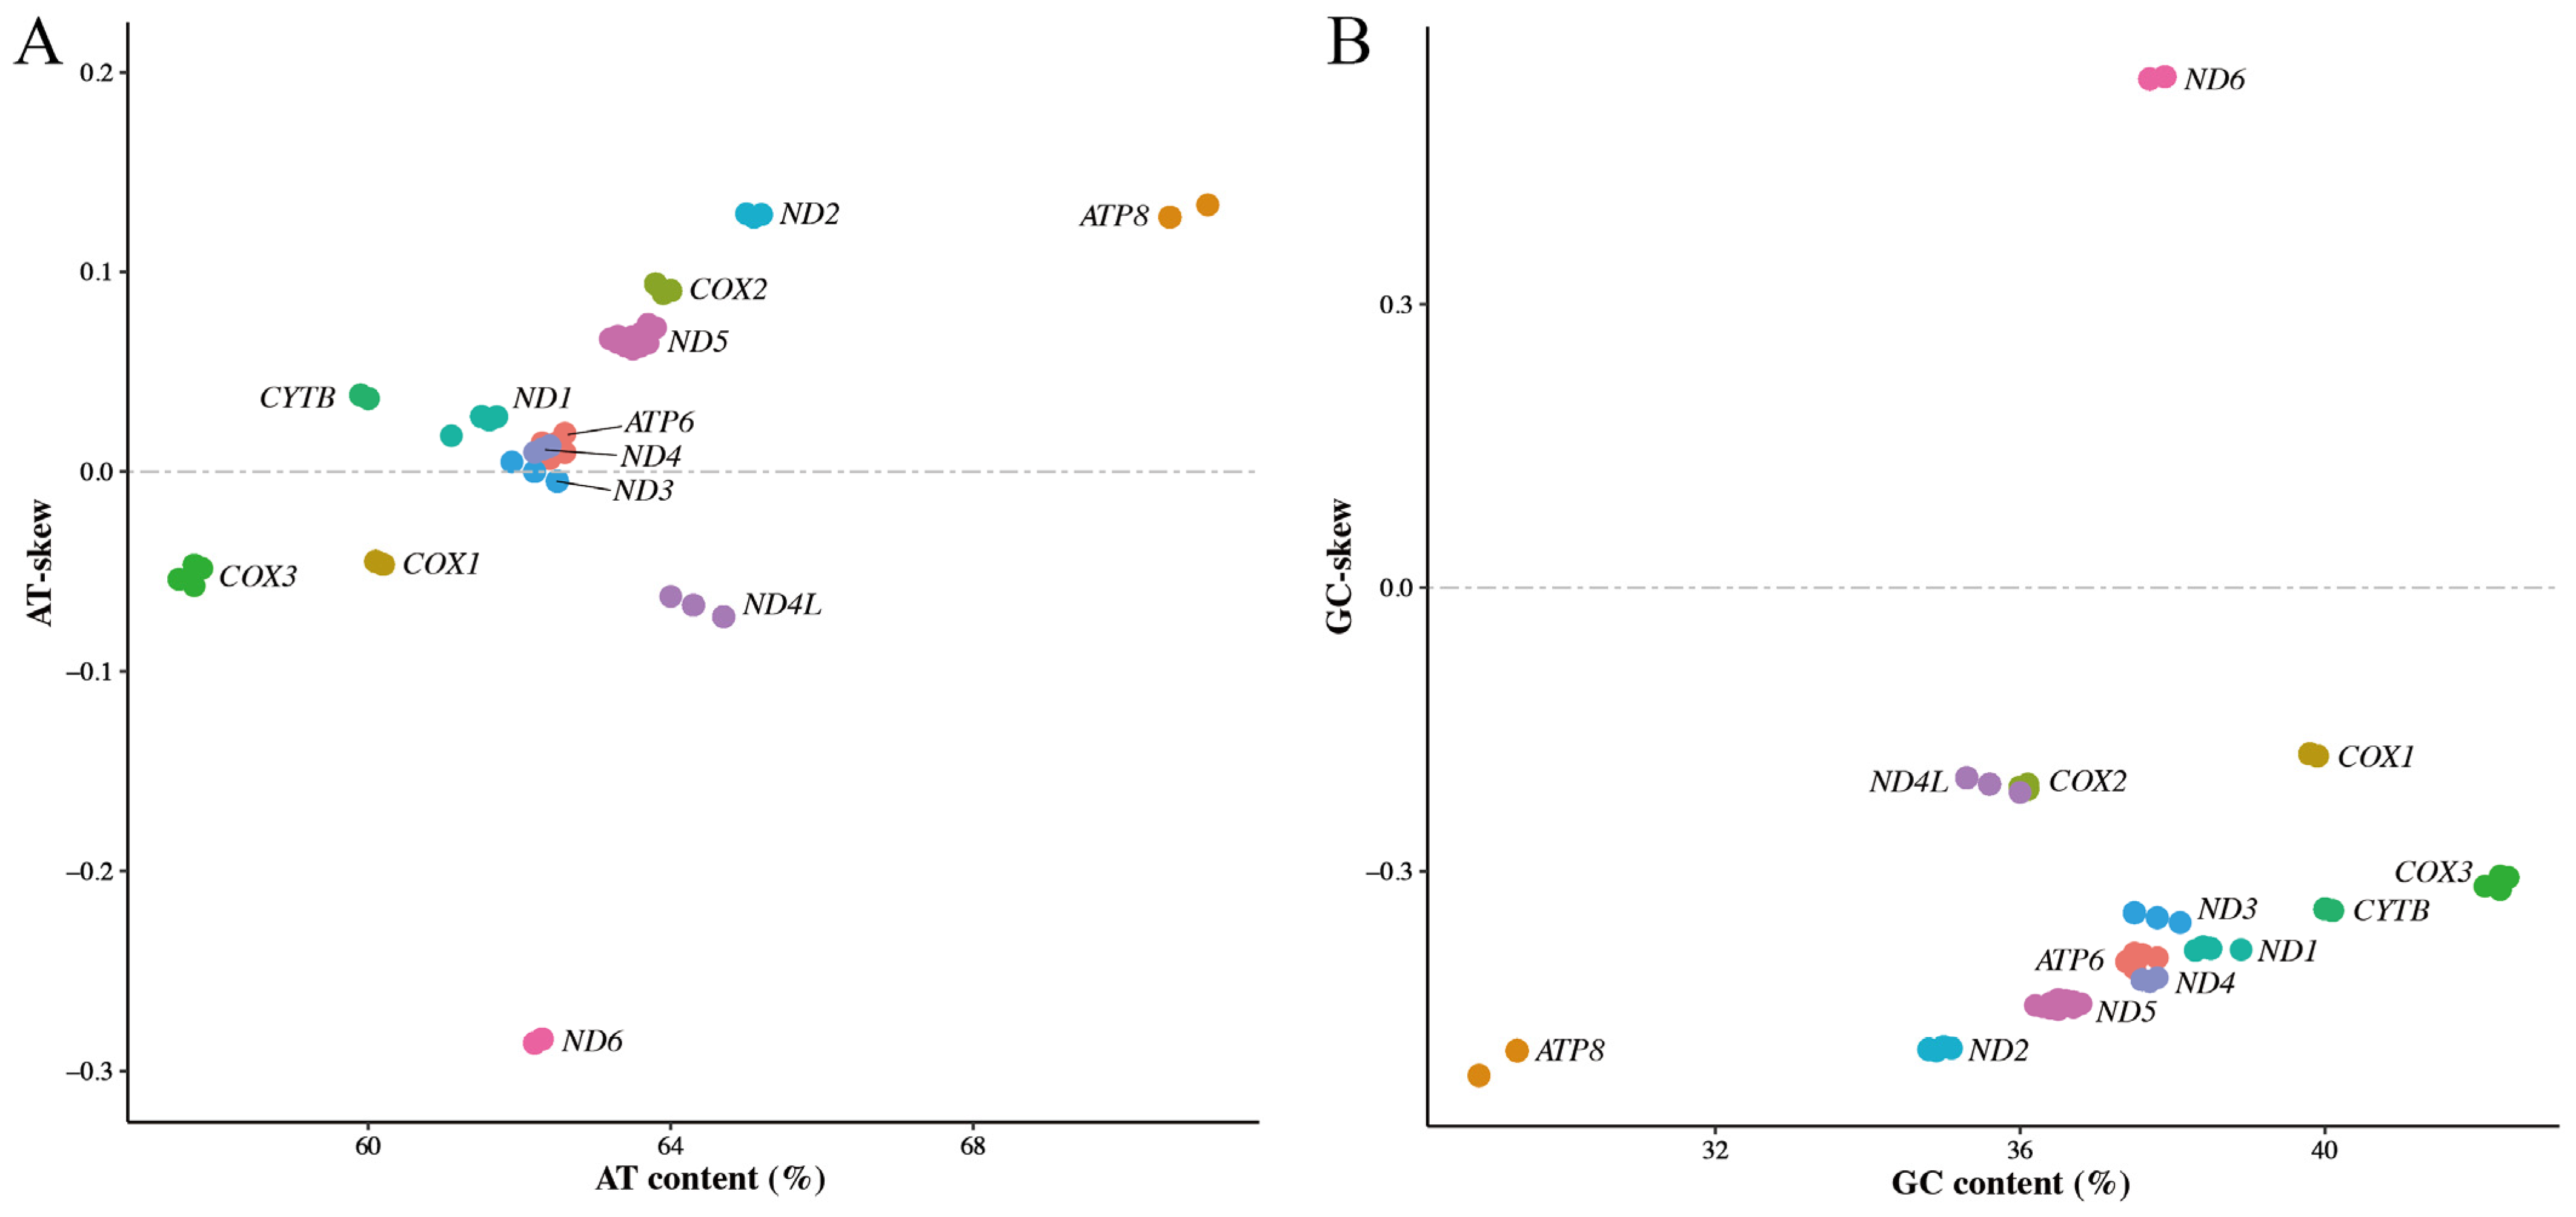
3.3. Nucleotide Bias of Mitochondrial Protein-Coding Genes

The skews of complete mitogenomes are useful to display the discrepancy of nucleotide composition among different species [44,46], while the skews of mitochondrial genes can reflect the bias in nucleotide composition of different genes in a species [43,47,48]. Here, the nucleotide composition and skews of mitochondrial PCGs were calculated. The skewness plots (Figure 3) were plotted using AT-skew (GC-skew) against the AT (GC) content [44]. The nucleotide composition results showed the GC contents were from 28.9% to 42.4% in 13 PCGs, and the AT contents were from 57.5% to 71.1%. The biases towards AT content occurred in each of the PCGs, similarly to what was previously reported for other species [43]. Moreover, our AT-skew plot (Figure 3A) highlighted eight PCGs (ATP8, ND2, COX2, ND5, CYTB, ND1, ATP6 and ND4) having positive skew values, and four PCGs (ND6, ND4L, COX3 and COX1) with negative skew values. The GC-skew plot (Figure 3B) showed that all PCGs had negative skew values except for gene ND6. These results are similar to those of the skewness of mitochondrial PCGs in Teressa goat [43] and India wild pig [47], where most of the mitochondrial PCGs had positive AT-skew values and negative GC-skew values. The positive AT-skew values and negative GC-skew values in most PCGs demonstrated the higher abundance of adenine and cytosine than guanine and thymine in mitochondrial PCGs of C. c. kansuensis.

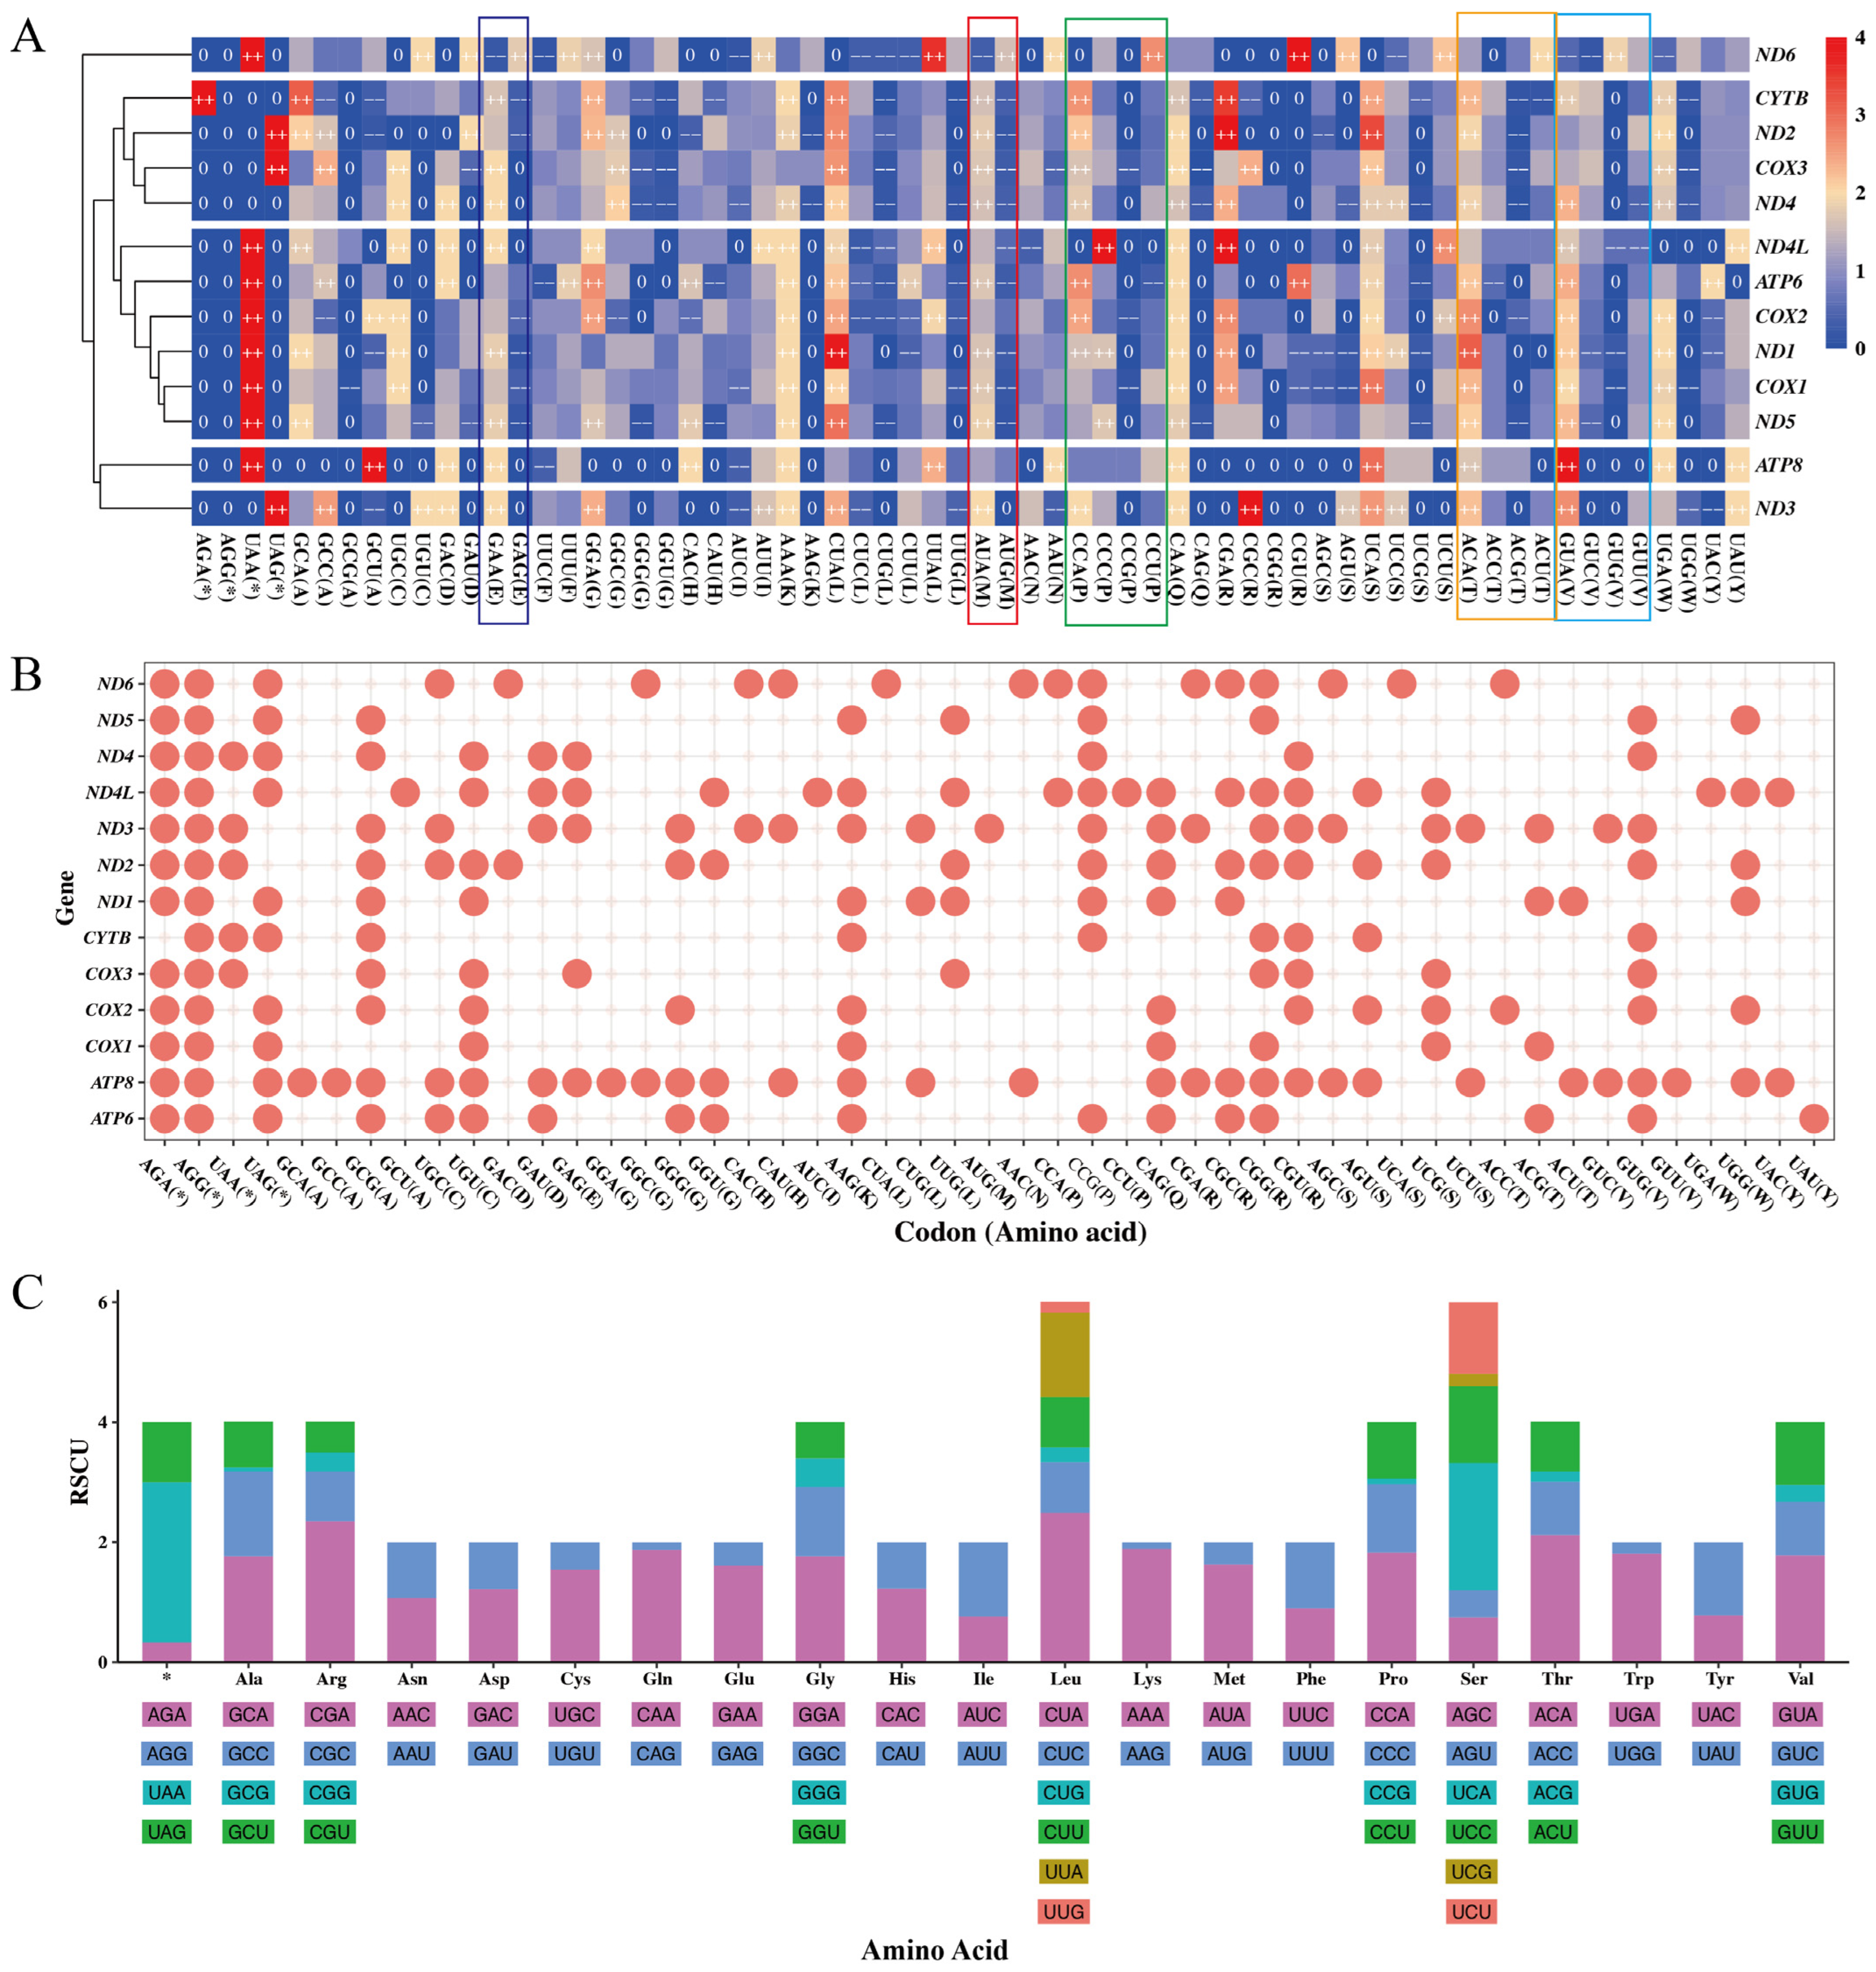
3.4. Codon Usage of Mitochondrial Protein-Coding Genes

Codon usage patterns (CUPs) refer to the non-random selection preferences exhibited by organisms for synonymous codons during the translation process [49,50]. The RSCU is helpful for detecting the CUPs for all synonymous codons in individual genes [51]. RSCU value is defined as the ratio of the observed frequency of a codon to its expected frequency, and is independent of the sequence length or amino acid composition [52]. Codons with an RSCU value greater than 1.6 or less than 0.6 are, respectively, regarded as over-represented or under-represented, while the others are considered unbiased or used randomly [53]. Notably, an RSCU value of 0 indicates complete absence of codon usage within individual genes, a phenomenon defined as codon aversion [54,55]. A set of codons unused by an individual gene is defined as codon aversion motif (CAM) [56]. Both the CUPs and CAMs are phylogenetically conserved, and so can be used in phylogenomic studies in the future [54,56]. Here, the mean RSCU values of each mitochondrial PCG in 89 individuals were calculated. The results revealed substantial codon usage biases among the 13 PCGs, with 63.82% of codons showing non-random CUPs: 25.48% unused codons (RSCU = 0), 15.02% under-represented codons (0 < RSCU < 0.6) and 23.32% over-represented codons (RSCU > 1.6). Strikingly, G-ending codons dominated the unused category, with a percentage of 53.30%, while A-ending codons were preferred among over-represented codons (68.04%). In contrast, U-ending and C-ending codons exhibited minor bias, accounting for 76.41% of unbiased codons (Table 4).
To better understand the CUPs of 13 mitochondrial PCGs in C. c. kansuensis, a hierarchical clustering heatmap was drawn using the mean RSCU value of each codon in each PCG (Figure 4A). The hierarchical clustering heatmap revealed different codon usage bias among the 13 PCGs. Notably, the gene ND6 preferentially used AUG as its start codon, whereas AUA was preferred in most other genes (highlighted by red rectangle). Similar codon preference patterns were observed for amino acid E (Glu), P (Pro), T (Thr), and V (Val), as indicated by colored rectangles in Figure 4A. According to the hierarchical clustering result, the CUPs of 13 PCGs can roughly be divided into five groups: (1) ND6; (2) ATP8; (3) ND3; (4) CYTB, ND2, COX3 and ND4; and (5) ND4L, ATP6, COX2, ND1, COX1 and ND5. Furthermore, following the definition of CAM [56], the CAM of a PCG comprises all its codons with an RSCU equal to 0. We visualized the CAMs of the 13 PCGs based on mean RSCU values (Figure 4B). The CAMs of 13 PCGs in C. c. kansuensis consisted of 49 codons encoding 19 amino acids and 4 termination codons. The number of unused codons across the 13 CAMs varied from 9 to 32.
To investigate CUPs at the amino acid level, we calculated the mean RSCU values for the concatenated 13 PCGs of 89 individuals. As shown in Figure 4C, the CUPs of amino acids in C. c. kansuensis mitochondrial PCGs revealed that the most preferred stop codon was UAA, and the most preferred start codon was AUA. For amino acids with synonymous codons ending in A or G (Glu, Lys, Met, Gln, and Trp), there was a strong preference for A-ending codons. In contrast, amino acids with synonymous codons ending in C or U (Cys, Asp, Phe, His, Ile, Asn and Tyr) exhibited random CUPs with no clear preference (0.6 < RSCU < 1.6). However, Cys was an exception, where the codon UGU was under-represented (RSCU = 0.46).

3.5. Effective Number of Codons

The ENC, with values ranging from 20 to 61, exhibits a negative correlation with codon usage bias [35,57]. The lower the ENC value, the stronger the codon usage bias of the gene. A gene with an ENC value less than 35 is considered to have a strong codon usage bias [20,35]. Here, the ENC values of 13 mitochondrial PCGs in 89 individuals were calculated. Among the 13 PCGs, the gene ATP8 showed the highest ENC values from 60.95 to 61, indicating negligible codon usage bias. With the exception of the gene ATP8 and ND4L, the ENC values of remaining genes were distributed from 36.34 to 45.32, signifying weak codon usage bias in mitochondrial PCGs across C. c. kansuensis populations.
In order to further evaluate whether the mutation pressure and natural selection have influenced the codon usage bias, an ENC plot was drawn using ENC values against GC3s [21,22,35,57,58,59]. When the ENC value of a gene falls near the standard curve in the ENC plot, mutation pressure was thought to be the only factor affecting its third-position bases of codons. If the ENC value falls far below the standard curve, the codon bias of that gene was affected by natural selection [22,51,53,57]. In our ENC plot (Figure 5A), most genes clustered below the standard curve, suggesting that natural selection was the primary factor affecting their codon usage bias. The points of the gene ND4L were positioned near the standard curve, suggesting its codon usage bias was mainly influenced by mutation pressure. These results collectively demonstrate that the codon usage bias of mitochondrial PCGs in C. c. kansuensis populations is affected more by natural selection than mutation.

3.6. PR2 Bias Analysis

PR2 describes the base composition rule in double-stranded DNA; the frequencies of A and T are approximately equal within a single strand, as are those of G and C, when mutation and selection are equally effective on both strands [60]. PR2 biases at the third codon position in four-codon sequences are considered to be effective indices to estimate the forces that drive deviation from neutral mutations in individual genes [53,58]. Points of genes should fall in the center of the PR2 bias plot, where both coordinates are 0.5, if codon usage bias is caused only by mutation pressure [58,61]. According to the vertebrate mitochondrial genetic codon table, there are 24 four-fold degenerate codons encoding 6 amino acids (Ala, Arg, Gly, Pro, Thr and Val). We extracted the four-codon sequences for each mitochondrial PCG from the 89 mitogenomes and analyzed PR2 biases at their third codon positions. The PR2 bias plot (Figure 5B) revealed that all PCG data points were distributed in the second quadrant, except for the genes ATP8 and ND6, indicating that 11 of 13 mitochondrial PCGs in C. c. kansuensis exhibit codon usage bias preferring A and C in the third codon position. The GC-bias values (G3/(G3 + C3)) of gene ATP8 were 0.5, indicating no bias to G or C at its third codon position. However, the AT-bias values (A3/(A3 + T3)) exceeded 0.5, suggesting its preference for A. The data points of the gene ND6 fell in the fourth quadrant, relatively close to the X-axis but distant from the Y-axis, suggesting that the gene ND6 had a strong preference for G and a weak preference for T. These observed biases in mitochondrial PCGs suggest that mutation pressure is not the only power affecting mitochondrial codon usage bias of C. c. kansuensis, which is consistent with the results of the ENC-plot analysis.

4. Conclusions

In this study, we assembled 89 complete mitogenomes of Cervus canadensis from five geographic populations across Qinghai and Gansu, China. Phylogenetic analysis confirmed that the five C. canadensis populations are taxonomically classified as C. c. kansuensis. Our analyses revealed that the nucleotide composition is biased towards AT in mitochondrial PCGs of C. c. kansuensis, and the adenine and cytosine is preferred over guanine and thymine. Moreover, the distinct codon usage patterns and codon aversion motifs observed among the 13 PCGs, along with the preferences of amino acids for synonymous codons, indicate significant codon usage bias in mitochondrial PCGs of C. c. kansuensis. Both the ENC plot and PR2 bias plot demonstrated that natural selection plays a critical role in shaping these biases. This study provides evidence for the subspecific classification of C. canadensis populations in Qinghai and Gansu, China, while offering novel insights into the characteristics of mitochondrial PCGs in C. c. k ansuensis. The complete mitogenomes generated in this research provide a valuable resource for further understanding the mitochondrial characteristics of Cervus elaphus (Linnaeus, 1758).

Supplementary Materials

The following supporting information can be downloaded at https://www.mdpi.com/article/10.3390/ani15101486/s1; Table S1: Nucleotide composition of 89 mitochondrial genomes.

Author Contributions

Conceptualization, X.X.; methodology, S.D. and L.T.; software, S.D.; validation, L.T.; formal analysis, S.D.; investigation, S.Y. and X.C.; resources, Y.F.; data curation, X.W.; writing—original draft preparation, S.D. and L.T.; writing—review and editing, X.X.; visualization, S.D.; supervision, W.S.; project administration, X.X.; funding acquisition, X.X. All authors have read and agreed to the published version of the manuscript.

Funding

This research was funded by the Special Animal Genetic Resources Platform of National Scientific and Technical Infrastructure Center (NSTIC TZDWZYK2024) and the National Natural Science Foundation of Jilin Province (YDZJ202401522ZYTS).

Institutional Review Board Statement

The animal study protocol was approved by the Animal Care and Use Committee of the Chinese Academy of Agricultural Sciences (approval number: ISAPSAEC-2024-034).

Informed Consent Statement

Not applicable.

Data Availability Statement

The complete mitochondrial genomes assembled in this study are available on reasonable request from the corresponding author as the research project is conducted by a national institution.

Acknowledgments

We express our gratitude towards the reviewers for taking the time to process this manuscript.

Conflicts of Interest

Author Xinhao Wang is an employee of Guangdong Chimelong Group. The company did not interfere with co-author’s access to all of the study’s data, analyzing and interpreting the data, preparing and publishing manuscripts independently. All authors declare no conflicts of interest.

Abbreviations

The following abbreviations are used in this manuscript:
NCBINational Center for Biotechnology Information
PCGProtein-coding gene
IUCNInternational Union for Conservation of Nature
PR2Parity Rule 2
ENCEffective Number of Codons
RSCURelative Synonymous Codon Usage
CUPCodon Usage Pattern
CAMCodon Aversion Motif

References

  1. Polziehn, R.; Strobeck, C. Phylogeny of wapiti, red deer, sika deer, and other North American cervids as determined from mitochondrial DNA. Mol. Phylogenet. Evol. 1998, 10, 249–258. [Google Scholar] [CrossRef] [PubMed]
  2. Ludt, C.J.; Schroeder, W.; Rottmann, O.; Kuehn, R. Mitochondrial DNA phylogeography of red deer (Cervus elaphus). Mol. Phylogenet. Evol. 2004, 31, 1064–1083. [Google Scholar] [CrossRef]
  3. Randi, E.; Mucci, N.; Claro-Hergueta, F.; Bonnet, A.; Douzery, E.J.P. A mitochondrial DNA control region phylogeny of the Cervinae: Speciation in Cervus and implications for conservation. Anim. Conserv. 2001, 4, 1–11. [Google Scholar] [CrossRef]
  4. Mahmut, H.; Masuda, R.; Onuma, M.; Takahashi, M.; Nagata, J.; Suzuki, M.; Ohtaishi, N. Molecular Phylogeography of the Red Deer (Cervus elaphus) Populations in Xinjiang of China: Comparison with other Asian, European, and North American Populations. Zool. Sci. 2002, 19, 485–495. [Google Scholar] [CrossRef]
  5. Kuwayama, R.; Ozawa, T. Phylogenetic Relationships among European Red Deer, Wapiti, and Sika Deer Inferred from Mitochondrial DNA Sequences. Mol. Phylogenet. Evol. 2000, 15, 115–123. [Google Scholar] [CrossRef]
  6. Lorenzini, R.; Garofalo, L. Insights into the evolutionary history of Cervus (Cervidae, tribe Cervini) based on Bayesian analysis of mitochondrial marker sequences, with first indications for a new species. J. Zool. Syst. Evol. Res. 2015, 53, 340–349. [Google Scholar] [CrossRef]
  7. Mackiewicz, P.; Matosiuk, M.; Świsłocka, M.; Zachos, F.E.; Hajji, G.M.; Saveljev, A.P.; Seryodkin, I.V.; Farahvash, T.; Rezaei, H.R.; Torshizi, R.V. Phylogeny and evolution of the genus Cervus (Cervidae, Mammalia) as revealed by complete mitochondrial genomes. Sci. Rep. 2022, 12, 16381. [Google Scholar] [CrossRef]
  8. Xiao, B.; Wang, T.; Lister, A.M.; Yuan, J.; Hu, J.; Song, S.; Lin, H.; Wang, S.; Wang, C.; Wei, D.; et al. Ancient and modern mitogenomes of red deer reveal its evolutionary history in northern China. Quat. Sci. Rev. 2023, 301, 107924. [Google Scholar] [CrossRef]
  9. Doan, K.; Niedziałkowska, M.; Stefaniak, K.; Sykut, M.; Jędrzejewska, B.; Ratajczak-Skrzatek, U.; Piotrowska, N.; Ridush, B.; Zachos, F.E.; Popović, D. Phylogenetics and phylogeography of red deer mtDNA lineages during the last 50,000 years in Eurasia. Zool. J. Linn. Soc. 2022, 194, 431–456. [Google Scholar] [CrossRef]
  10. Ohitaishi, N.; Gao, Y. A review of the distribution of all species of deer (Tragulidae, Moschidae and Cervidae) in China. Mammal Rev. 1990, 20, 125–144. [Google Scholar] [CrossRef]
  11. Zhao, Y.; Sun, J.; Ding, M.; Hayat Khattak, R.; Teng, L.; Liu, Z. Growth Stages and Inter-Species Gut Microbiota Composition and Function in Captive Red Deer (Cervus elaphus alxaicus) and Blue Sheep (Pseudois nayaur). Animals 2023, 13, 553. [Google Scholar] [CrossRef] [PubMed]
  12. Liu, Z.; Wang, J.; Sun, Y.; Hou, Z.; Teng, L. Complete mitochondrial genome of a wild Alashan Red Deer (Cervus elaphus alxaicus). Mitochondrial DNA A DNA Mapp. Seq. Anal. 2016, 27, 3313–3314. [Google Scholar] [CrossRef] [PubMed]
  13. Zhao, Q.; Xu, H.; Li, D.; Xie, M.; Ni, Q.; Zhang, M.; Yao, Y. Complete mitochondrial genome and phylogenetic analysis of Sichuan deer (Cervus elaphus macneilli). Conserv. Genet. Resour. 2018, 10, 431–435. [Google Scholar] [CrossRef]
  14. Catanese, G.; Catanese, G.; Infante, C.; Manchado, M.; Catanese, G.; Infante, C.; Manchado, M. Complete mitochondrial DNA sequences of the frigate tuna Auxis thazard and the bullet tuna Auxis rochei. DNA Seq. 2008, 19, 159–166. [Google Scholar] [CrossRef] [PubMed]
  15. Xu, Z.; Wu, L.; Chen, J.; Zhao, Y.; Han, C.; Huang, T.; Yang, G. Insight into the characteristics of an important evolutionary model bird (Geospiza magnirostris) mitochondrial genome through comparison. Biocell 2022, 46, 1733. [Google Scholar] [CrossRef]
  16. Li, Z.; Han, Y.; Li, Y.; Wu, W.; Lei, J.; Wang, D.; Lin, Y.; Wang, X. Whole Mitochondrial Genome Sequencing and Phylogenetic Tree Construction for Procypris mera (Lin 1933). Animals 2024, 14, 2672. [Google Scholar] [CrossRef]
  17. Fragkoulis, G.; Hangas, A.; Fekete, Z.; Michell, C.; Moraes Carlos, T.; Willcox, S.; Griffith, J.D.; Goffart, S.; Pohjoismäki, J.L.O. Linear DNA-driven recombination in mammalian mitochondria. Nucleic Acids Res. 2024, 52, 3088–3105. [Google Scholar] [CrossRef]
  18. Rokas, A.; Ladoukakis, E.; Zouros, E. Animal mitochondrial DNA recombination revisited. Trends Ecol. Evol. 2003, 18, 411–417. [Google Scholar] [CrossRef]
  19. Golosova, O.S.; Kholodova, M.V.; Volodin, I.A.; Seryodkin, I.V.; Okhlopkov, I.M.; Argunov, A.V.; Sipko, T.P. Genetic Diversity of the Eastern Subspecies of Red Deer (Cervus elaphus) in Russia Revealed by mtDNA and Microsatellite Polymorphism. Biol. Bull. Rev. 2023, 13, 482–494. [Google Scholar] [CrossRef]
  20. Han, S.; Ding, H.; Peng, H.; Dai, C.; Zhang, S.; Yang, J.; Gao, J.; Kan, X. Sturnidae sensu lato Mitogenomics: Novel Insights into Codon Aversion, Selection, and Phylogeny. Animals 2024, 14, 2777. [Google Scholar] [CrossRef]
  21. Hao, J.; Liang, Y.; Wang, T.; Su, Y. Correlations of gene expression, codon usage bias, and evolutionary rates of the mitochondrial genome show tissue differentiation in Ophioglossum vulgatum. BMC Plant Biol. 2025, 25, 134. [Google Scholar] [CrossRef] [PubMed]
  22. Li, Q.; Luo, Y.; Sha, A.; Xiao, W.; Xiong, Z.; Chen, X.; He, J.; Peng, L.; Zou, L. Analysis of synonymous codon usage patterns in mitochondrial genomes of nine Amanita species. Front. Microbiol. 2023, 14, 1134228. [Google Scholar] [CrossRef]
  23. Wada, K.; Okumura, K.; Nishibori, M.; Kikkawa, Y.; Yokohama, M. The complete mitochondrial genome of the domestic red deer (Cervus elaphus) of New Zealand and its phylogenic position within the family Cervidae. Anim. Sci. J. 2010, 81, 551–557. [Google Scholar] [CrossRef] [PubMed]
  24. Li, Y.; Ba, H.; Yang, F. Complete mitochondrial genome of Cervus elaphus songaricus (Cetartiodactyla: Cervinae) and a phylogenetic analysis with related species. Mitochondrial DNA A DNA Mapp. Seq. Anal. 2016, 27, 620–621. [Google Scholar] [CrossRef]
  25. Shao, Y.; Xing, X.; Zha, D.; Yang, F. Complete mitochondrial genome sequence of tarim red deer (Cervus elaphus yarkandensis). Mitochondrial DNA A DNA Mapp. Seq. Anal. 2016, 27, 130–131. [Google Scholar] [CrossRef]
  26. Shao, Y.; Su, W.; Liu, H.; Zha, D.; Zhang, R.; Xing, X. Complete mitochondrial genome sequence of northeastern red deer (Cervus elaphus xanthopygus). Mitochondrial DNA A DNA Mapp. Seq. Anal. 2016, 27, 547–548. [Google Scholar] [CrossRef]
  27. Frank, K.; Barta, E.; Bana, N.A.; Nagy, J.; Horn, P.; Orosz, L.; Steger, V. Complete mitochondrial genome sequence of a Hungarian red deer (Cervus elaphus hippelaphus) from high-throughput sequencing data and its phylogenetic position within the family Cervidae. Acta Biol. Hung. 2016, 67, 133–147. [Google Scholar] [CrossRef]
  28. Liu, H.; Wang, T.; He, J.; Tu, J.; Yang, X.; Yang, F.; Xing, X. The complete mitochondrial genome of Cervus elaphus kansuensis (Artiodactyla: Cervidae) and its phylogenetic analysis. Mitochondrial DNA Part B 2019, 4, 1720–1722. [Google Scholar] [CrossRef]
  29. Kim, H.J.; Hwang, J.Y.; Park, K.J.; Park, H.C.; Kang, H.E.; Park, J.; Sohn, H.J. The first complete mitogenome of Cervus canadensis nannodes (Merriam, 1905). Mitochondrial DNA B Resour. 2020, 5, 2294–2296. [Google Scholar] [CrossRef]
  30. Chen, S.; Zhou, Y.; Chen, Y.; Gu, J. fastp: An ultra-fast all-in-one FASTQ preprocessor. Bioinformatics 2018, 34, i884–i890. [Google Scholar] [CrossRef]
  31. Heng, L. Aligning sequence reads, clone sequences and assembly contigs with BWA-MEM. arXiv 2013, arXiv:1303.3997. [Google Scholar]
  32. Danecek, P.; Bonfield, J.K.; Liddle, J.; Marshall, J.; Ohan, V.; Pollard, M.O.; Whitwham, A.; Keane, T.; McCarthy, S.A.; Davies, R.M.; et al. Twelve years of SAMtools and BCFtools. GigaScience 2021, 10, giab008. [Google Scholar] [CrossRef]
  33. Bernt, M.; Donath, A.; Jühling, F.; Externbrink, F.; Florentz, C.; Fritzsch, G.; Pütz, J.; Middendorf, M.; Stadler, P.F. MITOS: Improved de novo metazoan mitochondrial genome annotation. Mol. Phylogenet. Evol. 2013, 69, 313–319. [Google Scholar] [CrossRef] [PubMed]
  34. Meng, G.; Li, Y.; Yang, C.; Liu, S. MitoZ: A toolkit for animal mitochondrial genome assembly, annotation and visualization. Nucleic Acids Res. 2019, 47, e63. [Google Scholar] [CrossRef]
  35. Li, M.; Wang, J.; Dai, R.; Smagghe, G.; Wang, X.; You, S. Comparative analysis of codon usage patterns and phylogenetic implications of five mitochondrial genomes of the genus Japanagallia Ishihara, 1955 (Hemiptera, Cicadellidae, Megophthalminae). PeerJ 2023, 11, e16058. [Google Scholar] [CrossRef] [PubMed]
  36. Song, N.; Xi, Y.-Q.; Yin, X.-M. Phylogenetic relationships of Brachycera (Insecta: Diptera) inferred from mitochondrial genome sequences. Zool. J. Linn. Soc. 2022, 196, 720–739. [Google Scholar] [CrossRef]
  37. Minh, B.Q.; Schmidt, H.A.; Chernomor, O.; Schrempf, D.; Woodhams, M.D.; Von Haeseler, A.; Lanfear, R. IQ-TREE 2: New models and efficient methods for phylogenetic inference in the genomic era. Mol. Biol. Evol. 2020, 37, 1530–1534. [Google Scholar] [CrossRef]
  38. Kalyaanamoorthy, S.; Minh, B.Q.; Wong, T.K.; Von Haeseler, A.; Jermiin, L.S. ModelFinder: Fast model selection for accurate phylogenetic estimates. Nat. Methods 2017, 14, 587–589. [Google Scholar] [CrossRef]
  39. Hoang, D.T.; Chernomor, O.; Von Haeseler, A.; Minh, B.Q.; Vinh, L.S. UFBoot2: Improving the ultrafast bootstrap approximation. Mol. Biol. Evol. 2018, 35, 518–522. [Google Scholar] [CrossRef]
  40. Hassanin, A.; Delsuc, F.; Ropiquet, A.; Hammer, C.; Vuuren, B.J.V.; Matthee, C.; Ruiz-Garcia, M.; Catzeflis, F.; Areskoug, V.; Nguyen, T.T.; et al. Pattern and timing of diversification of Cetartiodactyla (Mammalia, Laurasiatheria), as revealed by a comprehensive analysis of mitochondrial genomes. Comptes Rendus Biol. 2012, 335, 32–50. [Google Scholar] [CrossRef]
  41. Kumar, C.; Stecher, G.; Li, M.; Knyaz, C.; Tamura, K. MEGA X: Molecular Evolutionary Genetics Analysis across Computing Platforms. Mol. Biol. Evol. 2018, 35, 1547–1549. [Google Scholar] [CrossRef] [PubMed]
  42. Zhou, Q.; Xiong, M.; Luo, A.; Wang, X.; Wu, S.A. Characterization of the first mitochondrial genome of Aclerdidae (Hemiptera: Coccoidea) with a novel gene arrangement. Zool. Syst. 2022, 47, 293–304. [Google Scholar] [CrossRef]
  43. De, A.K.; Muthiyan, R.; Sunder, J.; Sawhney, S.; Sujatha, T.; Bhattacharya, D. The whole mitochondrial genome signature of Teressa goat, an indigenous goat germplasm of Andaman and Nicobar Islands, India. Small Rumin. Res. 2022, 217, 106848. [Google Scholar] [CrossRef]
  44. Wang, Q.; Wang, J.; Wu, Q.; Xu, X.; Wang, P.; Wang, Z. Insights into the evolution of Brachyura (Crustacea: Decapoda) from mitochondrial sequences and gene order rearrangements. Int. J. Biol. Macromol. 2021, 170, 717–727. [Google Scholar] [CrossRef] [PubMed]
  45. Wang, H.; Ren, Z.; Wang, L.; Li, Q.; Qin, W. Molecular phylogeny of wapiti (red deer) populations in Xinjiang. Acta Agric. Boreali-Occident. Sin. 2008, 17, 25–29. [Google Scholar] [CrossRef]
  46. An, J.; Yin, X.; Chen, R.; Boyko, C.B.; Liu, X. Integrative taxonomy of the subfamily Orbioninae (Crustacea: Isopoda) based on mitochondrial and nuclear data with evidence that supports Epicaridea as a suborder. Mol. Phylogenet. Evol. 2023, 180, 107681. [Google Scholar] [CrossRef]
  47. Das, P.J.; Kumar, S.; Choudhury, M.; Banik, S.; Pegu, S.R.; Kumar, S.; Deb, R.; Gupta, V.K. Characterization of the complete mitochondrial genome and identification of signature sequence of Indian wild pig. Gene 2024, 897, 148070. [Google Scholar] [CrossRef]
  48. Ma, Y.; Zheng, B.; Li, J.; Meng, W.; Xu, K.; Ye, Y. Characterization of the complete mitochondrial genome of Desmaulus extinctorium (Littorinimorpha, Calyptraeoidea, Calyptraeidae) and molecular phylogeny of Littorinimorpha. PLoS ONE 2024, 19, e0301389. [Google Scholar] [CrossRef]
  49. Ding, H.; Bi, D.; Han, S.; Yi, R.; Zhang, S.; Ye, Y.; Gao, J.; Yang, J.; Kan, X. Mitogenomic Codon Usage Patterns of Superfamily Certhioidea (Aves, Passeriformes): Insights into Asymmetrical Bias and Phylogenetic Implications. Animals 2022, 13, 96. [Google Scholar] [CrossRef]
  50. Chakraborty, S.; Mazumder, T.H.; Uddin, A. Compositional dynamics and codon usage pattern of BRCA1 gene across nine mammalian species. Genomics 2018, 111, 167–176. [Google Scholar] [CrossRef]
  51. Ran, R.; Zhang, X.; Wan, T.; Yi, W. Method analysis of codon usage bias and its related research. Grassl. Prataculture 2022, 34, 5–10+43. [Google Scholar] [CrossRef]
  52. Sharp, P.M.; Tuohy, T.M.F.; Mosurski, K.R. Codon usage in yeast: Cluster analysis clearly differentiates highly and lowly expressed genes. Nucleic Acids Res. 1986, 14, 5125–5143. [Google Scholar] [CrossRef]
  53. Khandia, R.; Singhal, S.; Kumar, U.; Ansari, A.I.; Singh, R.K. Analysis of Nipah Virus Codon Usage and Adaptation to Hosts. Front. Microbiology 2019, 10, 886. [Google Scholar] [CrossRef]
  54. Han, S.; Bi, D.; Yi, R.; Ding, H.; Wu, L.; Kan, X. Plastome evolution of Aeonium and Monanthes (Crassulaceae): Insights into the variation of plastomic tRNAs, and the patterns of codon usage and aversion. Planta 2022, 256, 35. [Google Scholar] [CrossRef]
  55. Miller, J.B.; Hippen, A.A.; Belyeu, J.R.; Whiting, M.F.; Ridge, P.G. Missing something? Codon aversion as a new character system in phylogenetics. Cladistics 2017, 33, 545–556. [Google Scholar] [CrossRef]
  56. Miller, J.B.; McKinnon, L.M.; Whiting, M.F.; Ridge, P.G. CAM: An alignment-free method to recover phylogenies using codon aversion motifs. PeerJ 2019, 7, e6984. [Google Scholar] [CrossRef]
  57. Guan, D.; Ma, L.; Khan, M.S.; Zhang, X.; Xu, S.; Xie, J. Analysis of codon usage patterns in Hirudinaria manillensis reveals a preference for GC-ending codons caused by dominant selection constraints. BMC Genom. 2018, 19, 542. [Google Scholar] [CrossRef]
  58. He, B.; Dong, H.; Jiang, C.; Cao, F.; Tao, S.; Xu, L.A. Analysis of codon usage patterns in Ginkgo biloba reveals codon usage tendency from A/U-ending to G/C-ending. Sci. Rep. 2016, 6, 35927. [Google Scholar] [CrossRef] [PubMed]
  59. Cao, J.K.; Lei, T.; Jing-Jing, G.U.; Song, C.; Xin, Q.I. Codon bias analysis of the mitochondrial genome reveals natural selection in the nonbiting midge Microtendipes umbrosus Freeman, 1955 (Diptera: Chironomidae). Pan-Pac. Entomol. 2023, 99, 217–225. [Google Scholar] [CrossRef]
  60. Sueoka, N. Intrastrand parity rules of DNA base composition and usage biases of synonymous codons. J. Mol. Evol. 1995, 40, 318–325. [Google Scholar] [CrossRef]
  61. Sueoka, N. Near homogeneity of PR2-bias fingerprints in the human genome and their implications in phylogenetic analyses. J. Mol. Evol. 2001, 53, 469–476. [Google Scholar] [CrossRef] [PubMed]
Figure 1. Locations of the sampled Cervus canadensis populations.
Animals 15 01486 g001
Figure 2. Phylogenetic trees constructed using three schemes: (A) CYTB; (B) PCGs_nt12; (C) PGCs. Different species are colored by different background colors. Sequences obtained from NCBI are indicated in italics. Red arrows point to 100% bootstrap supported clades formed by 89 mitogenomes and C. c. kansuensis. “--” denotes the subspecies information is not applicable. The sequence MH513320 is highlighted in red. Bootstrap values ≥ 80 are shown in red along the branches. Red arrows point to clades containing both the 89 sampled individuals and sequence MH513320. Sample prefixes denote collection locations: SN (Sunan), DT (Datong), GH (Gonghe), TD (Tongde), and MQ (Maqu).
Animals 15 01486 g002
Figure 3. Skewness plots of 13 mitochondrial protein-coding genes of Cervus canadensis. (A) AT-skew plot. (B) GC-skew plot. Different colors represent different genes.
Animals 15 01486 g003
Figure 4. Codon usage statistics of the Cervus canadensis mitochondrial genome. (A) CUPs of 13 mitochondrial PCGs. Colors from blue to red represent RSCU values from small to large. “++” denotes RSCU value > 1.6, “−−” denotes RSCU value < 0.6 and “0” denotes RSCU value = 0. Colored rectangles highlight codon usage bias specific to gene ND6. (B) CAMs of 13 mitochondrial PCGs. Codons unused in each PCG are marked as red points. (C) Statistics of codon usage for synonymous codons of each amino acid and stop codon (*) in combination of 13 mitochondrial PCGs. Different colors denote different codons.
Animals 15 01486 g004
Figure 5. Codon bias distribution of Cervus canadensis mitochondrial genome. (A) ENC-plot of 13 mitochondrial PCGs. ENC denotes value of effective number of codons. GC3 denotes GC content at the third codon position. (B) PR2 biases at third codon position of four-codon sequences in 13 mitochondrial PCGs. A3, T3, G3 and C3 represent nucleotide (A, T, G and C) contents at the third codon position.
Animals 15 01486 g005
Table 1. Number and type of samples collected from different geographic locations.
LocationLongitudeLatitudeNumberSample Type
Sunan99.638.820ossified antler
Datong101.736.910intravenous blood
Gonghe100.936.423frozen velvet antler
Tongde100.635.36ossified antler
Maqu101.134.230intravenous blood
Table 2. Mitochondrial sequences downloaded from NCBI.
Accession NumberLength (bp)SpeciesSubspeciesLocation
JN63259916,349Axis axis----
OR14329616,351Axis axis----
CM10225116,474C. albirostris----
HM04963616,478C. albirostris----
JN63269016,512C. albirostris--HT *
MF96659516,473C. albirostris--China
CM03322616,429C. canadensis--America
GU45743416,416C. canadensisxanthopygus--
HQ19142916,419C. canadensissongaricus--
KJ02507216,419C. canadensissongaricus--
KP17259316,428C. canadensisalxaicusChina
KU94239916,503C. canadensisalxaicusChina
KX44933416,350C. canadensismacneilliChina
MH51332016,430C. canadensiskansuensisChina
MT43093916,428C. canadensisnannodesRepublic of Korea
MT53458316,428C. canadensis--Republic of Korea
OL67992316,428C. canadensissibiricusRussia
OL67992416,353C. canadensisxanthopygusRussia
OP76465116,430C. canadensisalashanicusChina
OP76465216,436C. canadensisalashanicusChina
OP76465316,430C. canadensisxanthopygusChina
AB24542716,357C. elaphus--New Zealand
KT29094816,354C. elaphushippelaphusHungary
MF87224716,357C. elaphus--Denmark
MF87224816,357C. elaphus--Denmark
OL67991216,351C. elaphus--Poland
OL67991316,351C. elaphus--Poland
OL67991416,352C. elaphus--Poland
OL67991516,352C. elaphus--Poland
OL67991616,355C. elaphus--Poland
OL67991716,355C. elaphus--Poland
OL67991816,354C. elaphus--Poland
OL67991916,350C. elaphusmaralIran
OL67992016,351C. elaphus--Poland
OL67992116,351C. elaphusitalicusItaly
OL67992216,353C. elaphusbarbarusTunisia
GU45743516,351C. hangluyarkandensis--
MW43005016,354C. hangluhangluIndia
MW43005116,354C. hangluhangluIndia
ON41688416,351C. hangluhangluIndia
ON41688516,351C. hangluhangluIndia
--: The information is not applicable. *: Haute Touche Animal Park (Indre, France) [40].
Table 3. Gene features of 89 assembled genomes.
Gene
(Anticodon)
Length (bp)StrandStart CodonStop CodonGene
(Anticodon)
Length (bp)StrandStart CodonStop Codon
trnF (gaa)69+ trnK (uuu)69+
rrnS956+ ATP8201+ATGTAA
trnV (uac)67+ ATP6681+ATGTAA
rrnL1574 a+ COX3804+ATGTAG
trnL (uaa)75+ trnG (ucc)69+
ND1957+ATGTAAND3357+ATATAG
trnI (gau)69 b+ trnR (ucg)69+
trnQ (uug)72 ND4L297+ATGTAA
trnM (cau)69+ ND41378+ATGT--
ND21044+ATATAGtrnH (gug)69 c+
trnW (uca)68+ trnS (gcu)60+
trnA (ugc)69 trnL (uag)70+
trnN (guu)73 ND51821 d+ATATAA
trnC (gca)68 ND6528ATGTAA
trnY (gua)69 trnE (uuc)69
COX11546+ATGTAACYTB1140+ATGAGA
trnS (uga)70 trnT (ugu)70+
trnD (guc)68+ trnP (ugg)66
COX2684+ATGTAAControl Region522 e+
a rrnL with length of 1575 bp was observed in 32 individuals; b 1 exception observed with trnI (tRNA-Ile) and length of 70 bp; c trnH (tRNA-His) with length of 70 bp was observed in 7 of 89 individuals; d 2 individuals have ND5 genes with length of 1824 bp and 1 has length of 1827 bp; e length of control region varied from 512 bp to 525 bp, with highest frequency of 522 bp (44 instances), followed by 520 bp (31 instances).
Table 4. Frequencies of codons ending with different nucleotide in different RSCU intervals.
RSCU ValueNumber of CodonsPercentage (%)
A-Ending 1G-Ending 2U-Ending 3C-Ending 4Total
027113423021225.48
0~0.6463273112515.02
0.6~1.6452611311730136.18
>1.61326263019423.32
1 Codons ending with A; 2 codons ending with G; 3 codons ending with U(T); 4 codons ending with C.
Disclaimer/Publisher’s Note: The statements, opinions and data contained in all publications are solely those of the individual author(s) and contributor(s) and not of MDPI and/or the editor(s). MDPI and/or the editor(s) disclaim responsibility for any injury to people or property resulting from any ideas, methods, instructions or products referred to in the content.

