RNA-Seq Analysis Reveals the Molecular Mechanisms Regulating the Development of Different Adipose Tissues in Broiler Chicks

 ,
,  , and
, and 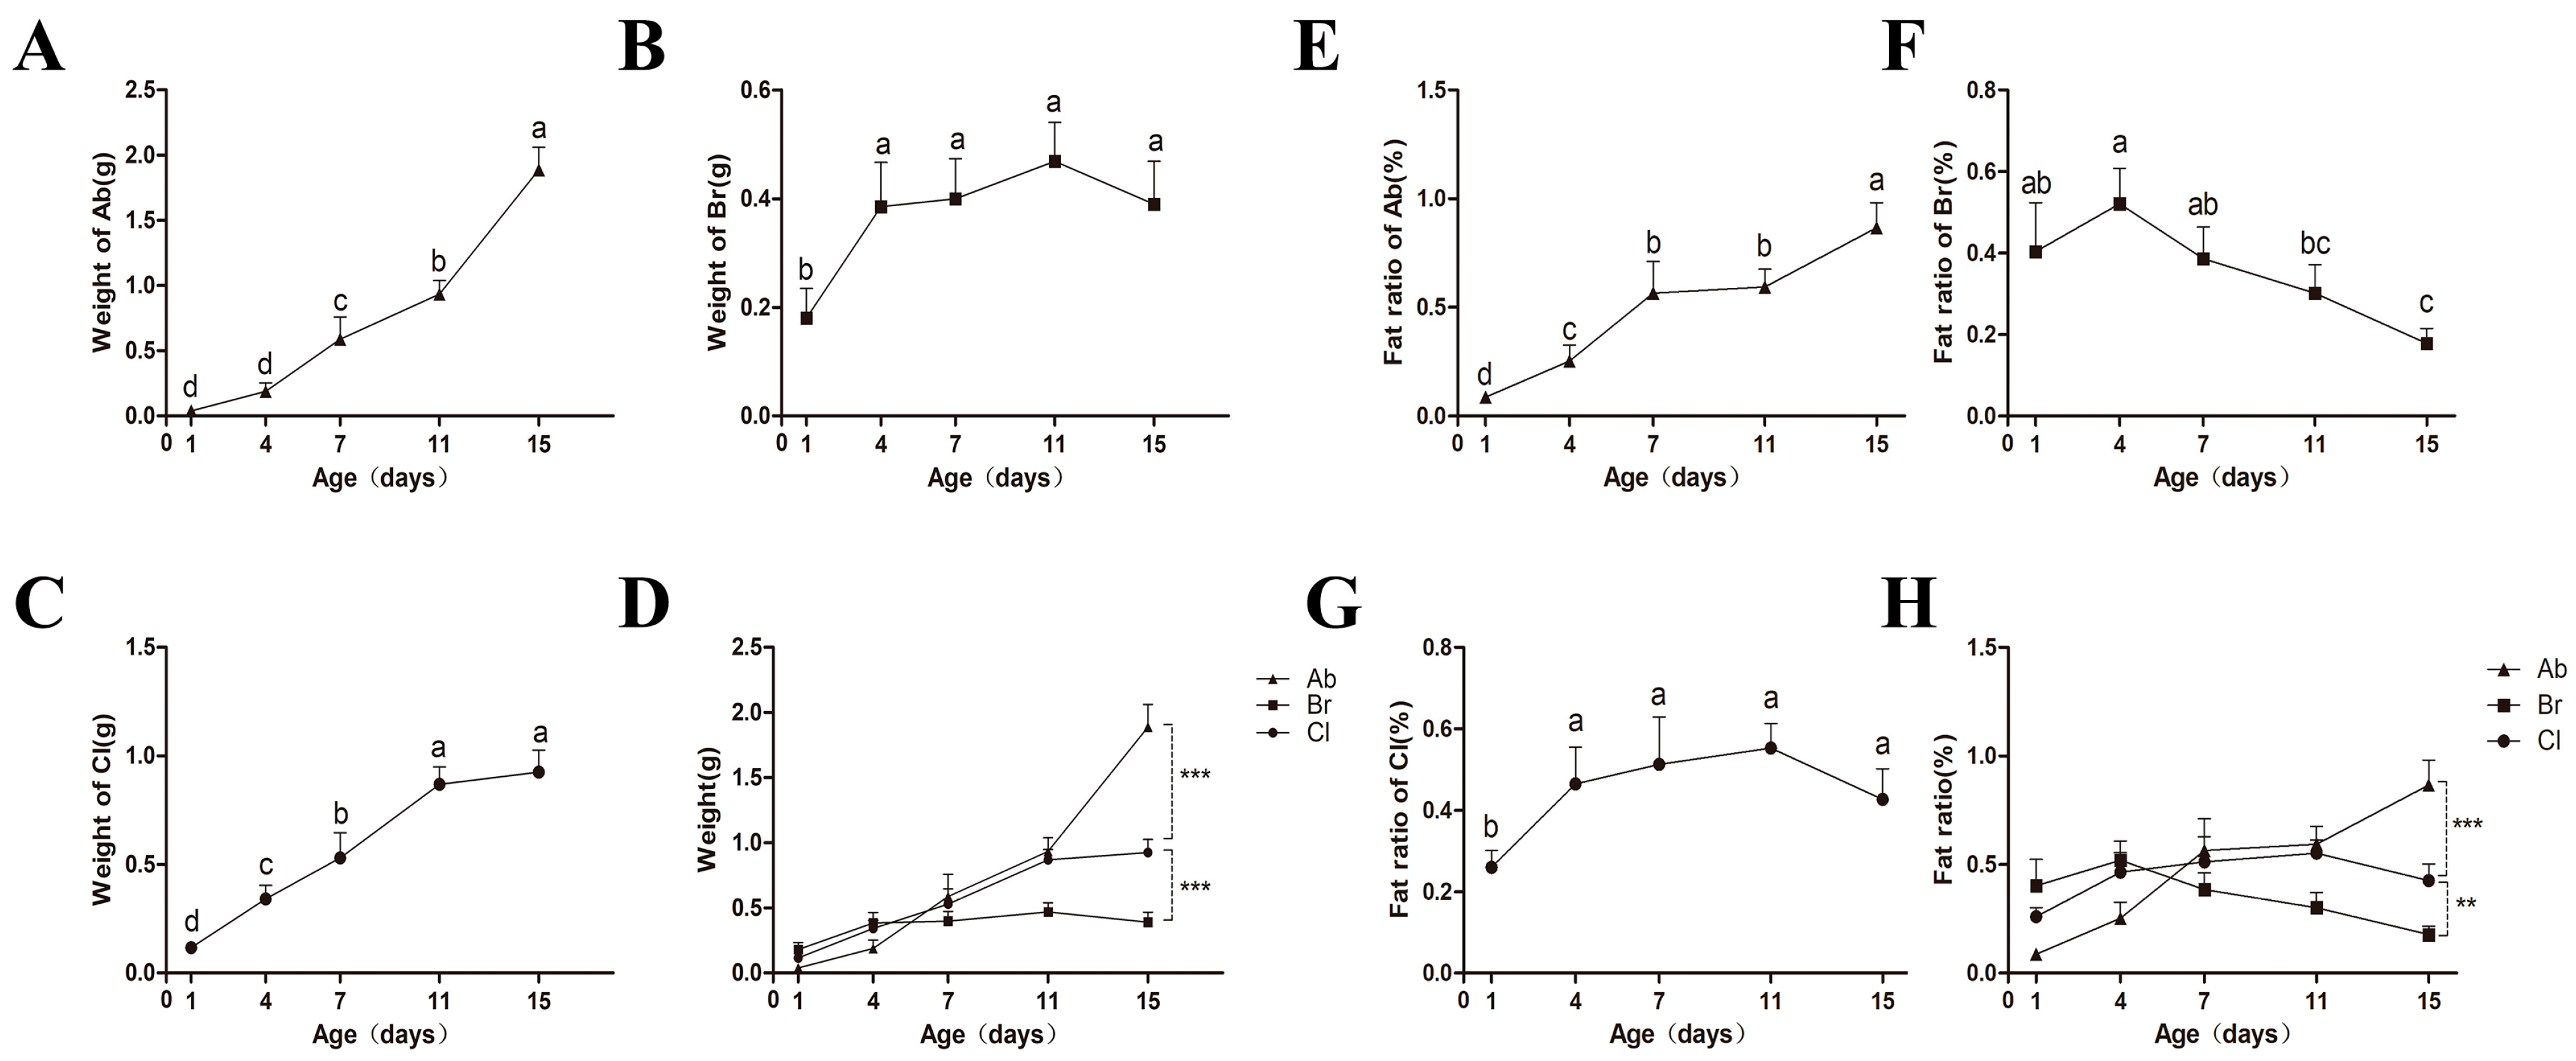
Simple Summary
Abstract
1. Introduction
2. Materials and Methods
2.1. Experimental Animals, Design, and Sample Collection
2.2. Experimental Animals’ Histological and Morphological Observation
2.3. Biochemical Analysis
2.4. Gene Library Construction and Quality Control
2.5. Differential Expression Gene Analysis
2.6. Functional Enrichment Analysis
2.7. RNA Extraction and Real-Time Quantitative PCR
2.8. Weighted Gene Co-Expression Network Analysis
2.9. Identification of Gene Hub
2.10. Statistical Analysis
3. Results
3.1. Differences in the Phenotype of the Adipose Tissues
3.2. Differences in Adipocytes Morphology among the Ab, Br, and Cl
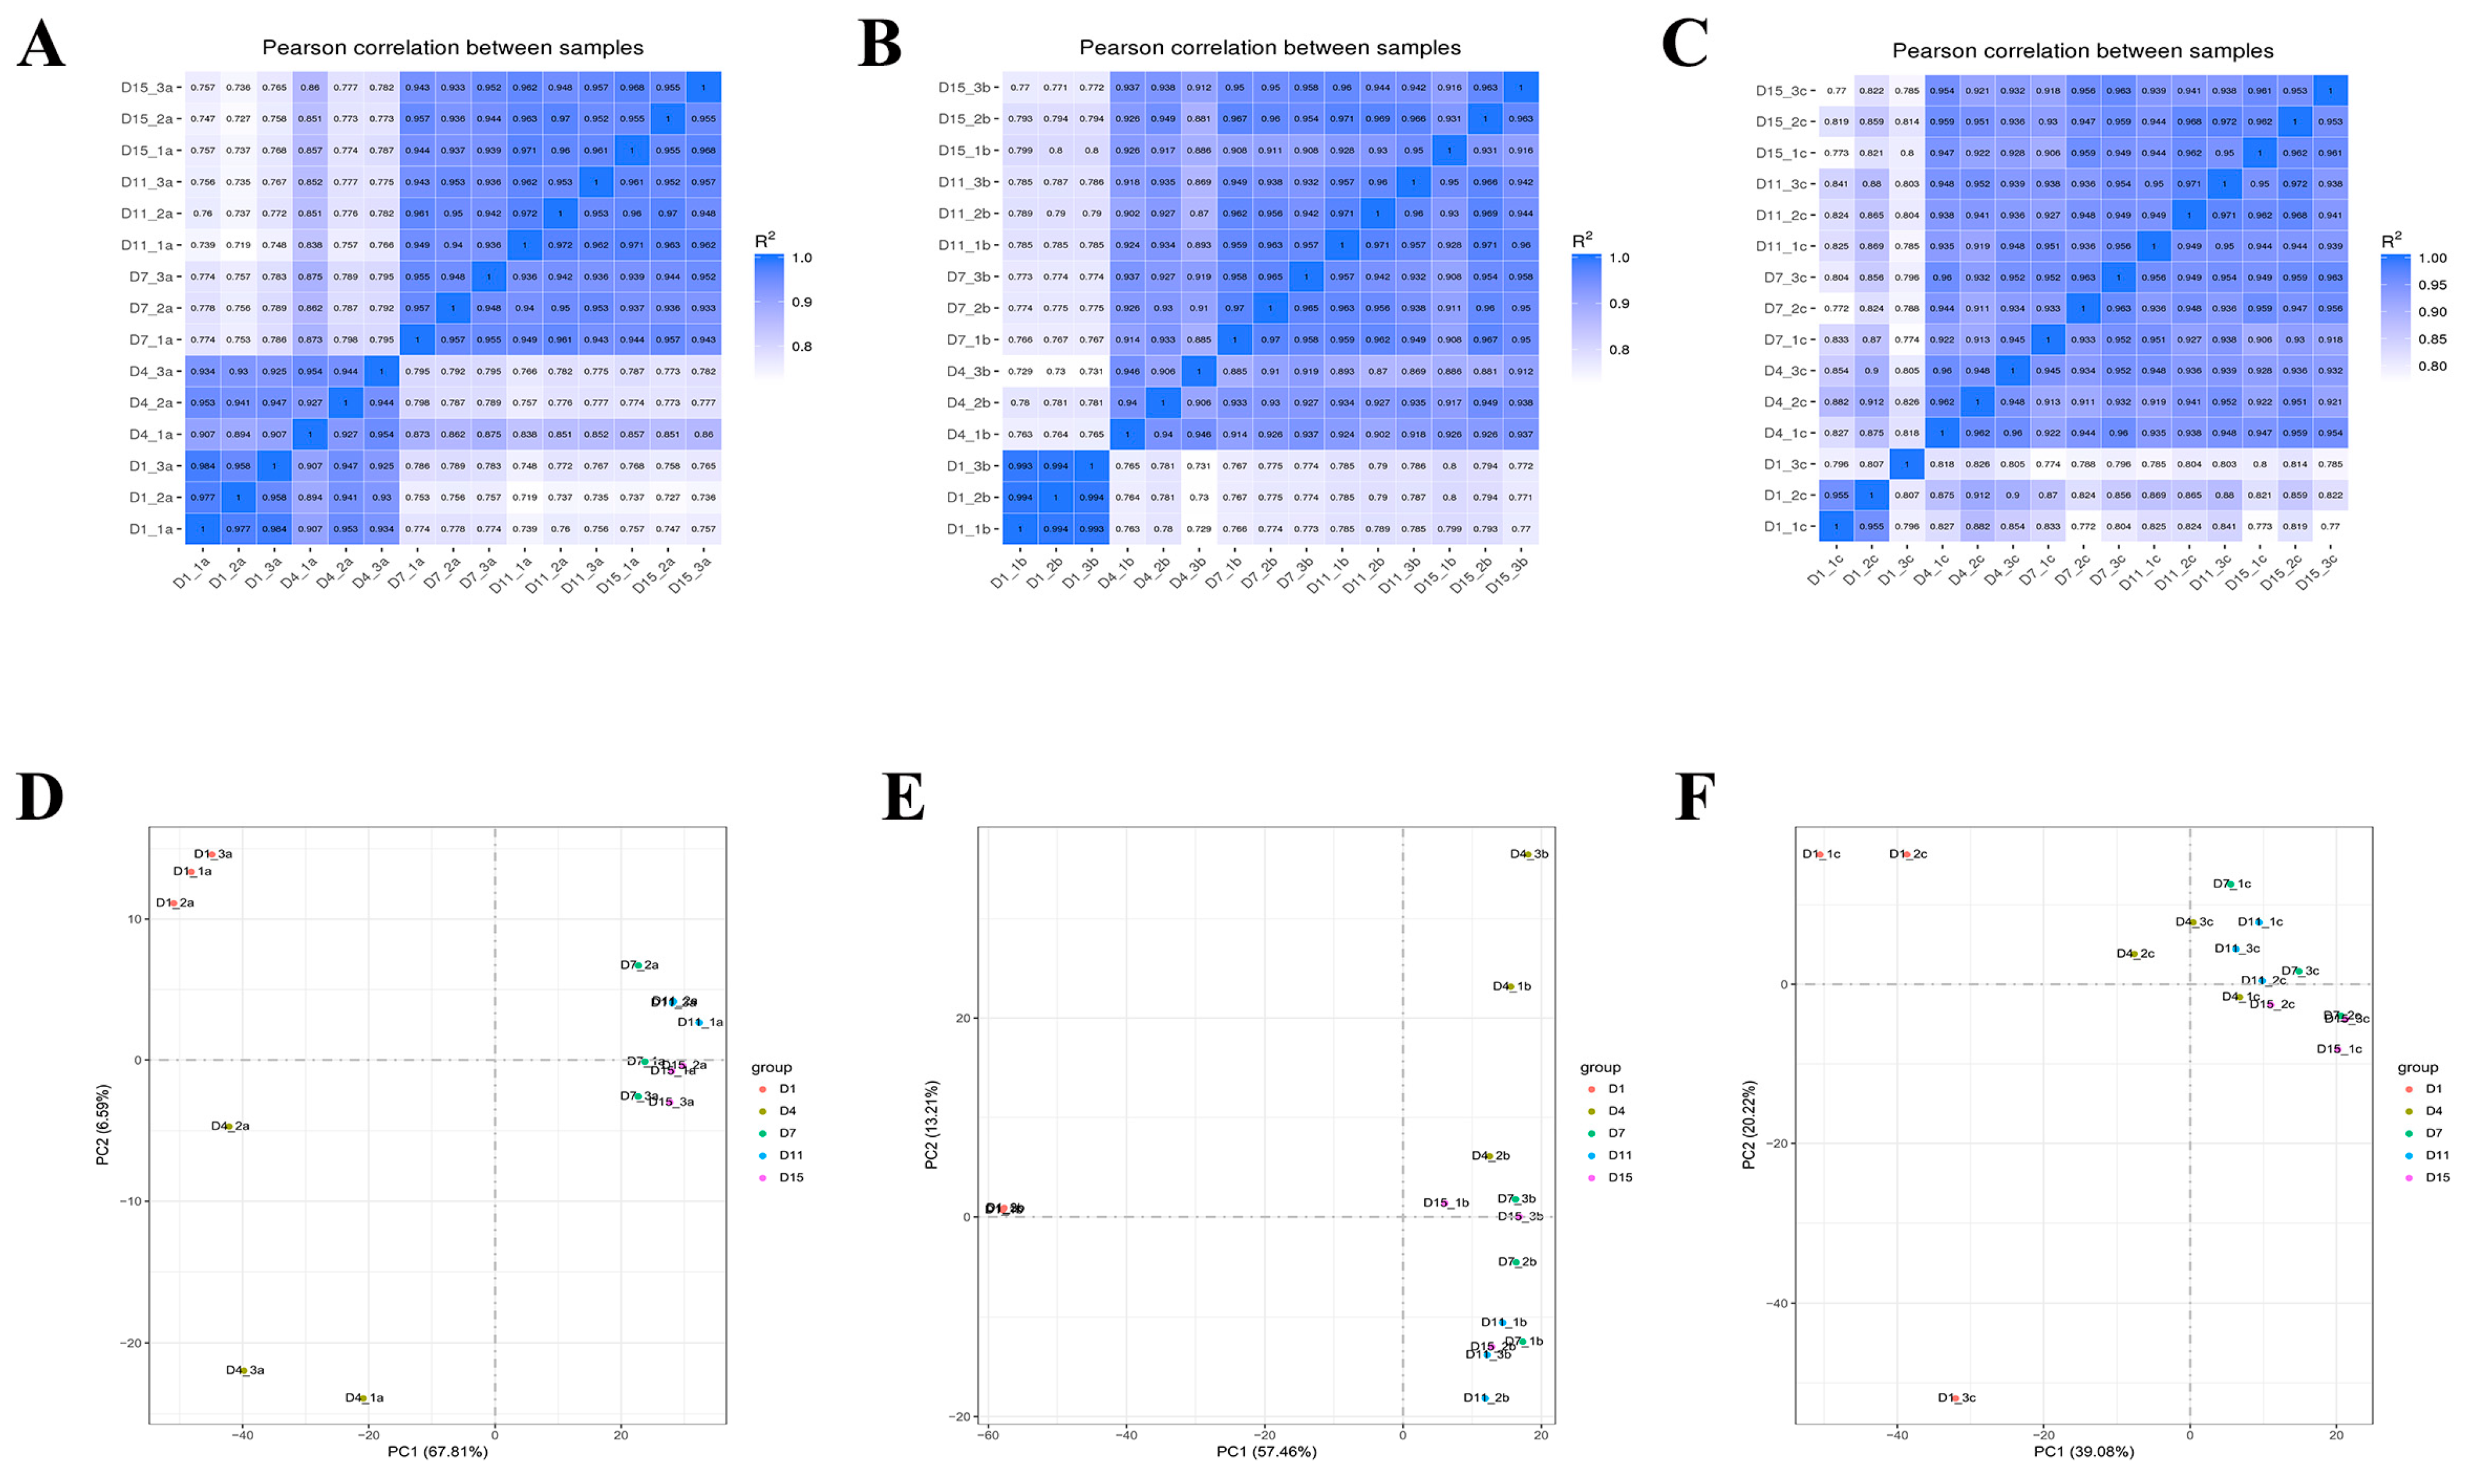
3.3. Transcriptome Sequencing and DEGs Analysis
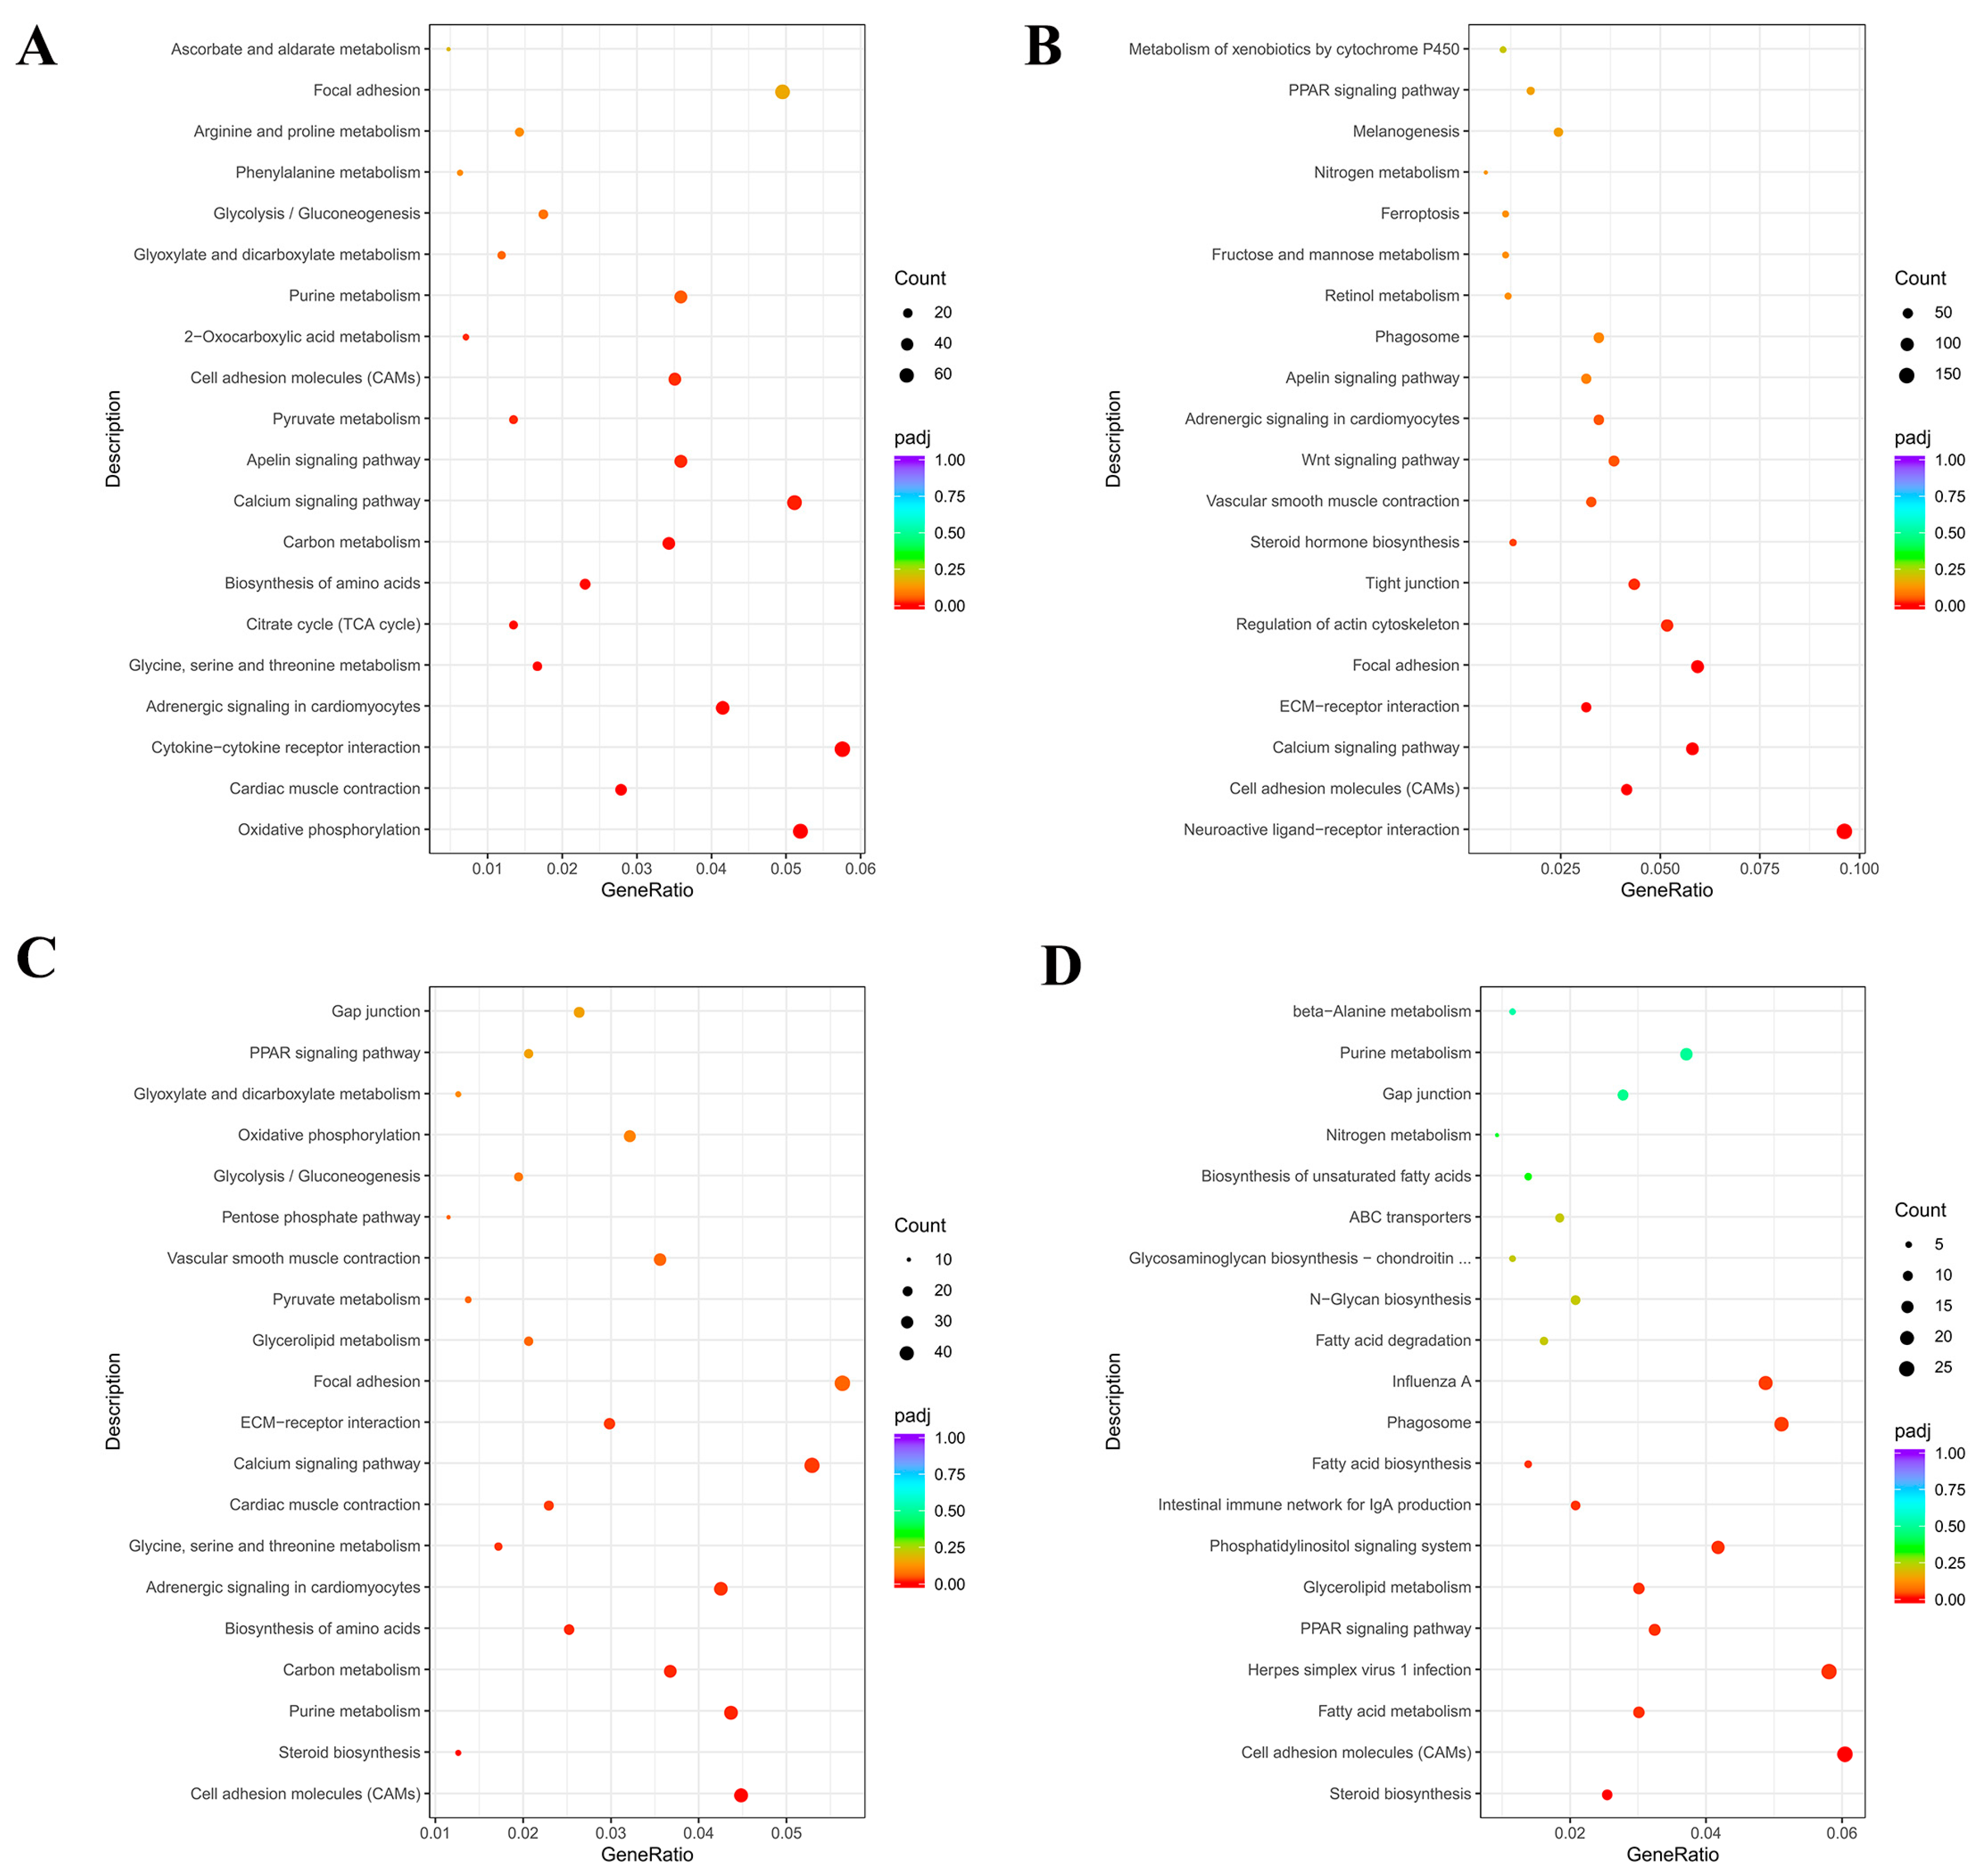
3.4. GO and KEGGs Pathway Enrichment Analysis
3.5. Validation of Sequencing Data by RT-qPCR
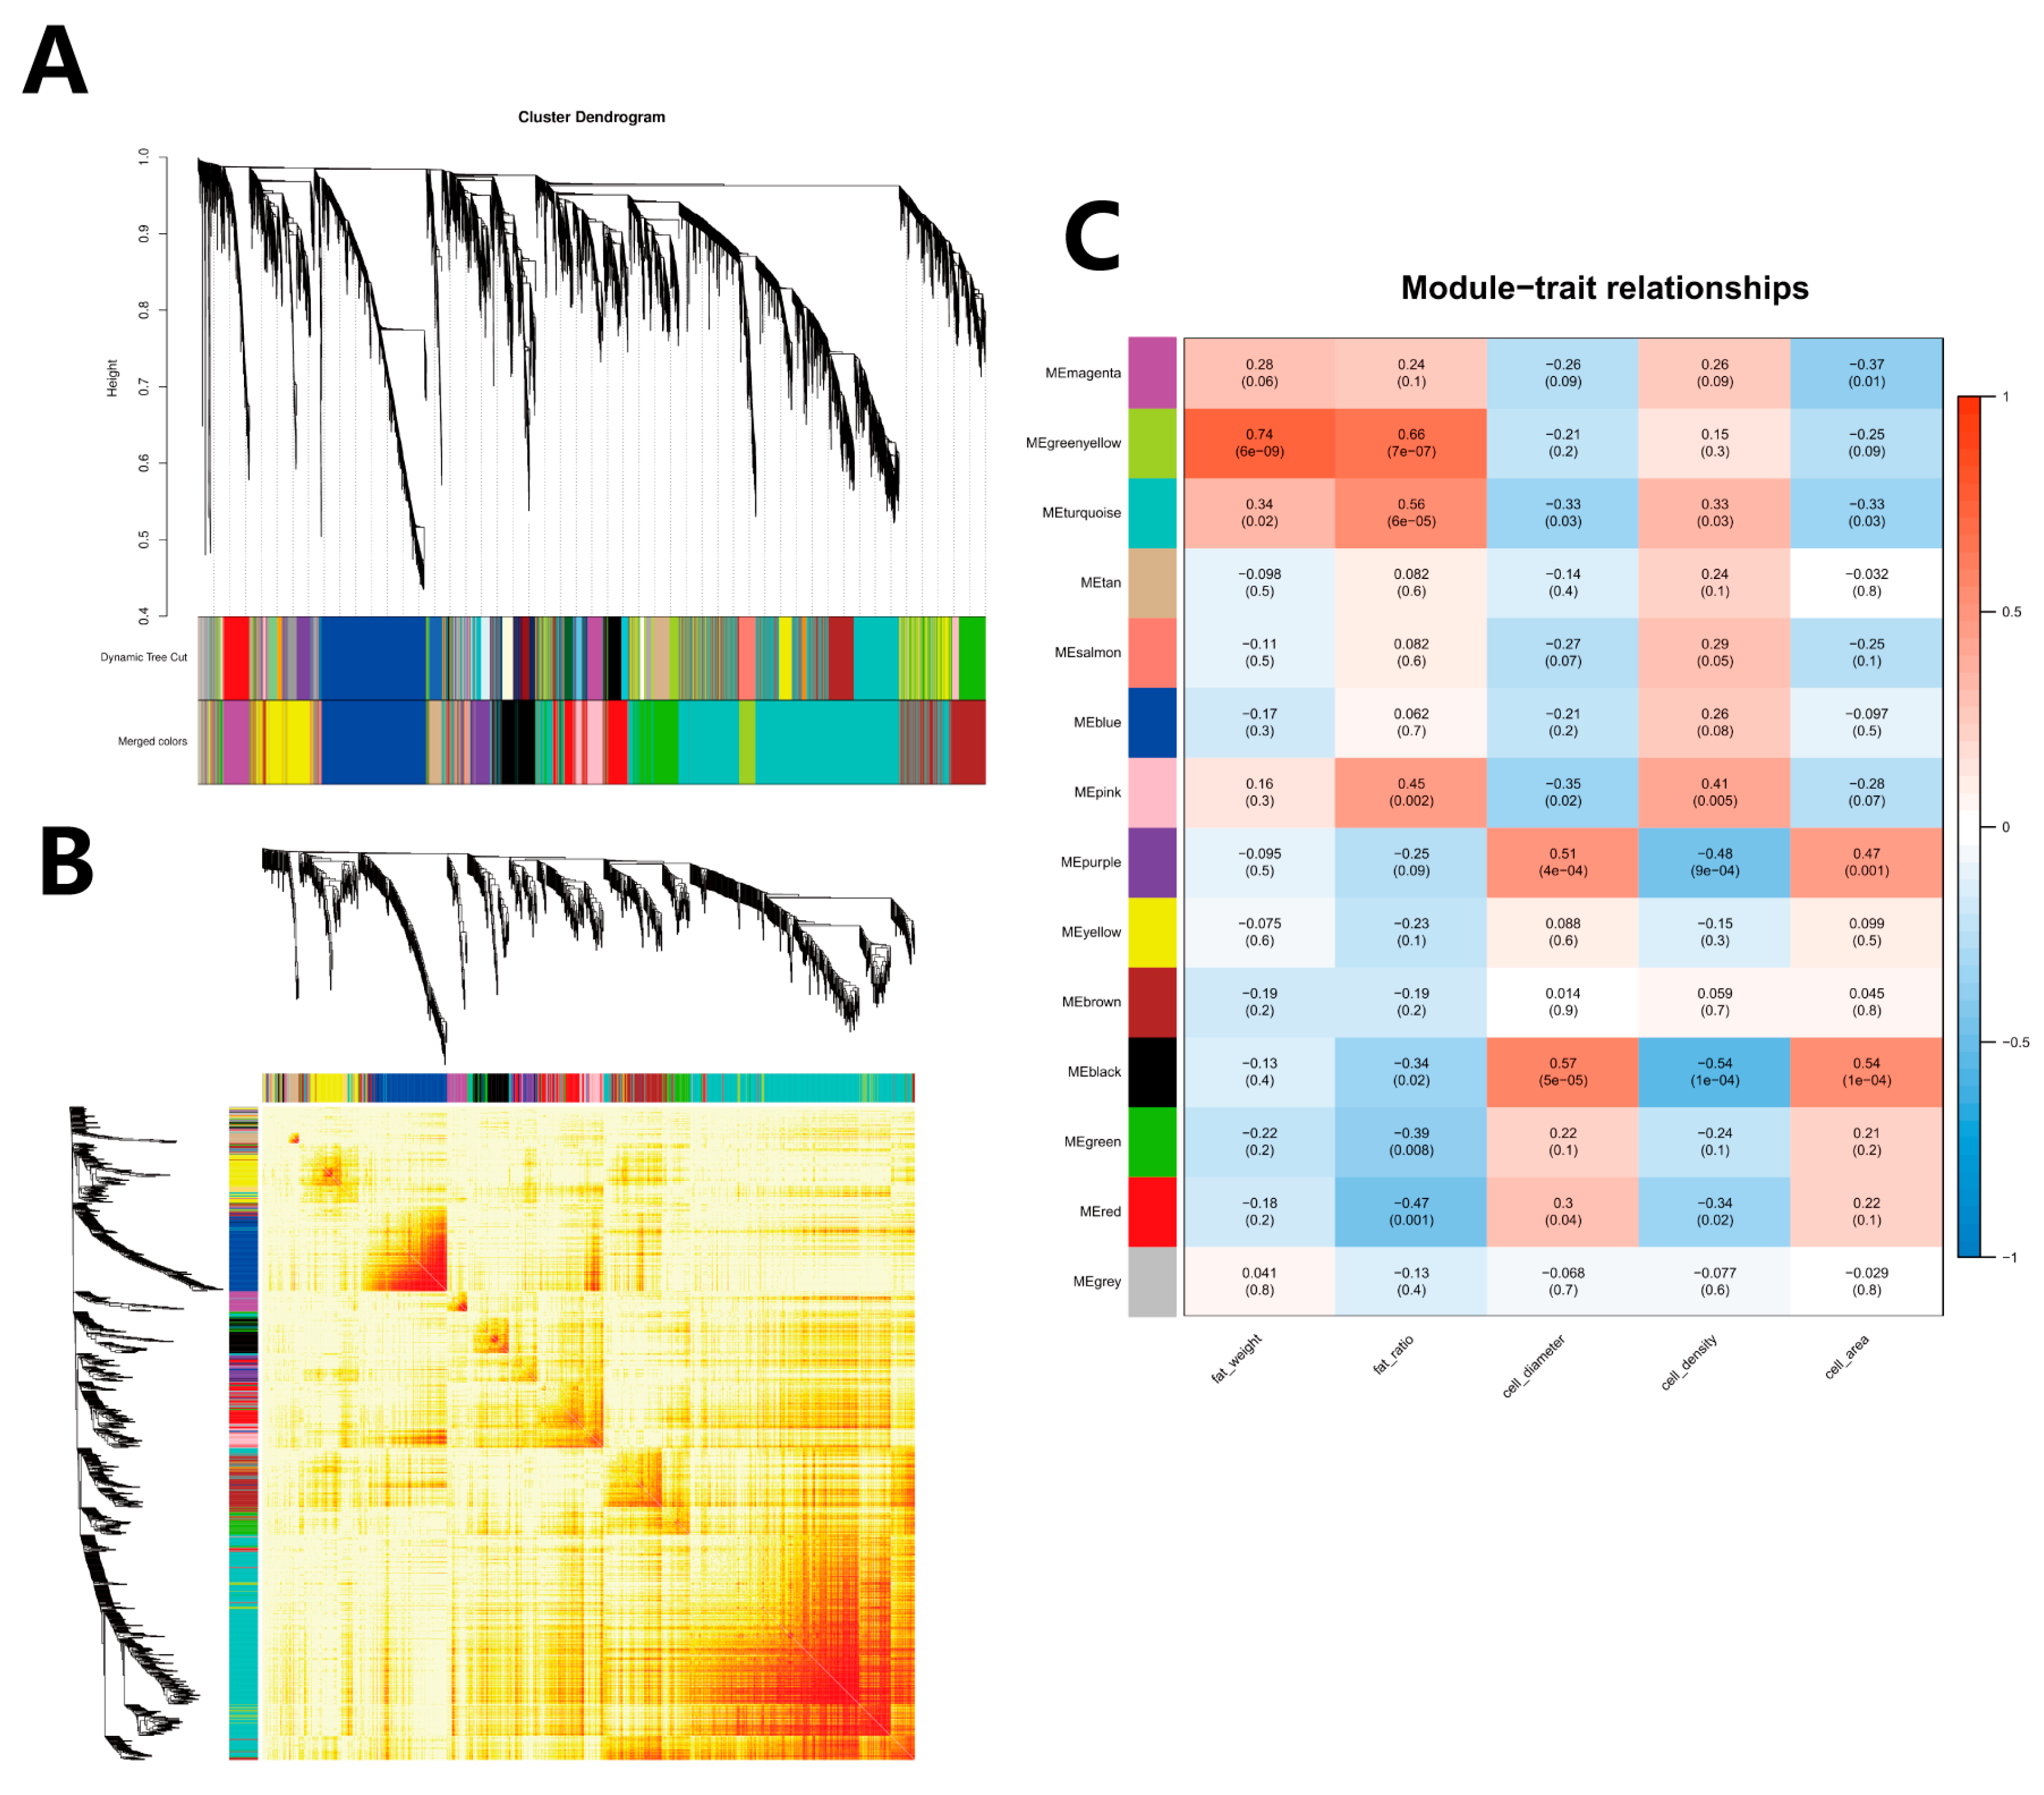
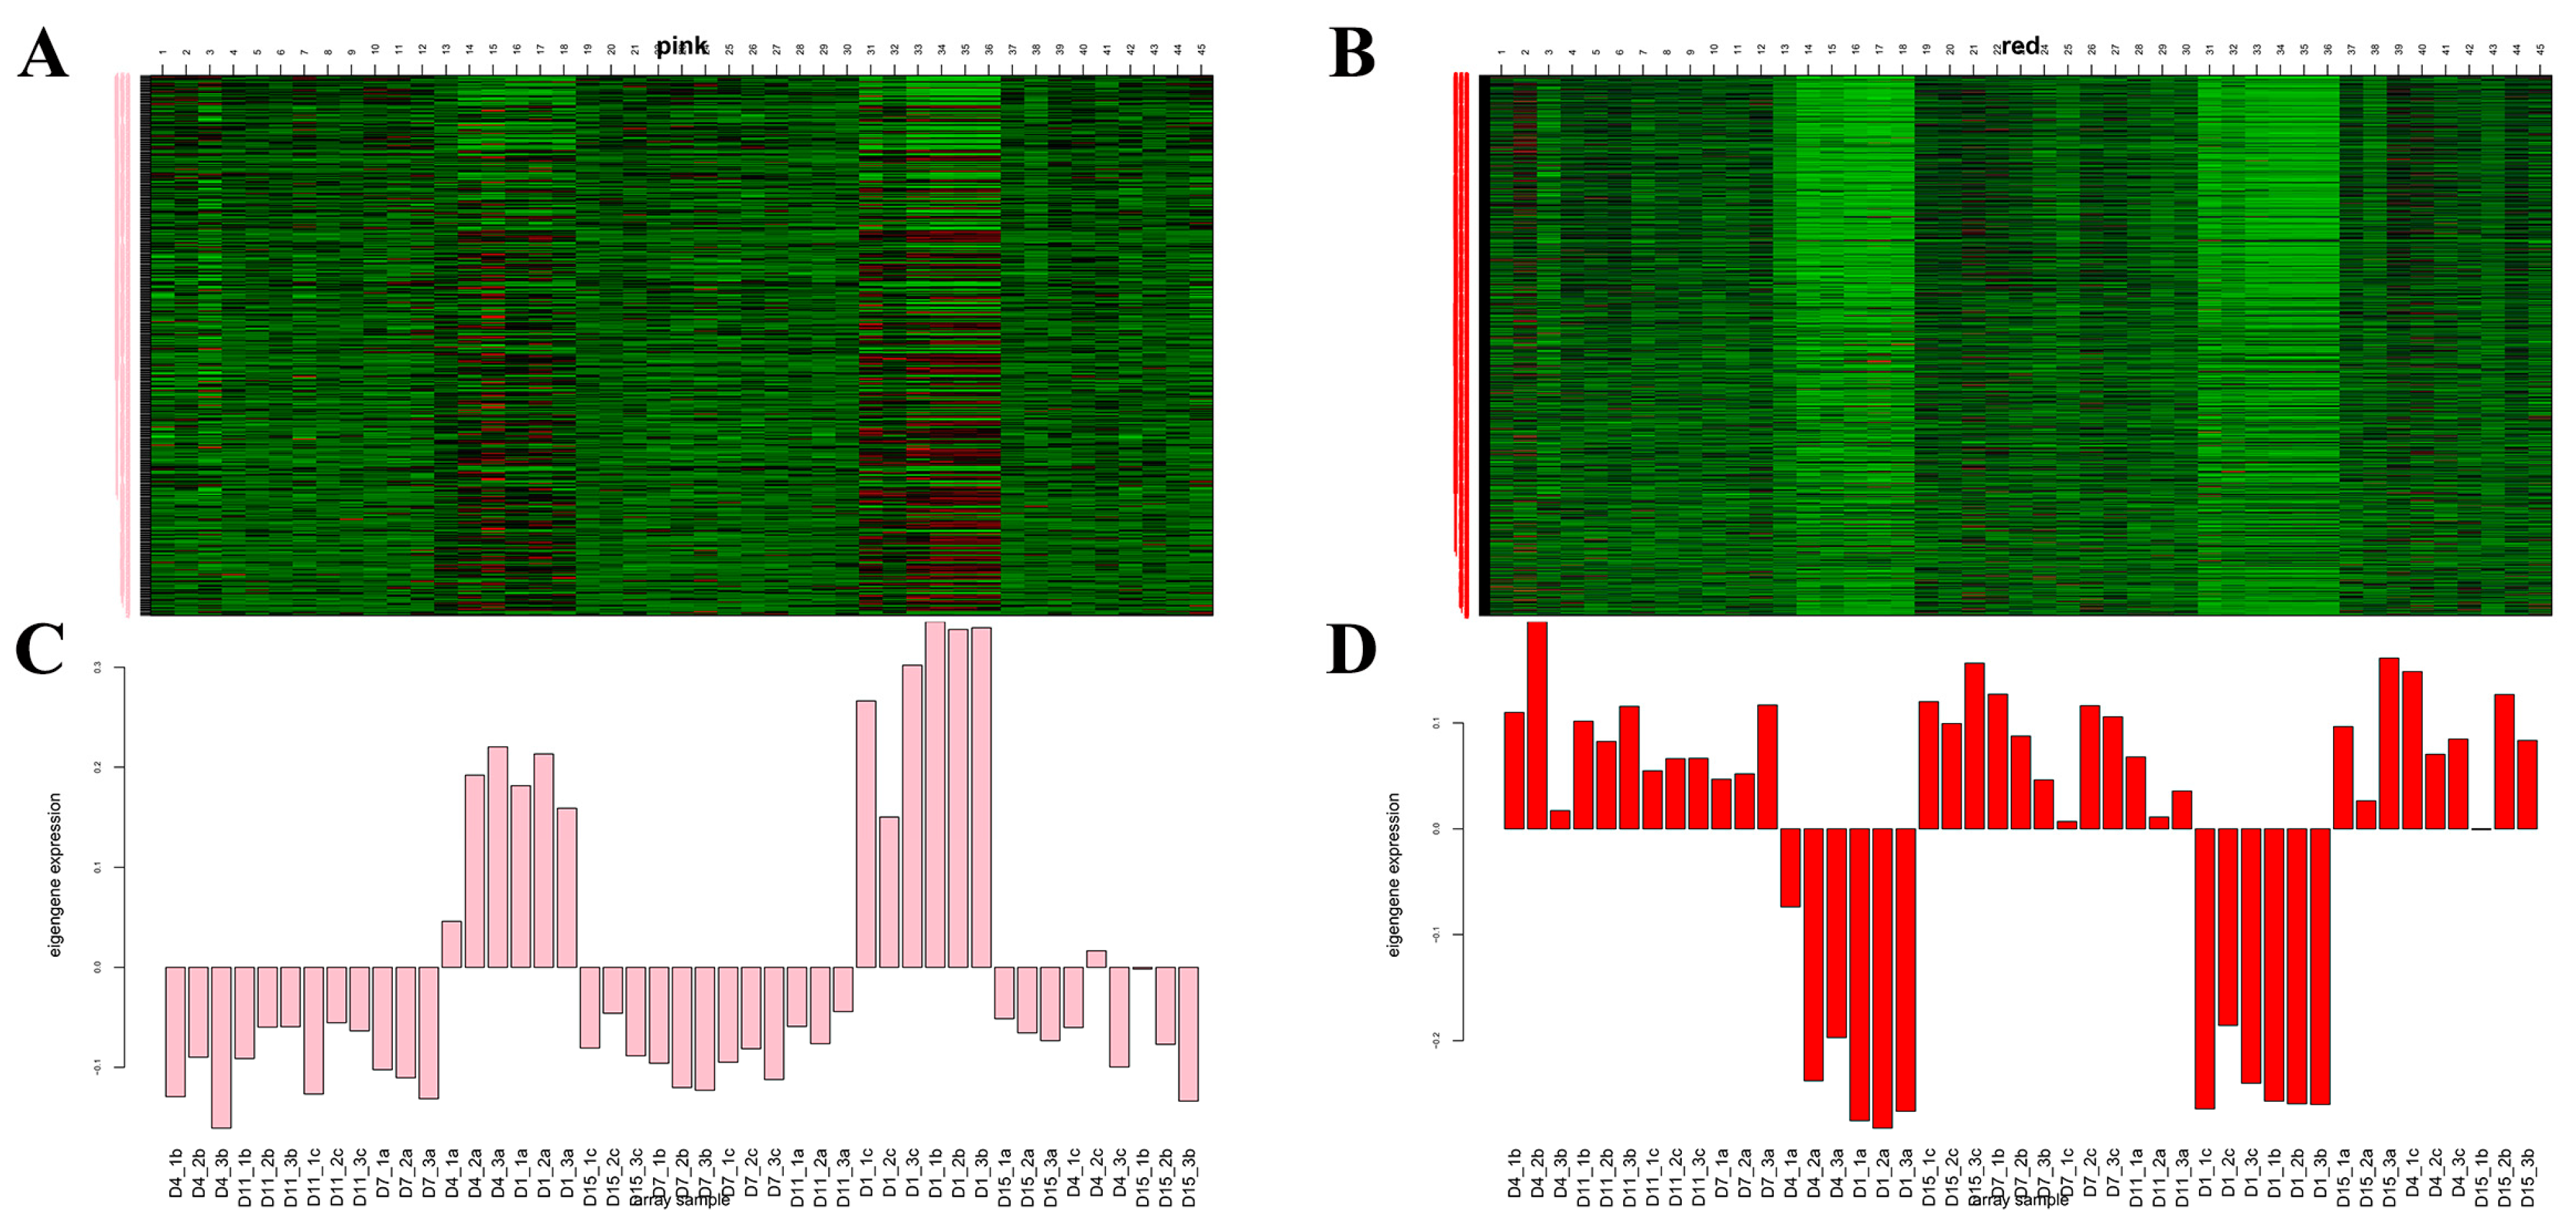
3.6. WGCNA Module Identification
3.7. Screening of Hub Genes in WGCNA Module
4. Discussion
5. Conclusions
Supplementary Materials
Author Contributions
Funding
Institutional Review Board Statement
Informed Consent Statement
Data Availability Statement
Conflicts of Interest
Abbreviations
| Ab | Abdominal Fat |
| Br | Thoracic Subcutaneous Fat |
| Cl | Clavicular Fat |
| PPARγ | Peroxisome Proliferator-Activated Receptor Gamma |
| CEBPα | CCAAT-Enhancer-Binding Protein Alpha |
| HE | Hematoxylin and Eosin |
| cDNA | Complementary Deoxyribonucleic Acid |
| RNA | Ribonucleic Acid |
| PCA | Principal Component Analysis |
| DEGs | Differentially Expressed Genes |
| WGCNA | Weighted Gene Co-expression Network Analysis |
| BP | Biological Process |
| CC | Cellular Component |
| MF | Molecular Function |
| KEGGs | Kyoto Encyclopedia of Genes and Genomes |
| GO | Gene Ontology |
| GS | Gene Significance |
| MM | Module Membership |
| TCA cycle | Citric Acid Cycle |
| ECM | Extracellular Matrix |
| CAMs | Cell Adhesion Molecules |
References
- Griffin, H.D.; Guo, K.; Windsor, D.; Butterwith, S.C. Adipose tissue lipogenesis and fat deposition in leaner broiler chickens. J. Nutr. 1992, 122, 363–368. [Google Scholar] [CrossRef] [PubMed]
- Butterwith, S.C. Regulators of adipocyte precursor cells. Poult. Sci. 1997, 76, 118–123. [Google Scholar] [CrossRef] [PubMed]
- Burt, D.W. The chicken genome. Genome Dyn. 2006, 2, 123–137. [Google Scholar] [PubMed]
- International Chicken Genome Sequencing Consortium. Sequence and comparative analysis of the chicken genome provide unique perspectives on vertebrate evolution. Nature 2004, 432, 695–716. [Google Scholar] [CrossRef] [PubMed]
- Renema, R.A.; Rustad, M.E.; Robinson, F.E. Implications of changes to commercial broiler and broiler breeder body weight targets over the past 30 years. World’s Poult. Sci. J. 2007, 63, 457–472. [Google Scholar] [CrossRef]
- Guilak, F.; Lott, K.E.; Awad, H.A.; Cao, Q.; Hicok, K.C.; Fermor, B.; Gimble, J.M. Clonal analysis of the differentiation potential of human adipose-derived adult stem cells. J. Cell. Physiol. 2006, 206, 229–237. [Google Scholar] [CrossRef]
- Wang, G.; Kim, W.K.; Cline, M.A.; Gilbert, E.R. Factors affecting adipose tissue development in chickens: A review. Poult. Sci. 2017, 96, 3687–3699. [Google Scholar] [CrossRef]
- Chouchani, E.T.; Kajimura, S. Metabolic adaptation and maladaptation in adipose tissue. Nat. Metab. 2019, 1, 189–200. [Google Scholar] [CrossRef]
- Wang, Y.; Mu, Y.; Li, H.; Ding, N.; Wang, Q.; Wang, Y.; Wang, S.; Wang, N. Peroxisome proliferator-activated receptor-gamma gene: A key regulator of adipocyte differentiation in chickens. Poult. Sci. 2008, 87, 226–232. [Google Scholar] [CrossRef]
- Zhao, L.; Liu, S.; Zhang, Z.; Zhang, J.; Jin, X.; Zhang, J.; Jiang, W.; Li, H.; Lin, H. Low and high concentrations of butyrate regulate fat accumulation in chicken adipocytes via different mechanisms. Adipocyte 2020, 9, 120–131. [Google Scholar] [CrossRef]
- Wan, X.; Yang, Z.; Ji, H.; Li, N.; Yang, Z.; Xu, L.; Yang, H.; Wang, Z. Effects of lycopene on abdominal fat deposition, serum lipids levels and hepatic lipid metabolism-related enzymes in broiler chickens. Anim. Biosci. 2021, 34, 385–392. [Google Scholar] [CrossRef] [PubMed]
- Chen, Y.; Akhtar, M.; Ma, Z.; Hu, T.; Liu, Q.; Pan, H.; Zhang, X.; Nafady, A.A.; Ansari, A.R.; Abdel-Kafy, E.M.; et al. Chicken cecal microbiota reduces abdominal fat deposition by regulating fat metabolism. NPJ Biofilms Microbiomes 2023, 9, 28. [Google Scholar] [CrossRef] [PubMed]
- Cahaner, A.; Nitsan, Z.; Nir, I. Weight and Fat-Content of Adipose and Nonadipose Tissues in Broilers Selected for or Against Abdominal Adipose-Tissue. Poult. Sci. 1986, 65, 215–222. [Google Scholar] [CrossRef]
- Xiao, Y.; Wang, G.; Gerrard, M.E. Changes in adipose tissue physiology during the first two weeks posthatch in chicks from lines selected for low or high body weight. Am. J. Physiol. Regul. Integr. Comp. Physiol. 2019, 316, R802–R818. [Google Scholar] [CrossRef]
- Su, Z.; Bai, X.; Wang, H.; Wang, S.; Chen, C.; Xiao, F.; Guo, H.; Gao, H.; Leng, L.; Li, H. Identification of biomarkers associated with the feed efficiency by metabolomics profiling: Results from the broiler lines divergent for high or low abdominal fat content. J. Anim. Sci. Biotechnol. 2022, 13, 122. [Google Scholar] [CrossRef] [PubMed]
- Peng, G.; Huang, E.; Ruan, J.; Huang, L.; Liang, H.; Wei, Q.; Xie, X.; Zeng, Q.; Huang, J. Effects of a high energy and low protein diet on hepatic and plasma characteristics and Cidea and Cidec mRNA expression in liver and adipose tissue of laying hens with fatty liver hemorrhagic syndrome. Anim. Sci. J. Nihon Chikusan Gakkaiho 2019, 90, 247–254. [Google Scholar] [CrossRef] [PubMed]
- Guo, L.; Huang, W.; Zhang, S.; Huang, Y.; Xu, Y.; Wu, R.; Fang, X.; Xu, H.; Nie, Q. Chicken Protein S Gene Regulates Adipogenesis and Affects Abdominal Fat Deposition. Animals 2022, 12, 2046. [Google Scholar] [CrossRef] [PubMed]
- Xu, S.; Chang, Y.; Wu, G.; Zhang, W.; Man, C. Potential role of miR-155-5p in fat deposition and skeletal muscle development of chicken. Biosci. Rep. 2020, 40, BSR20193796. [Google Scholar] [CrossRef]
- Chao, X.; Guo, L.; Wang, Q.; Huang, W.; Liu, M.; Luan, K.; Jiang, J.; Lin, S.; Nie, Q.; Luo, W.; et al. miR-429-3p/LPIN1 Axis Promotes Chicken Abdominal Fat Deposition via PPARγ Pathway. Front. Cell Dev. Biol. 2020, 8, 595637. [Google Scholar] [CrossRef]
- Zhai, B.; Li, H.; Li, S.; Gu, J.; Zhang, H.; Zhang, Y.; Li, H.; Tian, Y.; Li, G.; Wang, Y. Transcriptome analysis reveals FABP5 as a key player in the development of chicken abdominal fat, regulated by miR-122-5p targeting. BMC Genom. 2023, 24, 386. [Google Scholar] [CrossRef]
- Ono, M.; Aratani, Y.; Kitagawa, I.; Kitagawa, Y. Ascorbic acid phosphate stimulates type IV collagen synthesis and accelerates adipose conversion of 3T3-L1 cells. Exp. Cell Res. 1990, 187, 309–314. [Google Scholar] [CrossRef] [PubMed]
- Farmer, S.R. Transcriptional control of adipocyte formation. Cell Metab. 2006, 4, 263–273. [Google Scholar] [CrossRef] [PubMed]
- Kim, J.H.; Park, K.W.; Lee, E.W.; Jang, W.S.; Seo, J.; Shin, S.; Hwang, K.A.; Song, J. Suppression of PPARγ through MKRN1-mediated ubiquitination and degradation prevents adipocyte differentiation. Cell Death Differ. 2014, 21, 594–603. [Google Scholar] [CrossRef] [PubMed]
- Zhuo, Z.; Lamont, S.J.; Lee, W.R.; Abasht, B. RNA-Seq Analysis of Abdominal Fat Reveals Differences between Modern Commercial Broiler Chickens with High and Low Feed Efficiencies. PLoS ONE 2015, 10, e0135810. [Google Scholar] [CrossRef] [PubMed]
- Ward, A.B.; Mir, H.; Kapur, N.; Gales, D.N.; Carriere, P.P.; Singh, S. Quercetin inhibits prostate cancer by attenuating cell survival and inhibiting anti-apoptotic pathways. World J. Surg. Oncol. 2018, 16, 108. [Google Scholar] [CrossRef]
- Gao, H.; Wang, Y.; Li, W.; Gu, Y.; Lai, Y.; Bi, Y.; He, C. Transcriptomic comparison reveals genetic variation potentially underlying seed developmental evolution of soybeans. J. Exp. Bot. 2018, 69, 5089–5104. [Google Scholar] [CrossRef] [PubMed]
- Ross, S.E.; Hemati, N.; Longo, K.A.; Bennett, C.N.; Lucas, P.C.; Erickson, R.L.; MacDougald, O.A. Inhibition of adipogenesis by Wnt signaling. Science 2000, 289, 950–953. [Google Scholar] [CrossRef]
- Mortazavi, A.; Williams, B.A.; McCue, K.; Schaeffer, L.; Wold, B. Mapping and quantifying mammalian transcriptomes by RNA-Seq. Nat. Methods 2008, 5, 621–628. [Google Scholar] [CrossRef]
- Love, M.I.; Huber, W.; Anders, S. Moderated estimation of fold change and dispersion for RNA-seq data with DESeq2. Genome Biol. 2014, 15, 550. [Google Scholar] [CrossRef]
- Luo, N.; Shu, J.; Yuan, X.; Jin, Y.; Cui, H.; Zhao, G.; Wen, J. Differential regulation of intramuscular fat and abdominal fat deposition in chickens. BMC Genom. 2022, 23, 308. [Google Scholar] [CrossRef]
- Rao, X.; Huang, X.; Zhou, Z.; Lin, X. An improvement of the 2−ΔΔCT method for quantitative real-time polymerase chain reaction data analysis. Biostat. Bioinform. Biomath. 2013, 3, 71–85. [Google Scholar]
- Langfelder, P.; Horvath, S. WGCNA: An R package for weighted correlation network analysis. BMC Bioinform. 2008, 9, 559. [Google Scholar] [CrossRef] [PubMed]
- Zhang, X.; Hu, Y.; Ansari, A.R.; Akhtar, M.; Chen, Y.; Cheng, R.; Cui, L.; Nafady, A.A.; Elokil, A.A.; Abdel-Kafy, E.M.; et al. Caecal microbiota could effectively increase chicken growth performance by regulating fat metabolism. Microb. Biotechnol. 2022, 15, 844–861. [Google Scholar] [CrossRef] [PubMed]
- Zhang, X.Y.; Wu, M.Q.; Wang, S.Z.; Zhang, H.; Du, Z.Q.; Li, Y.M.; Cao, Z.P.; Luan, P.; Leng, L.; Li, H. Genetic selection on abdominal fat content alters the reproductive performance of broilers. Anim. Int. J. Anim. Biosci. 2018, 12, 1232–1241. [Google Scholar] [CrossRef] [PubMed]
- Han, D.; Deng, S.; Wang, H.; Huang, F.; Fauconnier, M.L.; Li, H.; Zheng, J.; Meng, L.; Zhang, C.; Li, X. Lipid oxidation and flavor changes in saturated and unsaturated fat fractions from chicken fat during a thermal process. Food Funct. 2023, 14, 6554–6569. [Google Scholar] [CrossRef] [PubMed]
- Sugii, S.; Wong, C.Y.Q.; Lwin, A.K.O.; Chew, L.J.M. Alternative fat: Redefining adipocytes for biomanufacturing cultivated meat. Trends Biotechnol. 2023, 41, 686–700. [Google Scholar] [CrossRef] [PubMed]
- Qiu, F.; Xie, L.; Ma, J.E.; Luo, W.; Zhang, L.; Chao, Z.; Chen, S.; Nie, Q.; Lin, Z.; Zhang, X. Lower Expression of SLC27A1 Enhances Intramuscular Fat Deposition in Chicken via Down-Regulated Fatty Acid Oxidation Mediated by CPT1A. Front. Physiol. 2017, 8, 449. [Google Scholar] [CrossRef]
- Suk, Y.O.; Washburn, K.W. Effects of environment on growth, efficiency of feed utilization, carcass fatness, and their association. Poult. Sci. 1995, 74, 285–296. [Google Scholar] [CrossRef]
- Brue, R.N.; Latshaw, J.D. Energy utilization by the broiler chicken as affected by various fats and fat levels. Poult. Sci. 1985, 64, 2119–2130. [Google Scholar] [CrossRef]
- Wu, M.; Huang, Y.; Zhu, Q.; Zhu, X.; Xue, L.; Xiong, J.; Chen, Y.; Wu, C.; Guo, Y.; Li, Y.; et al. Adipose tissue and ovarian aging: Potential mechanism and protective strategies. Ageing Res. Rev. 2022, 80, 101683. [Google Scholar] [CrossRef]
- Chen, P.; Suh, Y.; Choi, Y.M.; Shin, S.; Lee, K. Developmental regulation of adipose tissue growth through hyperplasia and hypertrophy in the embryonic Leghorn and broiler. Poult. Sci. 2014, 93, 1809–1817. [Google Scholar] [CrossRef] [PubMed]
- Bai, S.; Wang, G.; Zhang, W.; Zhang, S.; Rice, B.B.; Cline, M.A.; Gilbert, E.R. Broiler chicken adipose tissue dynamics during the first two weeks post-hatch. Comp. Biochem. Physiol. Part A Mol. Integr. Physiol. 2015, 189, 115–123. [Google Scholar] [CrossRef] [PubMed]
- Fouad, A.M.; El-Senousey, H.K. Nutritional factors affecting abdominal fat deposition in poultry: A review. Asian-Australas. J. Anim. Sci. 2014, 27, 1057–1068. [Google Scholar] [CrossRef] [PubMed]
- Liu, X.; Wang, C.; Wang, Y.; Wang, C.; Sun, X.; Zhu, Y.; Yang, X.; Zhang, L.; Liu, Y. Age-associated changes in the growth development of abdominal fat and their correlations with cecal gut microbiota in broiler chickens. Poult. Sci. 2023, 102, 102900. [Google Scholar] [CrossRef] [PubMed]
- Cherry, J.A.; Swartworth, W.J.; Siegel, P.B. Adipose Cellularity Studies in Commercial Broiler Chicks. Poult. Sci. 1984, 63, 97–108. [Google Scholar] [CrossRef]
- Abdalla, B.A.; Chen, J.; Nie, Q.; Zhang, X. Genomic Insights Into the Multiple Factors Controlling Abdominal Fat Deposition in a Chicken Model. Front. Genet. 2018, 9, 262. [Google Scholar] [CrossRef] [PubMed]
- Xu, T.; Gu, L.; Schachtschneider, K.M.; Liu, X.; Huang, W.; Xie, M.; Hou, S. Identification of differentially expressed genes in breast muscle and skin fat of postnatal Pekin duck. PLoS ONE 2014, 9, e107574. [Google Scholar] [CrossRef] [PubMed]
- Heinonen, S.; Muniandy, M.; Buzkova, J.; Mardinoglu, A.; Rodríguez, A.; Frühbeck, G.; Hakkarainen, A.; Lundbom, J.; Lundbom, N.; Kaprio, J.; et al. Mitochondria-related transcriptional signature is downregulated in adipocytes in obesity: A study of young healthy MZ twins. Diabetologia 2017, 60, 169–181. [Google Scholar] [CrossRef]
- Bełtowski, J. Apelin and visfatin: Unique “beneficial” adipokines upregulated in obesity? Med. Sci. Monit. Int. Med. J. Exp. Clin. Res. 2006, 12, RA112–RA119. [Google Scholar]
- Ceylan-Isik, A.F.; Kandadi, M.R.; Xu, X.; Hua, Y.; Chicco, A.J.; Ren, J.; Nair, S. Apelin administration ameliorates high fat diet-induced cardiac hypertrophy and contractile dysfunction. J. Mol. Cell. Cardiol. 2013, 63, 4–13. [Google Scholar] [CrossRef]
- Lee, H.J.; Jang, M.; Kim, H.; Kwak, W.; Park, W.; Hwang, J.Y.; Lee, C.K.; Jang, G.W.; Park, M.N.; Kim, H.C.; et al. Comparative Transcriptome Analysis of Adipose Tissues Reveals that ECM-Receptor Interaction Is Involved in the Depot-Specific Adipogenesis in Cattle. PLoS ONE 2013, 8, e66267. [Google Scholar] [CrossRef] [PubMed]
- San, J.; Du, Y.; Wu, G.; Xu, R.; Yang, J.; Hu, J. Transcriptome analysis identifies signaling pathways related to meat quality in broiler chickens—The extracellular matrix (ECM) receptor interaction signaling pathway. Poult. Sci. 2021, 100, 101135. [Google Scholar] [CrossRef] [PubMed]
- Yang, M.; Hu, B.; Sun, D.; Zhao, C.; Wei, H.; Li, D.; Liao, Z.; Zhao, Y.; Liang, J.; Shi, M.; et al. Growth hormone receptor gene influences mitochondrial function and chicken lipid metabolism by AMPK-PGC1α-PPAR signaling pathway. BMC Genom. 2022, 23, 219. [Google Scholar] [CrossRef] [PubMed]
- Ning, Z.; Deng, X.; Li, L.; Feng, J.; Du, X.; Amevor, F.K.; Tian, Y.; Li, L.; Rao, Y.; Yi, Z.; et al. miR-128-3p regulates chicken granulosa cell function via 14-3-3β/FoxO and PPAR-γ/LPL signaling pathways. Int. J. Biol. Macromol. 2023, 241, 124654. [Google Scholar] [CrossRef]
- Braun, T.; Arnold, H.H. The four human muscle regulatory helix-loop-helix proteins Myf3-Myf6 exhibit similar hetero-dimerization and DNA binding properties. Nucleic Acids Res. 1991, 19, 5645–5651. [Google Scholar] [CrossRef] [PubMed]
- Ojima, K.; Muroya, S.; Wada, H.; Ogawa, K.; Oe, M.; Takimoto, K.; Nishimura, T. Immature adipocyte-derived exosomes inhibit expression of muscle differentiation markers. FEBS Open Bio 2021, 11, 768–781. [Google Scholar] [CrossRef] [PubMed]
- Agra, R.M.; Fernández-Trasancos, Á.; Sierra, J.; González-Juanatey, J.R.; Eiras, S. Differential association of S100A9, an inflammatory marker, and p53, a cell cycle marker, expression with epicardial adipocyte size in patients with cardiovascular disease. Inflammation 2014, 37, 1504–1512. [Google Scholar] [CrossRef] [PubMed]
- Kabir, S.M.; Lee, E.-S.; Son, D.-S. Chemokine network during adipogenesis in 3T3-L1 cells: Differential response between growth and proinflammatory factor in preadipocytes vs. adipocytes. Adipocyte 2014, 3, 97–106. [Google Scholar] [CrossRef]
- Deng, J.; Guo, Y.; Yuan, F.; Chen, S.; Yin, H.; Jiang, X.; Jiao, F.; Wang, F.; Ji, H.; Hu, G.; et al. Autophagy inhibition prevents glucocorticoid-increased adiposity via suppressing BAT whitening. Autophagy 2020, 16, 451–465. [Google Scholar] [CrossRef]
- Kim, Y.J.; Cho, S.Y.; Yun, C.H.; Moon, Y.S.; Lee, T.R.; Kim, S.H. Transcriptional activation of Cidec by PPARgamma2 in adipocyte. Biochem. Biophys. Res. Commun. 2008, 377, 297–302. [Google Scholar] [CrossRef]
- Li, H.; Sun, J.; Li, B.; Jiang, A.; Tao, J.; Ning, C.; Li, R.; Liu, H. AMPK-PPARγ-Cidec Axis Drives the Fasting-Induced Lipid Droplet Aggregation in the Liver of Obese Mice. Front. Nutr. 2022, 9, 917801. [Google Scholar] [CrossRef]
- Cui, Z.; Jin, N.; Amevor, F.K.; Shu, G.; Du, X.; Kang, X.; Ning, Z.; Deng, X.; Tian, Y.; Zhu, Q.; et al. Dietary supplementation of salidroside alleviates liver lipid metabolism disorder and inflammatory response to promote hepatocyte regeneration via PI3K/AKT/Gsk3-β pathway. Poult. Sci. 2022, 101, 102034. [Google Scholar] [CrossRef]
- Egecioglu, E.; Ploj, K.; Xu, X.; Bjursell, M.; Salomé, N.; Andersson, N.; Ohlsson, C.; Taube, M.; Hansson, C.; Bohlooly, Y.M.; et al. Central NMU signaling in body weight and energy balance regulation: Evidence from NMUR2 deletion and chronic central NMU treatment in mice. American Journal of Physiology. Endocrinol. Metab. 2009, 297, E708–E716. [Google Scholar] [CrossRef]
- Kyoka Yokogi, Y.G.; Otsuka, M.; Ojima, F.; Kobayashi, T.; Tsuchiba, Y.; Takeuchi, Y.; Namba, M.; Kohno, M.; Tetsuka, M.; Takeuchi, S.; et al. Neuromedin U-deficient rats do not lose body weight or food intake. Sci. Rep. 2022, 12, 17472. [Google Scholar]


Disclaimer/Publisher’s Note: The statements, opinions and data contained in all publications are solely those of the individual author(s) and contributor(s) and not of MDPI and/or the editor(s). MDPI and/or the editor(s) disclaim responsibility for any injury to people or property resulting from any ideas, methods, instructions or products referred to in the content. |
© 2024 by the authors. Licensee MDPI, Basel, Switzerland. This article is an open access article distributed under the terms and conditions of the Creative Commons Attribution (CC BY) license (https://creativecommons.org/licenses/by/4.0/).
Share and Cite
Wei, S.; Kang, X.; Amevor, F.K.; Du, X.; Wu, Y.; Xu, Z.; Cao, X.; Shu, G.; Zhao, X. RNA-Seq Analysis Reveals the Molecular Mechanisms Regulating the Development of Different Adipose Tissues in Broiler Chicks. Animals 2024, 14, 899. https://doi.org/10.3390/ani14060899
Wei S, Kang X, Amevor FK, Du X, Wu Y, Xu Z, Cao X, Shu G, Zhao X. RNA-Seq Analysis Reveals the Molecular Mechanisms Regulating the Development of Different Adipose Tissues in Broiler Chicks. Animals. 2024; 14(6):899. https://doi.org/10.3390/ani14060899
Chicago/Turabian StyleWei, Shuo, Xincheng Kang, Felix Kwame Amevor, Xiaxia Du, Youhao Wu, Zhengyu Xu, Xueqing Cao, Gang Shu, and Xiaoling Zhao. 2024. "RNA-Seq Analysis Reveals the Molecular Mechanisms Regulating the Development of Different Adipose Tissues in Broiler Chicks" Animals 14, no. 6: 899. https://doi.org/10.3390/ani14060899
APA StyleWei, S., Kang, X., Amevor, F. K., Du, X., Wu, Y., Xu, Z., Cao, X., Shu, G., & Zhao, X. (2024). RNA-Seq Analysis Reveals the Molecular Mechanisms Regulating the Development of Different Adipose Tissues in Broiler Chicks. Animals, 14(6), 899. https://doi.org/10.3390/ani14060899