Article

Mitochondrial Variation of Bottlenose Dolphins (Tursiops truncatus) from the Canary Islands Suggests a Key Population for Conservation with High Connectivity within the North-East Atlantic Ocean

by
Daniel A. Gómez-Lobo
1,2,
Agustín P. Monteoliva
2,
Antonio Fernandez
3,
Manuel Arbelo
3,
Jesús de la Fuente
3,
Mónica Pérez-Gil
4,
Nuria Varo-Cruz
4,
Antonella Servidio
4,
Enrique Pérez-Gil
4,
Yaisel J. Borrell
1 and
Laura Miralles
1,2,*
1
Department of Functional Biology, University of Oviedo, 33006 Oviedo, Spain
2
Department of Environmental Genetics, Ecohydros, 39600 Maliaño, Spain
3
Veterinary Histology and Pathology, Atlantic Center for Cetacean Research, Institute of Animal Health and Food Safety (IUSA), Veterinary School, University of Las Palmas de Gran Canaria, 35001 Las Palmas, Spain
4
Cetaceans and Marine Research Institute of the Canary Islands (CEAMAR), 35509 Las Palmas, Spain
*
Author to whom correspondence should be addressed.
Animals 2024, 14(6), 901; https://doi.org/10.3390/ani14060901
Submission received: 1 February 2024 / Revised: 8 March 2024 / Accepted: 12 March 2024 / Published: 14 March 2024
(This article belongs to the Special Issue Protecting Endangered Species)

Abstract

:

Simple Summary

The common bottlenose dolphin, Tursiops truncatus, is a worldwide cetacean species essential for marine ecosystems’ health and balance. Understanding the genetic connectivity and structure of different populations is crucial for the correct management and conservation of a species, such as designing Special Areas of Conservation or Marine Protected Areas. In this study, we described the genetic composition of 49 bottlenose dolphins from the Canary Islands, which were previously unstudied, and compared them with individuals from the rest of the North-East Atlantic Ocean. The results showed that Canarian bottlenose dolphins have a remarkably diverse genetic composition, and this population is possibly part of a larger oceanic population in the North Atlantic. Therefore, the studied Special Areas of Conservation in the Canary Islands may correspond to a hotspot of genetic diversity and could be a strategic area for the conservation of the species.

Abstract

In recent decades, worldwide cetacean species have been protected, but they are still threatened. The bottlenose dolphin (Tursiops truncatus) is a vulnerable keystone species and a useful bioindicator of the health and balance of marine ecosystems in oceans all over the world. The genetic structure of the species is shaped by their niche specialization (along with other factors), leading to the classification of two ecotypes: coastal and pelagic. In this study, the genetic diversity, population structure, and ecotypes of bottlenose dolphins from the Canary Islands were assessed through the analysis of 49 new samples from biopsies and from stranded animals using the 636 bp portion of the mitochondrial control region and 343 individuals from databases (n = 392). The results reveal high genetic diversity in Canarian bottlenose dolphins (Hd = 0.969 and π = 0.0165) and the apparent lack of population genetic structure within this archipelago. High genetic structure (Fst, Φst) was found between the Canary Islands and coastal populations, while little to no structure was found with the pelagic populations. These results suggest that Canarian bottlenose dolphins are part of pelagic ecotype populations in the North Atlantic. The studied Special Areas of Conservation in the Canary Islands may correspond to a hotspot of genetic diversity of the species and could be a strategic area for the conservation of the oceanic ecotype of bottlenose dolphins.

1. Introduction

The common bottlenose dolphin (Tursiops truncatus) is one of the most widely distributed cetacean species occurring in temperate and tropical waters worldwide [1]. As top predators, they are useful bioindicators of the health and status of marine ecosystems and play vital roles in maintaining the balance in such environments [2,3]. Thanks to their behavioral and ecological plasticity, bottlenose dolphins can inhabit a vast range of aquatic ecosystems, from deep oceanic waters to coastal estuarine ecosystems, even roaming into rivers [4,5]. This great ecological variability and the lack of apparent physical barriers to dispersal or gene flow in the marine environment make it challenging to define a population (stock) and its boundaries, which have important implications in both evolutionary and conservation biology.
The bottlenose dolphin is protected by the EU Habitats Directive 92/43/EEC. It is included in the Berne Convention as strictly protected fauna, and its coastal ecotype is present in the ACCOBAMS (Agreement on the Conservation of Cetaceans in the Black Sea, Mediterranean Sea and contiguous Atlantic area). In Spain, it is cataloged as Vulnerable (VU) in the National Catalog of Endangered Species in both peninsular waters (Order of 10 March 2000) and in those of the Canary Islands (Order of 9 June 1999). The bottlenose dolphin is also included as Vulnerable in the Red Book of Vertebrates, both in the waters of the European Union and in the Spanish Mediterranean. However, globally, the common bottlenose dolphin is cataloged as Least Concern (LC) in the IUCN Red List of Threatened Species [6], and different populations from distant geographical areas face different anthropogenic threats; therefore, such populations should be categorized and managed separately. For example, Mediterranean populations were classified as Vulnerable (VU) until 2021 [7], and currently, the Fiordland subpopulation in New Zealand is listed as Critically Endangered (CE) [8], raising special conservation concerns for small and resident coastal populations.
Coastal bottlenose dolphin populations are commonly found in shallow waters less than 40 m deep, while pelagic populations are observed in outer deeper oceanic waters (200 to 4000 m) [9,10], and several studies have noted differences in their distribution, diet, and skull morphology [11,12,13,14,15], leading to the idea of two different ecotypes. In addition, findings of significant genetic structure have reinforced this idea, with coastal populations presenting lower genetic diversity [16,17,18,19,20,21,22,23]. Site fidelity, along with resource specialization and different social and behavioral strategies, appears to be a strong driving force of genetic structuring in coastal resident bottlenose dolphins worldwide [12,15,16,19,20,21,23,24,25,26]. In the North Atlantic Ocean, pelagic populations show a highly diverse pattern with high levels of gene flow among extremely distant geographical regions, suggesting the existence of a single large panmictic oceanic population [16,18,20,22]. On the contrary, some coastal populations present fine-scale levels of genetic structure with low diversity [19,22,23,25,27], and even the recent extinction of a genetically isolated population (e.g., Humber estuary, UK) has occurred with no signs of repopulation so far [28]. Such contrasting patterns and the reduced population size of coastal bottlenose dolphins raise special concerns about the conservation of the species. Since coastal cetaceans could face more anthropogenic threats than oceanic ones [29], and their low effective population sizes might lead to a decrease in the adaptive potential to environmental changes [30,31], the identification of such threatened populations is crucial for the management of the species (e.g., designation of Special Areas of Conservation, SACs).
The Canary Islands is one of the major four archipelagos (Azores, Madeira, Canaries, and Cape Verde) within the Macaronesian region. This region is characterized by complex geomorphology, with several sea mountains, volcanic activity, and a rugged coastline [32]. Its bathymetry is typical of oceanic islands, rapidly reaching depths of 200 m near the coast (Figure 1). Many cetacean species inhabit and roam these oceanic waters, representing not only a hotspot of cetacean abundance and diversity [33] but also an important biological corridor for these large marine mammals due to their high dispersal capacities. Bottlenose dolphin populations observed in different SACs from the Canary Islands show high site fidelity patterns and are greater than populations of other archipelagos (e.g., Hawaii or Bahamas; [34]). Several individuals have been resighted off two or more islands and even in other archipelagos (Madeira), providing evidence of the long-distance movements (≈500 km) that these dolphins can undertake [34,35]. Nevertheless, to date, these populations remain unstudied in terms of genetic structure, connectivity with other regions, and ecotype assessment.
In this context, the aims of this study were to determine the population structure within the Canary Islands and to assess the ecotype of bottlenose dolphins using molecular markers. Moreover, data relating to North-East Atlantic Ocean (NEAO) bottlenose dolphins were added to our analysis to study the phylogeographic relationships and possible connectivity with the other populations from the North-East Atlantic basin. Since no levels of genetic structure were found in other archipelagos (within and between Azores and Madeira) of the Macaronesian region [18], the high dispersal of Canarian bottlenose dolphins [34,35], and the broad connectivity of the pelagic ecotype in the North-East Atlantic [18,20], we hypothesized that none or negligible levels of genetic structure should be observed within the Canary Islands, clustering with the pelagic ecotype of the North-East Atlantic.

2. Materials and Methods

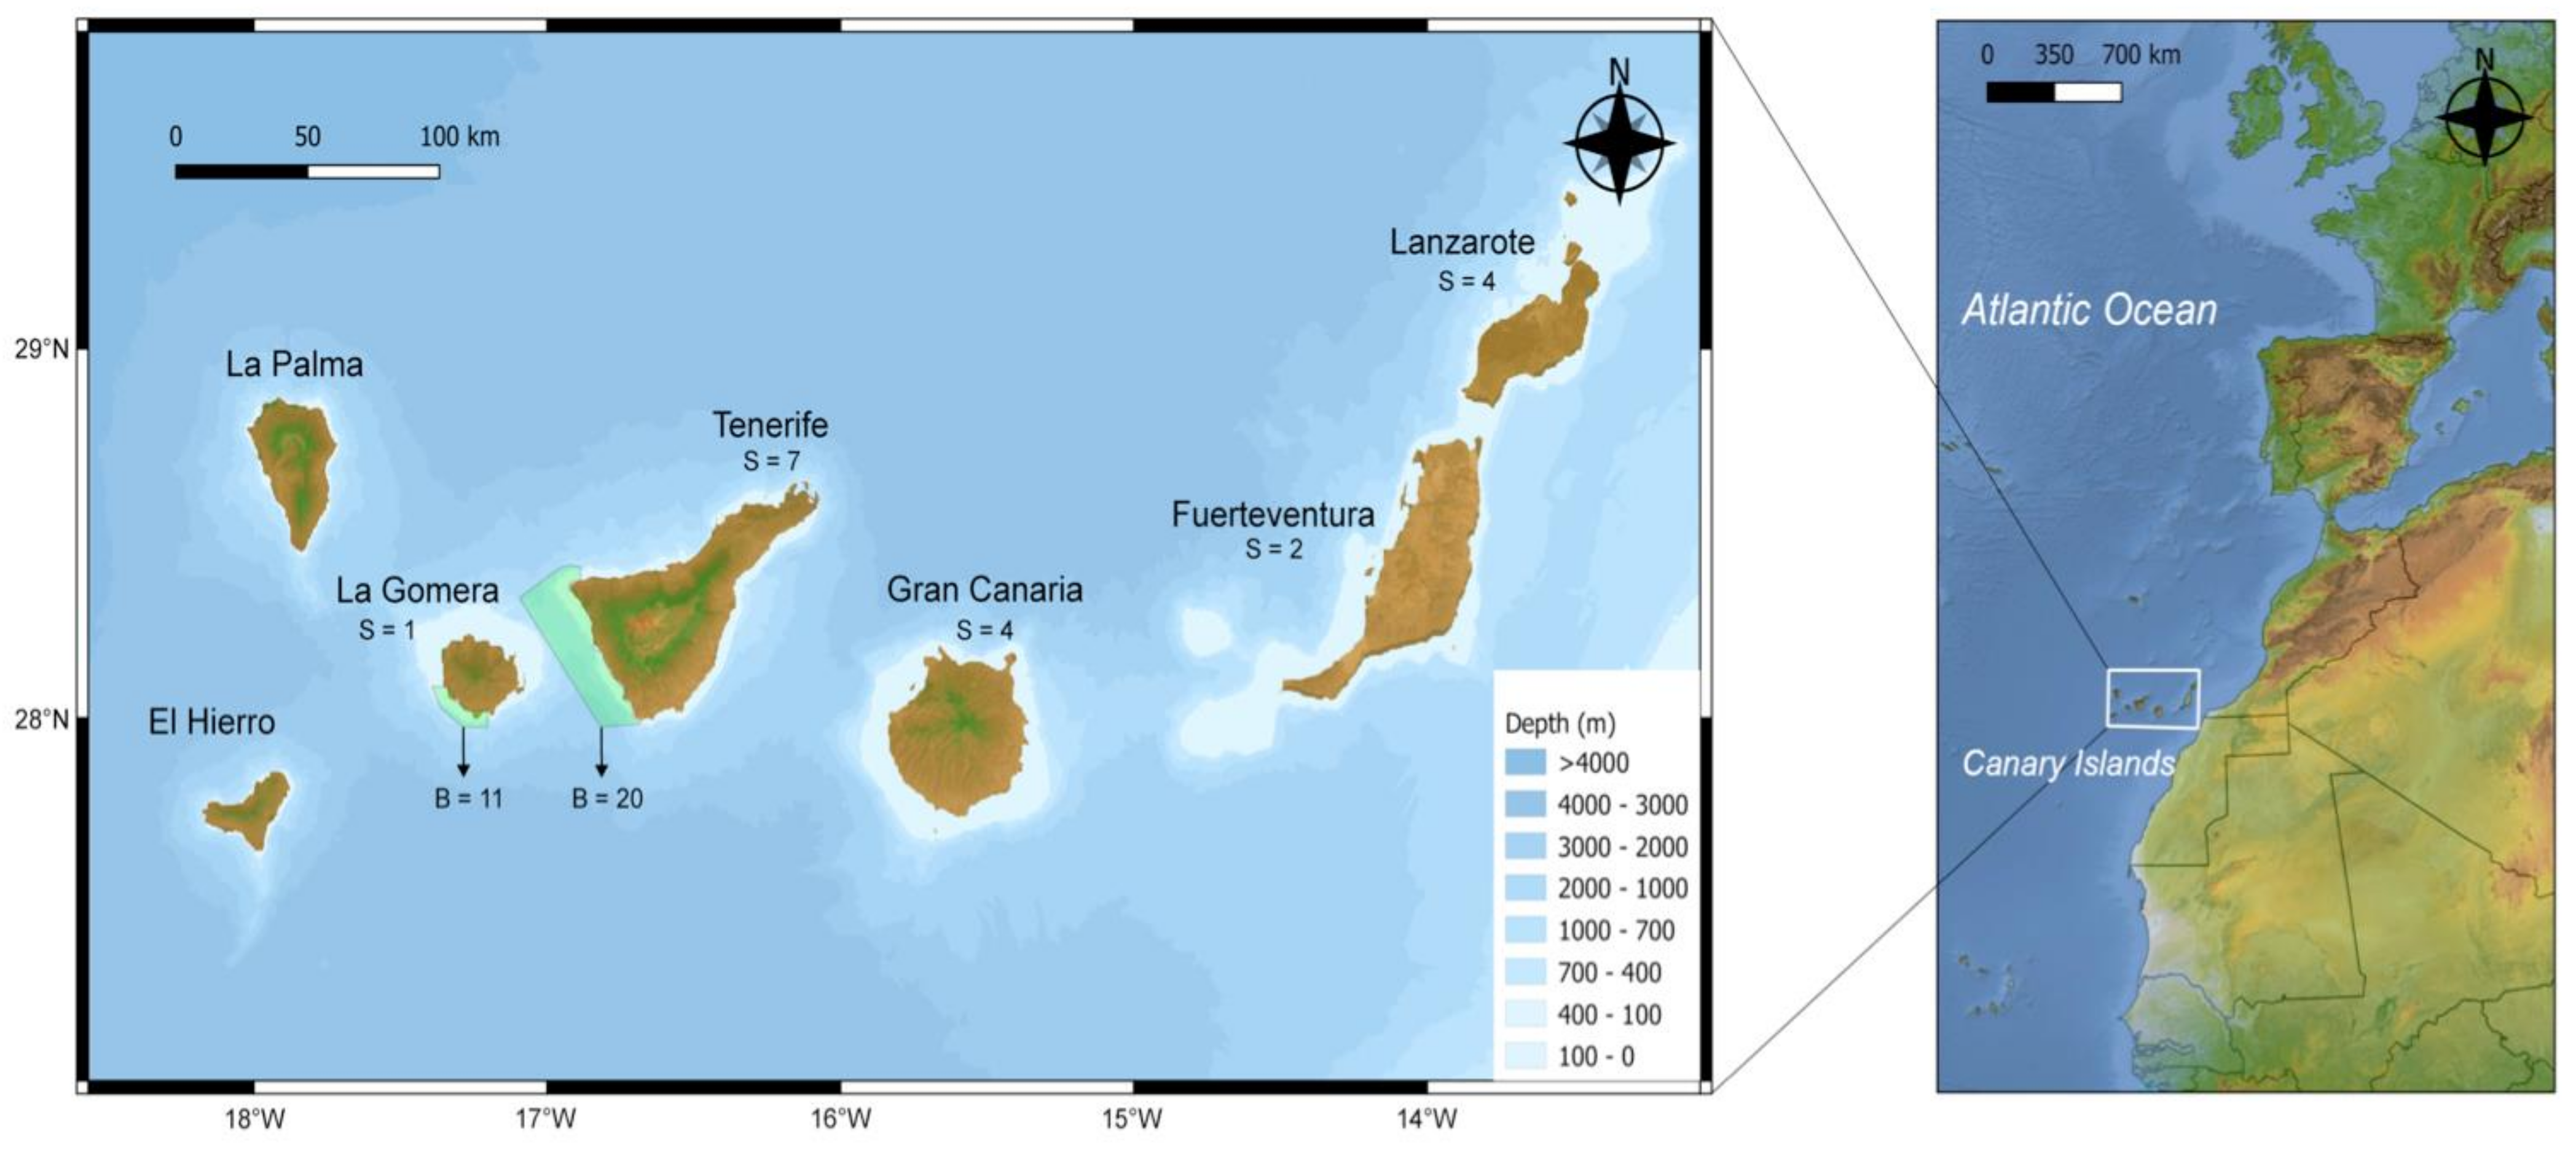
2.1. Sample Collection

A total of 49 bottlenose dolphin samples were collected from the Canary Islands from 2005 to 2022 (Table S1). Thirty-one biopsy samples were obtained from wild specimens in two different SACs (see studied area in Figure 1), the marine strips of Santiago-Valle Gran Rey in La Gomera island (ZEC-ES7020123) and Teno-Rasca in Tenerife Island (ZEC-ES7020017). The tissue size was 8 mm in diameter and length, and only adults were sampled. Photo identification was carried out simultaneously to spot individuals with site fidelity. Eighteen samples were obtained from stranded animals from five different locations (La Gomera, Tenerife, Gran Canaria, Fuerteventura, and Lanzarote). All stranding events were of single individuals (see Table S1), and the individuals were in the fresh decomposition stage (recently dead individuals), ensuring that death occurred near the coast. Tissue samples were either immediately preserved in ethanol or first frozen at −20 °C and later placed in ethanol for long-term storage.

2.2. Genetic Analysis: Population Structure and Diversity in the Canary Islands

DNA was extracted from the skin samples using DNeasy Blood and Tissue Kit (QIAGEN, Venlo, The Netherlands), following the manufacturer’s instructions with modifications for small size samples (biopsies), such as longer lysis incubation (24 h), longer pre-elution incubation (5–10 min) and smaller elution volume (75 μL). All individuals were genetically sexed with the multiplexed SRY gene and ZFY/ZFX gene PCR [36]. A fragment of the mtDNA D-loop region was amplified using the primers described in the work of Dalebout et al. [37] following the protocol of Miralles et al. [38]. PCR sequencing in forward and reverse directions was carried out at Macrogen Inc. (Madrid, Spain) with a 3730XL DNA Analyzer (Applied Biosystems, Waltham, MA, USA). All of the obtained sequences were visualized, assembled, and checked for ambiguities in BioEdit, Version 7.0.5.3 [39]. The sequences were aligned and manually edited in BioEdit, producing a dataset of 49 sequences. Prior to molecular analyses, all of the sequences were corroborated using the Nucleotide BLAST tool (Basic Local Alignment Search tool, NCBI).
Genetic diversity and structure (Fst, Φst) indexes were assessed using ARLEQUIN, Version 3.5.1.2 [40]. Fst may be an indicator of short-term or recent population processes, while Φst may be an indicator of longer-term or older processes. Therefore, it is useful to calculate both types of indexes for any data set. Combining these statistics will enable more robust analyses of population structure than what is possible with only Fst. Moreover, if they are different, it is possible that sample size and mutations have a larger influence on the results obtained. ARLEQUIN was also used to estimate the number of segregating sites (S), haplotypes (Nh), unique haplotypes (h), haplotype diversity (Hd), nucleotide diversity (π), and the average number of nucleotide differences between pairs of sequences (k). To determine if there were any deviations from the Wright–Fisher mutation-drift equilibrium due to population bottlenecks or expansions, Fu’s Fs and Tajima’s D indices were calculated in ARLEQUIN with their respective p values.
Phylogenetic relationships among the different haplotypes were inferred from a median-joining network constructed with PopArt, Version 1.7 [41,42], with the homoplasy parameter (ε) set to zero. To further visualize the possible genetic structure within the Canary Islands, non-metric Multidimensional Scaling (nMDS) analysis was conducted in PAST, Version 4.03 [43], using the mutation distribution of haplotypes and applying Tamura [44] for genetic distances and considering tolerable stress values <0.2 [45].

2.3. Genetic Analysis: Population Structure and Diversity in the NEAO

To study the phylogeographic relationships of the Canary Islands within the NEAO, the complete dataset of Louise et al. [20], except for the individuals of unknown origin, was downloaded from GenBank (n = 343). This dataset comprised four main groups containing several regions from the NEAO and Mediterranean Sea: the coastal south group (English Channel, Arcachon estuary, and South Galicia bottlenose dolphins), coastal north group (UK and Ireland resident or mobile coastal groups), pelagic Atlantic group (Azores archipelago and Bay of Biscay), and finally, the pelagic Mediterranean group (Gulf of Cadiz and Corsica) (see Louise et al. [20] for detailed description). The sequences were aligned using the Clustal W tool within MEGA-X, Version 10.0.5 [46], and trimmed to 636 pb to match our dataset. Since no polymorphism was present within the trimmed regions, no haplotype or information was lost, producing a final dataset of 392 sequences and defining 70 haplotypes, including the Canary Islands from this study. Genetic diversity and structure (Fst, Φst) indexes were calculated in ARLEQUIN in addition to an analysis of molecular variance (AMOVA) with 10,000 permutations. For Φst, the best-fit model of molecular evolution was determined using MEGA-X, which resulted in T92 +G + I [44], based on the Bayesian Information Criterion (BIC; [47]), with a gamma value of 0.46. Finally, a haplotype network was constructed using the median-joining algorithm in PopArt with ε set to zero.

3. Results

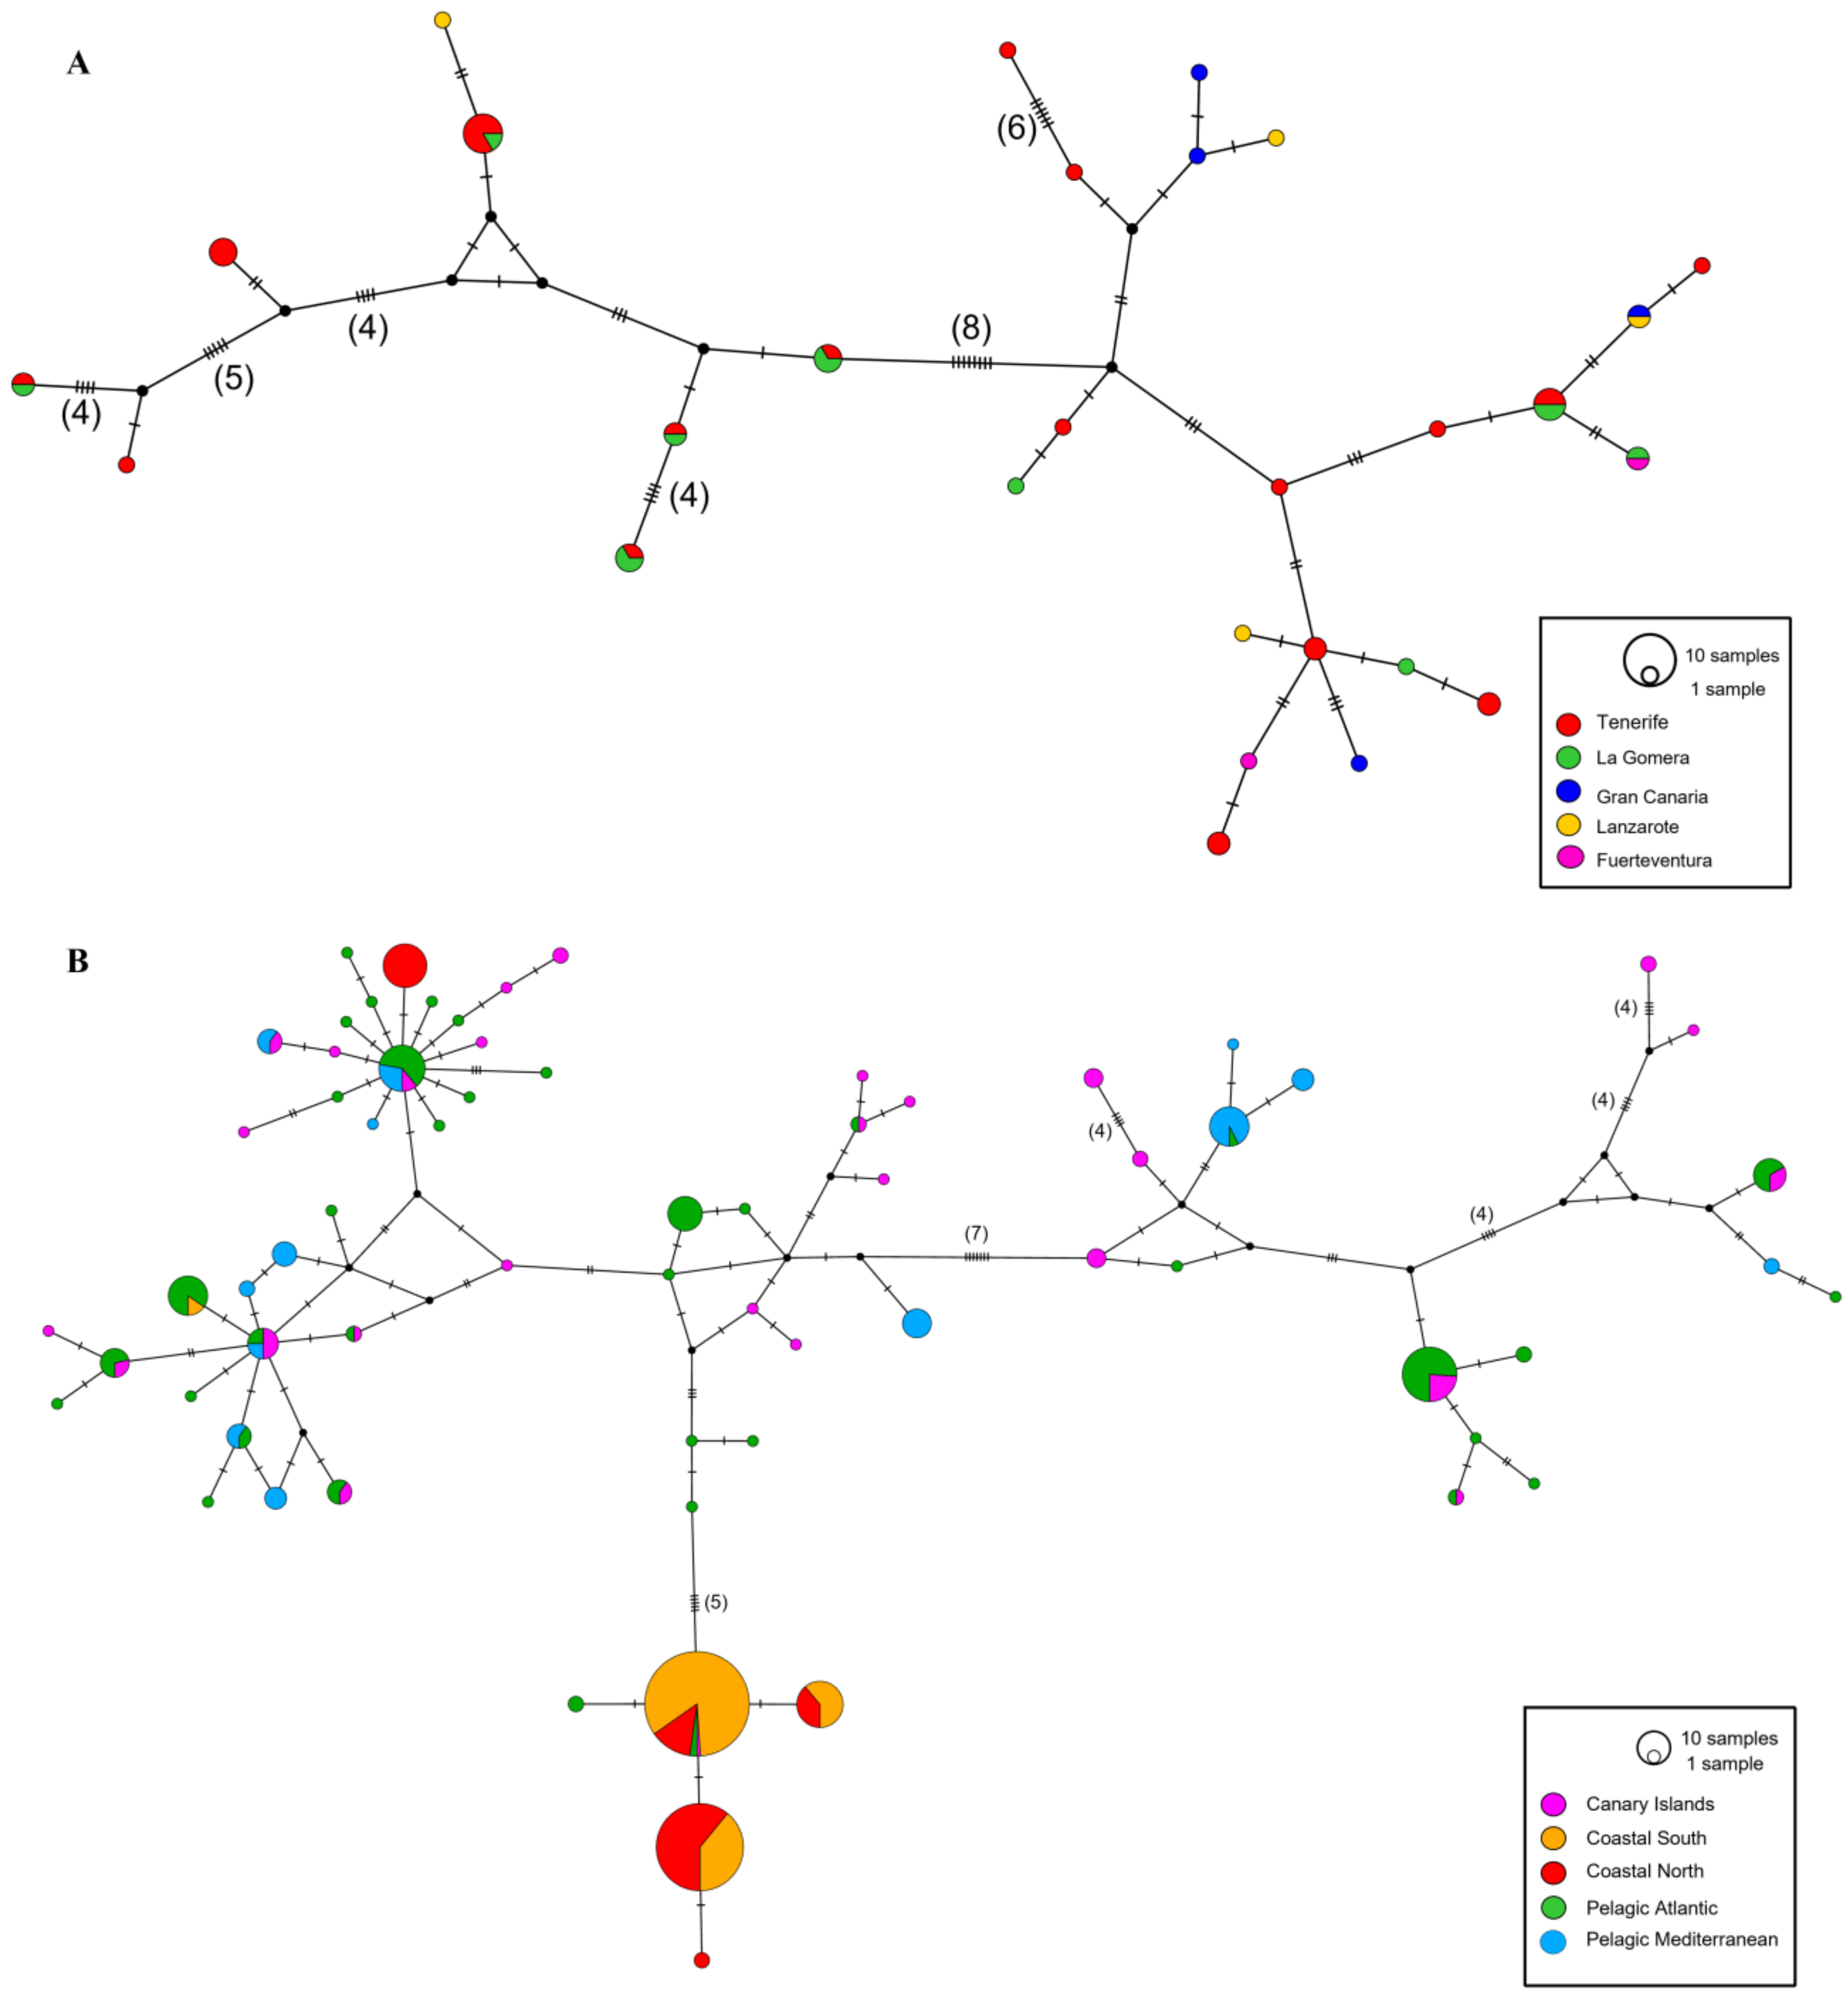
3.1. Population Structure and Genetic Diversity in the Canary Islands

In total, 49 mtDNA sequences of 636 bp were obtained, defining 28 haplotypes across the Canary Islands; 29 individuals corresponded to previously reported haplotypes, and 20 individuals presented 15 new unreported haplotypes (CAN1-CAN15, Table S1). New haplotypes were uploaded to GenBank under the accession numbers OQ656769-OQ656783.
Overall, mitochondrial haplotype and nucleotide diversities were high: Hd = 0.969 and π = 0.0165 (Table 1). Tenerife presented the highest number of haplotypes (Nh), unique haplotypes (h), and segregating sites (S), but it was also the location with the highest sample size (n = 27). Similar values of genetic variability in both largest samples in terms of π, Hd, and K were obtained despite the smaller sample size of La Gomera in comparison with Tenerife (Hd = 0.955 and 0.952, respectively) (Table 1). However, no significant population structure was found between these two localities (Fst = 0.0008, Φst = 0.014; p > 0.2). In addition, no differences were found between biopsies and stranding samples (Fst = 0.005, Φst = 0.049 p > 0.05), and all diversity indexes presented high similarity (Table S2, Supplementary Materials), discarding possible confounding effects between the two types of samples. Both Fu’s Fs (Fs = −5.88, p = 0.052) and Tajima’s D (D = 0.41, p = 0.725) were not significant.
The median-joining network (Figure 2A) shows a highly diverse and reticulated pattern, with most individuals forming single haplotypes with multiple mutational steps. The two more distant haplotypes were separated by 47 bp. Only eight haplotypes were shared between individuals from different locations, where six were shared between Tenerife and La Gomera, one between Fuerteventura and La Gomera, and one between Gran Canaria and Lanzarote.
Non-metric Multidimensional Scaling analysis shows the lack of genetic structure within the Canary Islands since no clear clustering is observed, and all samples are scattered across the plot. The low stress value (0.09) indicates the validity of the analysis (Figure 3).

3.2. Population Structure and Genetic Diversity in the Canary Islands

A dataset of 392 mtDNA sequences was obtained by combining this study (n = 49) and the work of Louis et al. [20] (n = 343), defining 70 haplotypes. With the inclusion of the highly diverse Canary population, the overall haplotypic diversity was augmented (Hd = 0.905) in relation to the values previously reported by Louis et al. [20] (Hd = 0.883). Out of the 70 haplotypes, 17 were private for the Canary Islands, being the second population with the most unique haplotypes after the Pelagic Atlantic samples (h = 25, Table 2). Despite having the smallest sample size, the Canary Islands presented the highest haplotypic diversity (Hd = 0.969) (Table 1 and Table 2). Initially, an analysis of molecular variance (AMOVA) was tested with the Canary Islands as an independent group against pelagic and coastal populations, resulted in being not significant in the global structure (Φct = 0.377, p = 0.139; Fct = 0.075, p = 0.268), which is likely due to the large variability within the populations (Φst = 0.434, p < 0.0001; Fst = 0.219, p < 0.0001). A second test was performed, grouping the Canary Islands within the pelagic group, which also resulted in no significance (Φct = 0.436, p = 0.103; Fct = 0.136, p = 0.103). The pairwise comparisons of Fst and Φst obtained by Louis et al. [20] were replicated with the addition of the Canary Islands population, where the last was mainly differentiated from the coastal populations (Table 3). All of the comparisons among the Canary Islands and coastal populations were significant, with high Fst and Φst values (p < 0.001), while no structure was found when compared with the pelagic Atlantic populations (Fst and Φst values). However, one significant but low level of genetic structure (Fst = 0.057, p < 0.001) was found between the Canary Islands and the pelagic Mediterranean (but not the Φst value). It is the only comparison when Fst is significant but Φst is not.
A global haplotype network including all sequences from Louis et al. [20] was performed with the addition of the Canary Islands sequences (Figure 2B). All of the individuals clustered among the pelagic haplotypes in the upper part of the network, except for one stranded individual (CET0564), which showed the haplotype Ttrunc2, typical of the coastal bottlenose dolphins. It is worth mentioning that, in the upper-left side of the network, a coastal north haplotype (in red) from the UK and Ireland clustered with several pelagic haplotypes from the Atlantic (Azores and Bay of Biscay) and Mediterranean (Gulf of Cadiz and Corsica) as well as five Canarian haplotypes in a branch with a star-like pattern. In general, branches of the network were well defined in terms of several mutations between the closest haplotypes (e.g., four, five or seven positions).

4. Discussion

The genetic identification of natural populations is of crucial importance for the correct management and risk assessment of a species since small isolated populations are at increased risk of the effects of genetic drift and inbreeding [30], which can increase extinction probability. This is especially true in the case of bottlenose dolphins because coastal populations have been described to have low levels of genetic diversity, and even the extinction of an isolated population has been reported (e.g., Humber Estuary, UK) [28]. The results of this study would help to define key areas within the Macaronesian region for the management and long-term conservation of this relevant marine species protected in Europe under the EU Habitats Directive (92/43/CEE).
This study is the first to report the genetic structure of the population within the Canary Islands and to assess the ecotypes using molecular markers (i.e., mtDNA) and biopsies of free-ranging individuals. The overall mitochondrial haplotypic diversity found in this study (Hd = 0.969) is the highest reported in any previously studied bottlenose dolphin population in the North Atlantic [17,18,20,27]. Bottlenose dolphins from the Canary Islands were found to be remarkably diverse, with high genetic diversity indexes (Table 1). From a total of 49 samples, we found 28 haplotypes, meaning that more than half of the individuals sampled presented a different mtDNA sequence with multiple mutations between them (overall k > 10). Both Fu’s Fs and Tajima’s D were not significant, suggesting a relatively stable population size under mutation–drift equilibrium. No sign of genetic structuring among the islands was found in this work (Figure 2A). The haplotype network shows both patterns of high genetic diversity and the lack of a fine-scale structure, showing three major characteristics: (1) the presence of many haplotypes composed of single individuals, (2) multiple mutational steps among haplotypes, and (3) samples from different localities scattered across the network (Figure 2A). Additionally, non-metric Multidimensional Scaling analysis reinforced the evidence of a lack of genetic structure within the Canary Islands since no clear clustering is observed and all samples are scattered across the plot (stress value = 0.09; Figure 3). Although the lack of structure was expected, the small sample size of Lanzarote, Gran Canaria, and Fuerteventura, coupled with the absence of nuclear markers (microsatellites), might hinder the signals of a fine-scale genetic structure.
Previously, only Fernández et al. [27] reported genetic data of six stranded bottlenose dolphins from the Canary Islands. These authors found high nuclear and mitochondrial diversity. In our study, samples from the Canary Islands were grouped with the Azores, Basque Country, and Mainland Portugal, forming an offshore population in contrast with the genetically isolated population of Southern Galicia and the Sado estuary [27]. As reported in the Azores and Madeira archipelagos [18], along with photo identification data [34,35], our results support the hypothesis of the absence of a fine-scale genetic structure within the Canary Islands, with this population possibly grouping within the diverse large oceanic ecotypes.
The global haplotype network indicated that individuals from the Canary Islands are closely related to both pelagic Atlantic and pelagic Mediterranean populations by clustering within the upper pelagic mitochondrial lineage (Figure 2B). All of the individuals clustered among the pelagic haplotypes in the upper part of the network, except for one stranded individual (CET0564), showing haplotype Ttrunc2, which is typical of coastal populations. The Canary samples were scattered across the network, sharing ten and three haplotypes with pelagic Atlantic and pelagic Mediterranean populations, respectively, which could indicate current or historical gene flow, incomplete lineage sorting, or introgression [20]. In addition, despite having less than half of the sample size of the pelagic Atlantic population, the population of the Canary Islands possessed a remarkably high number of seventeen private haplotypes (i.e., haplotypes only found in that locality) in comparison to twenty-five (Table 2). The lack of genetic structure with pelagic populations, the deep bathymetry of the islands, and the high levels of haplotypic diversity support the hypothesis that bottlenose dolphins from the Canary Islands are part of a large oceanic population in the North-East Atlantic [18,20]. This connectivity among populations could be maintained by the high dispersal capacity of the species [35,48,49] and adaptations to deep oceanic environments [21]. However, one low but significant value in terms of genetic structure (Fst = 0.057, p < 0.001) was found between the Canary Islands and pelagic Mediterranean (but not the Φst value) (Table 3). It is known that the Fst method is largely influenced by the presence of rare variants [50], while Φst statistics are not. Φst is derived from two different statistical distributions: the distribution of allele (haplotypes) frequencies among populations and the distribution of evolutionary distances among alleles [51]. When the significance of both markers differed, it is possible that samples size and/or mutation had a larger influence on the results obtained. After a population splits and until subpopulations have reached a stable equilibrium, Fst is likely to increase first, indicating recent events. Only after new alleles have arisen and monophyletic clades of alleles have begun to arise in different subpopulations will Φst begin to increase substantially [51]. This way, it takes advantage of this additional information and provides greater insight into the patterns of relationships among the populations.
The results obtained in this work are in concordance with those obtained by Hildebrandt (unpub. data; [52]), in which Canarian bottlenose dolphins showed high diversity indexes, a lack of structure, and similarities with bottlenose dolphins from the North Atlantic Ocean. The Canary Islands are considered a hotspot of cetacean biodiversity [33], one of the most diverse places for cetaceans and the largest in Europe [53]. However, just three species dominated the sightings: bottlenose dolphins, pilot whales (Globicephala macrorhynchus) and spotted dolphins (Stenella frontalis) [53]. Comparing the results obtained here with these other two delphinid species, we observed the same lack of genetic structuring across the Canary Islands in spotted dolphins [54] but not in pilot whales [52]. On a broader scale, it has been described that spotted dolphins represent several distinct units in the Atlantic Ocean: Macaronesian group clustering, Canary Islands, Azores and Madeiran individuals [54].
Bottlenose dolphins are a highly endangered species due to coastal activities and fisheries. They are protected in Europe under the EU Habitats Directive (92/43/CEE), the Berne Convention and the ACCOBAMS, which requests the designation of SACs for their protection. Our results highlight the importance of the SACs in terms of managing and preserving bottlenose dolphins inhabiting the Canary Islands since this region seems to represent a hotspot of genetic diversity for a large pelagic population. The protection of these strategic areas could have positive impacts even in the outer parts of the marine reserve [23,55] thanks to the high connectivity of such pelagic ecotypes in the North-East Atlantic Ocean. This study provides baseline data for further investigations of the fine-scale genetic structure within the Canarian and Macaronesian region. Future studies that include nuclear markers (microsatellites) or genomics would provide higher-resolution information [56] on the connectivity among islands and detailed information for the future management of this protected species.

5. Conclusions

The analysis of 49 new samples, along with 343 individuals from databases, revealed a remarkable level of genetic diversity among Canarian bottlenose dolphins, as indicated by the highest reported mitochondrial haplotypic diversity in any North-East Atlantic bottlenose dolphin population. In line with our hypothesis, we found negligible levels of genetic structure within the Canary Islands, suggesting a cohesive population across the archipelago. The results align with the absence of fine-scale genetic structure reported in other oceanic archipelagos and support the hypothesis that Canarian bottlenose dolphins are part of a larger oceanic population in the North-East Atlantic.
Results from this research highlight the importance of Special Areas of Conservation (SACs) in the Canary Islands. The designation of SACs is crucial for preserving the genetic diversity of bottlenose dolphins, particularly considering their classification as a strategic area for the conservation of the oceanic ecotype. Additionally, we highlight the importance of incorporating nuclear markers (microsatellites) or SNPs to enhance the resolution of connectivity and provide detailed information for the ongoing conservation and management of this protected species.

Supplementary Materials

The following supporting information can be downloaded at: https://www.mdpi.com/article/10.3390/ani14060901/s1, Table S1: Detailed sampling data of bottlenose dolphins from the Canary Islands; Table S2: Comparison of genetic diversity indexes of Biopsies and Stranding samples.

Author Contributions

Conceptualization L.M., A.F., M.A. and J.d.l.F.; methodology D.A.G.-L., Y.J.B. and L.M.; software, D.A.G.-L.; formal analysis, D.A.G.-L. and L.M.; investigation, D.A.G.-L. and L.M.; sampling M.P.-G., N.V.-C., A.S., E.P.-G.; resources, A.P.M.; data curation, D.A.G.-L., Y.J.B. and L.M.; writing—original draft preparation, D.A.G.-L.; writing—review and editing, D.A.G.-L., Y.J.B. and L.M.; visualization, All authors; supervision, LM.; project administration, J.d.l.F.; funding acquisition, A.F. All authors have read and agreed to the published version of the manuscript.

Funding

This study is a result of the MARCET II Project (MAC2/4.6c/392), co-financed by the Interreg Madeira-Azores-Canarias (MAC) Territorial Cooperation Program 2014–2020, and coordinated by the University of Las Palmas de Gran Canaria. Dr. Miralles held a Torres Quevedo grant from the Ministry of Innovation and Science of Spain (2018–2022) referenced PTQ2018-010019.

Institutional Review Board Statement

This work got a positive evaluation from the Ethics Committee "Comité Ético de Experimentación Animal de la Universidad de Las Palmas de Gran Canaria (CEEA-ULPGC)" under the reference expedient: OEBA-ULPGC 34/2020R1. This work also got the governmental authorization from the "Ministerio para la Transición Ecológica y el Reto Demográfico" referenced: SGPM/BDM/AUTSPP/15/2020 and DGBBD/BDM/AUTSPP/19/2021.

Informed Consent Statement

Not applicable.

Data Availability Statement

Data are contained within the article and Supplementary Materials. New haplotypes were accessible in GenBank under the accession numbers OQ656769-OQ656783.

Acknowledgments

We thank Olga Filatova for her disposition and teaching of QGIS used for map building. Additionally, thanks to Tomás Fortuño for his advice with QGIS functions.

Conflicts of Interest

The authors declare no conflicts of interest.

References

  1. Wells, R.S.; Scott, M.D. Common Bottlenose Dolphin: Tursiops truncatus. In Encyclopedia of Marine Mammals, 2nd ed.; Perrin, W.F., Würsig, B., Thewissen, J.G.M., Eds.; Academic Press: London, UK, 2009; pp. 249–255. ISBN 978-0-12-373553-9. [Google Scholar]
  2. Wells, R.S.; Rhinehart, H.L.; Hansen, L.J.; Sweeney, J.C.; Townsend, F.I.; Stone, R.; Casper, D.R.; Scott, M.D.; Hohn, A.A.; Rowles, T.K. Bottlenose Dolphins as Marine Ecosystem Sentinels: Developing a Health Monitoring System. EcoHealth 2004, 1, 246–254. [Google Scholar] [CrossRef]
  3. Torres, L.G.; Read, A.J.; Halpin, P. Fine-Scale Habitat Modeling of a Top Marine Predator: Do Prey Data Improve Predictive Capacity. Ecol. Appl. 2008, 18, 1702–1717. [Google Scholar] [CrossRef]
  4. Ballance, L.T. Habitat Use Patterns and Ranges of the Bottlenose Dolphin in the Gulf of California, Mexico. Mar. Mammal Sci. 1992, 8, 262–274. [Google Scholar] [CrossRef]
  5. Dos Santos, M.E.; Louro, S.; Couchinho, M.; Brito, C. Whistles of Bottlenose Dolphins (Tursiops truncatus) in the Sado Estuary, Portugal: Characteristics, Production Rates, and Long-Term Contour Stability. Aquat. Mamm. 2005, 31, 453–462. [Google Scholar] [CrossRef]
  6. Wells, R.; Natoli, A.; Braulik, G. Tursiops truncatus (Errata Version Published in 2019). In The IUCN Red List of Threatened Species; IUCN: Cambridge, UK, 2019. [Google Scholar] [CrossRef]
  7. Natoli, A.; Genov, T.; Kerem, D.; Gonzalvo, J.; Lauriano, G.; Holcer, D.; Labach, H.; Marsili, L.; Mazzariol, S.; Moura, A.E.; et al. Tursiops truncatus (Mediterranean Subpopulation) (Errata Version Published in 2022). In The IUCN Red List of Threatened Species; IUCN: Cambridge, UK, 2021. [Google Scholar]
  8. Currey, R.J.C.; Dawson, S.M.; Slooten, E. An Approach for Regional Threat Assessment under IUCN Red List Criteria That Is Robust to Uncertainty: The Fiordland Bottlenose Dolphins Are Critically Endangered. Biol. Conserv. 2009, 142, 1570–1579. [Google Scholar] [CrossRef]
  9. Certain, G.; Ridoux, V.; van Canneyt, O.; Bretagnolle, V. Delphinid Spatial Distribution and Abundance Estimates over the Shelf of the Bay of Biscay. ICES J. Mar. Sci. 2008, 65, 656–666. [Google Scholar] [CrossRef]
  10. Hammond, P.S.; Macleod, K.; Berggren, P.; Borchers, D.L.; Burt, L.; Cañadas, A.; Desportes, G.; Donovan, G.P.; Gilles, A.; Gillespie, D.; et al. Cetacean Abundance and Distribution in European Atlantic Shelf Waters to Inform Conservation and Management. Biol. Conserv. 2013, 164, 107–122. [Google Scholar] [CrossRef]
  11. Walker, W.A. Geographical Variation in Morphology and Biology of Bottlenose Dolphins (Tursiops) in the Eastern North Pacific; NOAA Administrative Report LJ-81-0003c.; National Marine Fisheries Service, Southwest Fisheries Center: La Jolla, CA, USA, 1981. [Google Scholar]
  12. Mead, J.G.; Potter, C.W. Recognizing Two Populations off the Bottlenose Dolphin (Tursiops truncatus) of the Atlantic Coast of North America—Morphologic and Ecologic Considerations. In International Marine Biology Research Institute: IBI Reports; International Marine Biology Research Institute: Kamogawa, Japan, 1995; pp. 31–44. [Google Scholar]
  13. Bearzi, M.; Saylan, C.A.; Hwang, A. Ecology and Comparison of Coastal and Offshore Bottlenose Dolphins (Tursiops truncatus) in California. Mar. Freshw. Res. 2009, 60, 584–593. [Google Scholar] [CrossRef]
  14. Perrin, W.F.; Thieleking, J.L.; Walker, W.A.; Archer, F.I.; Robertson, K.M. Common Bottlenose Dolphins (Tursiops truncatus) in California Waters: Cranial Differentiation of Coastal and Offshore Ecotypes. Mar. Mammal Sci. 2011, 27, 769–792. [Google Scholar] [CrossRef]
  15. Oudejans, M.G.; Visser, F.; Englund, A.; Rogan, E.; Ingram, S.N. Evidence for Distinct Coastal and Offshore Communities of Bottlenose Dolphins in the North East Atlantic. PLoS ONE 2015, 10, e0122668. [Google Scholar] [CrossRef]
  16. Hoelzel, A.R.; Potter, C.W.; Best, P.B. Genetic Differentiation between Parapatric ‘Nearshore’ and ‘Offshore’ Populations of the Bottlenose Dolphin. Proc. R. Soc. Lond. B Biol. Sci. 1998, 265, 1177–1183. [Google Scholar] [CrossRef]
  17. Natoli, A.; Birkun, A.; Aguilar, A.; Lopez, A.; Hoelzel, A.R. Habitat Structure and the Dispersal of Male and Female Bottlenose Dolphins (Tursiops truncatus). Proc. R. Soc. B Biol. Sci. 2005, 272, 1217–1226. [Google Scholar] [CrossRef]
  18. Quérouil, S.; Silva, M.A.; Freitas, L.; Prieto, R.; Magalhães, S.; Dinis, A.; Alves, F.; Matos, J.A.; Mendonça, D.; Hammond, P.S.; et al. High Gene Flow in Oceanic Bottlenose Dolphins (Tursiops truncatus) of the North Atlantic. Conserv. Genet. 2007, 8, 1405–1419. [Google Scholar] [CrossRef]
  19. Fruet, P.F.; Secchi, E.R.; Daura-Jorge, F.; Vermeulen, E.; Flores, P.A.C.; Simões-Lopes, P.C.; Genoves, R.C.; Laporta, P.; Di Tullio, J.C.; Freitas, T.R.O.; et al. Remarkably Low Genetic Diversity and Strong Population Structure in Common Bottlenose Dolphins (Tursiops truncatus) from Coastal Waters of the Southwestern Atlantic Ocean. Conserv. Genet. 2014, 15, 879–895. [Google Scholar] [CrossRef]
  20. Louis, M.; Viricel, A.; Lucas, T.; Peltier, H.; Alfonsi, E.; Berrow, S.; Brownlow, A.; Covelo, P.; Dabin, W.; Deaville, R.; et al. Habitat-Driven Population Structure of Bottlenose Dolphins, Tursiops truncatus, in the North-East Atlantic. Mol. Ecol. 2014, 23, 857–874. [Google Scholar] [CrossRef]
  21. Louis, M.; Fontaine, M.C.; Spitz, J.; Schlund, E.; Dabin, W.; Deaville, R.; Caurant, F.; Cherel, Y.; Guinet, C.; Simon-Bouhet, B. Ecological Opportunities and Specializations Shaped Genetic Divergence in a Highly Mobile Marine Top Predator. Proc. R. Soc. B Biol. Sci. 2014, 281, 20141558. [Google Scholar] [CrossRef] [PubMed]
  22. Gaspari, S.; Scheinin, A.; Holcer, D.; Fortuna, C.; Natali, C.; Genov, T.; Frantzis, A.; Chelazzi, G.; Moura, A.E. Drivers of Population Structure of the Bottlenose Dolphin (Tursiops truncatus) in the Eastern Mediterranean Sea. Evol. Biol. 2015, 42, 177–190. [Google Scholar] [CrossRef]
  23. Nykänen, M.; Louis, M.; Dillane, E.; Alfonsi, E.; Berrow, S.; O’Brien, J.; Brownlow, A.; Covelo, P.; Dabin, W.; Deaville, R.; et al. Fine-Scale Population Structure and Connectivity of Bottlenose Dolphins, Tursiops truncatus, in European Waters and Implications for Conservation. Aquat. Conserv. Mar. Freshw. Ecosyst. 2019, 29, 197–211. [Google Scholar] [CrossRef]
  24. Wiszniewski, J.; Allen, S.J.; Möller, L.M. Social Cohesion in a Hierarchically Structured Embayment Population of Indo-Pacific Bottlenose Dolphins. Anim. Behav. 2009, 77, 1449–1457. [Google Scholar] [CrossRef]
  25. Mirimin, L.; Miller, R.; Dillane, E.; Berrow, S.D.; Ingram, S.; Cross, T.F.; Rogan, E. Fine-Scale Population Genetic Structuring of Bottlenose Dolphins in Irish Coastal Waters. Anim. Conserv. 2011, 14, 342–353. [Google Scholar] [CrossRef]
  26. Allen, S.J.; Bryant, K.A.; Kraus, R.H.S.; Loneragan, N.R.; Kopps, A.M.; Brown, A.M.; Gerber, L.; Krützen, M. Genetic Isolation between Coastal and Fishery-impacted, Offshore Bottlenose Dolphin (Tursiops spp.) Populations. Mol. Ecol. 2016, 25, 2735–2753. [Google Scholar] [CrossRef] [PubMed]
  27. Fernández, R.; Santos, M.B.; Pierce, G.J.; Llavona, Á.; López, A.; Silva, M.A.; Ferreira, M.; Carrillo, M.; Cermeño, P.; Lens, S.; et al. Fine-Scale Genetic Structure of Bottlenose Dolphins, Tursiops truncatus, in Atlantic Coastal Waters of the Iberian Peninsula. Hydrobiologia 2011, 670, 111–125. [Google Scholar] [CrossRef]
  28. Nichols, C.; Herman, J.; Gaggiotti, O.E.; Dobney, K.M.; Parsons, K.; Hoelzel, A.R. Genetic Isolation of a Now Extinct Population of Bottlenose Dolphins (Tursiops truncatus). Proc. R. Soc. B Biol. Sci. 2007, 274, 1611–1616. [Google Scholar] [CrossRef]
  29. Crespo, E.A.; Notarbartolo di Sciara, G.; Reeves, R.R.; Smith, B.D. Dolphins, Whales and Porpoises: 2002–2010 Conservation Action Plan for the World’s Cetaceans; IUCN: Gland, UK, 2003; ISBN 978-2-8317-0656-6. [Google Scholar]
  30. Frankham, R.; Ballou, J.D.; Briscoe, D.A. Introduction to Conservation Genetics. Available online: https://www.cambridge.org/highereducation/books/introduction-to-conservation-genetics/696B4E558C93F7FBF9C33D6358EA7425 (accessed on 19 December 2023).
  31. Hare, M.P.; Nunney, L.; Schwartz, M.K.; Ruzzante, D.E.; Burford, M.; Waples, R.S.; Ruegg, K.; Palstra, F. Understanding and Estimating Effective Population Size for Practical Application in Marine Species Management. Conserv. Biol. 2011, 25, 438–449. [Google Scholar] [CrossRef]
  32. Troll, V.R.; Carracedo, J.C. Chapter 1—The Canary Islands: An Introduction. In The Geology of the Canary Islands; Troll, V.R., Carracedo, J.C., Eds.; Elsevier: Amsterdam, The Netherlands, 2016; pp. 1–41. ISBN 978-0-12-809663-5. [Google Scholar]
  33. Correia, A.M.; Gil, Á.; Valente, R.F.; Rosso, M.; Sousa-Pinto, I.; Pierce, G.J. Distribution of Cetacean Species at a Large Scale—Connecting Continents with the Macaronesian Archipelagos in the Eastern North Atlantic. Divers. Distrib. 2020, 26, 1234–1247. [Google Scholar] [CrossRef]
  34. Tobeña, M.; Escánez, A.; Rodríguez, Y.; López, C.; Ritter, F.; Aguilar, N. Inter-Island Movements of Common Bottlenose Dolphins Tursiops truncatus among the Canary Islands: Online Catalogues and Implications for Conservation and Management. Afr. J. Mar. Sci. 2014, 36, 137–141. [Google Scholar] [CrossRef]
  35. Dinis, A.; Molina, C.; Tobeña, M.; Sambolino, A.; Hartman, K.; Fernandez, M.; Magalhães, S.; dos Santos, R.P.; Ritter, F.; Martín, V.; et al. Large-Scale Movements of Common Bottlenose Dolphins in the Atlantic: Dolphins with an International Courtyard. PeerJ 2021, 9, e11069. [Google Scholar] [CrossRef]
  36. Rosel, P.E. PCR-based sex determination in Odontocete cetaceans. Conserv. Gen. 2003, 4, 647–649. [Google Scholar] [CrossRef]
  37. Dalebout, M.L.; Robertson, K.M.; Frantzis, A.; Engelhaupt, D.; Mignucci-Giannoni, A.A.; Rosario-Delestre, R.J.; Baker, C.S. Worldwide Structure of mtDNA Diversity among Cuvier’s Beaked Whales (Ziphius cavirostris): Implications for Threatened Populations. Mol. Ecol. 2005, 14, 3353–3371. [Google Scholar] [CrossRef]
  38. Miralles, L.; Lens, S.; Rodríguez-Folgar, A.; Carrillo, M.; Martín, V.; Mikkelsen, B.; Garcia-Vazquez, E. Interspecific Introgression in Cetaceans: DNA Markers Reveal Post-F1 Status of a Pilot Whale. PLoS ONE 2013, 8, e69511. [Google Scholar] [CrossRef]
  39. Hall, T.A. BioEdit: A User-Friendly Biological Sequence Alignment Editor and Analysis Program for Windows 95/98/NT. In Nucleic Acids Symposium Series; Oxford University Press: Oxford, UK, 1999; Volume 41, pp. 95–98. [Google Scholar]
  40. Excoffier, L.; Laval, G.; Schneider, S. Arlequin (Version 3.0): An Integrated Software Package for Population Genetics Data Analysis. Evol. Bioinform. 2005, 1. [Google Scholar] [CrossRef]
  41. Bandelt, H.J.; Forster, P.; Röhl, A. Median-Joining Networks for Inferring Intraspecific Phylogenies. Mol. Biol. Evol. 1999, 16, 37–48. [Google Scholar] [CrossRef] [PubMed]
  42. Leigh, J.W.; Bryant, D. Popart: Full-Feature Software for Haplotype Network Construction. Methods Ecol. Evol. 2015, 6, 1110–1116. [Google Scholar] [CrossRef]
  43. Hammer, O.; Harper, D.; Ryan, P. PAST: Paleontological Statistics Software Package for Education and Data Analysis. Palaeontol. Electron. 2001, 4, 1–9. [Google Scholar]
  44. Tamura, K. Estimation of the Number of Nucleotide Substitutions When There Are Strong Transition-Transversion and G+C-Content Biases. Mol. Biol. Evol. 1992, 9, 678–687. [Google Scholar] [CrossRef] [PubMed]
  45. Oksanen, J.; Blanchet, F.G.; Kindt, R.; Legendre, P.; Minchin, P.; O’Hara, R.; Simpson, G.; Solymos, P.; Stevens, M.; Wagner, H. Vegan: Community Ecology Package. R Package Version. 2.0-10; CRAN: Vienna, Austria, 2013. [Google Scholar]
  46. Kumar, S.; Stecher, G.; Li, M.; Knyaz, C.; Tamura, K. MEGA X: Molecular Evolutionary Genetics Analysis across Computing Platforms. Mol. Biol. Evol. 2018, 35, 1547–1549. [Google Scholar] [CrossRef]
  47. Guindon, S.; Gascuel, O. A Simple, Fast, and Accurate Algorithm to Estimate Large Phylogenies by Maximum Likelihood. Syst. Biol. 2003, 52, 696–704. [Google Scholar] [CrossRef] [PubMed]
  48. Wells, R.S.; Rhinehart, H.L.; Cunningham, P.; Whaley, J.; Baran, M.; Koberna, C.; Costa, D.P. Long Distance Offshore Movements of Bottlenose Dolphins. Mar. Mammal Sci. 1999, 15, 1098–1114. [Google Scholar] [CrossRef]
  49. Genov, T.; Železnik, J.; Bruno, C.; Ascheri, D.; Fontanesi, E.; Blasi, M.F. The Longest Recorded Movement of an Inshore Common Bottlenose Dolphin (Tursiops truncatus). Mamm. Biol. 2022, 102, 1469–1481. [Google Scholar] [CrossRef]
  50. Bhatia, G.; Patterson, N.; Sankararaman, S.; Price, A.L. Estimating and Interpreting FST: The Impact of Rare Variants. Genome Res. 2013, 23, 1514–1521. [Google Scholar] [CrossRef]
  51. Holsinger, K.E.; Weir, B.S. Genetics in Geographically Structured Populations: Defining, Estimating and Interpreting FST. Nat. Rev. Genet. 2009, 10, 639–650. [Google Scholar] [CrossRef] [PubMed]
  52. Hildebrandt, S. Estructura Genética de las Poblaciones de Cetáceos del Archipiélago Canario: Secuenciación de la Región Control y los Genes COI y NADH5 del ADN Mitocondrial [Genetic Structure of the Cetacean Populations from the Canarian Archipelago: Sequencing of the Control Region and the COI and NADH5 Genes of the Mitochondrial DNA]. Ph.D. Dissertation, Universidad de Las Palmas de Gran Canaria, Las Palmas, Spain, 2002. [Google Scholar]
  53. Herrera, I.; Carrillo, M.; Cosme de Esteban, M.; Haroun, R. Distribution of cetaceans in the canary islands (Northeast Atlantic ocean): Implications for the natura 2000 network and future conservation measures. Front. Mar. Sci. 2021, 8, 669790. [Google Scholar] [CrossRef]
  54. Do Amaral, K.B.; Barragán-Barrera, D.C.; Mesa-Gutiérrez, R.A.; Farías-Curtidor, N.; Caballero Gaitán, S.J.; Méndez-Fernandez, P.; Oliveira Santos, M.C.; Rinaldi, C.; Rinaldi, R.; Siciliano, S.; et al. Seascape genetics of the Atlantic Spotted Dolphin (Stenella frontalis) based on mitochondrial DNA. J. Hered. 2021, 112, 646–662. [Google Scholar] [CrossRef]
  55. Hooker, S.K.; Cañadas, A.; Hyrenbach, K.D.; Corrigan, C.; Polovina, J.J.; Reeves, R.R. Making Protected Area Networks Effective for Marine Top Predators. Endanger. Species Res. 2011, 13, 203–218. [Google Scholar] [CrossRef]
  56. Allendorf, F.W.; Hohenlohe, P.A.; Luikart, G. Genomics and the Future of Conservation Genetics. Nat. Rev. Genet. 2010, 11, 697–709. [Google Scholar] [CrossRef]
Figure 1. Map of the Canary Islands with sampling scheme of stranded (S) individuals and biopsy (B) samples. Areas in green highlight the Special Areas of Conservation (SACs) in La Gomera (ZEC-ES7020123) and Tenerife (ZEC-ES7020017) where biopsies were collected. Isobaths are plotted and denoted on a scale of blue.
Animals 14 00901 g001
Figure 2. Median-joining network based on 636 bp of mtDNA haplotypes found in bottlenose dolphins from the Canary Islands (A), and from the North-East Atlantic and Mediterranean (B). Each circle represents a unique haplotype colored proportionally to the amount of individuals found in each location. Size of the circle is proportional to the haplotype frequencies. Black circles represent unsampled or extinct intermediate haplotypes. Hatch marks represent mutational steps. More than 3 mutational steps are denoted in parenthesis.
Animals 14 00901 g002
Figure 3. Non-metric Multidimensional Scaling of the five localities sampled in the Canary Islands. (A) Scatter plot showing necropsies (squares) and biopsies (circles) samples colored depending on the locality of collection. Red = Tenerife; Green = La Gomera; Blue = Gran Canaria; Orange = Lanzarote; Pink = Fuerteventura. Here, 95% ellipse is denoted with in a blue line. (B) Shepard plot. The stress value of the Shepard plot is 0.09.
Animals 14 00901 g003
Table 1. Bottlenose dolphin mitochondrial genetic diversity found in bottlenose dolphins from the Canary Islands, including sample size (n), segregating sites (S), number of haplotypes (Nh), number of unique haplotypes (h), haplotype diversity (Hd), nucleotide diversity (π), and average number of nucleotide differences (k). SD = standard deviation.
PopulationsnSNhhHd (SD)π (SD)k
Tenerife 27 35 17 11 0.952 (0.025) 0.0166 (0.009) 10.571
La Gomera 12 31 9 2 0.955 (0.047) 0.0153 (0.008) 9.713
Lanzarote 4 24 4 3 1.000 (0.177) 0.0206 (0.014) 13.121
Gran Canaria 4 16 4 3 1.000 (0.177) 0.0149 (0.010) 9.491
Fuerteventura 2 9 2 1 1.000 (0.500) 0.0128 (0.014) 8.122
Total494328/0.969 (0.011)0.0165
(0.009)
10.509
Table 2. Bottlenose dolphin mitochondrial genetic diversity in the North-East Atlantic, including sample size (n), segregating sites (S), number of haplotypes (Nh), number of unique haplotypes (h), haplotype diversity (Hd), nucleotide diversity (π), and average number of nucleotide differences (k). Data from this work and from Louis et al. [20]. SD = standard deviation.
PopulationsnSNhhHd (SD)π (SD)k
Canary Islands494328170.969 (0.011)0.0165 (0.009)10.503
Coastal south11512400.499 (0.044)0.0014 (0.001)0.889
Coastal north7613520.667 (0.042)0.0063 (0.003)4.028
Pelagic Atlantic1014138250.929 (0.013)0.0155 (0.007)9.881
Pelagic Mediterranean51281580.902 (0.022)0.0137 (0.007)8.680
Total3925670/0.905 (0.009)0.0140 (0.007)8.894
Table 3. Population pairwise Fst (above diagonal) and Φst (below diagonal) values in terms of bottlenose dolphins from the Canary Islands.
PopulationsCanary IslandsCoastal SouthCoastal NorthPelagic AtlanticPelagic
Mediterranean
Canary Islands-0.291 **0.191 **0.0150.057 **
Coastal south0.635 **-0.252 **0.279 **0.328 **
Coastal north0.401 **0.233 **-0.195 **0.222 **
Pelagic Atlantic0.0040.541 **0.349 **-0.071 **
Pelagic Mediterranean0.0400.671 **0.446 **0.056 **-
** p < 0.01 after sequential Bonferroni correction.
Disclaimer/Publisher’s Note: The statements, opinions and data contained in all publications are solely those of the individual author(s) and contributor(s) and not of MDPI and/or the editor(s). MDPI and/or the editor(s) disclaim responsibility for any injury to people or property resulting from any ideas, methods, instructions or products referred to in the content.

