
Small Felids Coexist in Mixed-Use Landscape in the Bolivian Amazon
 , , ,
, , ,
Abstract
Simple Summary
Abstract
1. Introduction
- (1)
- Occupancy probabilities will decrease with increased proximity to human activity centers.
- (2)
- Occupancy probabilities will be lower at stations with higher jaguar or puma relative abundances. Smaller cat (oncilla, jaguarundi, and margay) occupancy probabilities will be lower at stations with higher ocelot occupancy estimates.
2. Materials and Methods
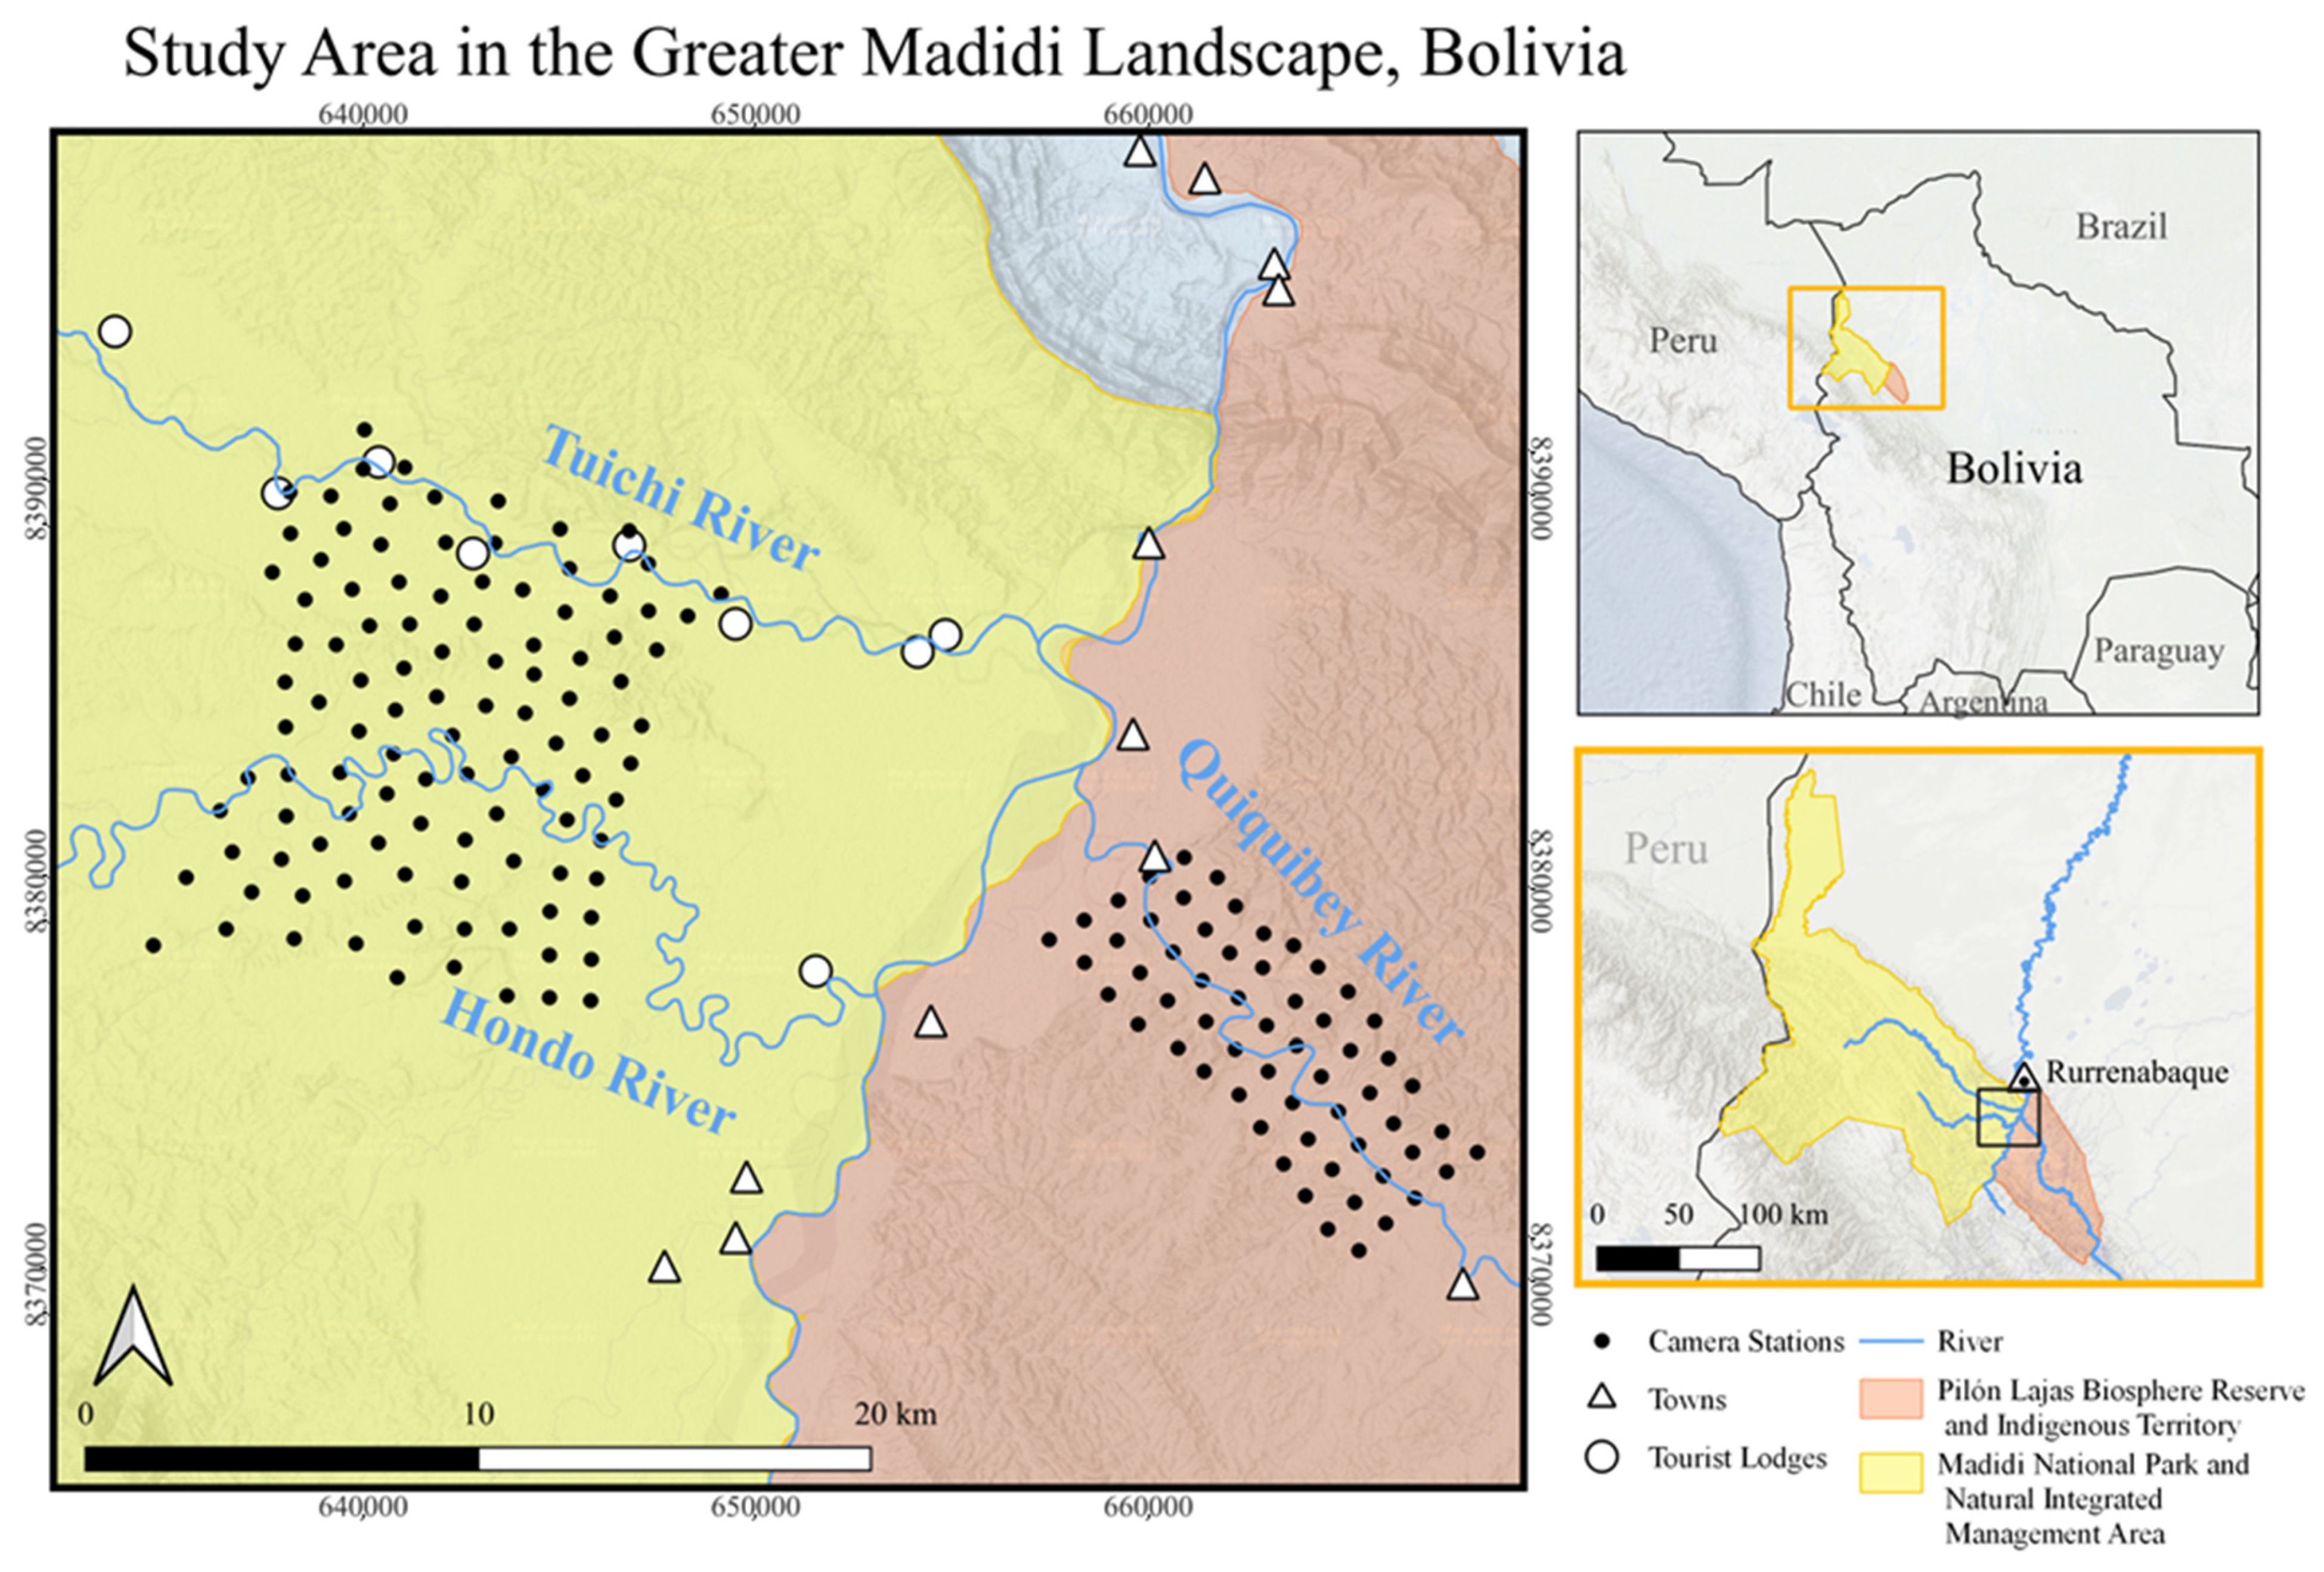
2.1. Study Site
2.2. Camera Trap Surveys
2.3. Data Analysis
3. Results
4. Discussion
5. Conclusions
Author Contributions
Funding
Institutional Review Board Statement
Informed Consent Statement
Data Availability Statement
Acknowledgments
Conflicts of Interest
Appendix A
Camera Setting Protocol
Appendix B
Full List of Prey Assigned to Each Species
Appendix C
Analysis and Covariate Details

| Covariates | Estimate | 95% CI | p-Value |
|---|---|---|---|
| Ocelot Occupancy (Ψ) β Coefficients | |||
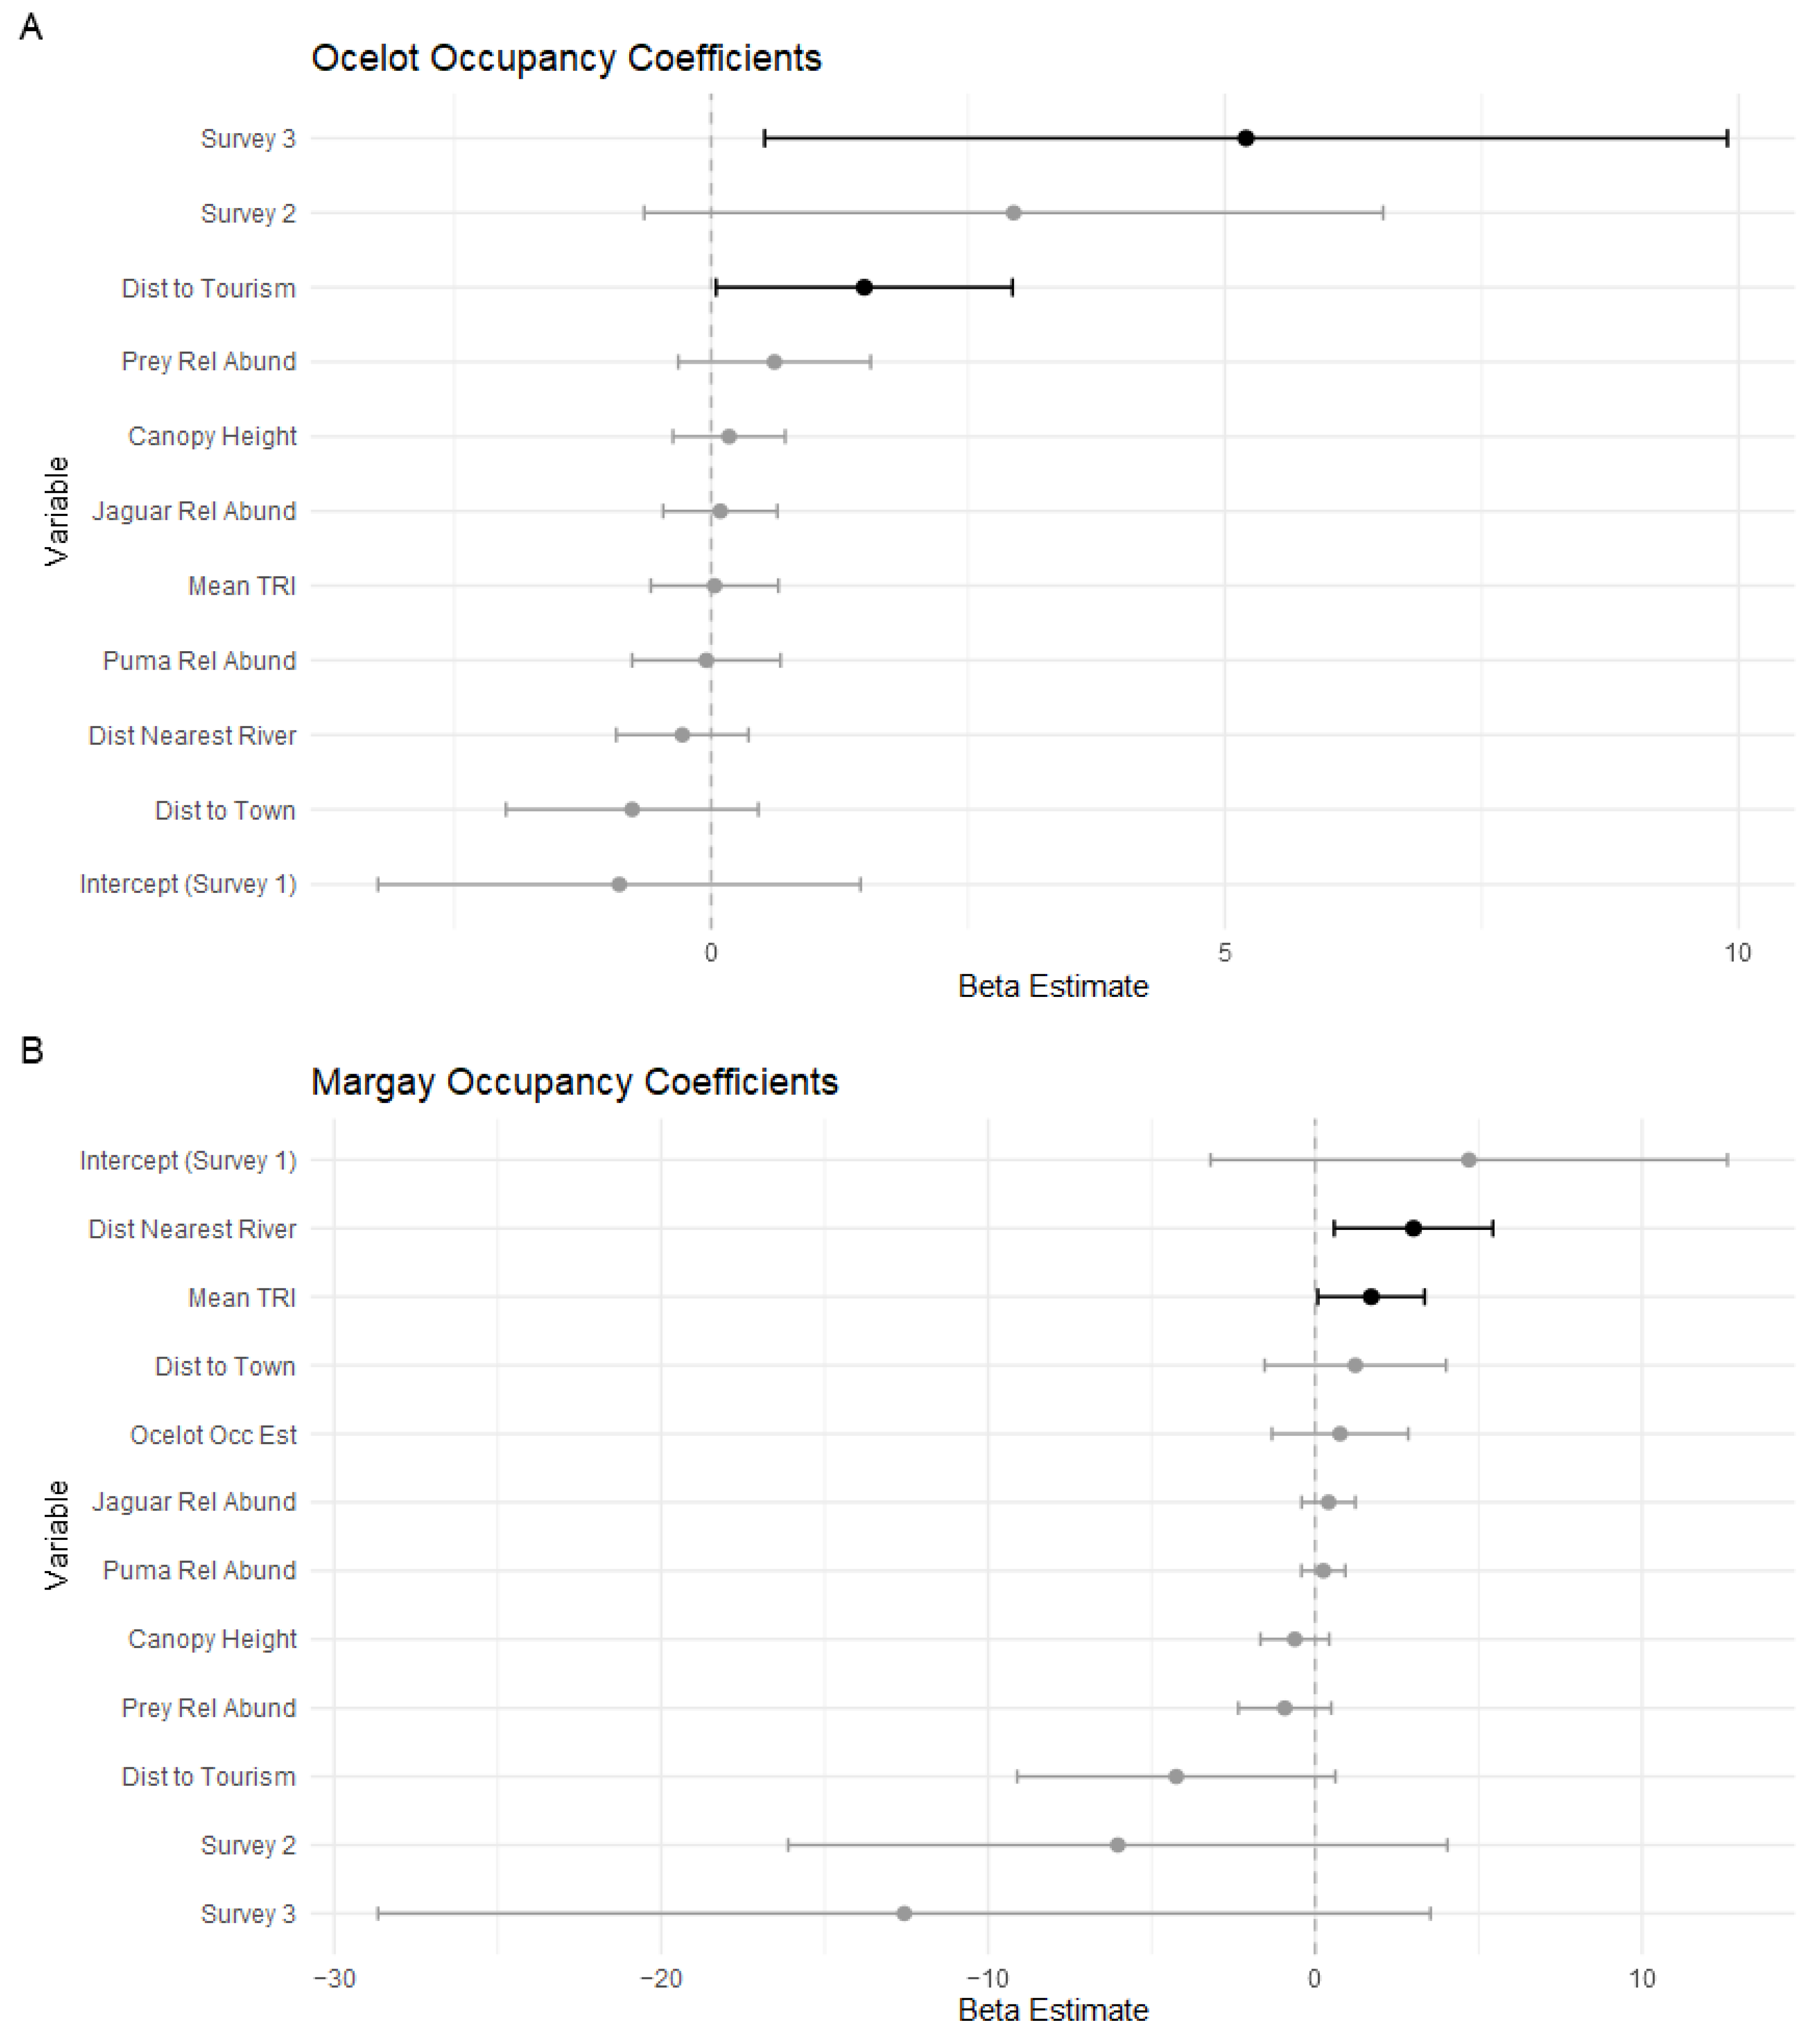
| Intercept (Survey 1) | −0.894 | ||
| Survey 2 | 2.94 | (−0.522, 6.54) | 0.109 |
| Survey 3 | 5.21 | (0.521, 9.89) | 0.0294 |
| Distance to River | −0.280 | (−0.924, 0.363) | 1 |
| Distance to Town | −0.769 | (−1.997, 0.459) | 0.890 |
| Distance to Lodge | 1.491 | (0.0479, 2.933) | 0.0214 |
| Prey Relative Abundance | 0.616 | (−0.320, 1.552) | 0.0986 |
| Mean TRI | 0.0334 | (−0.587, 0.654) | 0.916 |
| Canopy Height | 0.174 | (−0.371, 0.721) | 0.531 |
| Jaguar Relative Abundance | 0.0890 | (−0.467, 0.644) | 0.623 |
| Puma Relative Abundance | −0.0471 | (−0.769, 0.675) | 0.449 |
| Mean Ocelot Occupancy () Real Coefficients | |||
| 0.776 | (0.433, 0.934) | ||
| Ocelot Detection (p) β Coefficients | |||
| Attractant | −0.0000120 | (−0.000346, 0.000322) | 1 |
| Ocelot Detection () Real Coefficients | |||
| 0.471 | (0.417, 0.525) | ||
| Margay Occupancy (Ψ) β Coefficients | |||
| Intercept (Survey 1) | 4.71 | ||
| Survey 2 | −6.03 | (−16.1, 4.05) | 1 |
| Survey 3 | −12.6 | (−28.7, 3.53) | 1 |
| Distance to River | 3.013 | (0.583, 5.444) | 0.0151 |
| Distance to Town | 1.233 | (−1.542, 4.008) | 0.192 |
| Distance to Lodge | −4.244 | (−9.111, 0.622) | 0.956 |
| Prey Relative Abundance | −0.926 | (−2.348, 0.495) | 0.899 |
| Mean TRI | 1.718 | (0.0836, 3.353) | 0.0394 |
| Canopy Height | −0.619 | (−1.670, 0.432) | 1 |
| Jaguar Relative Abundance | 0.412 | (−0.408, 1.233) | 0.838 |
| Puma Relative Abundance | 0.255 | (−0.416, 0.926) | 0.772 |
| Ocelot Occupancy Estimate | 0.765 | (−1.320, 2.850) | 0.764 |
| Mean Margay Occupancy () Real Coefficients | |||
| 0.389 | (0.0879, 0.747) | ||
| Margay Detection (p) β Coefficients | |||
| Attractant | 0.000427 | (−0.0808, 0.0817) | 0.992 |
| Margay Detection () Real Coefficients | |||
| 0.147 | (0.0956, 0.218) | ||
References
- Venter, O.; Sanderson, E.W.; Magrach, A.; Allan, J.R.; Beher, J.; Jones, K.R.; Possingham, H.P.; Laurance, W.F.; Wood, P.; Fekete, B.M.; et al. Sixteen Years of Change in the Global Terrestrial Human Footprint and Implications for Biodiversity Conservation. Nat. Commun. 2016, 7, 12558. [Google Scholar] [CrossRef]
- Riggio, J.; Baillie, J.E.M.; Brumby, S.; Ellis, E.; Kennedy, C.M.; Oakleaf, J.R.; Tait, A.; Tepe, T.; Theobald, D.M.; Venter, O.; et al. Global Human Influence Maps Reveal Clear Opportunities in Conserving Earth’s Remaining Intact Terrestrial Ecosystems. Glob. Chang. Biol. 2020, 26, 4344–4356. [Google Scholar] [CrossRef] [PubMed]
- Ellis, E.C. Anthropogenic Transformation of the Terrestrial Biosphere. Philos. Trans. R. Soc. Math. Phys. Eng. Sci. 2011, 369, 1010–1035. [Google Scholar] [CrossRef] [PubMed]
- Pimm, S.L.; Russell, G.J.; Gittleman, J.L.; Brooks, T.M. The Future of Biodiversity. Science 1995, 269, 347–350. [Google Scholar] [CrossRef]
- Butchart, S.H.M.; Walpole, M.; Collen, B.; Van Strien, A.; Scharlemann, J.P.W.; Almond, R.E.A.; Baillie, J.E.M.; Bomhard, B.; Brown, C.; Bruno, J.; et al. Global Biodiversity: Indicators of Recent Declines. Science 2010, 328, 1164–1168. [Google Scholar] [CrossRef] [PubMed]
- Vitousek, P.M.; Mooney, H.A.; Lubchenco, J.; Melillo, J.M. Human Domination of Earth’s Ecosystems. Science 1997, 277, 494–499. [Google Scholar] [CrossRef]
- Jones, K.R.; Venter, O.; Fuller, R.A.; Allan, J.R.; Maxwell, S.L.; Negret, P.J.; Watson, J.E.M. One-Third of Global Protected Land Is under Intense Human Pressure. Science 2018, 360, 788–791. [Google Scholar] [CrossRef]
- Caro, T.; Darwin, J.; Forrester, T.; Ledoux-Bloom, C. Conservation in the Anthropocene. Conserv. Biol. 2023, 26, 185–188. [Google Scholar] [CrossRef]
- Fletcher, M.-S.; Hamilton, R.; Dressler, W.; Palmer, L. Indigenous Knowledge and the Shackles of Wilderness. Proc. Natl. Acad. Sci. USA 2021, 118, e2022218118. [Google Scholar] [CrossRef]
- Marneweck, C.J.; Allen, B.L.; Butler, A.R.; Do Linh San, E.; Harris, S.N.; Jensen, A.J.; Saldo, E.A.; Somers, M.J.; Titus, K.; Muthersbaugh, M.; et al. Middle-out Ecology: Small Carnivores as Sentinels of Global Change. Mammal Rev. 2022, 52, 471–479. [Google Scholar] [CrossRef]
- Schmitz, O.J. Predator Diversity and Trophic Interactions. Ecology 2007, 88, 2415–2426. [Google Scholar] [CrossRef]
- Hunter, L. Wild Cats of the World; Bloomsbury Wildlife: London, UK, 2015; ISBN 978-1-4729-6826-5. [Google Scholar]
- Bellani, G.G. Subfamily Felinae. In Felines of the World; Elsevier: Amsterdam, The Netherlands, 2020; pp. 145–308. ISBN 978-0-12-816503-4. [Google Scholar]
- de Oliveira, T.G.; Tortato, M.A.; Silveira, L.; Kasper, B.; Mazim, F.D.; Lucherini, M.; Jacomo, A.T.; Soares, J.B.G.; Marques, R.V.; Sunquist, M. Ocelot Ecology and Its Effect on the Small-Felid Guild in the Lowland Neotropics. In Biology and Conservation of Wild Felids; Oxford University Press: Oxford, UK, 2010; ISBN 978-0-19-923445-5. [Google Scholar]
- Giordano, A.J. Ecology and Status of the Jaguarundi Puma yagouaroundi: A Synthesis of Existing Knowledge: Jaguarundi Ecology and Status. Mammal Rev. 2016, 46, 30–43. [Google Scholar] [CrossRef]
- Emmons, L.H. A Field Study of Ocelots (Felis pardalis) in Peru. Rev. d Écologie Terre Vie 1988, 43, 133–157. [Google Scholar] [CrossRef]
- Sunquist, M.E.; Sunquist, F. Wild Cats of the World; University of Chicago Press: Chicago, IL, USA, 2002; ISBN 0-226-77999-8. [Google Scholar]
- Wang, E. Diets of Ocelots (Leopardus pardalis), Margays (L. wiedii), and Oncillas (L. tigrinus) in the Atlantic Rainforest in Southeast Brazil. Stud. Neotrop. Fauna Environ. 2002, 37, 207–212. [Google Scholar] [CrossRef]
- Bianchi, R.D.C.; Rosa, A.F.; Gatti, A.; Mendes, S.L. Diet of Margay, Leopardus wiedii, and Jaguarundi, Puma yagouaroundi, (Carnivora: Felidae) in Atlantic Rainforest, Brazil. Zool. Curitiba 2011, 28, 127–132. [Google Scholar] [CrossRef]
- Seibert, J.B.; Moreira, D.d.O.; Mendes, S.L.; Gatti, A. Diet of Two Sympatric Felids (Leopardus guttulus and Leopardus wiedii) in a Remnant of Atlantic Forest, in the Montane Region of Espírito Santo, Southeastern Brazil. Bol. Mus. Biol. Mello Leitão 2015, 37, 193–200. [Google Scholar]
- Rinaldi, A.R.; Rodriguez, F.H.; Carvalho, A.L.; Passos, F.C. Feeding of Small Neotropical Felids (Felidae: Carnivora) and Trophic Niche Overlap in Antropized Mosaic Landscape, South Brazilian. Biotemas 2015, 28, 155. [Google Scholar] [CrossRef]
- Di Bitetti, M.S.; De Angelo, C.D.; Di Blanco, Y.E.; Paviolo, A. Niche Partitioning and Species Coexistence in a Neotropical Felid Assemblage. Acta Oecologica 2010, 36, 403–412. [Google Scholar] [CrossRef]
- Oliveira-Santos, L.G.R.; Graipel, M.E.; Tortato, M.A.; Zucco, C.A.; Cáceres, N.C.; Goulart, F.V.B. Abundance Changes and Activity Flexibility of the Oncilla, Leopardus tigrinus (Carnivora: Felidae), Appear to Reflect Avoidance of Conflict. Zool. Curitiba 2012, 29, 115–120. [Google Scholar] [CrossRef]
- Wang, B.; Rocha, D.G.; Abrahams, M.I.; Antunes, A.P.; Costa, H.C.M.; Gonçalves, A.L.S.; Spironello, W.R.; De Paula, M.J.; Peres, C.A.; Pezzuti, J.; et al. Habitat Use of the Ocelot (Leopardus pardalis) in Brazilian Amazon. Ecol. Evol. 2019, 9, 5049–5062. [Google Scholar] [CrossRef]
- Emmons, L.H. Comparative Feeding Ecology of Felids in a Neotropical Rainforest. Behav. Ecol. Sociobiol. 1987, 20, 271–283. [Google Scholar] [CrossRef]
- Do Linh San, E.; Sato, J.J.; Belant, J.L.; Somers, M.J. (Eds.) The World’s Small Carnivores: Definitions, Richness, Distribution, Conservation Status, Ecological Roles, and Research Efforts. In Small Carnivores: Evolution, Ecology, Behavior, and Conservation, 1st ed.; Wiley: Hoboken, NJ, USA, 2022; ISBN 978-1-118-94328-1. [Google Scholar]
- Kosydar, A.J.; Rumiz, D.I.; Conquest, L.L.; Tewksbury, J.J. Effects of Hunting and Fragmentation on Terrestrial Mammals in the Chiquitano Forests of Bolivia. Trop. Conserv. Sci. 2014, 7, 288–307. [Google Scholar] [CrossRef]
- Dias, D.D.M.; Lima Massara, R.; De Campos, C.B.; Henrique Guimarães Rodrigues, F. Human Activities Influence the Occupancy Probability of Mammalian Carnivores in the Brazilian Caatinga. Biotropica 2019, 51, 253–265. [Google Scholar] [CrossRef]
- Mateo, R.G.; Arellano, G.; Gómez-Rubio, V.; Tello, J.S.; Fuentes, A.F.; Cayola, L.; Loza, M.I.; Cala, V.; Macía, M.J. Insights on Biodiversity Drivers to Predict Species Richness in Tropical Forests at the Local Scale. Ecol. Model. 2022, 473, 110133. [Google Scholar] [CrossRef]
- De Oliveira, T.G.; Pereira, J.A. Intraguild Predation and Interspecific Killing as Structuring Forces of Carnivoran Communities in South America. J. Mamm. Evol. 2014, 21, 427–436. [Google Scholar] [CrossRef]
- Kasper, C.B.; Schneider, A.; Oliveira, T.G. Home Range and Density of Three Sympatric Felids in the Southern Atlantic Forest, Brazil. Braz. J. Biol. 2016, 76, 228–232. [Google Scholar] [CrossRef]
- Gómez, H.; Wallace, R.B.; Ayala, G.; Tejada, R. Dry Season Activity Periods of Some Amazonian Mammals. Stud. Neotrop. Fauna Environ. 2005, 40, 91–95. [Google Scholar] [CrossRef]
- Navarro, G.; Maldonado, M. Geografía Ecológica de Bolivia: Vegetación y Ambientes Acuáticos, 1st ed.; Centro de Ecología Simón I. Patiño: Cochabamba, Bolivia, 2002; ISBN 99905-0-225-0. [Google Scholar]
- Wallace, R.B.; Gomez, H.; Ayala, G.; Espinoza, F. Camera Trapping for Jaguar (Panthera onca) in the Tuichi Valley, Bolivia. J. Neotrop. Mammal. 2003, 10, 133–139. [Google Scholar]
- Ayala, G.; Viscarra, M.E. Densidad y patrones de actividad de ocelotes (Leopardus pardalis) en Río Hondo, Parque Nacional y Área Natural de Manejo Integrado Madidi, La Paz, Bolivia. Rev. Boliv. Ecol. Conserv. Ambient. 2010, 28, 119–129. [Google Scholar]
- SERNAP. Plan de manejo y plan de vida de la Reserva de la Biosfera y Tierra Comunitaria de Origen Pilón Lajas; Servicio Nacional de Areas Protegidas y Consejo Regional T’simane Mostene: La Paz, Bolivia, 2009. [Google Scholar]
- SERNAP. Parque Nacional y Area Natural de Manejo Integrado Madidi: Plan de Manejo; SERNAP: La Paz, Bolivia, 2006. [Google Scholar]
- Tobler, M.W.; Carrillo-Percastegui, S.E.; Leite Pitman, R.; Mares, R.; Powell, G. An Evaluation of Camera Traps for Inventorying Large- and Medium-Sized Terrestrial Rainforest Mammals. Anim. Conserv. 2008, 11, 169–178. [Google Scholar] [CrossRef]
- Kays, R.; Tilak, S.; Kranstauber, B.; Jansen, P.A.; Carbone, C.; Rowcliffe, M.J.; Fountain, T.; Eggert, J.; He, Z. Monitoring Wild Animal Communities with Arrays of Motion Sensitive Camera Traps. arXiv 2010, arXiv:1009.5718. [Google Scholar]
- O’Brien, T.G.; Kinnaird, M.F.; Wibisono, H.T. Crouching Tigers, Hidden Prey: Sumatran Tiger and Prey Populations in a Tropical Forest Landscape. Anim. Conserv. 2003, 6, 131–139. [Google Scholar] [CrossRef]
- Polisar, J.; O’Brien, T.G.; Matthews, S.M.; Beckmann, J.P.; Sanderson, E.W.; Rosas-Rosas, O.C.; Lopez-Gonzalez, C.A. Review of Jaguar Survey and Monitoring Techniques and Methodologies; Wildlife Conservation Society: Bronx, NY, USA, 2014. [Google Scholar]
- Rocha, D.G.; Ramalho, E.E.; Magnusson, W.E. Baiting for Carnivores Might Negatively Affect Capture Rates of Prey Species in Camera-trap Studies. J. Zool. 2016, 300, 205–212. [Google Scholar] [CrossRef]
- Mills, L.S.; Knowlton, F.F. Coyote Space Use in Relation to Prey Abundance. Can. J. Zool. 1991, 69, 1516–1521. [Google Scholar] [CrossRef]
- Mills, D.; Fattebert, J.; Hunter, L.; Slotow, R. Maximising Camera Trap Data: Using Attractants to Improve Detection of Elusive Species in Multi-Species Surveys. PLoS ONE 2019, 14, e0216447. [Google Scholar] [CrossRef] [PubMed]
- Noss, A.; Polisar, J.; Maffei, L.; Garcia, R.; Silver, S. Evaluating Jaguar Densities with Camera Traps; Wildlife Conservation Society: Bronx, NY, USA, 2013. [Google Scholar]
- Viscarra, M.E.; Ayala, G.; Wallace, R.; Nallar, R. Short Communication: The Use of Commercial Perfumes for Studying Jaguars. CATnews 2011, 54, 30–31. [Google Scholar]
- Horn, P.E.; Pereira, M.J.R.; Trigo, T.C.; Eizirik, E.; Tirelli, F.P. Margay (Leopardus wiedii) in the Southernmost Atlantic Forest: Density and Activity Patterns under Different Levels of Anthropogenic Disturbance. PLoS ONE 2020, 15, e0232013. [Google Scholar] [CrossRef] [PubMed]
- Pérez-Irineo, G.; Santos-Moreno, A.; Hernández-Sánchez, A. Density and Activity Pattern of Leopardus wiedii and Leopardus pardalis in Sierra Norte of Oaxaca, Mexico. THERYA 2017, 8, 223–232. [Google Scholar] [CrossRef]
- Hodge, A.-M.C. Habitat Selection of the Margay (Leopardus wiedii) in the Eastern Andean Foothills of Ecuador. Mammalia 2014, 78, 351–358. [Google Scholar] [CrossRef]
- Harmsen, B.J.; Saville, N.; Foster, R.J. Long-Term Monitoring of Margays (Leopardus wiedii): Implications for Understanding Low Detection Rates. PLoS ONE 2021, 16, e0247536. [Google Scholar] [CrossRef]
- Michalski, F.; Crawshaw, P.G.; Oliveira, T.G.D.; Fabián, M.E. Notes on Home Range and Habitat Use of Three Small Carnivore Species in a Disturbed Vegetation Mosaic of Southeastern Brazil/Notes Sur Le Territoire et l’utilisation de l’habitat de Trois Espèces de Petits Carnivores Dans Une Végétation Mosaïque Perturbée Au Sud Est Du Brésil. Mammalia 2006, 70, 52–57. [Google Scholar] [CrossRef]
- Garrido, E.P.; González-Maya, J.F. Distribución Geográfica de la Oncilla (Leopardus tigrinus) en Colombia e Implicaciones para su Conservación. Lat. Am. J. Conserv. 2011, 2, 51–59. [Google Scholar]
- González-Maya, J.F.; Zárrate-Charry, D.A.; Arias-Alzate, A.; Lemus-Mejía, L.; Hurtado-Moreno, A.P.; Vargas-Gómez, M.G.; Cárdenas, T.A.; Mallarino, V.; Schipper, J. Spotting What’s Important: Priority Areas, Connectivity, and Conservation of the Northern Tiger Cat (Leopardus tigrinus) in Colombia. PLoS ONE 2022, 17, e0273750. [Google Scholar] [CrossRef] [PubMed]
- Machado, R.F.; Cerezer, F.O.; Hendges, C.D.; Cáceres, N.C. Factors Affecting the Home Range Size of Felids (Mammalia, Carnivora) with Emphasis on Three American Species. Ecol. Austral 2017, 27, 199–311. [Google Scholar]
- Wallace, R.; Ayala, G.; Viscarra, M. Lowland Tapir (Tapirus terrestris) Distribution, Activity Patterns and Relative Abundance in the Greater Madidi-Tambopata Landscape. Integr. Zool. 2012, 7, 407–419. [Google Scholar] [CrossRef] [PubMed]
- Pérez-Irineo, G.; Santos-Moreno, A. Abundance and Activity Patterns of Medium-Sized Felids (Felidae, Carnivora) in Southeastern Mexico. Southwest Nat. 2016, 61, 33–39. [Google Scholar] [CrossRef]
- O’Brien, T.G. Abundance, Density, and Relative Abundance: A Conceptual Framework. In Camera Traps in Animal Ecology; O’Connell, A.F., Nichols, J.D., Karanth, K.U., Eds.; Springer: Tokyo, Japan, 2011; pp. 71–96. ISBN 978-4-431-99494-7. [Google Scholar]
- Gonzalez-Borrajo, N.; López-Bao, J.V.; Palomares, F. Spatial Ecology of Jaguars, Pumas, and Ocelots: A Review of the State of Knowledge. Mammal Rev. 2017, 47, 62–75. [Google Scholar] [CrossRef]
- Chinchilla, F.A. La Dieta Del Jaguar (Panthera onca), El Puma (Felis concolor) y El Manigordo (Felis pardalis) (Carnivora: Felidae) En El Parque Nacional Corcovado, Costa Rica. Rev. Biol. Trop. 1997, 45, 1223–1229. [Google Scholar]
- Moreno, R.S.; Kays, R.W.; Samudio, R. Competitive Release in Diets of Ocelot (Leopardus pardalis) and Puma (Puma concolor) after Jaguar (Panthera onca) Decline. J. Mammal. 2006, 87, 808–816. [Google Scholar] [CrossRef]
- Riley, S.J.; DeGloria, S.D.; Elliot, R. A Terrain Ruggedness Index That Quantifies Topographic Heterogeneity. Intermt. J. Sci. 1999, 5, 23–27. [Google Scholar]
- Mackenzie, D.I.; Nichols, J.D.; Lachman, G.B.; Droege, S.; Royle, J.A.; Langtimm, C.A. Estimating Site Occupancy Rates When Detection Probabilities are Less than One. Ecology 2002, 83, 2248–2255. [Google Scholar] [CrossRef]
- R Core Team. R: A Language and Environment for Statistical Computing; R Foundation for Statistical Computing: Vienna, Austria, 2023; Available online: https://www.R-project.org/ (accessed on 17 December 2023).
- MacKenzie, D.I.; Hines, J.E. RPresence: R Interface for Program PRESENCE; R Foundation for Statistical Computing: Vienna, Austria, 2023. [Google Scholar]
- MacKenzie, D.I.; Bailey, L.L. Assessing the Fit of Site-Occupancy Models. J. Agric. Biol. Environ. Stat. 2004, 9, 300–318. [Google Scholar] [CrossRef]
- Locke, H. Nature Needs Half: A Necessary and Hopeful New Agenda for Protected Areas. PARKS 2013, 19, 13–22. [Google Scholar] [CrossRef]
- Ellis, E.C. To Conserve Nature in the Anthropocene, Half Earth Is Not Nearly Enough. One Earth 2019, 1, 163–167. [Google Scholar] [CrossRef]
- Ellis, E.C.; Mehrabi, Z. Half Earth: Promises, Pitfalls, and Prospects of Dedicating Half of Earth’s Land to Conservation. Curr. Opin. Environ. Sustain. 2019, 38, 22–30. [Google Scholar] [CrossRef]
- Painter, R.L.E.; Duran, A.; Miro, E. Indigenous Alliances for Conservation in Bolivia: Alliances for Conservation in Bolivia. Conserv. Biol. 2011, 25, 1084–1086. [Google Scholar] [CrossRef] [PubMed]
- Painter, L.; Wallace, R.; Gómez, H. Landscape Conservation in the Greater Madidi Landscape, Bolivia. In Principles of Conservation Biology; Froom, M.J., Meffe, G.K., Carroll, C.R., Eds.; Sinauer Associates: Sunderland, MA, USA, 2006; ISBN 978-0-87893-518-5. [Google Scholar]
- Forrest, J.L.; Sanderson, E.W.; Wallace, R.; Lazzo, T.M.S.; Cerveró, L.H.G.; Coppolillo, P. Patterns of Land Cover Change In and Around Madidi National Park, Bolivia. Biotropica 2008, 40, 285–294. [Google Scholar] [CrossRef]
- Karanth, K.U.; Nichols, J.D. Estimation of Tiger Densities in India Using Photographic Captures and Recaptures. Ecology 1998, 79, 2852–2862. [Google Scholar] [CrossRef]
- O’Brien, T.G.; Baillie, J.E.M.; Krueger, L.; Cuke, M. The Wildlife Picture Index: Monitoring Top Trophic Levels: The Wildlife Picture Index. Anim. Conserv. 2010, 13, 335–343. [Google Scholar] [CrossRef]
- Sollmann, R.; Furtado, M.M.; Hofer, H.; Jácomo, A.T.A.; Tôrres, N.M.; Silveira, L. Using Occupancy Models to Investigate Space Partitioning between Two Sympatric Large Predators, the Jaguar and Puma in Central Brazil. Mamm. Biol. 2012, 77, 41–46. [Google Scholar] [CrossRef]
- Farr, T.G.; Rosen, P.A.; Caro, E.; Crippen, R.; Duren, R.; Hensley, S.; Kobrick, M.; Paller, M.; Rodriquez, E.; Roth, L.; et al. The Shuttle Radar Topography Mission. Rev. Geophys. 2007, 45, 2005RG000183. [Google Scholar] [CrossRef]
- Potapov, P.; Li, X.; Hernandez-Serna, A.; Tyukavina, A.; Hansen, M.C.; Kommareddy, A.; Pickens, A.; Turubanova, S.; Tang, H.; Silva, C.E.; et al. Mapping Global Forest Canopy Height through Integration of GEDI and Landsat Data. Remote Sens. 2021, 253, 112165. [Google Scholar] [CrossRef]


| Type | Covariate | Mean (Minimum, Maximum) |
|---|---|---|
| Human Variables | Distance to nearest road (m) | 18,809 (7176, 30,211) |
| Distance to nearest town (m) | 10,947 (629, 19,494) | |
| Distance to nearest tourist lodge (m) | 7435 (331, 17,489) | |
| Non-Human Variables | Mean TRI 1 (m) | 25.13 (10.00, 70.53) |
| Canopy Height (m) | 26.23 (0, 32) | |
| Relative Abundance Indices | Jaguar (obs/100 days) | 1.547 (0, 13.043) |
| Puma (obs/100 days) | 0.521 (0, 13.043) | |
| Ocelot Prey (obs/100 days) | 117.5 (2.12, 476.60) | |
| Margay/Jaguarundi/Oncilla Prey (obs/100 days) | 27.3 (0, 145.65) |
| Species | Survey | Occupancy Prob. () ± SE | Detection Prob. () ± SE | Detection/Non-Detection (% with Detection) | Number of Observations |
|---|---|---|---|---|---|
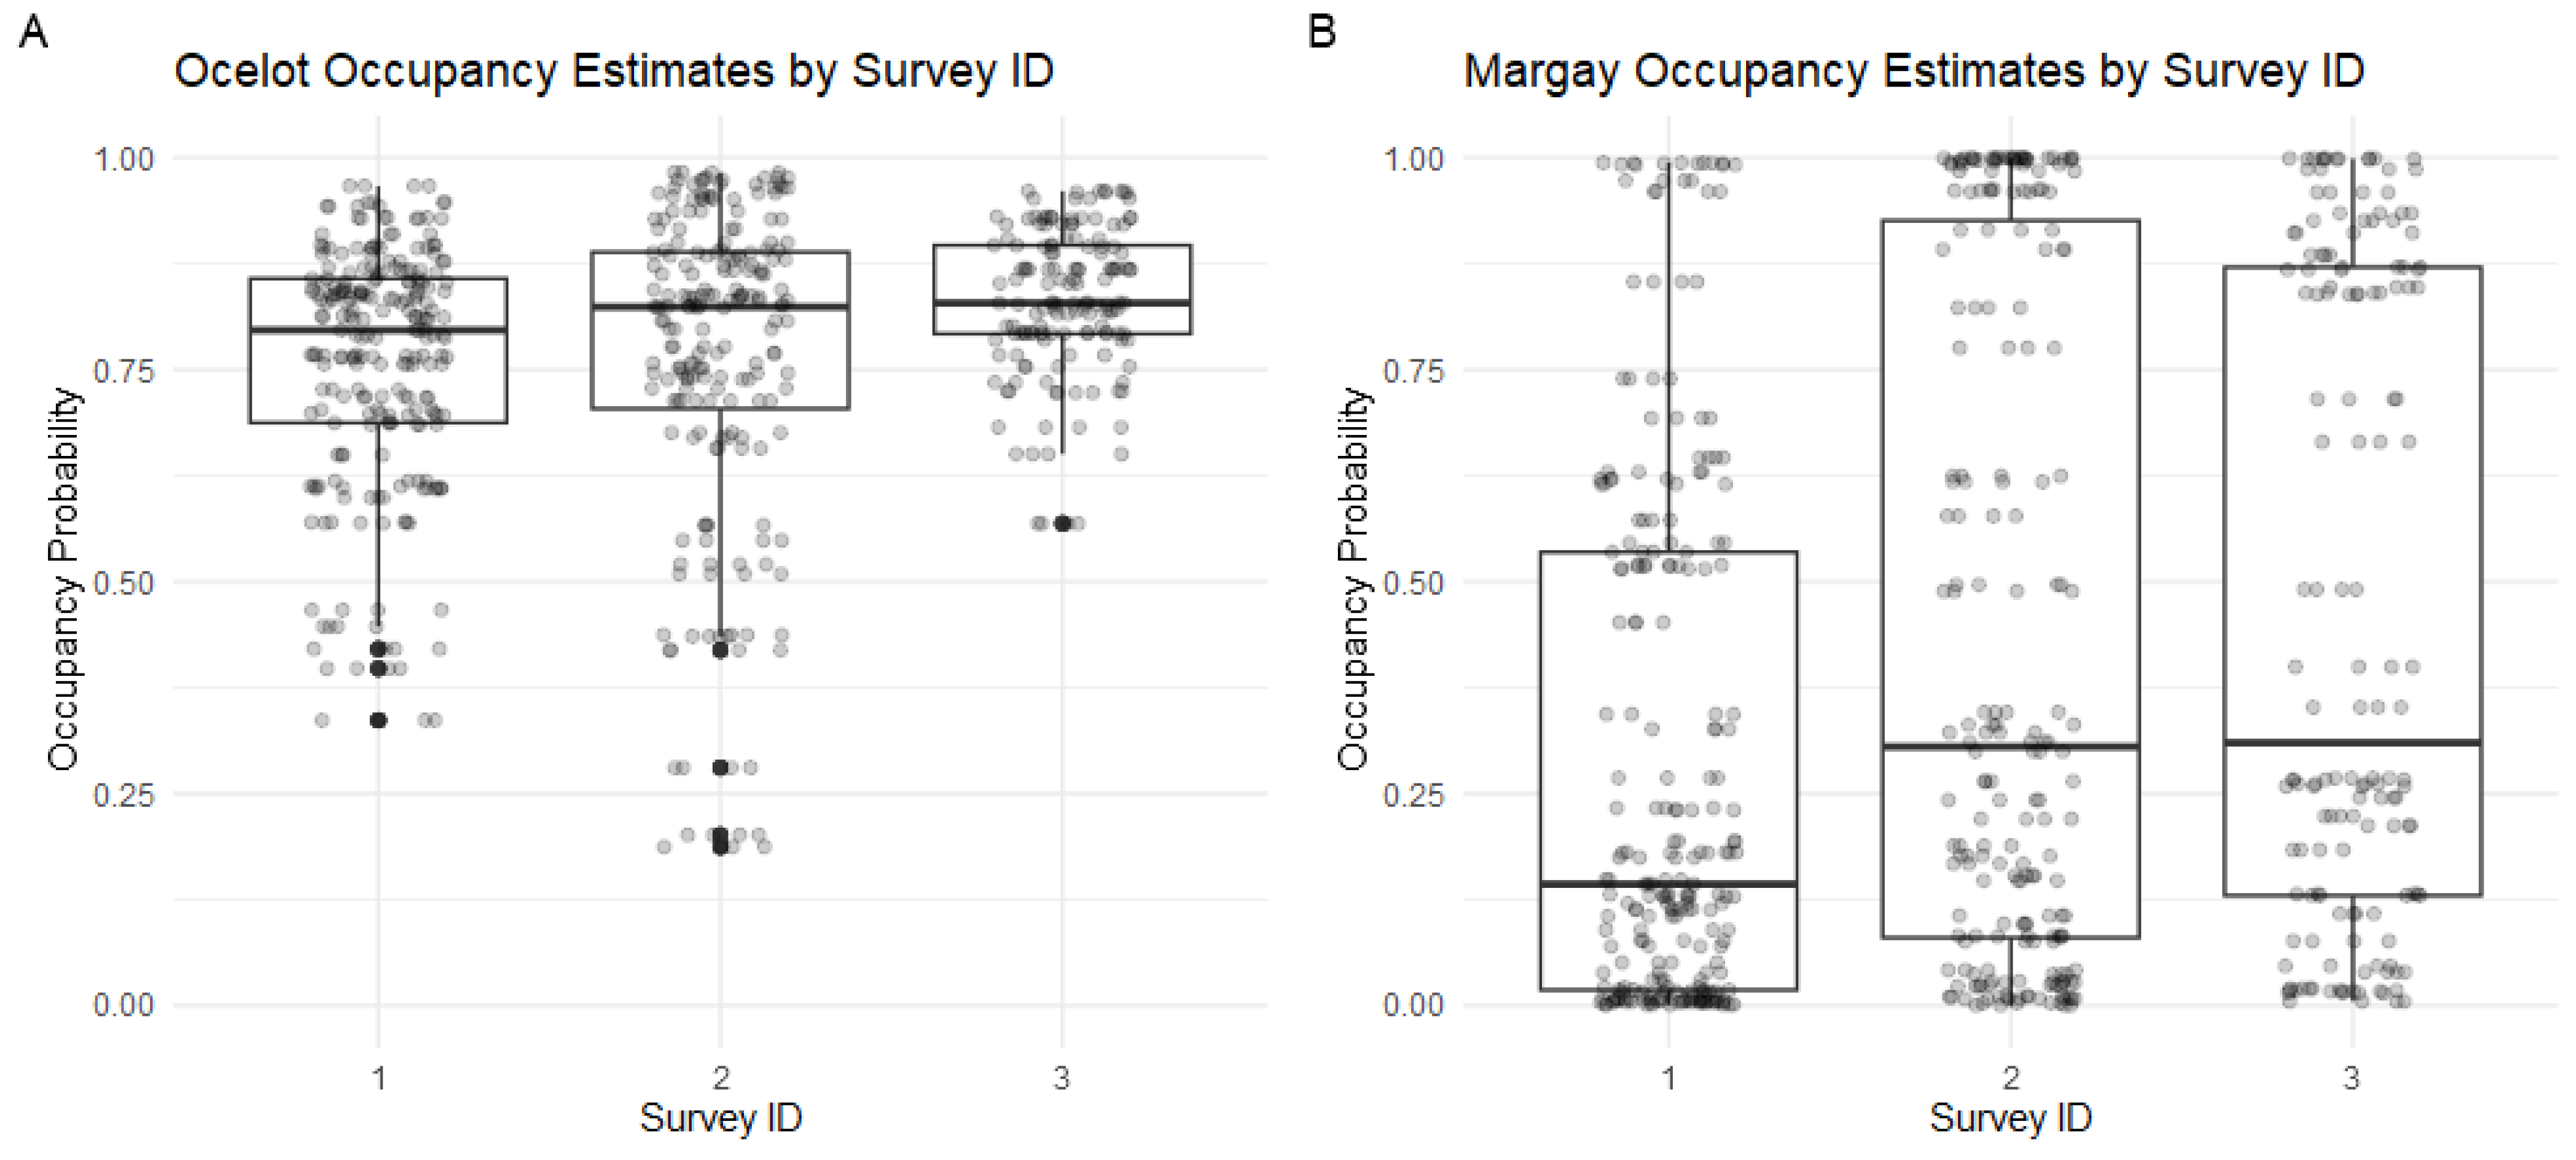
| Ocelot | 1 | 0.7574 ± 0.1310 | 42/17 (71.2%) | 215 | |
| 2 | 0.7571 ± 0.1310 | 36/16 (69.2%) | 186 | ||
| 3 | 0.8308 ± 0.1168 | 30/8 (78.9%) | 77 | ||
| Overall | 0.7760 ± 0.1274 | 0.4711 ± 0.02753 | 108/41 (72.5%) | 478 | |
| Margay | 1 | 0.2902 ± 0.1739 | 8/51 (13.6%) | 14 | |
| 2 | 0.4402 ± 0.1387 | 11/41 (21.1%) | 18 | ||
| 3 | 0.4740 ± 0.1774 | 9/31 (23.7%) | 15 | ||
| Overall | 0.3894 ± 0.1625 | 0.1466 ± 0.0310 | 28/121 (18.8%) | 47 | |
| Jaguarundi | 1 | 7/52 (11.9%) | 12 | ||
| 2 | 4/48 (7.7%) | 5 | |||
| 3 | 2/36 (5.3%) | 2 | |||
| Overall | 13/136 (8.7%) | 19 | |||
| Oncilla | Overall (1) | 2/57 (3.4%) | 5 |
Disclaimer/Publisher’s Note: The statements, opinions and data contained in all publications are solely those of the individual author(s) and contributor(s) and not of MDPI and/or the editor(s). MDPI and/or the editor(s) disclaim responsibility for any injury to people or property resulting from any ideas, methods, instructions or products referred to in the content. |
© 2024 by the authors. Licensee MDPI, Basel, Switzerland. This article is an open access article distributed under the terms and conditions of the Creative Commons Attribution (CC BY) license (https://creativecommons.org/licenses/by/4.0/).
Share and Cite
Anderson, C.; Zuckerwise, A.; Wallace, R.B.; Ayala, G.; Viscarra, M.; Schmitz, O.J. Small Felids Coexist in Mixed-Use Landscape in the Bolivian Amazon. Animals 2024, 14, 697. https://doi.org/10.3390/ani14050697
Anderson C, Zuckerwise A, Wallace RB, Ayala G, Viscarra M, Schmitz OJ. Small Felids Coexist in Mixed-Use Landscape in the Bolivian Amazon. Animals. 2024; 14(5):697. https://doi.org/10.3390/ani14050697
Chicago/Turabian StyleAnderson, Courtney, Amelia Zuckerwise, Robert B. Wallace, Guido Ayala, Maria Viscarra, and Oswald J. Schmitz. 2024. "Small Felids Coexist in Mixed-Use Landscape in the Bolivian Amazon" Animals 14, no. 5: 697. https://doi.org/10.3390/ani14050697
APA StyleAnderson, C., Zuckerwise, A., Wallace, R. B., Ayala, G., Viscarra, M., & Schmitz, O. J. (2024). Small Felids Coexist in Mixed-Use Landscape in the Bolivian Amazon. Animals, 14(5), 697. https://doi.org/10.3390/ani14050697