
VNN1 Gene Expression and Polymorphisms Associated with Chicken Carcass Traits


Abstract
Simple Summary
Abstract
1. Introduction
2. Materials and Methods
2.1. Carcass Traits Data
2.2. Primer Design
2.3. DNA Extraction, Polymerase Chain Reaction, and DNA Sequencing
2.4. RNA Extraction, Complementary DNA (cDNA) Synthesis, and Quantitative Real-Time PCR (qRT-PCR)
2.5. Sequencing and Genotyping
2.6. Statistics and Analysis
3. Results
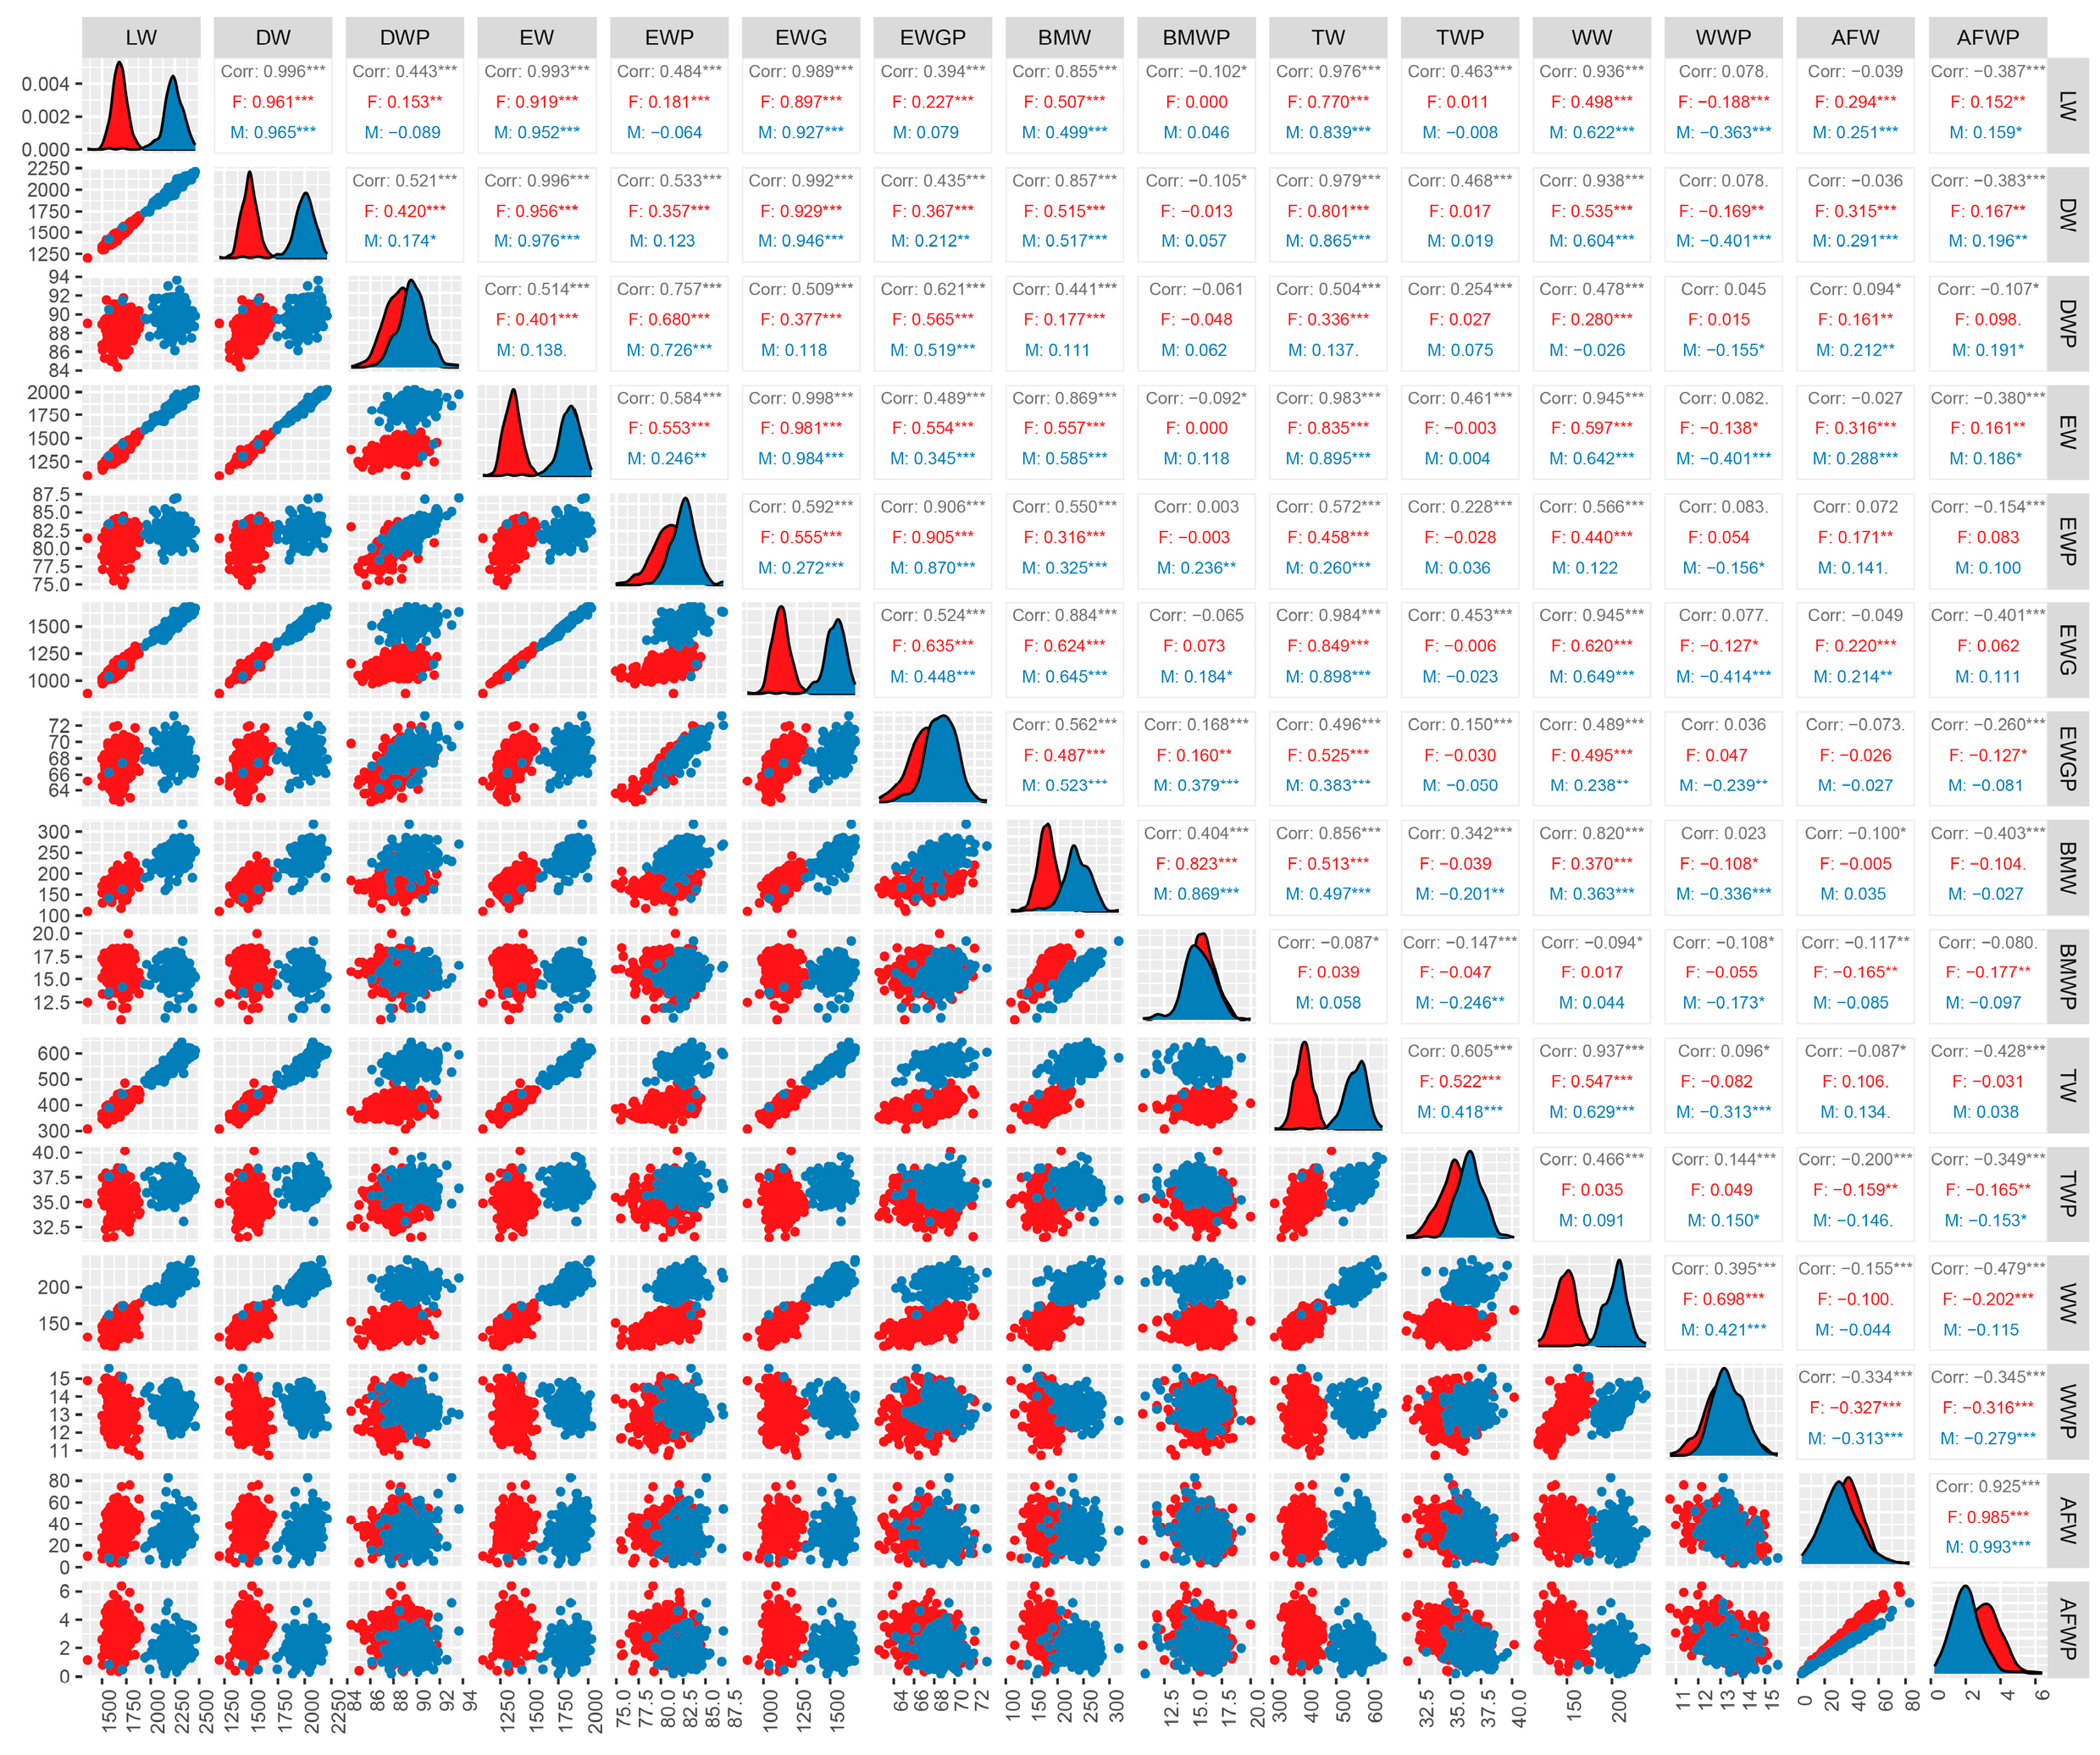
3.1. Information on Carcass Traits
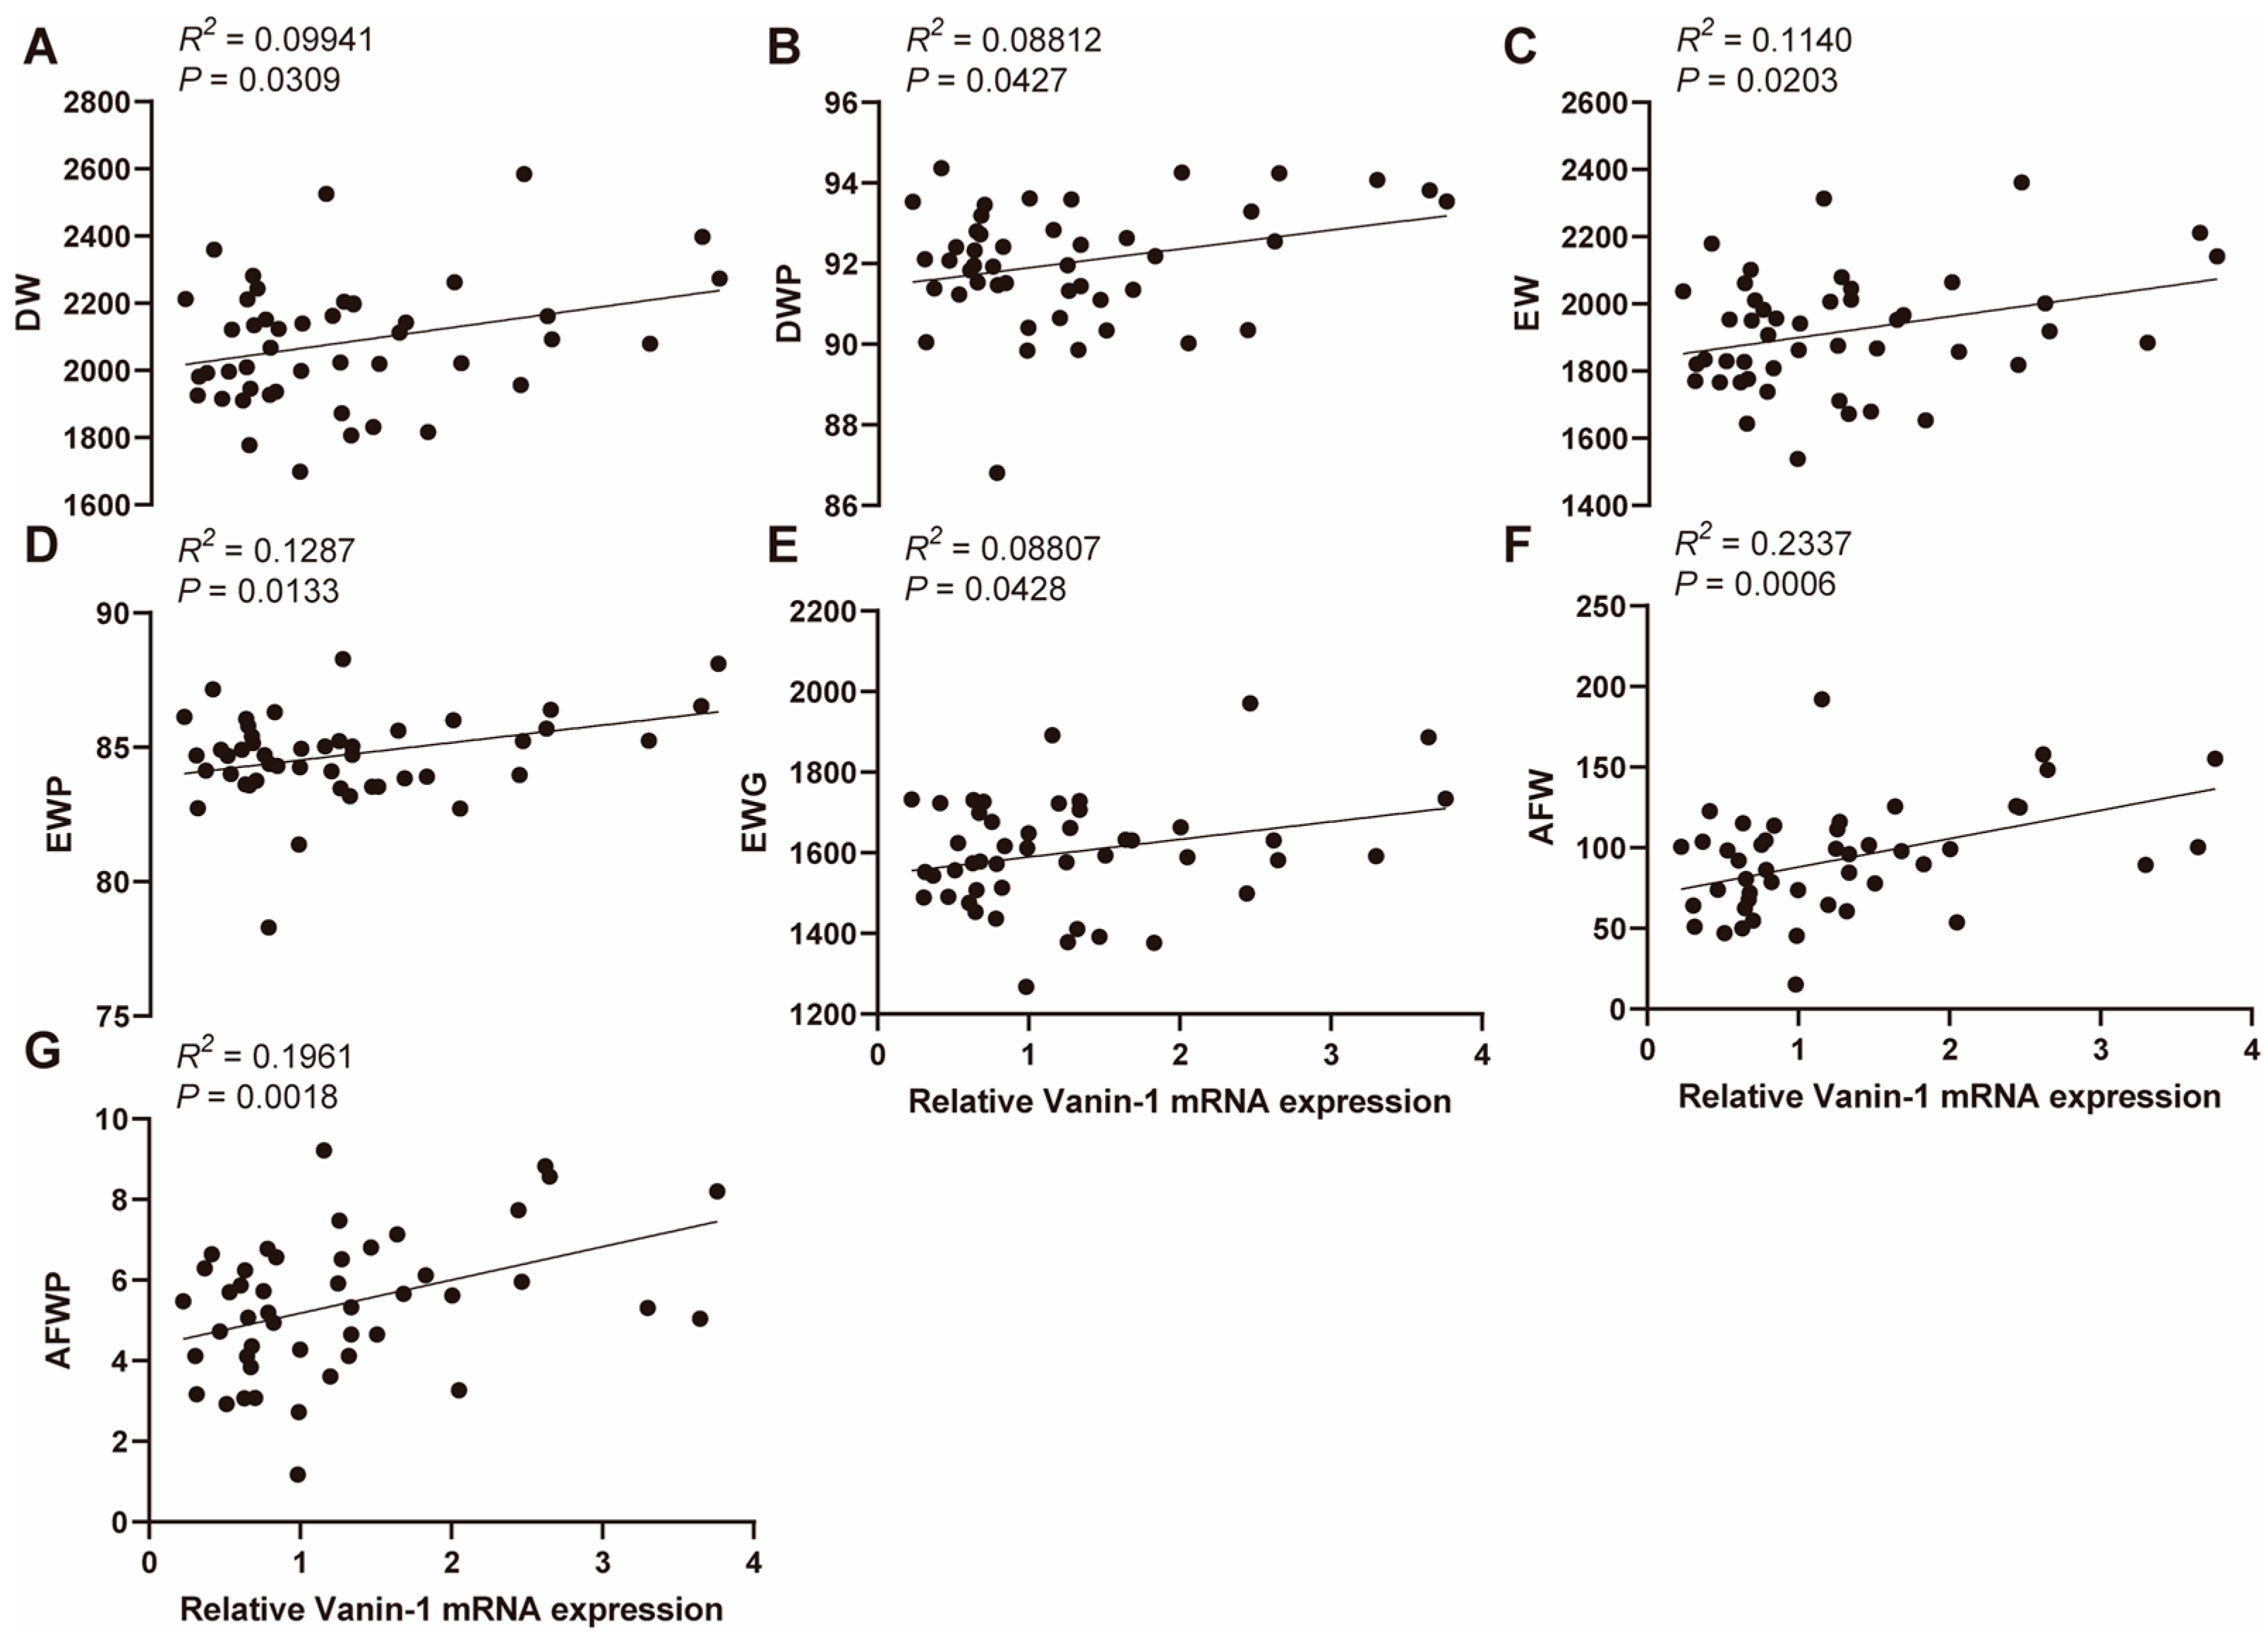
3.2. Association between VNN1 Expression and Carcass Traits
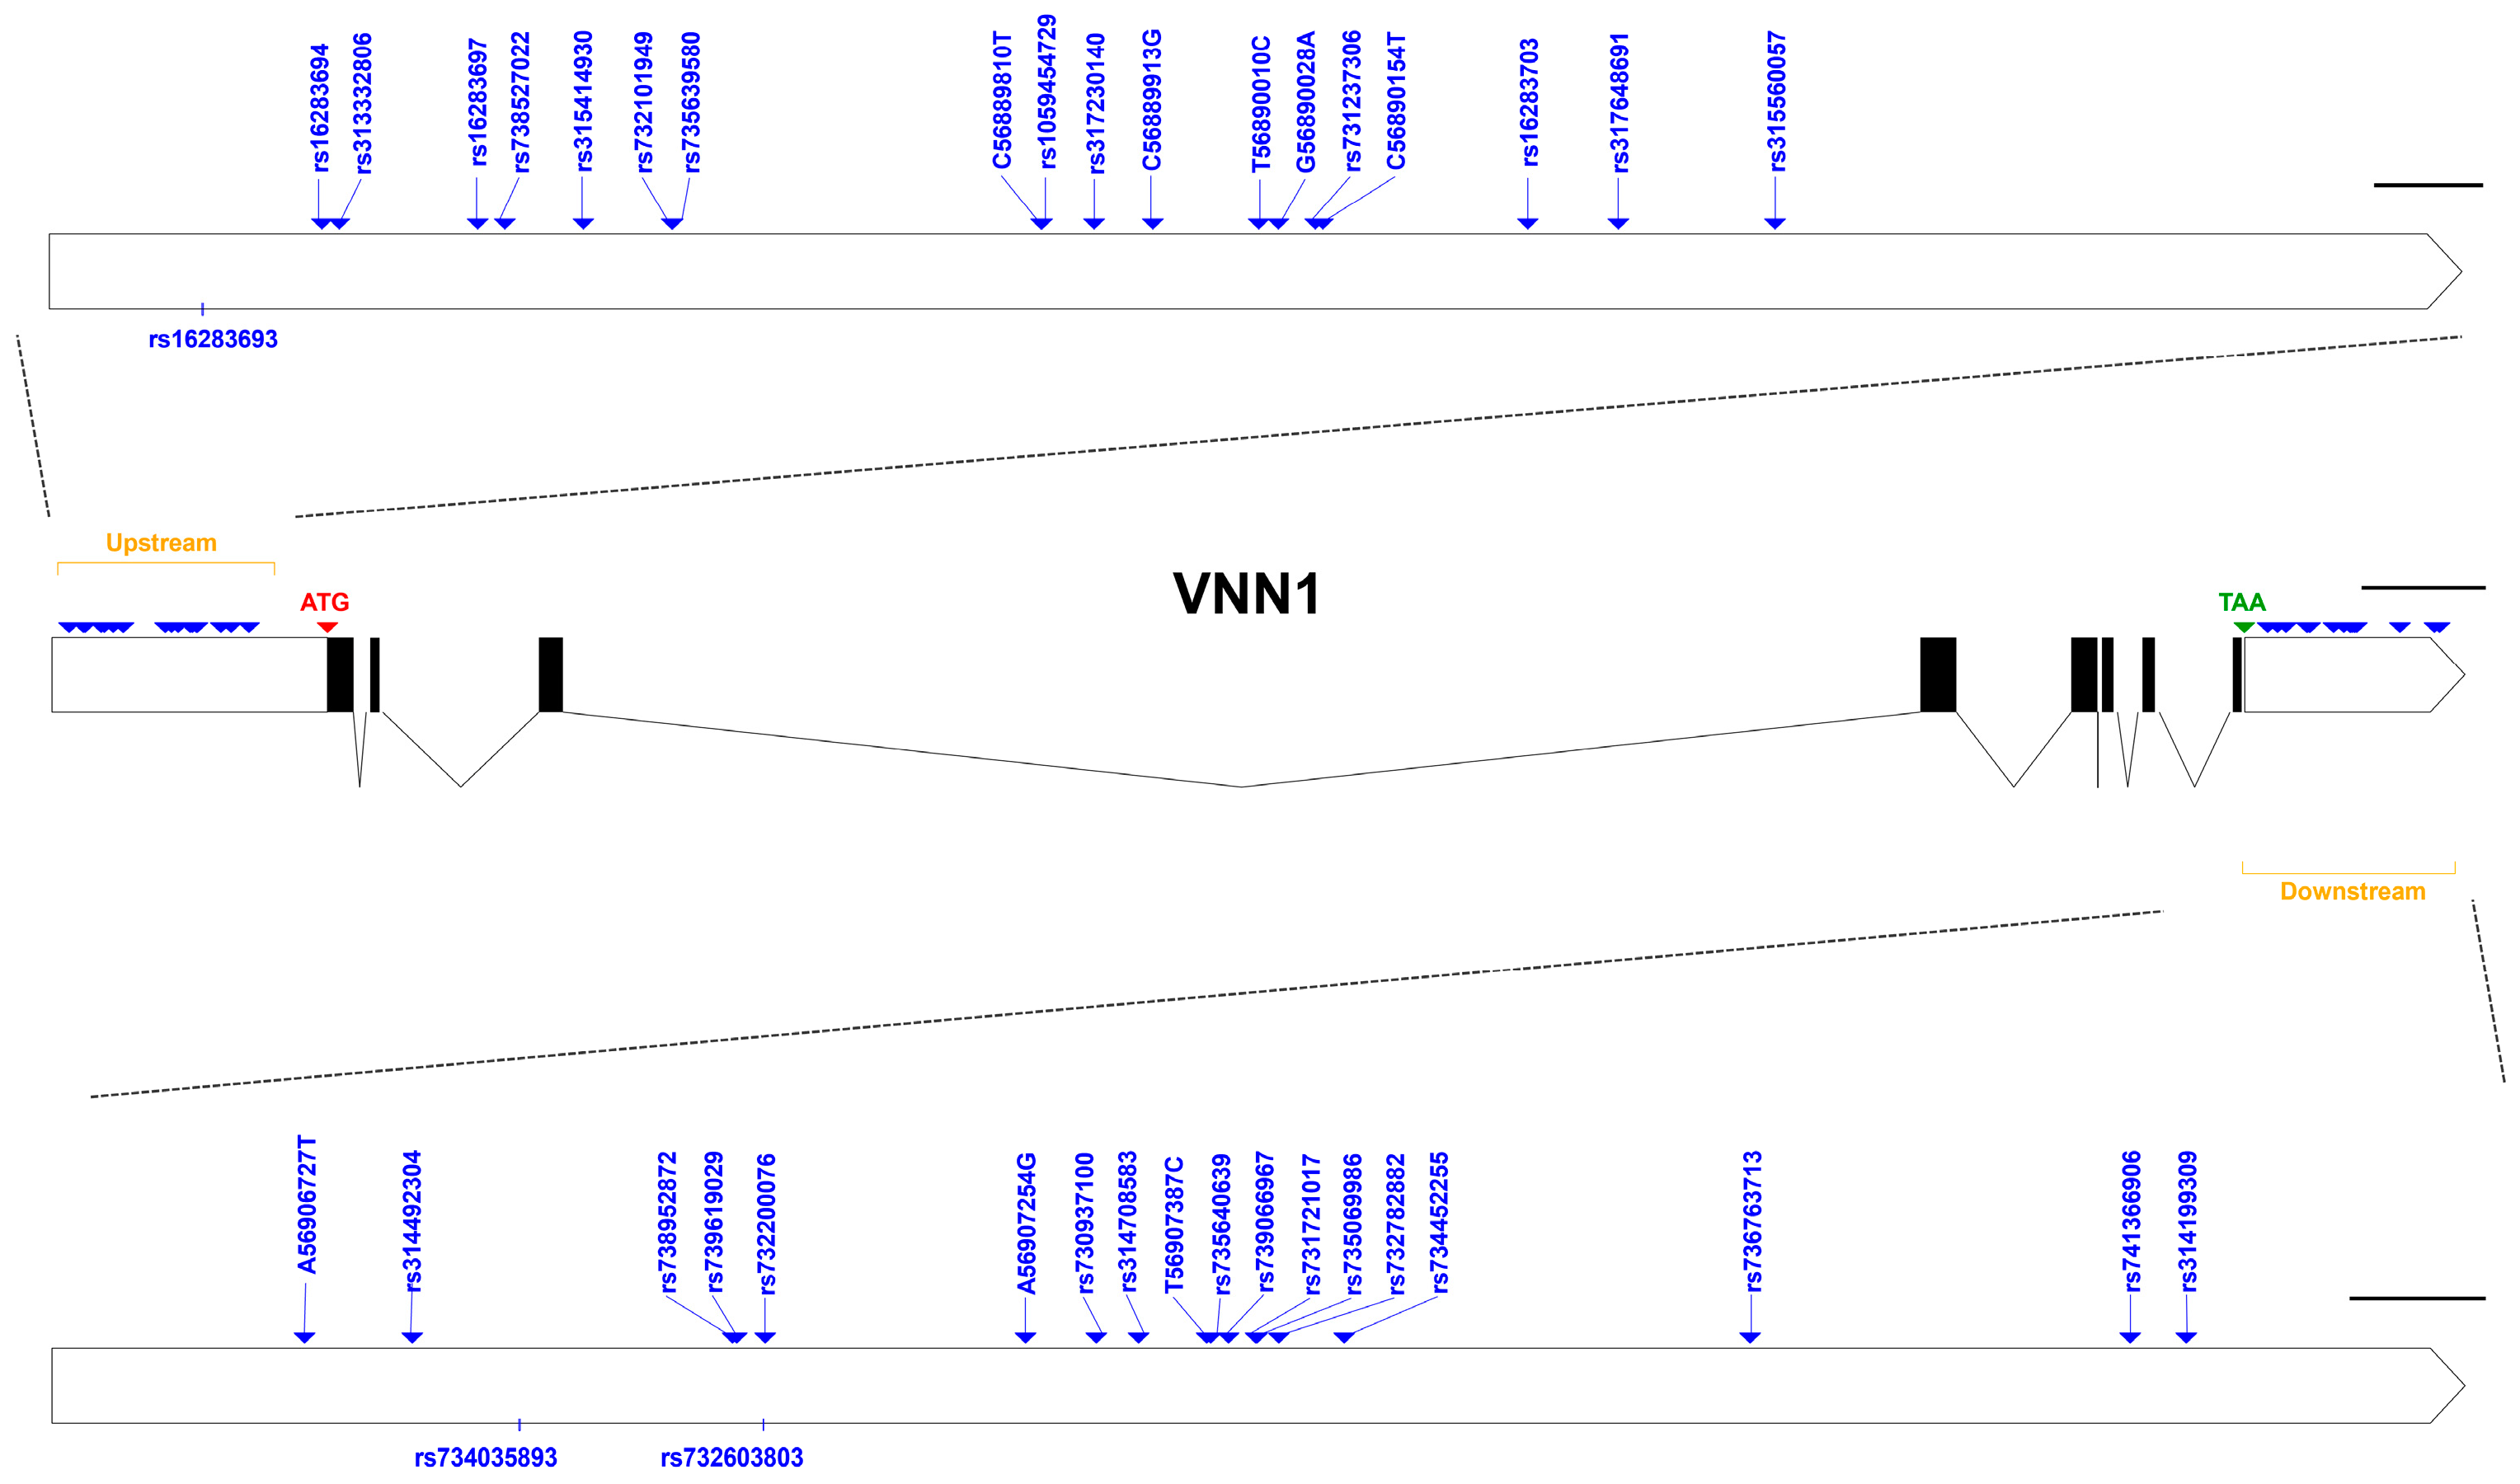
3.3. Information on SNPs
3.4. Association of SNPs with Carcass Traits and Haplotype Reconstruction
3.5. Association of Haplotypes with Carcass Traits
4. Discussion
5. Conclusions
Supplementary Materials
Author Contributions
Funding
Institutional Review Board Statement
Informed Consent Statement
Data Availability Statement
Conflicts of Interest
References
- Zheng, M.; Wen, J. Current Status of Broiler Breeding Industry Development. Chin. Livest. Pout. Breed. 2023, 19, 182–189. [Google Scholar]
- Pan, R.; Qi, L.; Xu, Z.; Zhang, D.; Nie, Q.; Zhang, X.; Luo, W. Weighted Single-Step GWAS Identified Candidate Genes Associated with Carcass Traits in a Chinese Yellow-Feathered Chicken Population. Poult. Sci. 2024, 103, 103341. [Google Scholar] [CrossRef]
- Huang, S.; He, Y.; Ye, S.; Wang, J.; Yuan, X.; Zhang, H.; Li, J.; Zhang, X.; Zhang, Z. Genome-Wide Association Study on Chicken Carcass Traits Using Sequence Data Imputed from SNP Array. J. Appl. Genet. 2018, 59, 335–344. [Google Scholar] [CrossRef]
- Allais, S.; Hennequet-Antier, C.; Berri, C.; Salles, L.; Demeure, O.; Le Bihan-Duval, E. Mapping of QTL for Chicken Body Weight, Carcass Composition, and Meat Quality Traits in a Slow-Growing Line. Poult. Sci. 2019, 98, 1960–1967. [Google Scholar] [CrossRef] [PubMed]
- Liu, J.; Zhou, J.; Li, J.; Bao, H. Identification of Candidate Genes Associated with Slaughter Traits in F2 Chicken Population Using Genome-Wide Association Study. Anim. Genet. 2021, 52, 532–535. [Google Scholar] [CrossRef]
- Zhang, H.; Shen, L.-Y.; Xu, Z.-C.; Kramer, L.M.; Yu, J.-Q.; Zhang, X.-Y.; Na, W.; Yang, L.-L.; Cao, Z.-P.; Luan, P.; et al. Haplotype-Based Genome-Wide Association Studies for Carcass and Growth Traits in Chicken. Poult. Sci. 2020, 99, 2349–2361. [Google Scholar] [CrossRef] [PubMed]
- Helal, M.M.; El-Gendy, E.A. Marker-Assisted Selection for Improving Body Weight in Local Chickens in Egypt. J. Agric. Sci. 2023, 161, 135–147. [Google Scholar] [CrossRef]
- Rui, L. Energy Metabolism in the Liver. Compr. Physiol. 2014, 4, 177–197. [Google Scholar] [CrossRef]
- Li, Y.; Wang, X.; Yu, J.; Shao, F.; Zhang, Y.; Lu, X.; Gu, Z. MiR-122 Targets the Vanin 1 Gene to Regulate Its Expression in Chickens. Poult. Sci. 2016, 95, 1145–1150. [Google Scholar] [CrossRef]
- van Diepen, J.A.; Jansen, P.A.; Ballak, D.B.; Hijmans, A.; Hooiveld, G.J.; Rommelaere, S.; Galland, F.; Naquet, P.; Rutjes, F.P.J.T.; Mensink, R.P.; et al. PPAR-Alpha Dependent Regulation of Vanin-1 Mediates Hepatic Lipid Metabolism. J. Hepatol. 2014, 61, 366–372. [Google Scholar] [CrossRef]
- Chen, S.; Zhang, W.; Tang, C.; Tang, X.; Liu, L.; Liu, C. Vanin-1 Is a Key Activator for Hepatic Gluconeogenesis. Diabetes 2014, 63, 2073–2085. [Google Scholar] [CrossRef] [PubMed]
- Gu, Z.; Li, J.; Yu, J.; Wang, Z.; Xu, L.; Yao, W. PSIV-19 Identification of VNN1-Regulated Genes Involved in Lipid Metabolism in Chicken Hepatocytes. J. Anim. Sci. 2018, 96, 131–132. [Google Scholar] [CrossRef]
- Wang, Z.; Yu, J.; Hua, N.; Li, J.; Xu, L.; Yao, W.; Gu, Z. Regulation of Chicken Vanin1 Gene Expression by Peroxisome Proliferators Activated Receptor α and miRNA-181a-5p. Anim. Biosci. 2021, 34, 172–184. [Google Scholar] [CrossRef] [PubMed]
- Xu, L.; Wang, Z.; Liu, S.; Wei, Z.; Yu, J.; Li, J.; Li, J.; Yao, W.; Gu, Z. CRISPR/Cas9-Mediated Knockout of the Vanin-1 Gene in the Leghorn Male Hepatoma Cell Line and Its Effects on Lipid Metabolism. Anim. Biosci. 2024, 37, 437–450. [Google Scholar] [CrossRef] [PubMed]
- Wegner, R.-M. Experience with the Get-Away Cage System. World’s Poult. Sci. J. 1990, 46, 41–47. [Google Scholar] [CrossRef]
- Yang, X.; Xian, Y.; Li, Z.; Wang, Z.; Nie, Q. G0S2 Gene Polymorphism and Its Relationship with Carcass Traits in Chicken. Animals 2022, 12, 916. [Google Scholar] [CrossRef] [PubMed]
- Livak, K.J.; Schmittgen, T.D. Analysis of Relative Gene Expression Data Using Real-Time Quantitative PCR and the 2−ΔΔCT Method. Methods 2001, 25, 402–408. [Google Scholar] [CrossRef]
- Purcell, S.; Neale, B.; Todd-Brown, K.; Thomas, L.; Ferreira, M.A.R.; Bender, D.; Maller, J.; Sklar, P.; de Bakker, P.I.W.; Daly, M.J.; et al. PLINK: A Tool Set for Whole-Genome Association and Population-Based Linkage Analyses. Am. J. Hum. Genet. 2007, 81, 559–575. [Google Scholar] [CrossRef]
- Chang, C.C.; Chow, C.C.; Tellier, L.C.; Vattikuti, S.; Purcell, S.M.; Lee, J.J. Second-Generation PLINK: Rising to the Challenge of Larger and Richer Datasets. GigaScience 2015, 4, s13742-015. [Google Scholar] [CrossRef]
- Botstein, D.; White, R.L.; Skolnick, M.; Davis, R.W. Construction of a Genetic Linkage Map in Man Using Restriction Fragment Length Polymorphisms. Am. J. Hum. Genet. 1980, 32, 314–331. [Google Scholar]
- Perdry, H.; Dandine-Roulland, C.; Banddyopadhyay, D.; Kettner, L. Gaston: Genetic Data Handling (QC, GRM, LD, PCA) & Linear Mixed Models. R Package 2018, 83, 1–29. [Google Scholar]
- El-Attrouny, M.M.; Iraqi, M.M.; Sabike, I.I.; Abdelatty, A.M.; Moustafa, M.M.; Badr, O.A. Comparative Evaluation of Growth Performance, Carcass Characteristics and Timed Series Gene Expression Profile of GH and IGF-1 in Two Egyptian Indigenous Chicken Breeds versus Rhode Island Red. J. Anim. Breed. Genet. 2021, 138, 463–473. [Google Scholar] [CrossRef] [PubMed]
- Cao, H.; Dong, X.; Mao, H.; Xu, N.; Yin, Z. Expression Analysis of the PITX2 Gene and Associations between Its Polymorphisms and Body Size and Carcass Traits in Chickens. Animals 2019, 9, 1001. [Google Scholar] [CrossRef] [PubMed]
- Deng, K.P.; Fan, Y.X.; Ma, T.W.; Wang, Z.; Tan Tai, W.J.; Nie, H.T.; Guo, Y.X.; Yu, X.Q.; Sun, L.W.; Wang, F. Carcass Traits, Meat Quality, Antioxidant Status and Antioxidant Gene Expression in Muscle and Liver of Hu Lambs Fed Perilla Seed. J. Anim. Physiol. Anim. Nutri. 2018, 102, e828–e837. [Google Scholar] [CrossRef] [PubMed]
- Liu, L.X.; Dou, T.F.; Li, Q.H.; Rong, H.; Tong, H.Q.; Xu, Z.Q.; Huang, Y.; Gu, D.H.; Chen, X.B.; Ge, C.R.; et al. Myostatin mRNA Expression and Its Association with Body Weight and Carcass Traits in Yunnan Wuding Chicken. Genet. Mol. Res. 2016, 15, gmr15048967. [Google Scholar] [CrossRef] [PubMed]
- Xu, H.-Y.; Wang, Y.; Liu, Y.-P.; Wang, J.; Zhu, Q. Polymorphisms and Expression of the Chicken POU1F1 Gene Associated with Carcass Traits. Mol. Biol. Rep. 2012, 39, 8363–8371. [Google Scholar] [CrossRef] [PubMed]
- Wang, Q.; Li, H.; Li, N.; Leng, L.; Wang, Y. Tissue Expression and Association with Fatness Traits of Liver Fatty Acid-Binding Protein Gene in Chicken. Poult. Sci. 2006, 85, 1890–1895. [Google Scholar] [CrossRef]
- Mayr, C. Regulation by 3’-Untranslated Regions. Annu. Rev. Genet. 2017, 51, 171–194. [Google Scholar] [CrossRef] [PubMed]
- Leppek, K.; Das, R.; Barna, M. Functional 5′ UTR mRNA Structures in Eukaryotic Translation Regulation and How to Find Them. Nat. Rev. Mol. Cell Biol. 2018, 19, 158–174. [Google Scholar] [CrossRef]
- Zhang, H.; Wang, Y.; Lu, J. Function and Evolution of Upstream ORFs in Eukaryotes. Trends Biochem. Sci. 2019, 44, 782–794. [Google Scholar] [CrossRef]
- Cui, H.X.; Yang, S.Y.; Wang, H.Y.; Zhao, J.P.; Jiang, R.R.; Zhao, G.P.; Chen, J.L.; Zheng, M.Q.; Li, X.H.; Wen, J. The Effect of a Mutation in the 3-UTR Region of the HMGCR Gene on Cholesterol in Beijing-You Chickens. Anim. Biotechnol. 2010, 21, 241–251. [Google Scholar] [CrossRef] [PubMed]
- Cui, Z.; Shen, X.; Zhang, X.; Li, F.; Amevor, F.K.; Zhu, Q.; Wang, Y.; Li, D.; Shu, G.; Tian, Y.; et al. A Functional Polymorphism of Inhibin Alpha Subunit at miR-181b-1-3p-Binding Site Regulates Proliferation and Apoptosis of Chicken Ovarian Granular Cells. Cell Tissue Res. 2021, 384, 545–560. [Google Scholar] [CrossRef] [PubMed]
- Gunnarsson, U.; Kerje, S.; Bed’hom, B.; Sahlqvist, A.-S.; Ekwall, O.; Tixier-Boichard, M.; Kämpe, O.; Andersson, L. The Dark Brown Plumage Color in Chickens Is Caused by an 8.3-Kb Deletion Upstream of SOX10. Pigment Cell Melanoma Res. 2011, 24, 268–274. [Google Scholar] [CrossRef] [PubMed]
- Zhang, G.; Dai, G.; Wang, J.; Wei, Y.; Ding, F.; Li, Z.; Zhao, X.; Xie, K.; Wang, W. Polymorphisms in 5’-Upstream Region of the Myostatin Gene in Four Chicken Breeds and Its Relationship with Growth Traits in the Bian Chicken. Afr. J. Biotechnol. 2012, 11, 9677–9682. [Google Scholar] [CrossRef]
- Zhang, Z.; Zhong, H.; Lin, S.; Liang, L.; Ye, S.; Xu, Z.; Ji, C.; Zhang, Z.; Zhang, D.; Zhang, X. Polymorphisms of AMY1A Gene and Their Association with Growth, Carcass Traits and Feed Intake Efficiency in Chickens. Genomics 2021, 113, 583–594. [Google Scholar] [CrossRef]


| Nutrient | 1–6 Weeks | 7–13 Weeks |
|---|---|---|
| Energy Metabolism (kcal/kg) | 2870 | 2760 |
| Crude protein (%) | 17.4 | 15.6 |
| Calcium (%) | 1.02 | 1.10 |
| Phosphorus (%) | 0.55 | 0.60 |
| Lysine (%) | 1.0 | 0.8 |
| Methionine (%) | 0.46 | 0.38 |
| Sodium chloride (%) | 0.43 | 0.44 |
| Primer Name | Sequence (5′-3′) | Purpose | Length (bp) |
|---|---|---|---|
| VNN1-SNP5 | F: GGAGGCTACTTGATCTTCCTGG | Amplification | 1746 |
| R: CTCCCCAGTTTACCCTCCCTA | |||
| VNN1-SNP5-S | F: GTAAGTAATCATGTAAAT | Sequencing | - |
| VNN1-SNP3 | F: CCCTGCGAAGCTTCCTGTAA | Amplification | 1712 |
| R: GCTGCTCTCAGCTGCTCTTA | |||
| VNN1-SNP3-S | F: TTGGGACTCCTAGTGAAG | Sequencing | - |
| VNN1 | F: CTGCACCGATCCCACAAGAT | qPCR | 146 |
| R: GACCATCACTGGGGCACTTG | |||
| GAPDH | F: AGAACATCATCCCAGCGT | qPCR | 182 |
| R: AGCCTTCACTACCCTCTTG |
| Trait | Mean ± SD | Maximum | Minimum | |||
|---|---|---|---|---|---|---|
| Female | Male | Female | Male | Female | Male | |
| LW | 1679.97 ± 75.16 a | 2217.08 ± 120.63 b | 1890.00 | 2430.00 | 1350.00 | 1570.00 |
| DW | 1484.26 ± 72.47 a | 1989.84 ± 108.28 b | 1699.00 | 2196.00 | 1202.00 | 1421.00 |
| DWP | 88.34 ± 1.22 a | 89.76 ± 1.36 b | 91.74 | 93.66 | 84.34 | 86.13 |
| EW | 1355.71 ± 71.89 a | 1828.76 ± 102.16 b | 1562.00 | 1995.00 | 1099.00 | 1309.00 |
| EWP | 80.68 ± 1.72 a | 82.49 ± 1.38 b | 84.48 | 87.00 | 74.91 | 78.41 |
| EWG | 1131.84 ± 64.02 a | 1520.7 ± 93.35 b | 1320.00 | 1681.00 | 880.00 | 1040.00 |
| EWGP | 67.36 ± 1.74 a | 72.23 ± 4.28 b | 71.99 | 79.63 | 62.55 | 64.90 |
| BMW | 178.74 ± 17.75 a | 233.553 ± 26.21 b | 242.49 | 318.00 | 110.00 | 141.26 |
| BMWP | 15.79 ± 1.23 a | 15.34 ± 1.24 b | 19.99 | 19.18 | 10.62 | 11.84 |
| TW | 398.72 ± 26.28 a | 556.99 ± 37.33 b | 485.34 | 625.65 | 307.00 | 390.8 |
| TWP | 35.23 ± 1.23 a | 36.63 ± 1.01 b | 40.18 | 38.69 | 31.45 | 34.46 |
| WW | 148.21 ± 11.6 a | 203.51 ± 12.18 b | 178.41 | 228.23 | 118.00 | 162.01 |
| WWP | 13.1 ± 0.82 a | 13.4 ± 0.71 b | 15.12 | 15.58 | 10.73 | 11.86 |
| AFW | 35.38 ± 11.79 a | 30.84 ± 13.36 b | 76.16 | 83.00 | 4.00 | 5.29 |
| AFWP | 3.02 ± 0.96 a | 1.98 ± 0.83 b | 6.39 | 5.20 | 0.36 | 0.33 |
| SNP Name | Chr: bp 1 | Alleles 2 | Class 3 | Conseq.Type 4 |
|---|---|---|---|---|
| rs16283693 | 3:56889037 | A/- | deletion | upstream gene variant |
| rs16283694 | 3:56889150 | A/G | SNP | upstream gene variant |
| rs313332806 | 3:56889166 | A/C | SNP | upstream gene variant |
| rs16283697 | 3:56889293 | A/G | SNP | upstream gene variant |
| rs738527022 | 3:56889318 | A/G | SNP | upstream gene variant |
| rs315414930 | 3:56889390 | C/T | SNP | upstream gene variant |
| rs732101949 | 3:56889471 | A/C | SNP | upstream gene variant |
| rs735639580 | 3:56889472 | A/G | SNP | upstream gene variant |
| C56889810T | 3:56889810 | C/T | SNP | upstream gene variant |
| rs1059454729 | 3:56889811 | G/A | SNP | upstream gene variant |
| rs317230140 | 3:56889859 | G/A | SNP | upstream gene variant |
| C56889913G | 3:56889913 | C/G | SNP | upstream gene variant |
| T56890010C | 3:56890010 | T/C | SNP | upstream gene variant |
| G56890028A | 3:56890028 | G/A | SNP | upstream gene variant |
| rs731237306 | 3:56890062 | A/G | SNP | upstream gene variant |
| C56890154T | 3:56890154 | C/T | SNP | upstream gene variant |
| rs16283703 | 3:56890257 | T/G | SNP | upstream gene variant |
| rs317648691 | 3:56890340 | C/A | SNP | upstream gene variant |
| rs315560057 | 3:56890484 | A/G | SNP | upstream gene variant |
| A56906727T | 3:56906727 | A/T | SNP | 3 prime UTR variant |
| rs314492304 | 3:56906806 | T/A | SNP | 3 prime UTR variant |
| rs734035893 | 3:56906872-56906873 | -/C | insertion | 3 prime UTR variant |
| rs738952872 | 3:56907040 | G/A | SNP | 3 prime UTR variant |
| rs739619029 | 3:56907043 | T/A | SNP | 3 prime UTR variant |
| rs732603803 | 3:56907060-56907061 | -/C | insertion | 3 prime UTR variant |
| rs732200076 | 3:56907063 | G/A | SNP | 3 prime UTR variant |
| A56907254G | 3:56907254 | A/G | SNP | 3 prime UTR variant |
| rs730937100 | 3:56907306 | C/A | SNP | 3 prime UTR variant |
| rs314708583 | 3:56907337 | G/A | SNP | 3 prime UTR variant |
| T56907387C | 3:56907387 | T/C | SNP | 3 prime UTR variant |
| rs735640639 | 3:56907390 | G/C | SNP | 3 prime UTR variant |
| rs739066967 | 3:56907403 | A/T | SNP | 3 prime UTR variant |
| rs731721017 | 3:56907423 | C/T | SNP | 3 prime UTR variant |
| rs735069986 | 3:56907424 | G/A | SNP | 3 prime UTR variant |
| rs732782882 | 3:56907440 | T/C | SNP | 3 prime UTR variant |
| rs734452255 | 3:56907488 | T/C | SNP | 3 prime UTR variant |
| rs736763713 | 3:56907786 | G/A | SNP | 3 prime UTR variant |
| rs741366906 | 3:56908065 | A/C | SNP | 3 prime UTR variant |
| rs314199309 | 3:56908106 | G/A | SNP | 3 prime UTR variant |
| SNP Name | N | Genotype Frequency | Allelic Frequency | Ho | He | p Value | PIC | ||
|---|---|---|---|---|---|---|---|---|---|
| rs16283693 | 424 | AA(0.002) | A-(0.087) | --(0.910) | A(0.046) | 0.087 | 0.088 | 0.600 | 0.151 |
| rs16283694 | 424 | AA(0.007) | AG(0.215) | GG(0.778) | A(0.114) | 0.215 | 0.203 | 0.335 | 0.292 |
| rs313332806 | 424 | AA(0.002) | AC(0.085) | CC(0.913) | A(0.045) | 0.085 | 0.086 | 0.580 | 0.148 |
| rs16283697 | 424 | AA(0.033) | AG(0.292) | GG(0.675) | G(0.179) | 0.293 | 0.294 | 0.869 | 0.379 |
| rs738527022 | 420 | AA(0.052) | AG(0.364) | GG(0.583) | A(0.235) | 0.364 | 0.359 | 0.892 | 0.431 |
| rs315414930 | 389 | CC(0.041) | CT(0.316) | TT(0.643) | C(0.199) | 0.316 | 0.319 | 0.874 | 0.401 |
| rs732101949 | 389 | AA(0.039) | AC(0.324) | CC(0.638) | A(0.201) | 0.324 | 0.321 | 1.000 | 0.400 |
| rs735639580 | 389 | AA(0.039) | AG(0.321) | GG(0.64) | A(0.199) | 0.321 | 0.319 | 1.000 | 0.399 |
| C56889810T | 424 | CC(0.005) | CT(0.134) | TT(0.861) | C(0.072) | 0.134 | 0.134 | 1.000 | 0.214 |
| rs1059454729 | 424 | GG(0.002) | GA(0.134) | AA(0.863) | A(0.070) | 0.134 | 0.130 | 0.710 | 0.210 |
| rs317230140 | 426 | GG(0.049) | GA(0.343) | AA(0.608) | G(0.221) | 0.343 | 0.344 | 1.000 | 0.421 |
| C56889913G | 425 | CC(0.014) | CG(0.202) | GG(0.784) | G(0.115) | 0.202 | 0.204 | 0.812 | 0.294 |
| T56890010C | 425 | TT(0.014) | TC(0.198) | CC(0.788) | C(0.113) | 0.198 | 0.200 | 0.807 | 0.291 |
| G56890028A | 425 | GG(0.005) | GA(0.096) | AA(0.899) | A(0.053) | 0.096 | 0.100 | 0.328 | 0.168 |
| rs731237306 | 425 | AA(0.014) | AG(0.191) | GG(0.795) | G(0.109) | 0.191 | 0.195 | 0.618 | 0.285 |
| C56890154T | 425 | CC(0.012) | CT(0.188) | TT(0.800) | T(0.106) | 0.188 | 0.189 | 0.800 | 0.279 |
| rs16283703 | 425 | TT(0.068) | TG(0.442) | GG(0.489) | G(0.289) | 0.442 | 0.411 | 0.156 | 0.462 |
| rs317648691 | 425 | CC(0.054) | CA(0.365) | AA(0.581) | C(0.237) | 0.365 | 0.361 | 0.894 | 0.434 |
| rs315560057 | 425 | AA(0.054) | AG(0.365) | GG(0.581) | A(0.237) | 0.365 | 0.361 | 0.894 | 0.434 |
| A56906727T | 393 | AA(0.018) | AT(0.023) | TT(0.959) | T(0.029) | 0.023 | 0.057 | 6.01 × 10⁻¹⁰ | 0.077 |
| rs314492304 | 393 | TT(0.214) | TA(0.188) | AA(0.598) | T(0.308) | 0.188 | 0.426 | 8.19 × 10⁻²⁸ | 0.500 |
| rs734035893 | 393 | --(0.135) | -C(0.036) | CC(0.83) | C(0.153) | 0.036 | 0.259 | 2.58 × 10−50 | 0.266 |
| rs738952872 | 393 | GG(0.015) | GA(0.018) | AA(0.967) | A(0.024) | 0.018 | 0.047 | 2.27 × 10−09 | 0.064 |
| rs739619029 | 393 | TT(0.015) | TA(0.018) | AA(0.967) | A(0.024) | 0.018 | 0.047 | 2.27 × 10−09 | 0.064 |
| rs732603803 | 393 | --(0.018) | -C(0.01) | CC(0.972) | C(0.023) | 0.010 | 0.045 | 2.36 × 10⁻¹² | 0.054 |
| rs732200076 | 393 | GG(0.018) | GA(0.01) | AA(0.972) | A(0.023) | 0.010 | 0.045 | 2.36 × 10⁻¹² | 0.054 |
| A56907254G | 393 | AA(0.104) | AG(0.015) | GG(0.88) | G(0.112) | 0.015 | 0.199 | 6.11 × 10−49 | 0.197 |
| rs730937100 | 393 | CC(0.02) | CA(0.056) | AA(0.924) | A(0.048) | 0.056 | 0.092 | 2.56 × 10−07 | 0.137 |
| rs314708583 | 393 | GG(0.033) | GA(0.056) | AA(0.911) | A(0.061) | 0.056 | 0.115 | 4.61 × 10⁻¹² | 0.159 |
| T56907387C | 393 | TT(0.135) | TC(0.003) | CC(0.863) | C(0.136) | 0.003 | 0.235 | 4.71 × 10−66 | 0.211 |
| rs735640639 | 393 | GG(0.033) | GC(0.048) | CC(0.919) | C(0.057) | 0.048 | 0.108 | 4.43 × 10⁻¹³ | 0.147 |
| rs739066967 | 393 | AA(0.038) | AT(0.053) | TT(0.908) | T(0.065) | 0.053 | 0.121 | 2.68 × 10⁻¹⁴ | 0.163 |
| rs731721017 | 393 | CC(0.02) | CT(0.053) | TT(0.926) | T(0.047) | 0.053 | 0.090 | 1.52 × 10−07 | 0.133 |
| rs735069986 | 392 | GG(0.112) | GA(0.013) | AA(0.875) | A(0.119) | 0.013 | 0.209 | 1.18 × 10−52 | 0.202 |
| rs732782882 | 393 | TT(0.02) | TC(0.053) | CC(0.926) | C(0.047) | 0.053 | 0.090 | 1.52 × 10−07 | 0.133 |
| rs734452255 | 385 | TT(0.26) | TC(0.179) | CC(0.561) | T(0.349) | 0.179 | 0.455 | 5.46 × 10⁻³³ | 0.519 |
| rs736763713 | 385 | GG(0.075) | GA(0.179) | AA(0.745) | A(0.165) | 0.179 | 0.276 | 6.67 × 10⁻¹⁰ | 0.415 |
| rs741366906 | 385 | AA(0.068) | AC(0.049) | CC(0.883) | C(0.092) | 0.049 | 0.167 | 4.48 × 10⁻²⁵ | 0.398 |
| rs314199309 | 385 | GG(0.075) | GA(0.036) | AA(0.888) | A(0.094) | 0.036 | 0.170 | 7.83 × 10⁻³¹ | 0.193 |
| LD Block 1 | SNP 2 | Haplotype 3 | Diplotype 4 |
|---|---|---|---|
| BLOCK1 | rs16283693 rs313332806 | H1: -C(0.952) H2: AA(0.042) | H1H1(0.908) H1H2(0.085) |
| BLOCK2 | rs738527022 rs315414930 rs732101949 rs735639580 rs317230140 rs317648691 rs315560057 | H1: GTCGAAG(0.790) H2: ACAAGCA(0.177) H3: ACAAACA(0.016) | H1H1(0.618) H1H2(0.278) H2H2(0.036) H1H3(0.026) |
| BLOCK3 | rs730937100 rs314708583 rs735640639 rs739066967 rs731721017 rs732782882 | H1: CGGACT(0.925) H2: AACTTC(0.041) H3: CAGTCT(0.014) | H1H1(0.901) H1H2(0.043) H2H2(0.018) H3H3(0.013) |
| Traits 1 | BLOCK2 2 | p Value 3 | |||
|---|---|---|---|---|---|
| H1H1 | H1H2 | H1H3 | H2H2 | ||
| EW | 1455.26 ± 211.68 a | 1465.44 ± 212.41 a | 1411 ± 176.44 a | 1451.23 ± 203.85 a | 0.0300 |
| EWP | 80.02 ± 1.88 a | 81.25 ± 1.84 a | 81.06 ± 1.39 a | 80.45 ± 1.81 a | 0.0086 |
| EWGP | 68.28 ± 3.25 a | 68.79 ± 3.31 a | 68.37 ± 3.20 a | 67.35 ± 2.72 a | 0.0286 |
| TW | 432.43 ± 70.43 a | 433.81 ± 74.14 a | 420.41 ± 65.31 a | 426.15 ± 68.1 a | 0.0103 |
| TWP | 35.61 ± 1.25 a | 35.32 ± 1.42 a | 35.63 ± 1.54 a | 35.27 ± 1.41 a | 2.88 × 10⁻⁴ |
| Traits 1 | BLOCK3 2 | p Value 3 | |||
|---|---|---|---|---|---|
| H1H1 | H1H2 | H2H2 | H3H3 | ||
| EW | 1421.95 ± 181.59 a | 1464.29 ± 201.26 a | 1533.5 ± 287.7 a | 1331 ± 26.25 a | 4.24 × 10⁻⁶ |
| EWP | 80.89 ± 1.80 a | 81.47 ± 1.25 a | 81.74 ± 1.58 a | 80.2 ± 1.15 a | 2.14 × 10⁻⁶ |
| EWG | 1186.09 ± 151.01 a | 1216.94 ± 169.15 a | 1277.67 ± 239.74 a | 1113.6 ± 27.08 a | 6.02 × 10⁻⁶ |
| EWGP | 67.93 ± 2.74 a | 68.8 ± 3.48 a | 68.11 ± 1.46 a | 67.1 ± 1.47 a | 1.62 × 10⁻⁶ |
| BMW | 186.1 ± 26.85 a | 191.46 ± 28.28 a | 193.2 ± 38.67 a | 179.01 ± 10.21 a | 0.0007 |
| BMWP | 15.7 ± 1.26 a | 15.75 ± 1.2 a | 15.18 ± 2.00 a | 16.07 ± 0.80 a | 0.0014 |
| TW | 420.89 ± 61.61 a | 436.99 ± 70.89 a | 457.14 ± 107.21 a | 390.78 ± 10.53 a | 3.09 × 10⁻⁵ |
| TWP | 35.43 ± 1.31 a | 35.83 ± 1.31 a | 35.56 ± 1.96 a | 35.11 ± 1.23 a | 4.43 × 10⁻⁶ |
| WW | 155.97 ± 22.91 a | 163.31 ± 25.20 a | 168.15 ± 28.16 a | 146.32 ± 6.41 a | 2.23 × 10⁻⁴ |
| WWP | 13.14 ± 0.91 a | 13.42 ± 0.93 a | 13.20 ± 0.34 a | 13.15 ± 0.67 a | 0.0021 |
Disclaimer/Publisher’s Note: The statements, opinions and data contained in all publications are solely those of the individual author(s) and contributor(s) and not of MDPI and/or the editor(s). MDPI and/or the editor(s) disclaim responsibility for any injury to people or property resulting from any ideas, methods, instructions or products referred to in the content. |
© 2024 by the authors. Licensee MDPI, Basel, Switzerland. This article is an open access article distributed under the terms and conditions of the Creative Commons Attribution (CC BY) license (https://creativecommons.org/licenses/by/4.0/).
Share and Cite
Zhang, S.; Fang, X.; Wu, R.; Nie, Q.; Li, Z. VNN1 Gene Expression and Polymorphisms Associated with Chicken Carcass Traits. Animals 2024, 14, 1888. https://doi.org/10.3390/ani14131888
Zhang S, Fang X, Wu R, Nie Q, Li Z. VNN1 Gene Expression and Polymorphisms Associated with Chicken Carcass Traits. Animals. 2024; 14(13):1888. https://doi.org/10.3390/ani14131888
Chicago/Turabian StyleZhang, Siyu, Xiang Fang, Ruiquan Wu, Qinghua Nie, and Zhenhui Li. 2024. "VNN1 Gene Expression and Polymorphisms Associated with Chicken Carcass Traits" Animals 14, no. 13: 1888. https://doi.org/10.3390/ani14131888
APA StyleZhang, S., Fang, X., Wu, R., Nie, Q., & Li, Z. (2024). VNN1 Gene Expression and Polymorphisms Associated with Chicken Carcass Traits. Animals, 14(13), 1888. https://doi.org/10.3390/ani14131888