Simple Summary
Niacin, an essential vitamin in weaned pig diets, plays an important role in regulating anti-inflammatory effects and gut health. This study aimed to investigate the effects of niacin supplementation in newly weaned piglets’ diets on inflammation resistance, immunity enhancement, intestinal antioxidant status, and intestinal microbial composition. Studies have found that niacin can significantly improve immunity, antioxidant status and anti-inflammatory effects in newly weaned piglets, better relieve stress damage caused by weaning, improve colonic microbial diversity, and promote intestinal health.
Abstract
Niacin plays an important role in regulating the gut health of weaned piglets. In this study, 48 25-day-old weaned piglets (7.9 ± 0.20 kg) produced by 14 sows (3 to 4 piglets per sow) were randomly divided into 4 groups with 6 replicates in each group and 2 piglets in each replicate. Each group was fed diets supplemented with 22.5 (N1), 30 (N2), 45 (N3), and 75 (N4) mg/kg of niacin, respectively. Samples were taken at 7 and 14 d, respectively. The study shows that changes in niacin levels significantly affected the content of IgG and IgM in the serum (p < 0.05). Niacin had a significant effect on antioxidant parameters such as MDA, T-SOD, and CuZn-SOD in the jejunal mucosa of weaned piglets (p < 0.05). Moreover, significant differences were observed in the expression of cytokines such as TGF-β, TNF-α, and COX2 in the jejunal mucosa (p < 0.05). The 16S rRNA sequencing analysis showed that there were significant differences in the colonic species composition, which were also accompanied by changes in the isovaleric acid content (p < 0.05). In conclusion, an appropriate increase in niacin dose based on NRC (2012) has an important role in improving the antioxidant status of weaned piglets, alleviating intestinal inflammation in piglets, improving immunity, and regulating the structure of the microbiota.
1. Introduction
Since July 2020, China has banned antibiotics in feed. Pharmaceutical feed additives are no longer allowed. In fact, since 2000, Denmark and other EU member states have voluntarily cancelled all antibiotics in feed. The consequence of this is that within one to two weeks after a piglet is weaned, the growth performance declines rapidly, the growth rates slow down, and the incidences of diarrhea increase. In such a severe situation, finding suitable antibiotic alternatives and evaluating the interaction mechanism between the host, microbiota, and pathogens is of urgent importance.
Niacin, a water-soluble vitamin, is essential in pig diets. The daily nutritional requirement of niacin for weaned piglets weighing 7 to 11 kg is approximately 30 mg [1]. Niacin can be converted into nicotinamide in animals and then synthesized into Coenzyme I (NAD). NAD becomes Coenzyme II (NADP) after phosphorylation by ATP [2]. Both niacin and niacinamide act as vitamins to support the biosynthesis of NAD(P). NAD(P) is a specific coenzyme of many dehydrogenases in animals. It participates in carbohydrate, protein, and fat metabolism and is vital in energy metabolism [3,4,5]. Niacin has a variety of pharmacological effects when administered in super-physiological doses. First, when used to treat the corresponding deficiency, niacin causes a flushing reaction [6]. However, this reaction is not harmful to animals. Later, researchers discovered that niacin can regulate the levels of cholesterol, free fatty acids, lipoproteins(A), and triglycerides in animal plasma, and then, they developed it into a broad-spectrum lipid-modulating drug [7,8,9]. In addition, niacin has a good anti-inflammatory performance [10,11]. Recent studies have found that the pharmacological effects of niacin are mediated by the niacin receptor GPR109A/HCA2 [5,12,13]. Since niacin receptors are expressed in adipocytes, immune cells, and keratinocytes, niacin supplements can reduce the occurrence of inflammatory processes in animals through the action of niacin receptors.
Since the intestinal tracts of piglets are not yet well developed, inflammation is easily induced within two weeks after weaning [14]. However, few reports are available on dietary supplementation of niacin to relieve intestinal inflammation in weaned piglets. Therefore, in view of the good biological functions of niacin, this study aims to investigate the effects of different levels of niacin on serum biochemical parameters, antioxidant status, cytokine levels, inflammatory gene expression, and colonic microbial composition in weaned piglets.
2. Materials and Methods
All animal experiments were approved by the Ethics and Animal Welfare Committee, and the care and treatment of the animals met the standards set by the Animal Care and Utilization Committee of Hunan Normal University.
2.1. Animals
A total of 48 25-day-old weaning piglets (24 males and 24 females; Duroc × Landrace × Yorkshire) produced by 14 sows (3 to 4 piglets per sow) were randomly assigned into 1 of 4 treatments with 6 replicates per treatment and 2 pens (1 piglet per pen) per replicate for 14-day period experiment. Additional niacin content for each treatment was 22.5 (N1, control), 30 (N2), 45 (N3), and 75 (N4) mg/kg, respectively. The niacin was supplemented in the form of nicotinamide (Royal DSM NV, Shanghai, China). The basal diet was formulated to meet the nutritional recommendation for NRC (2012), and it contained 17.15 mg/kg niacin. The diet composition and nutrient composition analysis are presented in Table 1. Each piglet was placed in a separate nursery barn, with all piglets free to eat and drink during this period. The experiment was divided into two stages. On the seventh day, six piglets (three males and three females) were randomly selected from each group for tissue sampling and sacrificed peacefully (P1); the remaining piglets were sampled after euthanasia on day 14 (P2). Blood samples were collected from the anterior vena cava before slaughter. Then, 15 cm of jejunum was taken and gently cleaned with PBS buffer solution. After that, 2 cm was taken and fixed with 4% paraformaldehyde; the rest of the jejunum was used to collect the mucosa with a slide and put it in liquid nitrogen for quick freezing. Colonic stool samples were collected in a 50 mL centrifuge tube and stored at −80 °C.

Table 1.
Ingredient and chemical composition of piglet diets, as fed basis.
2.2. Serum Parameter Analysis
A biochemical analyzer (TBA120FR, Toshiba Medical Systems Corporation, Japan) was used to detect many biochemical indexes such as blood urea nitrogen (BUN), glucose (GLU), aspartate aminotransferase (AST), alanine aminotransferase (ALT), total protein (TP), immunoglobulin M (IgM), immunoglobulin A (IgA) and immunoglobulin G (IgG) in serum. The kit for this experiment was provided by Nanjing Jiancheng Biological Engineering Research Institute (Nanjing Jiancheng, Nanjing, China).
2.3. Oxidative Stress Index
The jejunal mucosa samples were homogenized with PBS buffer. The malondialdehyde (MDA), superoxide dismutase (SOD), and total antioxidant capacity (T-AOC) in the samples were detected by the kit. The detection method was provided by the manufacturer (Beyotime Biotechnology, Shanghai, China).
2.4. Detection of mRNA Expression by Real-Time RT-PCR
The total RNA of the small intestine was extracted with TRIZOL reagent (Invitrogen, Waltham, MA, USA), after which then the genomic DNA in the sample was removed by DNase I (Invitrogen, Waltham, MA, USA), and cDNA was synthesized by the Prime Script RT Reagent Kit (TAKARA, Kusatsu, Japan). After cDNA dilution, quantitative reverse transcription polymerase chain reaction (qRT-PCR) was performed, and SYBRTM Green PCR Master Mix (Thermo Fisher Scientific, Waltham, MA, USA) was used for real-time quantitative PCR on QuantStudio 5 Real-Time PCR System (Thermo Fisher Scientific, USA).
According to the conserved sequence of related genes of pigs logged by Genbank, we designed the primer with TsingKe Biological Technology Ltd. (Beijing, China) and Primer 5.0 software and synthesized it with Beijing Jingke Biotechnology Co., Ltd., Beijing, China (Table 2).
Table 2.
Primers used for real-time quantitative PCR analysis.
2.5. Cytokines
Jejunal mucosa samples were made 10% homogenate with PBS buffer, and the concentrations of TNF-α and IL-6 were detected according to the method provided by using ELISA kit (Cusabio, Wuhan, China).
2.6. Volatile Fatty Acid Detection
One gram of homogenized colon stool sample was put into a 10 mL centrifuge tube. Then, 5 mL of distilled water was added to it and mixed with the vortex for 30 s. The mixture was centrifuged for 15 min in a 4 °C centrifuge (15,000 rpm). This was followed by mixing the supernatant and 25% metaphosphoric acid solution in a ratio of 9: 1. After centrifuging overnight, it was centrifuged in a 4 °C centrifuge (15,000 rpm) for 10 min. The supernatant was filtered with a membrane having a pore diameter of 0.45 μm and transferred into the injection bottle. Colonic VFAs (acetic acid, propionic acid, isobutyric acid, butyric acid, isovaleric acid, and valeric acid) were determined by gas chromatography (Agilent Technologies 7890B GC System, Agilent, Santa Clara, CA, USA).
2.7. Gut Microbiota Sequencing
The total genomic DNA was extracted from a clean colon stool sample. The V3-V4 region of the 16S rRNA gene was amplified with specific primers. Samples were sequenced on the IonS5TMXL platform provided by Novogene (Beijing, China). Using a single-end sequencing method, a small fragment library was constructed for single-end sequencing. Through Reads shear filtering, Operational Taxonomic Units (OTUs) clustering, analysis of the annotation and the abundance of species, alpha diversity analysis, and beta diversity analysis (Beta Diversity), we chose the t-test, MetaStat, and LEfSe statistical analysis methods, such as species composition and community structure of the sample difference significance test.
2.8. Statistical Analysis
The data were tested for normal distribution and homogeneity of variance, and a one-way analysis of variance was performed on the data that met the analysis requirements. The differences among the groups were regressed through linear and quadratic terms. p < 0.05 meant significant difference among the groups; 0.05 < p < 0.1 meant there is a trend of significant difference, and p > 0.1 signified no significant difference.
3. Results
3.1. Serum Biochemical Index
As Table 3 shows, we found that the serum IgG level of the N1 group was significantly lower than that of other groups at the P1 stage (combined, p = 0.033; linear, p = 0.036; quadratic, p = 0.047). In the P2 stage, the IgG level of the N4 group was lower than that of the N1 and N2 groups (combined, p = 0.023; linear, p = 0.004; quadratic, p = 0.266). Moreover, the IgM level of the N4 group in the P2 stage was significantly higher than that in the other groups (combined, p < 0.001; linear, p < 0.004; quadratic, p = 0.051).
Table 3.
The serum biochemical parameters in weaned piglets with different niacin concentrations 1.
3.2. Oxidative Stress Index
The detection results of MDA, T-SOD, CuZn-SOD, and T-AOC in jejunal mucosa are shown in Table 4. In the P1 stage, the T-SOD content in groups N2.P1 and N4.P1 was significantly higher than that of the NI.P1 group (combined, p = 0.006; linear, p = 0.222; quadratic, p = 0.399). The level of MDA was significantly higher in the N3.P1 group than that of the N1.P1 group (combined, p = 0.130; linear, p = 0.544; quadratic, p = 0.034). In the P2 stage, the content of T-SOD in N2.P2, N3.P2, and N4.P2 groups was significantly higher than that in the N1 group (combined, p < 0.001; linear, p = 0.705; quadratic, p < 0.001). The CuZn-SOD level in the N2.P2 group was significantly higher than that in the N1.P2 group (combined, p = 0.029; linear, p = 0.416; quadratic, p = 0.038). Lastly, the level of MDA was significantly lower in the N2 group than in the other groups (combined, p = 0.002; linear, p = 0.349; quadratic, p = 0.013).
Table 4.
The oxidative stress index in jejunal mucosa of weaned piglets with different niacin concentrations 1.
3.3. Gene Expression
As Table 5 shows, the level of niacin in the diet did not affect the gene expression levels of IFN-γ and IL-1β in the jejunum (p > 0.05). At the P1 stage, TGF-β (combined, p = 0.001; linear, p = 0.030; quadratic, p = 0.008) and TNF-α (combined, p = 0.001; linear, p = 0.837; quadratic, p = 0.059) gene expression levels in the N3 group were significantly higher than those in the other groups. Compared with groups N2 and N4, the expression level of the COX2 gene in the N3 group at the P2 stage was significantly higher (combined, p = 0.018; linear, p = 0.489; quadratic, p = 0.056).
Table 5.
The mRNA expression of inflammatory cytokines in jejunal mucosa of weaned piglets with different niacin concentrations 1.
3.4. Cytokines of the Small Intestine
As Table 6 shows, the TNF-α level of the N3 group was higher than that of other treatments at the P1 stage (combined, p = 0.007; linear, p = 0.036; quadratic, p = 0.231), which was consistent with the trend of TNF-α gene expression level. No effect of dietary niacin on IL-6 concentration was observed during the whole experiment (p > 0.05).
Table 6.
The cytokines production in jejunal mucosa of weaned piglets with different niacin concentrations 1.
3.5. Microbiota and VFAs of Colon Contents
The sequence of V3-V4 regions of bacterial 16S rRNA genes from colon manure samples, produced 1904380 and 1982345 raw reads in P1 and P2 stages, respectively. OTUs were described at 97% of species similarity, and 15896 and 15085 OTUs were obtained in the samples at the P1 and P2 stages, respectively. The alpha diversity index analysis showed no significant difference (Figure 1a–f; p > 0.05). Based on the species annotation results of all samples and the OTUs abundance information, a beta diversity analysis was performed on samples based on weighted Unifrac distance. Figure 2a is drawn with a PCoA. The contribution rates of PCoA1 and PCoA2 to the total variance were 31.63% and 12.54%, respectively. Figure 2b is plotted using PCA. The contribution rates of PC1 and PC2 to the total variance were 5.94% and 4.54%, respectively.
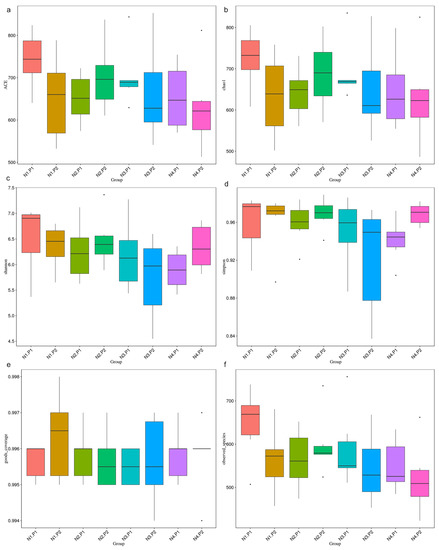
Figure 1.
Alpha diversity index analysis. (a), ACE index; (b), chao1 index; (c), Shannon index; (d), Simpson; (e), goods_coverage index; (f), observed_species. P1: the experimental period is 7 days. P2: the experimental period is 14 days. N1: 22.5 mg/kg niacin group. N2: 30 mg/kg niacin group. N3: 45 mg/kg niacin group. N4: 75 mg/kg niacin group. Black dots: abnormal value.
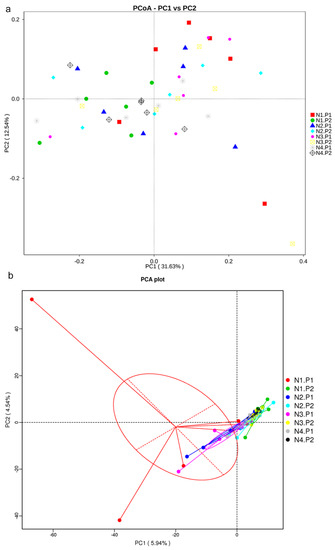
Figure 2.
Principal co-ordinates analysis (PCoA) and principal components analysis (PCA). (a), PCoA plot; (b), PCA plot. P1: The experimental period is 7 days. P2: The experimental period is 14 days. N1: 22.5 mg/kg niacin group. N2: 30 mg/kg niacin group. N3: 45 mg/kg niacin group. N4: 75 mg/kg niacin group.
The relative abundance of the sample microorganism at the phylum level is shown in Figure 3. The difference between the groups was analyzed by T-test. At the phylum level, the relative abundance of phylum_Proteobacteria in the N4.P1 group was significantly lower than that in the N1.P1 group (Figure 4a; p < 0.05). The N4.P2 group had higher relative abundance of phylum_Firmicutes than the N1.P2 group (Figure 4b; p < 0.05). Furthermore, the relative abundance of phylum_Proteobacteria was significantly increased in the N2.P2 group (Figure 4c, d; p < 0.05). Additionally, at genus level, the N1.P1 group had significantly higher relative abundance of [Eubacterium]_coprostanoligenes_group, Ruminococcus_1 and Lachnospiraceae_FCS020_group than the N4.P1 group (Figure 5a; p < 0.05). The relative abundances of Family_ⅩⅢ_AD3011_group and Oscillibacter in the N4.P1 group were significantly higher than those in the N1.P1 group (Figure 5a; p < 0.05). The relative abundance of Ruminococcace_UCG-008 in the N2.P2 group was significantly higher than that in the N1.P2 group (Figure 5b; p < 0.05). The MetaStat method was used to analyze the species abundance between the groups (Figure 6). It was also found that the relative abundance of Ruminococcus_1 in the N1.P1 group was significantly higher than that in the N4.P1 group at the genus level (Figure 6a; p < 0.05). The relative abundance of Alphaproteobacteria in the N2.P2 and N3.P2 groups was significantly higher than that in the N4.P2 group at the class level (Figure 6b; p < 0.05). The fecal microorganisms in P1 and P2 stages were analyzed by LEfSe (Figure 7), and we found that genus_Anaerovibrio and phylum_Proteobacteria were biomarkers in the N1.P1 group (p < 0.05). Family_Ruminococcaceae is a biomarker for the N4.P2 group (p < 0.05). Furthermore, the biomarkers of the N2.P2 group are class_Betaproteobacteria and phylum_Proteobacteria (p < 0.05). To better reveal the effect of niacin on the gut microbiota of weaned piglets, we specifically analyzed the changes in the content of volatile fatty acids in the colonic contents of the N1 and N4 groups. As Table 7 shows, we observed that the isovaleric acid content in the N1.P1 group was significantly lower than that in the N4.P1 group (p = 0.024).
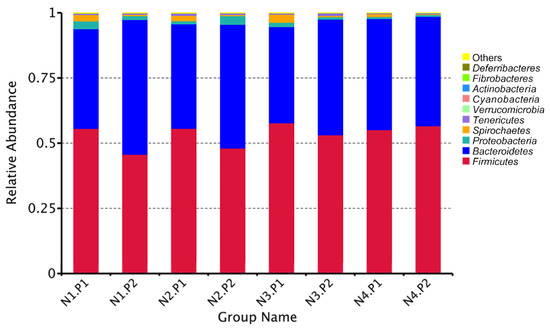
Figure 3.
Relative species abundance at phylum level in colonic contents. P1: the experimental period is 7 days. P2: the experimental period is 14 days. N1: 22.5 mg/kg niacin group. N2: 30 mg/kg niacin group. N3: 45 mg/kg niacin group. N4: 75 mg/kg niacin group.
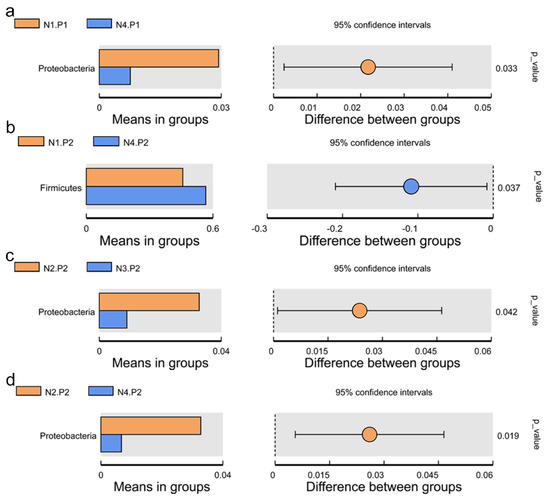
Figure 4.
Species between-group difference test (phylum level). (a), t-test between N1.P1 group and N4.P1 group; (b), t-test between N1.P2 group and N4.P2 group; (c), t-test between N2.P2 group and N3.P2 group; (d), t-test between N2.P2 group and N4.P2 group. P1: the experimental period is 7 days. P2: the experimental period is 14 days. N1: 22.5 mg/kg niacin group. N2: 30 mg/kg niacin group. N3: 45 mg/kg niacin group. N4: 75 mg/kg niacin group.
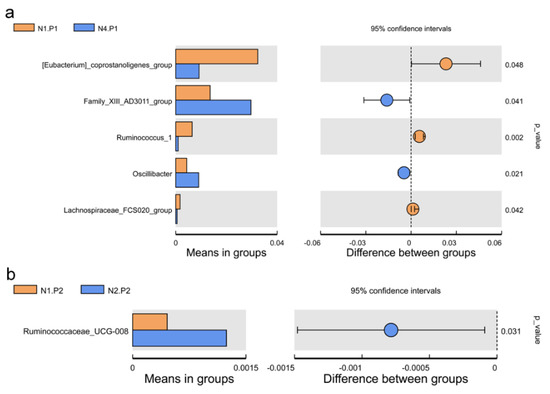
Figure 5.
Species between-group difference test (genus level). (a), t-test between N1.P1 group and N4.P1 group; (b), t-test between N1.P2 group and N2.P2 group. P1: the experimental period is 7 days. P2: the experimental period is 14 days. N1: 22.5 mg/kg niacin group. N2: 30 mg/kg niacin group. N3: 45 mg/kg niacin group. N4: 75 mg/kg niacin group.
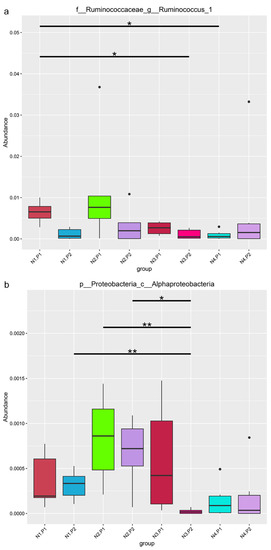
Figure 6.
Analysis of significant differences between groups in metastats. (a), family_Ruminococcaceae_genus_Ruminococcus_1; (b), phylum_Proteobacteria_class_Alphaproteobacteria. P1: the experimental period is 7 days. P2: the experimental period is 14 days. N1: 22.5 mg/kg niacin group. N2: 30 mg/kg niacin group. N3: 45 mg/kg niacin group. N4: 75 mg/kg niacin group. Black pots: abnormal value. *: p < 0.05; **: p < 0.01.
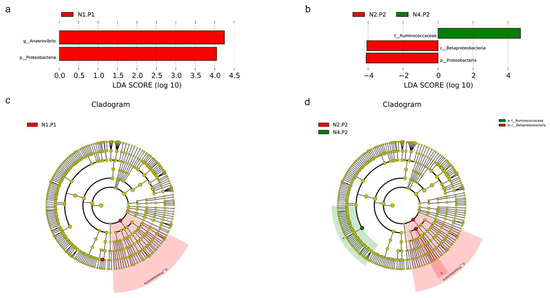
Figure 7.
LEfSe analysis. (a), histogram of the results of LEfSe among four groups in P1 stage and their respective effect sizes, p < 0.05 considered significant; (b), histogram of the results of LEfSe among four groups in P2 stage and their respective effect sizes, p < 0.05 considered significant; (c), cladogram showing taxonomic representation of differences among four groups in P1 stage; (d), cladogram showing taxonomic representation of differences among four groups in P2 stage. P1: the experimental period is 7 days. P2: the experimental period is 14 days. N1: 22.5 mg/kg niacin group. N2: 30 mg/kg niacin group. N3: 45 mg/kg niacin group. N4: 75 mg/kg niacin group.
Table 7.
The concentration of colon contents in weaned piglets with different niacin concentrations 1.
4. Discussion
Niacin is an indispensable essential nutrient in piglet diets. Our previous studies have shown that niacin can influence intestinal morphology and function by affecting cell proliferation of weaned piglets [15]. The latest research shows that it plays an important role in improving the intestinal immunity of weaned piglets [16]. In fish, niacin deficiency reduces the intestinal mucosal immunity and intestinal function of young grass carp [17,18]. Niacin can alleviate inflammation in a GPR109A-dependent manner, thereby effectively alleviating mouse colitis induced by iodoacetamide [19]. Similarly, niacin improves vascular permeability through DP1 mediation, reduces colonic epithelial cell apoptosis, promotes epithelial cell renewal, and inhibits the expression of pro-inflammatory factors in macrophages, alleviating DSS/TNBS-induced mouse colon damage [20]. TNF-α is an inflammatory factor produced mainly by activated monocytes/macrophages. It kills and inhibits tumor cells and is involved in the pathological damage of certain autoimmune diseases [21]. TGF-β is one of the main cytokines that inhibit the function of regulatory T cells and promote the differentiation of pro-inflammatory Th17 and Th9 cells [22,23]. COX2 is an early response gene. The expression of COX2 in healthy animals is low in the gastrointestinal tract, but the expression increases when tissue damage and inflammation are relieved [24]. It plays a key role in the defense and repair of the gastrointestinal mucosa. In this study, the expressions of TGF-β and COX2 in the N3 group were significantly increased, indicating that niacin is exerting a protective effect on piglets under weaning stress. In contrast, TNF-α, an inflammatory cytokine, showed increased expression. One possible reason is that the piglets are in the period of recent weaning, and various external factors lead to the formation of large inflammatory aggregates in the piglets. Short-term niacin supplementation does not yet achieve complete elimination of inflammation.
IgM is the first antibody produced during the immune response. It exists in a secreted form, mainly in the blood [25]. Its unique properties enable it to participate in a variety of pathophysiological processes, including infection, B cell homeostasis, inflammation, and autoimmunity. Natural IgM plays a key role in preventing a series of pathogen infections. It can promote clearance and limit the spread of pathogens, and with the help of the complement component C1q, it can enhance their phagocytosis by phagocytes and increase the presentation of pathogen-derived antigens [25]. Changes in the piglet’s response to infection may lead to chronic inflammation and subsequent autoimmunity. IgM increases the number of B cells and transfers them to the infected area, expressing IgG and thus strengthening the connection with IgM, pathogens, and autoimmunity [26,27]. In this study, IgM and IgG in the N4 group were significantly higher than in the N1 group during the P1 phase. This indicates that piglets supplemented with niacin were able to rapidly improve their autoimmunity in the first week after weaning to cope with the challenges caused by weaning stress. In contrast, at the P2 stage, the immunity of piglets supplemented with high concentrations of niacin was enhanced and their condition gradually recovered, resulting in a significant decrease in the level of IgG produced in the body in response to pathogenic infections.
Many previous studies have pointed out that niacin has a good antioxidant effect, which is reflected in humans, rats, and dairy cows [28,29,30]. In organisms, free radicals act on lipids to cause peroxidation. The end product of oxidation is MDA, which causes cross-linking and polymerization of proteins, nucleic acids, and other cytotoxic life macromolecules. MDA content is an important parameter that reflects the body’s anti-oxidation potential. It can reflect the body’s lipid peroxidation rate and intensity and can also indirectly reflect the degree of tissue peroxidation damage. Superoxide dismutase (SOD) is the main defensive enzyme against free radical damage and scavenges endogenous oxygen free radicals. The characteristics of free radical damage are that it destroys the defense enzyme system, consumes a large amount of SOD, and reduces the activity of SOD. In this study, the P1 phase was the most severe stage of weaning injury in piglets. High dose niacin supplementation could not achieve a rapid increase in antioxidant capacity of piglets. However, at the P2 stage, with increasing doses of niacin, the T-SOD and CuZn-SOD activities in piglets’ jejunum gradually increased, and the antioxidant status of piglets was significantly enhanced, especially with the supplementation of 30 mg/kg. Surprisingly, the MDA level in the N2.P2 group was also high. One possible reason for this is that the jejunum of weaned piglets is still in the repair stage. It may take longer for weaned piglets supplemented with niacin to reach a fully healthy physiological state.
The application of sequencing technology has enriched researchers’ understanding of intestinal microbes. This study shows that Firmicutes and Bacteroidetes are always the two most important phyla for piglets, which is consistent with previous studies [31,32,33,34]. Previous reports have shown that niacin significantly improves the colonic microbiota and the concentration of volatile fatty acids in hungry weaned piglets. [16]. The vast majority of short-chain fatty acids are produced by indigestible carbohydrates in the intestine through bacterial fermentation, dietary intake, or protein (amino acid) metabolism. Carbohydrates are first hydrolyzed and utilized by bacteria to produce intermediate products, including organic acids such as monosaccharide and oligosaccharide molecules, lactic acid, ethanol, and succinic acid. Bacteria continue to ferment intermediate products to produce short-chain fatty acids as the end product of metabolism. In this study, the level of isovaleric acid in the colon contents of piglets in the N4.P1 group was significantly increased. One possible reason is that high dose niacin supplementation mobilizes the catabolism of leucine in animals, which then increases isovaleric acid production through a series of transamination and enzymatic reactions [35]. In this study, due to the supplementation of niacin, the Firmicutes and Proteobacteria at the P2 stage increased significantly. Firmicutes is one of the largest bacterial groups, most of which are Gram-positive and either spherical or rod-shaped, with cell wall structures. Most of the members of Firmicutes are beneficial bacteria, which can promote animal health and play an important role in protecting against pathogens. Several members of Firmicutes are believed to be capable of producing short-chain fatty acids, which protect the energy acquisition and immune barrier establishment of newly weaned piglets [36]. The phylum Proteobacteria contains a variety of pathogenic bacteria, which are usually associated with intestinal inflammation in weaned piglets [37,38]. As previously reported, the phylum Bacteroides consumes oligosaccharides in milk mainly through mucus utilization [39,40]. Due to the change in the weaning diet from liquid milk to solid feed in piglets, coupled with the supplementation of high niacin, the abundance of Bacteroides decreased. During the transition period of piglet weaning, due to the change in diet from liquid to solid, the increase in Firmicutes and the decrease in the abundance of Proteobacteria and Bacteroides may also be an adaptive mechanism for piglets to digest solid feed due to the supplement of niacin. At the genus level, [Eubacterium]_coprostanoligenes_group is known as a group capable of converting cholesterol to coprostanol. He et al. found that when piglets were under stress, the level of serum cholesterol and also the abundance of [Eubacterium]_coprostanoligenes_group increased significantly [41]. High doses of niacin may alleviate weaning stress through [Eubacterium]_coprostanoligenes_group lowering of serum cholesterol levels. Geng et al. found that Ruminococcus_1 has a gene encoding succinate dehydrogenase, which may be involved in the synthesis of succinate through pathways involved in oxidative phosphorylation and the citric acid cycle [42]. Thus, high doses of niacin may inhibit the production of pro-inflammatory cytokines by reducing the concentration of succinate, thereby reducing the inflammatory response in weaned piglets.
In this study, we explored the effect of niacin in the intestine of piglets based on the variation in its level. The variability between the tested parameters was due to the variability of niacin levels in the diets. This explains the different roles played by niacin in immunity, antioxidant, and anti-inflammatory aspects of piglets and also provides guidance for the application of niacin in weaned piglet diets, especially for anti-stress effects.
5. Conclusions
In conclusion, additional supplementation of 45 or even 75 mg/kg niacin in the diet of weaned piglets was effective in improving immunity of piglets and reducing the level of inflammatory factors. Supplementation of 30 mg/kg in weaned piglets can rapidly reshape the antioxidant status in response to intestinal damage caused by weaning stress. Meanwhile, the composition of the colonic microbiota was changed in response to the niacin level.
Author Contributions
Conceptualization, Q.W., H.Y. and Y.Y.; methodology, J.X.; software, L.Y.; validation, Z.W. and Z.Y.; formal analysis, J.L.; investigation, Q.W.; resources, H.Y.; data curation, J.X.; writing—original draft preparation, Z.W. and Z.Y.; writing—review and editing, Q.W. and H.Y.; visualization, J.L.; supervision, Y.Y.; project administration, Q.W., H.Y. and Y.Y.; funding acquisition, Q.W., H.Y. and Y.Y. All authors have read and agreed to the published version of the manuscript.
Funding
This research was funded by Tianjin Synthetic Biotechnology Innovation Capacity Improvement Project (TSBICIP-CXRC-038), Key Programs of Frontier Scientific Research of the Chinese Academy of Sciences (QYZDYSSW-SMC008), Hunan Provincial Key Laboratory of Animal Nutritional Physiology and Metabolic Process open fund projects (ISA2020113), Scientific Research Project of Hunan Education Department (20B369), and Postgraduate Scientific Research Innovation Project of Hunan Province (QL20220114).
Institutional Review Board Statement
The animal study protocol (protocol code 20170229176) was approved by the Animal Care and Use Committee of the Hunan Normal University, Changsha City, Hunan, China.
Informed Consent Statement
Not applicable.
Data Availability Statement
All 16S rRNA sequencing data that support the findings of this research have been deposited in the Sequence Read Archive (SRA) and are accessible through the BioProject ID PRJNA879341 (http://www.ncbi.nlm.nih.gov/bioproject/879341, accessed on 12 September 2022).
Conflicts of Interest
The authors declare no conflict of interest. The funders had no role in the design of the study; in the collection, analyses, or interpretation of data; in the writing of the manuscript, or in the decision to publish the results.
References
- National Research Council of the National Academies. Nutrient Requirements of Swine, 11th ed.; National Academy Press: Washington, DC, USA, 2012.
- Jacobson, E.L.; Kim, H.; Kim, M.; Jacobson, M.K. Niacin: Vitamin and Antidyslipidemic Drug. Sub Cell. Biochem. 2012, 56, 37–47. [Google Scholar]
- Bieganowski, P.; Brenner, C. Discoveries of Nicotinamide Riboside as a Nutrient and Conserved NRK Genes Establish a Preiss-Handler Independent Route to NAD in Fungi and Humans. Cell 2004, 117, 495–502. [Google Scholar] [CrossRef]
- Bogan, K.L.; Brenner, C. Nicotinic acid, nicotinamide, and nicotinamide riboside: A molecular evaluation of NAD+ precursor vitamins in human nutrition. Annu. Rev. Nutr. 2008, 28, 115–130. [Google Scholar] [CrossRef]
- Gille, A.; Bodor, E.T.; Ahmed, K.; Offermanns, S. Nicotinic acid: Pharmacological effects and mechanisms of action. Annu. Rev. Pharmacol. Toxicol. 2008, 48, 79–106. [Google Scholar] [CrossRef]
- Spies, T.D.; Cooper, C.; Blankenhorn, M.A. The use of nicotinic acid in the treatment of pellagra. JAMA 1938, 110, 622–627. [Google Scholar] [CrossRef]
- Altschul, R.; Hoffer, A.; Stephen, J.D. Influence of nicotinic acid on serum cholesterol in man. Arch. Biochem. Biophys. 1955, 54, 558–559. [Google Scholar] [CrossRef]
- Carlson, L.A. Studies on the effect of nicotinic acid on catecholamine stimulated lipolysis in adipose tissue in vitro. Acta Med. Scand. 2009, 173, 719–722. [Google Scholar] [CrossRef]
- Carlson, L.A. Nicotinic acid: The broad-spectrum lipid drug. A 50th anniversary review. J. Intern. Med. 2005, 258, 94–114. [Google Scholar] [CrossRef]
- Wu, B.J.; Yan, L.; Charlton, F.; Witting, P.K.; Barter, P.J.; Rye, K. Evidence That Niacin Inhibits Acute Vascular Inflammation and Improves Endothelial Dysfunction Independent of Changes in Plasma Lipids. Arterioscler. Thromb. Vasc. Biol. 2010, 30, 968–975. [Google Scholar] [CrossRef]
- Lukasova, M.; Malaval, C.; Gille, A.; Kero, J.; Offermanns, S. Nicotinic acid inhibits progression of atherosclerosis in mice through its receptor GPR109A expressed by immune cells. J. Clin. Investig. 2011, 121, 1163–1173. [Google Scholar] [CrossRef]
- Offermanns, S.; Colletti, S.L.; Lovenberg, T.W.; Semple, G.; Wise, A.; Ijzerman, A.P. International Union of Basic and Clinical Pharmacology. LXXXII: Nomenclature and Classification of Hydroxy-carboxylic Acid Receptors (GPR81, GPR109A, and GPR109B). Pharmacol. Rev. 2011, 63, 269–290. [Google Scholar] [CrossRef]
- Kamanna, V.S.; Ganji, S.H.; Kashyap, M.L. Niacin: An old drug rejuvenated. Curr. Atheroscler. Rep. 2009, 11, 45–51. [Google Scholar] [CrossRef]
- Campbell, J.M.; Crenshaw, J.D.; Polo, J. The biological stress of early weaned piglets. J. Anim. Sci. Biotechnol. 2013, 4, 19. [Google Scholar] [CrossRef]
- Yi, Z.; Tan, X.; Wang, Q.; Huang, P.; Li, Y.; Ding, X.; Li, J.; Huang, J.; Yang, H.; Yin, Y. Dietary niacin affects intestinal morphology and functions via modulating cell proliferation in weaned piglets. Food Funct. 2021, 12, 7402–7414. [Google Scholar] [CrossRef]
- Feng, J.; Wang, L.; Chen, Y.; Xiong, Y.; Wu, Q.; Jiang, Z.; Yi, H. Effects of niacin on intestinal immunity, microbial community and intestinal barrier in weaned piglets during starvation. Int. Immunopharmacol. 2021, 95, 107584. [Google Scholar] [CrossRef]
- Feng, L.; Li, S.-Q.; Jiang, W.-D.; Liu, Y.; Jiang, J.; Wu, P.; Zhao, J.; Kuang, S.-Y.; Tang, L.; Tang, W.-N.; et al. Deficiency of dietary niacin impaired intestinal mucosal immune function via regulating intestinal NF-κB, Nrf2 and MLCK signaling pathways in young grass carp (Ctenopharyngodon idella). Fish Shellfish Immunol. 2016, 49, 177–193. [Google Scholar] [CrossRef]
- Li, S.-Q.; Feng, L.; Jiang, W.-D.; Liu, Y.; Jiang, J.; Wu, P.; Kuang, S.-Y.; Tang, L.; Tang, W.-N.; Zhang, Y.-A.; et al. Deficiency of dietary niacin impaired gill immunity and antioxidant capacity, and changes its tight junction proteins via regulating NF-κB, TOR, Nrf2 and MLCK signaling pathways in young grass carp (Ctenopharyngodon idella). Fish Shellfish Immunol. 2016, 55, 212–222. [Google Scholar] [CrossRef]
- Salem, H.A.; Wadie, W. Effect of Niacin on Inflammation and Angiogenesis in a Murine Model of Ulcerative Colitis. Sci. Rep. 2017, 7, 7139. [Google Scholar] [CrossRef]
- Li, J.; Kong, D.; Wang, Q.; Wu, W.; Tang, Y.; Bai, T.; Guo, L.; Wei, L.; Zhang, Q.; Yu, Y.; et al. Niacin ameliorates ulcerative colitis via prostaglandin D2-mediated D prostanoid receptor 1 activation. EMBO Mol. Med. 2017, 9, 571–588. [Google Scholar] [CrossRef] [PubMed]
- Akdis, M.; Aab, A.; Altunbulakli, C.; Azkur, K.; Costa, R.A.; Crameri, R.; Duan, S.; Eiwegger, T.; Eljaszewicz, A.; Ferstl, R.; et al. Interleukins (from IL-1 to IL-38), interferons, transforming growth factor β, and TNF-α: Receptors, functions, and roles in diseases. J. Allergy Clin. Immunol. 2016, 138, 984–1010. [Google Scholar] [CrossRef] [PubMed]
- Butz, H.; Rácz, K.; Hunyady, L.; Patócs, A. Crosstalk between TGF-β signaling and the microRNA machinery. Trends Pharmacol. Sci. 2012, 33, 382–393. [Google Scholar] [CrossRef]
- Gutcher, I.; Donkor, M.K.; Ma, Q.; Rudensky, A.Y.; Flavell, R.A.; Li, M.O. Autocrine Transforming Growth Factor-β1 Promotes In Vivo Th17 Cell Differentiation. Immunity 2011, 34, 396–408. [Google Scholar] [CrossRef]
- Wallace, J.L.; Devchand, P.R. Emerging roles for cyclooxygenase-2 in gastrointestinal mucosal defense. Br. J. Pharmacol. 2005, 145, 275–282. [Google Scholar] [CrossRef]
- Ehrenstein, M.R.; Notley, C.A. The importance of natural IgM: Scavenger, protector and regulator. Nat. Rev. Immunol. 2010, 10, 778–786. [Google Scholar] [CrossRef]
- Zhong, X.; Lau, S.; Bai, C.; Degauque, N.; Holodick, N.E.; Steven, S.J.; Tumang, J.; Gao, W.; Rothstein, T.L. A novel subpopulation of B-1 cells is enriched with autoreactivity in normal and lupus-prone mice. Arthritis Rheum. 2009, 60, 3734–3743. [Google Scholar] [CrossRef]
- Enghard, P.; Humrich, J.Y.; Chu, V.T.; Grussie, E.; Hiepe, F.; Burmester, G.-R.; Radbruch, A.; Berek, C.; Riemekasten, G. Class switching and consecutive loss of dsDNA-reactive B1a B cells from the peritoneal cavity during murine lupus development. Eur. J. Immunol. 2010, 40, 1809–1818. [Google Scholar] [CrossRef]
- Ganji, S.H.; Qin, S.; Zhang, L.; Kamanna, V.S.; Kashyap, M.L. Niacin inhibits vascular oxidative stress, redox-sensitive genes, and monocyte adhesion to human aortic endothelial cells. Atherosclerosis 2009, 202, 68–75. [Google Scholar] [CrossRef]
- Yuan, K.; Shaver, R.D.; Bertics, S.J.; Espineira, M.; Grummer, R.R. Effect of rumen-protected niacin on lipid metabolism, oxidative stress, and performance of transition dairy cows. J. Dairy Sci. 2012, 95, 2673–2679. [Google Scholar] [CrossRef]
- Cho, K.-H.; Kim, H.-J.; Rodriguez-Iturbe, B.; Vaziri, N.D. Niacin ameliorates oxidative stress, inflammation, proteinuria, and hypertension in rats with chronic renal failure. Am. J. Physiol. Ren. Physiol. 2009, 297, F106–F113. [Google Scholar] [CrossRef]
- Chen, L.M.; Xu, Y.S.; Chen, X.Y.; Fang, C.; Zhao, L.P.; Chen, F. The Maturing Development of Gut Microbiota in Commercial Piglets during the Weaning Transition. Front. Microbiol. 2017, 8, 1688. [Google Scholar] [CrossRef]
- Kim, H.B.; Borewicz, K.; White, B.A.; Singer, R.S.; Sreevatsan, S.; Tu, Z.J.; Isaacson, R.E. Longitudinal investigation of the age-related bacterial diversity in the feces of commercial pigs. Vet. Microbiol. 2011, 153, 124–133. [Google Scholar] [CrossRef]
- Looft, T.; Johnson, T.A.; Allen, H.K.; Bayles, D.O.; Alt, D.P.; Stedtfeld, R.D.; Sul, W.J.; Stedtfeld, T.M.; Chai, B.; Cole, J.R.; et al. In-feed antibiotic effects on the swine intestinal microbiome. Proc. Natl. Acad. Sci. USA 2012, 109, 1691. [Google Scholar] [CrossRef]
- Hu, J.; Nie, Y.; Chen, J.; Zhang, Y.; Wang, Z.; Fan, Q.; Yan, X. Gradual Changes of Gut Microbiota in Weaned Miniature Piglets. Front. Microbiol. 2016, 7, 1727. [Google Scholar] [CrossRef]
- Thierry, A.; Maillard, M.-B.; Yvon, M. Conversion of l-Leucine to Isovaleric Acid by Propionibacterium freudenreichii TL 34 and ITGP23. Appl. Environ. Microbiol. 2002, 68, 608–615. [Google Scholar] [CrossRef]
- Atarashi, K.; Tanoue, T.; Shima, T.; Imaoka, A.; Kuwahara, T.; Momose, Y.; Cheng, G.; Yamasaki, S.; Saito, T.; Ohba, Y.; et al. Induction of Colonic Regulatory T Cells by Indigenous Clostridium Species. Science 2011, 331, 337–341. [Google Scholar] [CrossRef]
- Minamoto, Y.; Otoni, C.C.; Steelman, S.M.; Büyükleblebici, O.; Steiner, J.M.; Jergens, A.E.; Suchodolski, J.S. Alteration of the fecal microbiota and serum metabolite profiles in dogs with idiopathic inflammatory bowel disease. Gut Microbes 2015, 6, 33–47. [Google Scholar] [CrossRef]
- Meng, Q.; Luo, Z.; Cao, C.; Sun, S.; Ma, Q.; Li, Z.; Shi, B.; Shan, A. Weaning Alters Intestinal Gene Expression Involved in Nutrient Metabolism by Shaping Gut Microbiota in Pigs. Front. Microbiol. 2020, 11, 694. [Google Scholar] [CrossRef]
- Marcobal, A.; Barboza, M.; Sonnenburg, E.D.; Pudlo, N.; Martens, E.C.; Desai, P.; Lebrilla, C.B.; Weimer, B.C.; Mills, D.A.; German, J.B.; et al. Bacteroides in the Infant Gut Consume Milk Oligosaccharides via Mucus-Utilization Pathways. Cell Host Microbe 2011, 10, 507–514. [Google Scholar] [CrossRef]
- Marcobal, A.; Sonnenburg, J.L. Human milk oligosaccharide consumption by intestinal microbiota. Clin. Microbiol. Infect. 2012, 18, 12–15. [Google Scholar] [CrossRef]
- He, J.; Zheng, W.; Lu, M.; Yang, X.; Xue, Y.; Yao, W. A controlled heat stress during late gestation affects thermoregulation, productive performance, and metabolite profiles of primiparous sow. J. Therm. Biol. 2019, 81, 33–40. [Google Scholar] [CrossRef]
- Geng, T.; He, F.; Su, S.; Sun, K.; Zhao, L.; Zhao, Y.; Bao, N.; Pan, L.; Sun, H. Probiotics Lactobacillus rhamnosus GG ATCC53103 and Lactobacillus plantarum JL01 induce cytokine alterations by the production of TCDA, DHA, and succinic and palmitic acids, and enhance immunity of weaned piglets. Res. Vet. Sci. 2021, 137, 56–67. [Google Scholar] [CrossRef]
Publisher’s Note: MDPI stays neutral with regard to jurisdictional claims in published maps and institutional affiliations. |
© 2022 by the authors. Licensee MDPI, Basel, Switzerland. This article is an open access article distributed under the terms and conditions of the Creative Commons Attribution (CC BY) license (https://creativecommons.org/licenses/by/4.0/).