Simple Summary
Increased growth rates of ewe lambs between three and seven months of age can potentially have negative impacts on mammary development and milk production, affecting their capacity to wean a lamb as yearling ewes. This experiment was designed to examine the impacts of an increased growth rate of ewes between weaning and their first breeding at seven months of age on mammary development using ultrasonography and to establish if mammary ultrasound measures could be indicators of growth of yearling ewe progeny. Mammary measures were taken in late pregnancy, early lactation and weaning in 59 single-bearing yearling ewes either preferentially fed and achieving 47.9 kg at breeding at seven months of age, or fed to achieve 44.9 kg at breeding. Mammary measures did not differ between live-weight gain treatments, indicating no evidence of negative effects on mammary development of yearling ewes. Some mammary measures, however, were positively associated with the growth of the progeny to weaning suggesting that ultrasonography has the potential to identify yearling ewes that would wean heavier lambs.
Abstract
The experiment aimed to examine the impacts of an increased growth rate of ewes between three and seven months of age on udder development using ultrasound and to establish whether ultrasonography could be used to identify ewe mammary structures that may be indirect indicators of singleton growth to weaning. Udder dimensions, depths of gland cistern (GC), parenchyma (PAR) and fat pad (FP) were measured in late pregnancy (P107), early lactation (L29), and at weaning (L100) in 59 single-bearing yearling ewes selected from two treatments. The ‘heavy’ group (n = 31) was preferentially fed prior to breeding achieving an average breeding live-weight of 47.9 ± 0.38 kg at seven months of age. The ‘control’ group (n = 28) had an average breeding live-weight of 44.9 ± 0.49 kg. Udder dimensions, GC, PAR and FP did not differ between treatments. Lamb growth to L100 was positively associated (p < 0.05) with PAR at P107 and GC at L29. There was no evidence of negative effects of the live-weight gain treatments on udder development of yearling ewes as measured by ultrasonography. The results suggest that this ultrasound method has the potential to identify pregnant yearling ewes which would wean heavier singletons.
1. Introduction
A major determinant for achieving puberty and successful breeding of yearling ewes at seven months of age is the attainment of 40–70% of mature live-weight [1,2]. Yearling ewes that weighed 40 to 45 kg at breeding had greater performance than those bred at 35 kg or below, therefore Kenyon et al. [2] recommended a minimum live-weight of yearling ewes of 40 kg at breeding. Further, heavier live-weights at breeding have been shown to improve the reproductive performance of yearling ewes resulting in a greater number of yearling ewes mated during the breeding period, increased fertility rate, litter size, and lambing percentage [2,3]. Using this combined knowledge, farmers aim to feed their Romney-type yearling ewes to achieve suitable growth rates post-weaning to ensure they reach live-weights greater than 40 to 45 kg at breeding at seven months of age. Increased growth rates prior to puberty, however, have been reported to have negative impacts on mammary gland development and milk production in yearling ewes [4,5]. McCann et al. [6] reported that yearling ewes grown at higher rates between weaning and breeding at seven months of age produced less milk than yearling ewes with lower growth rates, indicating an impairment of the mammary gland development and function. Farmers, therefore, need to balance the desire for heavier live-weights at breeding to improve yearling ewe reproductive performance while limiting any potential negative impacts on lactation performance and growth of the progeny to weaning.
Yearling ewes have a period of accelerated growth of parenchymal mammary tissue, called allometric phase, between two and five months of age [7,8]. During this period, the ductal network of the mammary gland expands extensively into the mammary fat pad [9]. The development of the ductal network during this period will determine future alveolar development, and therefore future milk production [5,10]. A high plane of nutrition prior to puberty has been reported to reduce the development of parenchyma [5,8] and increase fat accumulation in the fat pad [8,9], which combined may explain the reported subsequent lower milk production [5,11].
Ewe mammary internal structures can be visualized using ultrasonography [12]. Specifically, ultrasound has been used to investigate the mammary parenchyma [13,14] and the mammary gland cistern (sinus lactiferous) [15,16]. In dairy ewes, mammary morphology and milk production were reported as traits of interest in genetic selection, leading to an increase in mammary size and milk yield compared to non-dairy breeds [17,18]. In addition, currently, most studies that have examined mammary structures using ultrasonography have utilised dairy breed ewes [12] with only a small number of studies examining dual-purpose meat and wool breeds [15,19]. Ruberte et al. [19] examined the relationship between mammary ultrasound images and mammary anatomy of mature ewes, whereas Caja et al. [15] focused on measures of cistern size using ultrasound and its correlation with milk yield of mature ewes. Currently, no studies have used ultrasound to examine the mammary gland of non-dairy yearling ewes. Over the last 20 years, ultrasound technology has improved, allowing for more detailed examination of the mammary structures through greater image resolution which allows the assessment of the development of the parenchyma and identification of abnormalities in the parenchyma [12]. The present experiment was the first, to these authors’ knowledge, to utilise ultrasound on non-dairy yearling ewes during their first pregnancy and lactation and to investigate the relationship between ultrasound measurements of yearling ewe udders and the growth of their progeny.
The primary objective of this experiment was to investigate the effects of an increased growth rate between weaning (three months of age) and breeding (seven months of age) on mammary gland dimensions and structures of single-bearing Romney yearling ewes during their first pregnancy and lactation using ultrasonography. It was hypothesised that yearling ewes with an increased growth rate between weaning and breeding (heavy) would have a smaller parenchymal area and a greater fat pad area than yearling ewes with a lower growth rate between weaning and breeding (control). The second objective was to develop an ultrasound technique to identify mammary internal structures that could be used as indirect indicators of the growth to weaning of the progeny of yearling ewes. It was hypothesised that the ultrasound measurements of the young dam’s mammary gland in lactation would be correlated with the early growth rate of their progeny.
2. Materials and Methods
The experiment was conducted at Massey University’s Riverside Farm (latitude: 40°50′35″ S, longitude: 175°37′55″ E), 10 km north of Masterton, New Zealand. All animal handling procedures were approved by the Massey University Animal Ethics Committee (MUAEC-17/16).
2.1. Experimental Design
2.1.1. Background
As previously described by Haslin et al. [20], at weaning, at approximately 86 days of age (127 days prior to breeding; P-127), 270 twin-born Romney ewe lambs (hereafter called yearling ewes) were allocated to one of the two treatment groups using a stratified random sampling procedure to ensure that the average live-weight of the groups did not differ (28.6 ± 0.16 kg). The intent of this experiment was to bring yearling ewes to different live-weight targets at their first breeding (P0) at seven months of age. The ‘heavy’ group (n = 135) was preferentially fed until breeding (10/05/2018; P0) achieving an average live-weight of 47.9 ± 0.38 kg. The ‘control’ group (n = 135) had an average live-weight of 44.9 ± 0.49 kg at P0. Both groups grazed lucerne sward (Medicago sativa L.; heavy for 105 days (P-127 to P-22) and control for 100 days (P-127 to P-27)), then ryegrass (Lolium perenne L.) and white clover-based sward (Trifolium repens L.) for 22 days heavy (P-22 to P0) and 27 days control (P-27 to P0), and both were offered a cereal-based concentrate feed (CP 10.5%, NDF 17.6%, ADF 7.1%, ME 12.8 MJ/kg DM) pre-breeding (Figure 1). Cereal-based concentrate feed mass offered to the heavy group at a rate of 200 g/yearling ewe/day for 68 days (P-119 to P-51) and 300 g/yearling ewe/day for 51 days (P-51 to P0; Figure 1). Yearling ewes in the control group were offered 200 g/yearling ewe/day for 43 days (P-94 to P-51; Figure 1). Individual animal feed intake was not measured. Pasture allowances were controlled using a rotational grazing system and by differing pre- and post-grazing herbage sward heights. All yearling ewes were managed as a single mob from P0 and bred for two 17-day periods (P0 to P34) to crayon-harnessed Romney rams at a ratio of 1:40 [3]. Yearling ewes were identified as mated in the first 17-day period by recording the presence of a crayon colour mark on their rump [3]. Pregnancy diagnosis was determined at 84 days of pregnancy (P84) using transabdominal ultrasound (Figure 1).
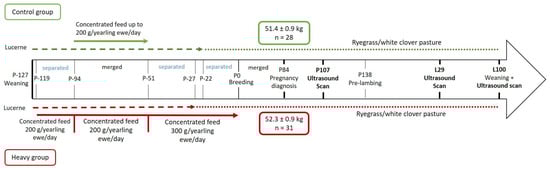
Figure 1.
Experimental design from weaning of the yearling ewes (P-127) to weaning of their progeny (L100) (extended of [20]). P: days of pregnancy, L: days of lactation. The lactation period was deemed to have begun after the first lamb of all yearling ewes was born (L1). The green colour (top) corresponds to the control group and the red colour (bottom) corresponds to the heavy group.
2.1.2. Present Study
Romney yearling ewes from each treatment group were randomly selected at pregnancy diagnosis (approximately 10 months of age) to select only yearling ewes mated during the first 17 days of breeding that were identified as single-bearing (P84; heavy, n = 31, 52.3 ± 0.85 kg and control, n = 28, 51.4 ± 0.85 kg; Figure 1). Only single-bearing yearling ewes were selected as yearling ewes carrying singles are more frequent than those carrying twins [21]. At 138 days of pregnancy (P138), yearling ewes from both treatment groups were randomly assigned to one of four lambing paddocks (average stocking rate 8.02 yearling ewe/ha; heavy n = 8, 6, 9, 8 and control n = 9, 5, 9, 5 per lambing paddock) to ensure yearling ewes from each treatment group in each paddock. Cross-suckling was not controlled, as ewes and lambs are developing an exclusive bond [22] making cross-suckling not frequent. Two yearling ewes in the heavy group died during the lambing period. All yearling ewes lambed within 15 days (1/10/2018 to 16/10/2018). The lactation period was deemed to have begun after the first lamb had been born from all yearling ewes (1/10/2018; L1) and all lambs were weaned at approximately 100 ± 4 days of age (17/01/2019; L100; heavy n = 24 and control n = 24).
From P0 to L100, both groups were managed and grazed together using a rotational grazing system on ryegrass and white clover pasture under commercial New Zealand grazing conditions. The pre-grazing pasture mass during pregnancy and lactation was on average 868 ± 39 and 1265 ± 58 kg DM/ha, respectively. Due to low pasture availability in pregnancy, all yearling ewes were offered lucerne bailage (CP 13.3%, NDF 48.8%, ADF 36.1%, ME 9.6 MJ/kg DM) at a rate of approximately 1.0 kg/yearling ewe/day from P34 to P138.
2.2. Animal Measurements
Unfasted live-weights of yearling ewes were recorded at P-127, P0, P84, P107, L29 and L100. Body condition score (BCS) of yearling ewes were recorded at P0, P84, P138, L29 and L100. Lambs were tagged within 18 h of birth, during twice-daily lambing rounds, at which time their date of birth, paddock, sex, dam number and birth weights were recorded. Lambs were reweighed at L29 and L100.
2.2.1. Udder Score and Morphology
Yearling ewe udder scoring, and morphological trait measurements were performed at P107, L29 and L100 by a single trained operator. The scoring system, adapted from Griffiths et al. [23], assessed udder health and included the palpation of both udder halves and teats (Table 1). Yearling ewes were placed in a sitting position to allow access to the udder for palpations.

Table 1.
Description of the traits and scores used to assess udder health of yearling ewes in late pregnancy and lactation (adapted from [23]).
Morphological traits were measured while yearling ewes were standing and included udder circumference (UC, cm) measured above the teats [24], using a tape (Scrotal Measuring Tape, Shoof international LTD, New Zealand), and the height of each udder half (cm), using a ruler to measure the distance between the rear udder attachment along the outside edge of the udder, and the udder floor [25] (Figure 2). Udder volume (UV, cm3) was calculated using UC and an average of udder height (UH) according to Ayadi et al. [25] (1) and (2).
where UV = udder volume (cm3); π = 3.14159; R = radius (cm); UH = udder height (cm); UC = udder circumference (cm).
R = UC/2π
UV = π × R2 × UH,

Figure 2.
Morphological traits of yearling ewe udder. A. Udder height (cm) measured from outside edge of the udder between the ewe leg and the udder floor; B. Udder circumference (cm) taken above the teats (adapted from [24]).
2.2.2. Ultrasound Scanning
Ultrasound scans were performed by a single operator, at P107, L29 and L100 (Figure 1). At L29 and L100, ultrasound scans were not conducted for yearling ewes whose lambs had died (heavy n = 5 and control n = 4). At L29 and L100, yearling ewes were separated from their lambs four hours prior to the ultrasound scanning to allow the udder to accumulate milk according to Ruberte et al. [19] and Caja et al. [15]. Yearling ewes were placed in a sitting position (i.e., shearing position; Figure 3b,c) to allow easy access to the udder. Ultrasound scans were performed with an ultrasound scanner fitted with a linear transducer with 5.0–10.0 MHz imaging frequency (Sonosite M-Turbo Ultrasound with L38xi, Bothell, Washington, DC, USA). Vegetable oil was used as a coupling gel. The transducer was applied on the external base of each teat at an approximate angle of 30° from the caudal-cranial axis (Figure 3a) with an inclination of approximately 45° in relation to the teat [26] (Figure 3b,c). A light and consistent pressure was applied to the udder through the transducer to minimise variations related to pressure on the images. There was variability in the position of yearling ewes but, the effects of these variations were minimised by indicating to the handler on which position (on right of left leg) the ewe had to be sited for the ultrasound scan (Figure 3b,c), and by identifying the most representative and consistent mammary structures on the images during the scan prior to capturing the images.

Figure 3.
(a) Diagram representing the position of the transducer (solid line) applied on the right and left udder halves; (b) Picture of an ultrasound scan of the right udder half of a yearling ewe in pregnancy (P107); (c) Picture of an ultrasound scan of the left udder half of a yearling ewe in pregnancy (P107).
A minimum of three images were taken from each udder half. Images included the gland cistern, mammary parenchyma, putative fat pad and the boundary between the mammary gland and the abdominal wall. One image of suitable resolution per udder half, where all structures were identifiable and present was selected for image processing [27]. Udder halves with an udder palpation score of 4 or 5 (Table 1) at a specific time point (P107, L29 or L100) were considered “abnormal” [23] and were not included in the image selection (heavy: 1 ewe with 1 half and control: 2 ewes with 1 half each).
The image processing was undertaken using ImageJ software [28] as used by Abràmoff et al. [29]. The scales between pixels and millimetres were calculated based on the number of pixels, the scanning depth (mm), and the transducer width (mm) (Figure 4). This method relies on the ability of the operator to interpret and identify lines on the images. To standardize the assessment compartment depth, drawing templates were created for each time point as used by Molenaar et al. [30] and included four representative images from four different yearling ewes with and without the lines drawn for each compartment (Appendix A). The total depth of mammary gland conservative (MTc) was the smallest likely demarcation (abdominal wall) of the mammary gland (Figure 5a), and total depth of the mammary gland generous (MTg) was the largest likely demarcation of the mammary gland visible on the image [30] (Figure 5a). The MTc, MTg, fat pad (FP), parenchyma (PAR), and gland cistern (GC) depths were estimated at the deepest point for each sub-compartment, excluding the skin layers, using the straight tracer (Figure 5a) and were expressed in millimetres.

Figure 4.
Diagram of an ultrasound image and the dimensions needed to calculate the correspondence between pixels and millimetres.
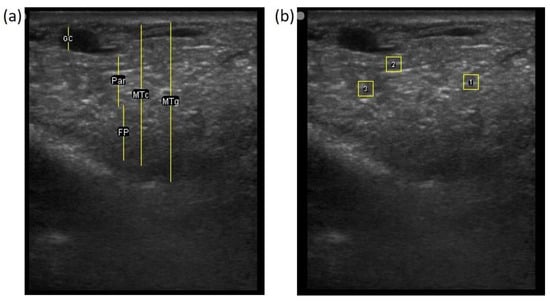
Figure 5.
(a) Demonstration of delimitations of the mammary total depth conservative (MTc) and generous (MTg), mammary gland cistern (GC), parenchyma (PAR) and the fat pad (FP) and (b) Demonstration of randomly positioning of regions of interest (1, 2, 3) in the parenchyma.
To assess the development of the parenchyma at P107, L29, and L100, three regions of interest (ROI; [26]) were randomly drawn in the parenchyma area, each square measured 6.7 mm2 (Figure 5b). The brightness of each pixel corresponded to echogenicity and was numerically represented on a scale of 256 levels of grey [31]. Echogenicity is defined as the capacity of tissues to interact and reflect the sound waves of the transducer [32]. This capacity varies with tissues, i.e., liquids have very low echogenicity [32] and fat has greater echogenicity but attenuates as the depth increases [30].
2.3. Statistical Analysis
All statistical analyses were conducted using SAS v9.4 (SAS Institute Inc., Cary, NC, USA). Yearling ewes that died (heavy n = 2) or whose lambs died prior to L100 (control n = 4 and heavy n = 5) were excluded from the experiment. The final dataset included 24 yearling ewes and their singletons in each treatment group and a total of 284 images.
Growth of yearling ewes from P-127 to P0 was analysed using a linear mixed model including treatment group (control vs. heavy) as a fixed effect and age at P-127 as a covariate. Live-weight of yearling ewes at P107, L29 and L100 was analysed using a linear mixed model allowing for repeated measures. The model included treatment group, day of measurement (P107, L29 and L100) and their two-way interaction as fixed effects. Lambing date was fitted as a covariate in the model as used by Pettigrew et al. [33]. The BCS of yearling ewes was analysed using a generalized linear model allowing for repeated measures with a Poisson distribution and a log transformation. Treatment group, day of measurement (P0, P84, P138, L29 and L100) and their two-way interaction were included as fixed effects. Growth of the progeny from birth to L29 and from L29 to L100 was analysed using a linear mixed model allowing for repeated measures, and including treatment group, time (birth to L29 and L29 to L100) as fixed effects, date of birth as a covariate and lambing paddock as a random effect.
The ROI grey-scale values, GC, FP, PAR, MTc and MTg of the right and left udder halves were analysed using general linear mixed models allowing for repeated measures. These models included udder half (right vs. left), day of measurement, treatment group and two-way interactions of udder half and day of measurement and treatment group and day of measurement as fixed effects, with a Tukey–Kramer adjustment, lambing date as a covariate and yearling ewe as a random effect. The grey-scale, GC, PAR, MTc, MTg did not differ (p > 0.05) between udder halves, therefore, an average of the two halves was calculated for each day of measurement and used in further analyses. For FP, udder halves were significantly (p < 0.05) different at L100 and thus the FP measures of the right and left halves at L100, remained separated in the analyses.
To determine the effect of individual yearling ewe live-weight at P0 on the grey-scale values, GC, PAR, FP, MTc and MTg, the linear mixed models were re-run without treatment as a fixed effect and including udder half, day of measurement and their two-way interaction as a fixed effect, lambing date and live-weight at P0 as a covariate, a two-way interaction between live-weight at P0 and day of measurement, and yearling ewe as a random effect.
The residuals were generated using general mixed models. Ewe live-weight, ewe BCS, UV, UH, UC and MTg were adjusted for treatment group and lambing date. In the model, PAR, GC and MTc were adjusted for the treatment group, MTg and lambing date. Lamb growth from birth to L29, L29 to L100 and birth to L100 were adjusted for the treatment group, lambing date, and sex of lamb. Pearson correlations were used to test for linear associations between the residuals of ewe live-weight, UC, UH, UV, GC, PAR, FP, MTc and MTg at each time point (P107, L29, L100) and lamb growth from birth to L29, from L29 to L100 and from birth to L100.
Multiple regression analyses of lamb growth from birth to L29 and from birth to L100 were carried out using general linear models. General linear models were used to examine whether each predictive variable was individually correlated with lamb growth. Predictive variables correlated with lamb growth with p ≤ 0.20 were included in the model [34]. Correlations between selected predictive variables were examined to identify high collinearity, resulting in Equations (3) and (4) respectively.
Lamb growth from birth to L29 = GC at L29 + MTc at L29 + BCS at P0
Lamb growth from birth to L100 = PAR at P107 + FP at P107 + Ewe LW at L29 + GC at L29 + MTc at L29
Backward manual variable eliminations were used to select the model that best explained the variation in lamb growth from birth to L29 and to L100 by removing predictive variables with p > 0.10. Confounding effects were evaluated after each variable removal and were examined by checking the changes in predictive variable coefficients. Any non-significant predictive variable causing greater than a 20% change in the model coefficients was considered a confounding variable and included in the model [34].
3. Results
3.1. Growth and Live-Weight
Yearling ewes from the heavy group had greater growth rates between P-127 and P0 than control yearling ewes (p < 0.05; 147 ± 4.4 vs. 133 ± 4.4 g/d, respectively) resulting in a tendency for different live-weight at breeding (p = 0.09, 47.5 ± 0.71 vs. 45.8 ± 0.71 kg, respectively). Live-weight of yearling ewes, however, did not differ (p > 0.05) between treatments at P107, L29 or L100 (Table 2).
Table 2.
Effect of time (P107, P138, L29, L100) and treatment group (control vs. heavy) on yearling ewe live-weight and body condition score (BCS) in pregnancy (P107, P138), early lactation (L29) and at weaning (L100) and lamb live-weight in early lactation (L29) and at weaning (L100). Least square means ± s.e for live-weight and least-square means (95% confidence intervals) for BCS.
Yearling ewe BCS did not differ (p > 0.05) between treatment groups at any time point (Table 2). Ewe BCS did not differ (p > 0.05) between P0, P84 and P138, which in turn were greater (p < 0.05) than BCS at L29 and L100, which did not differ (p > 0.05; Table 2).
Lamb live-weights at birth, L29 and L100 (Table 2) and lamb growth from birth to L29, from L29 to L100 (average 340.8 ± 13.5 g/d and 201.5 ± 8.19 g/d, respectively) and lamb growth from birth to L100 [35] did not differ (p > 0.05) between treatments.
3.2. Udder Scores and Morphology
The udder scores, UH, UC and UV at P107, L29 and L100 were presented in Haslin et al. [35]. Briefly, teat palpation score, udder depth score, the proportion of asymmetric udder and dimensions (UH, UC and UV) did not differ (p > 0.05) between treatment groups at any time point. The control group had greater (p < 0.01) udder palpation scores at P107 than the heavy group [35].
3.3. Ultrasound Measurements
The depth of the gland cistern (GC), parenchyma (PAR), total mammary conservative (MTc), total mammary generous (MTg) and the grey-scale value did not differ between udder halves (p > 0.05; data not shown). The depth of the fat pad (FP) did not differ at P107 between udder halves (p > 0.05; data not shown), but at L100, the left udder half had a deeper FP than the right udder half (p < 0.05; 19.2 ± 0.91 left vs. 15.4 ± 0.99 right).
The depths of GC, PAR, FP, MTc, MTg and the ROI grey-scale values did not differ (p > 0.05) between treatment groups at any time point (Table 3). Live-weight at P0, irrespective of treatment group, had no effect (p > 0.05) on GC, FP, MTc, MTg and ROI grey-scale values but negatively impacted PAR at P107 (p < 0.05; estimate −0.20 mm).
Table 3.
Effect of time (P107, L29, L100) and treatments (control vs. heavy) on depths of the mammary gland cistern (GC), parenchyma (PAR), fat pad (FP), the total mammary depth conservative and generous (MTc and MTg), and the grey-scale value of regions of interest (ROI) in the parenchyma (least-square means ± SEM).
The depth of GC, PAR, MTg and MTc were greater at L29 (p < 0.001) than L100 which was, in turn, greater (p < 0.001) than P107, irrespective of treatment groups. The depth of FP was greater at L100 than at P107, irrespective of treatment groups (p < 0.001; Table 3).
3.4. Correlations between Udder Measurements, Ewe Live-Weight, Ewe BCS and Lamb Growth
At P107, UC was positively correlated with UV, UH and PAR (p < 0.05), and GC and PAR were negatively associated with FP (p < 0.01; Table 4). BCS of yearling ewes at P138 was positively associated (p < 0.01) with FP at P107 and live-weight at P107, and negatively associated (p < 0.05) with PAR at P107 (Table 4). At L29, UV was positively correlated with UH and UC (p < 0.05), and PAR was negatively correlated with GC (p < 0.05). Live-weight of yearling ewes at L29, irrespective of treatments, was positively associated with BCS at L29 (p < 0.01) and UC (p < 0.05; Table 5). At L100, UV was positively correlated with UH, UC, FP of left half (p < 0.05), UH was positively associated with UC and FP of the left half (p < 0.05). Live-weight of yearling ewes was positively associated (p < 0.001) with BCS of yearling ewes at L100 (Table 6) At L100, FP of the left half was negatively correlated with PAR (p < 0.01; Table 6).
Table 4.
Correlation coefficients of residuals of udder volume (UV), circumference (UC), height (UH), gland cistern (GC), parenchyma (PAR) and fat pad (FP) at P107, live-weight of yearling ewes (Ewe LW) in pregnancy (P107) 1, body condition score of yearling ewes (Ewe BCS) in late pregnancy (P138), lamb growth from birth to weaning (Birth to L100), birth to early lactation (Birth to L29) and early lactation to weaning (L29 to L100).
Table 5.
Correlation coefficients of residuals of udder volume (UV), circumference (UC), height (UH), gland cistern (GC) and parenchyma (PAR) at L29, body condition score and live-weight of yearling ewes (Ewe BCS and Ewe LW) in early lactation (L29) 1, lamb growth from birth to weaning (Birth to L100), birth to early lactation (Birth to L29) and early lactation to weaning (L29 to L100).
Table 6.
Correlation coefficients of residuals of udder volume (UV), circumference (UC), height (UH), gland cistern (GC), parenchyma (PAR) and fat pad from the right (FP Right) and left (FP Left) udder halves at L100, body condition score and live-weight of yearling ewes (Ewe BCS and Ewe LW) at weaning (L100) 1, lamb growth from birth to weaning (Birth to L100), birth to early lactation (Birth to L29) and early lactation to weaning (L29 to L100).
Lamb growth from birth to L29, irrespective of treatments, was positively associated with GC at L29 (p < 0.05; Table 5) and FP at L100 on the right half (p < 0.05; Table 6). Lamb growth from birth to L29 to L100 was positively associated with PAR at P107 (p < 0.05; Table 4) and FP at L100 on the left half (p < 0.05; Table 6) but negatively associated with FP at P107 (p < 0.05; Table 4). Lamb growth from birth to L100 was positively associated with PAR at P107 (p < 0.01; Table 4), GC at L29 (p < 0.05) but negatively associated with PAR at L29 (p < 0.05; Table 5).
3.5. Multiple Regression of Lamb Growth
The best model explained 12.2% of the variation in lamb growth from birth to L29 included only the effect of GC at L29 (Lamb growth from birth to L29 = 261.4 (±35.1) + 4.9 (±1.9) GC at L29; estimate (±SE)). The difference between a yearling ewe with an average GC at L29 and a GC in the 90th percentile was 6.6 mm (Table 7), resulting in a 32.3 g/d difference in lamb growth from birth to L29.
Table 7.
Descriptive statistics of the depths of the gland cistern (GC), parenchyma (PAR) and mammary fat pad (FP) in late-pregnancy (P107), early lactation (L29) and weaning (L100), irrespective of treatment groups.
For the period birth to L100, the best model explained 37.6% of the variation in lamb growth and included the effect of PAR at P107, yearling ewe live-weight (LW) at L29 and GC at L29 (Lamb growth from birth to L100 = 37.4 (±48.5) + 7.2 (±1.9) PAR at P107 + 2.0 (±0.65) LW at L29 + 1.2 (±0.63) GC at L29). The difference between a yearling ewe with an average PAR at P107 and a PAR in the 90th percentile was 2.6 mm (Table 7), resulting in 18.7 g/d in lamb growth from birth to L100. The difference between a yearling ewe with an average GC at L29 and a GC in the 90th percentile was 6.6 mm (Table 7) resulting in 7.9 g/d in lamb growth from birth to L100.
4. Discussion
4.1. Treatment Effects
The first objective of this experiment was to investigate the effects of increasing growth rates of yearling ewes between weaning and breeding on mammary gland dimensions and internal structures. It was hypothesised that yearling ewes with an increased growth rate would have a reduced mammary parenchymal and a greater fat pad area compared with yearling ewes with a lower growth rate. Despite differences in yearling ewe growth rate between weaning and breeding, depth of the gland cistern, parenchyma, fat pad and total depth of the mammary gland conservative and generous did not differ between treatments, which contrast with previous studies [5,8,11]. The differences in yearling ewe growth rates between treatments from weaning to breeding, however, were small (14 g/d) and the magnitude of the growth (less than 150 g/d on average) was lower than those achieved in previous studies (i.e., from 173 to 305 g/d; [8,11]). The small differences in the growth rate of yearling ewes between treatments in the present experiment (14 g/d) may have impacted the ability of the treatments to alter mammary gland development. There are also differences in breeds between studies that may also explain the difference between the results of the present experiment and previous studies (Hampshire Down [8], Suffolk crossed Dorset and Suffolk [11], Dorset [5]). In the present experiment, there was no evidence of negative impacts on mammary gland development of Romney-type yearling ewes achieving live-weight gains of approximately 147 g/d between their weaning at three months of age and their first breeding at seven months of age and reared under New Zealand conditions.
No differences were found between the right and the left udder half for total depths of the mammary gland, depths of the gland cistern and parenchyma. This finding is consistent with previous studies [13,14]. At weaning, however, the fat pad differed between udder halves. This difference could be explained by a preference of the lamb for one udder half, which may have been over-stimulated [36], in particular for ewes rearing a singleton. Overstimulation of one udder half may lead to an early partial udder involution of the non-preferred udder half resulting in changes in the mammary tissues [37].
4.2. Associations between Udder Measurements and Lamb Growth
The second objective of this experiment was to develop an ultrasound technique to identify mammary internal structures that could be used as indirect indicators of lamb growth to weaning. Mammary parenchymal depth in late pregnancy measured by ultrasound was moderately and positively associated with lamb growth to weaning. Singletons born to yearling ewes with a large parenchyma in late pregnancy being 1832 g heavier at weaning at 100 days of age than singletons born to yearling ewes with an average parenchyma in late pregnancy. The mammary parenchyma includes the secretory tissue involved in the production and secretion of milk [38,39] with the number of secretory cells determining milk production [40,41]. Thus, a deeper parenchyma in pregnancy could indicate a greater number of secretory cells and potentially greater milk production. Strzetelski et al. [32] reported in primiparous dairy heifers that the percentage of secretory tissue measured by ultrasound was highly positively correlated with milk production. While the impact of the parenchymal depth in late pregnancy on singleton growth to weaning was moderate, the results suggested that the ultrasound method could potentially be used as a technique to identify pregnant yearling ewes that will wean heavier singletons.
The gland cistern depth in early lactation was moderately and positively correlated to lamb growth from birth to early lactation and to weaning. Singletons born to yearling ewes with a large gland cistern in early lactation being 938 g and 790 g heavier at 29 and 100 days of age respectively, than singletons born to yearling ewes with an average gland cistern in early lactation. The mammary gland cistern is the cavity that milk drains into between milkings or suckling events [38]. Ewes with larger cisterns were reported to produce more milk than ewes with smaller cisterns [15,16,42]. It is likely, therefore, that yearling ewes with larger gland cisterns in early lactation would have greater milk production than those with smaller cisterns. The associations between ultrasound measurements and milk production in non-dairy yearling ewes, however, are still unknown. These results again suggested that ultrasound has the potential to identify yearling ewes that would wean heavier singletons. Further research is warranted to confirm these findings and investigate the use of ultrasound to examine the association between mammary gland, milk production and lamb growth in non-dairy yearling ewes.
The ultrasound scan in late pregnancy was easier to perform, as lactating yearling ewes and lambs had to be separated and were off feed for four hours pre-scanning, whereas late-pregnant yearling ewes did not require a waiting period prior to scanning. The measurement of the parenchyma in late pregnancy relies on the ability of the operator to identify the demarcation between tissues which can be difficult due to the image resolution and the attenuation of signal as the scanning depth increases [30]. The measure of the gland cistern did not so much rely on the operator ability, as the gland cistern appears clearly as black on the image [15,30]. The precise measure of the parenchyma and gland cistern with this ultrasound technique could not be performed at scanning as the correspondence between millimetres and pixels varies depending on the scanning depth. The ultrasound technique used in this experiment would therefore be challenging to apply on larger flocks of yearling ewes. More research is required to improve the ultrasound technique for its potential application on larger flocks.
5. Conclusions
This experiment was the first to use ultrasound to investigate the relationship between udder measurements and the growth of progeny of non-dairy yearling ewes during pregnancy and lactation. The depth of the mammary parenchyma in late pregnancy and of the gland cistern in early lactation were indicators of growth from birth to weaning of singletons. Under the conditions of this experiment, there was no evidence of negative effects of the differing live-weight gain treatments between three and seven months of age on mammary gland development of Romney-type yearling ewes during their first pregnancy and lactation as measured by ultrasonography. The results of the association between lamb growth and mammary ultrasound measures suggest that the ultrasound technique used in this experiment has the potential to identify pregnant yearling ewes which would wean heavier singletons. More research is needed to investigate the use of ultrasound to examine the associations between mammary ultrasound measurements, milk production and lamb growth in non-dairy yearling ewes.
Author Contributions
Conceptualization, E.H., R.A.C.-T., P.R.K., S.T.M. and H.T.B.; methodology, investigation, resources and visualization, E.H., A.J.M., R.A.C.-T., P.R.K., S.T.M. and H.T.B.; software, E.H. and A.J.M.; formal analysis, E.H., R.A.C.-T., P.R.K., S.T.M. and H.T.B.; data curation, E.H. and A.J.M.; writing—original draft preparation, E.H.; writing—review and editing, E.H., R.A.C.-T., P.R.K., A.J.M., S.T.M. and H.T.B.; supervision, R.A.C.-T., P.R.K., S.T.M. and H.T.B.; project administration, E.H., R.A.C.-T., P.R.K., S.T.M. and H.T.B.; funding acquisition, H.T.B. All authors have read and agreed to the published version of the manuscript.
Funding
This experiment was funded by Beef + Lamb New Zealand.
Institutional Review Board Statement
The experiment and all animal handling procedures were approved by the Massey University Animal Ethics Committee (MUAEC-17/16).
Informed Consent Statement
Not applicable.
Data Availability Statement
The data presented in this experiment are available within the article.
Acknowledgments
The authors wish to acknowledge Dean Burnham, Geoff Purchas, Riverside farm staff for their technical assistance and Beef and Lamb New Zealand for funding this experiment.
Conflicts of Interest
The authors declare no conflict of interest. There are no relevant financial or non-financial competing interest to report. The funders had no role in the design of the study, in the collection, analysis, or interpretation of data, in the writing of the manuscript, or in the decision to publish the results.
Appendix A. Drawing Templates of Mammary Ultrasound Images in Late Pregnancy, Early Lactation and Weaning in Yearling Ewes
Table A1.
Drawing template of mammary ultrasound images in late pregnancy (107 days of pregnancy; P107) in four different yearling ewes.


Table A2.
Drawing template of mammary ultrasound images in early lactation (29 days of lactation; L29) in four different yearling ewes.


Table A3.
Drawing template of mammary ultrasound images at weaning (100 days of lactation; L100) in four different yearling ewes.


References
- Dýrmundsson, Ó.R. Puberty and early reproductive performance in sheep. I. Ewe lambs. Commonw. Bur. Anim. Breed. Genet. 1973, 41, 273–289. [Google Scholar]
- Kenyon, P.R.; Thompson, A.N.; Morris, S.T. Breeding ewe lambs successfully to improve lifetime performance. Small Rumin. Res. 2014, 118, 2–15. [Google Scholar] [CrossRef]
- Haslin, E.; Corner-Thomas, R.A.; Kenyon, P.R.; Morris, S.T.; Pettigrew, E.J.; Hickson, R.E.; Blair, H.T. Brief Communication: Impacts of live weight of ewe lambs at mating on their reproductive performance. N. Z. J. Anim. Sci. Prod. 2019, 79, 87–90. [Google Scholar]
- Tolman, B.; McKusick, B.C. The effect of growth rate on mammary gland development in ewe lambs: A review. In Proceedings of the Dairy Sheep Symposium, Eau Claire, WI, USA, 1–3 November 2001. [Google Scholar]
- Villeneuve, L.; Cinq-Mars, D.; Lacasse, P. Effects of restricted feeding of prepubertal ewe lambs on growth performance and mammary gland development. Animal 2010, 4, 944–950. [Google Scholar] [CrossRef]
- McCann, M.A.; Goode, L.; Harvey, R.W.; Caruolo, E.V.; Mann, D.L. Effects of rapid weight gain to puberty on reproduction, mammary development and lactation in ewe lambs. Theriogenology 1989, 32, 55–68. [Google Scholar] [CrossRef]
- Anderson, R.R. Mammary gland growth in sheep. J. Anim. Sci. 1975, 41, 118–123. [Google Scholar] [CrossRef]
- Johnsson, I.D.; Hart, I.C. Pre-pubertal mammogenesis in the sheep 1. The effects of level of nutrition on growth and mammary development in female lambs. Anim. Sci. 1985, 41, 323–332. [Google Scholar] [CrossRef]
- Hovey, R.C.; Mcfadden, T.B.; Akers, R.M. Regulation of mammary gland growth and morphogenesis by the mammary fat pad: A species comparison. J. Mammary Gland. Biol. Neoplasia 1999, 4, 53–68. [Google Scholar] [CrossRef]
- Berryhill, G.E.; Trott, J.E.; Derpinghaus, A.L.; Hovey, R.C. TRIENNAL LACTATION SYMPOSIUM/BOLFA: Dietary regulation of allometric ductal growth in the mammary glands. J. Anim. Sci. 2017, 95, 5664–5674. [Google Scholar] [CrossRef]
- Umberger, S.H.; Goode, L.; Caruolo, E.V.; Harvey, R.W.; Britt, J.H.; Linnerud, A.C. Effects of accelerated growth during rearing on reproduction and lactation in ewes lambing at 13 to 15 months of age. Theriogenology 1985, 23, 555–564. [Google Scholar] [CrossRef]
- Barbagianni, M.S.; Mavrogianni, V.S.; Vasileiou, N.G.C.; Fthenakis, G.C.; Petridis, I.G. Ultrasonographic examination of the udder in sheep. Small Rumin. Res. 2017, 152, 86–99. [Google Scholar] [CrossRef]
- Petridis, I.G.; Gouletsou, P.G.; Barbagianni, M.S.; Amiridis, G.S.; Brozos, C.; Valasi, I.; Fthenakis, G.C. Ultrasonographic findings in the ovine udder during involution. J. Dairy Res. 2014, 81, 288–296. [Google Scholar] [CrossRef] [PubMed]
- Barbagianni, M.S.; Gouletsou, P.G.; Valasi, I.; Petridis, I.G.; Giannenas, I.; Fthenakis, G.C. Ultrasonographic findings in the ovine udder during lactogenesis in healthy ewes or ewes with pregnancy toxaemia. J. Dairy Res. 2015, 82, 293–303. [Google Scholar] [CrossRef] [PubMed]
- Caja, G.; Such, X.; Ruberte, J.; Carretero, A.; Navarro, M. The use of ultrasonography in the study of mammary gland cisterns during lactation in sheep. Proc. Eur. Soc. Anim. Prod. 1999, 95, 91–93. [Google Scholar]
- Rovai, M.; Caja, G.; Such, X. Evaluation of udder cisterns and effects on milk yield of dairy ewes. J. Dairy Sci. 2008, 91, 4622–4629. [Google Scholar] [CrossRef]
- Carta, A.; Casu, S.; Salaris, S. Invited review: Current state of genetic improvement in dairy sheep. J. Dairy Sci. 2009, 92, 5814–5833. [Google Scholar] [CrossRef] [PubMed]
- Pourlis, A. Ovine mammary morphology and associations with milk production, milkability and animal selection. Small Rumin. Res. 2020, 184. [Google Scholar] [CrossRef]
- Ruberte, J.; Carretero, A.; Fernandez, M.; Navarro, M.; Caja, G.; Kirchner, F.; Such, X. Ultrasound mammography in the lactating ewe and its correspondence to anatomical section. Small Rumin. Res. 1994, 13, 199–204. [Google Scholar] [CrossRef]
- Haslin, E.; Corner-Thomas, R.A.; Kenyon, P.R.; Morris, S.T.; Blair, H.T. Effects of heavier live weight of ewe lambs at mating on fertility, lambing percentage, subsequent live weight and the performance of their progeny. N. Z. J. Agric. Res. 2020, 1–15. [Google Scholar] [CrossRef]
- Corner, R.A.; Mulvaney, F.J.; Morris, S.T.; West, D.M.; Morel, P.C.H.; Kenyon, P.R. A comparison of the reproductive performance of ewe lambs and mature ewes. Small Rumin. Res. 2013, 114, 126–133. [Google Scholar] [CrossRef]
- Nowak, R.; Keller, M.; Lévy, F. Mother-Young Relationships in Sheep: A Model for a Multidisciplinary Approach of the Study of Attachment in Mammals. J. Neuroendocrinol. 2011, 23, 1042–1063. [Google Scholar] [CrossRef]
- Griffiths, K.J.; Ridler, A.L.; Compton, C.W.R.; Corner-Thomas, R.A.; Kenyon, P.R. Investigating associations between lamb survival to weaning and dam udder and teat scores. N. Z. Vet. J. 2019, 67, 1–9. [Google Scholar] [CrossRef]
- Sezenler, T.; Ceyhan, A.; Yüksel, M.A.; Önaldı, A.; Yıldırır, M. Effect of parity and type of lambing on performance and udder traits of Bandirma ewes. Indian J. Anim. Sci. 2016, 86, 575–577. [Google Scholar]
- Ayadi, M.; Such, X.; Ezzehizi, N.; Zouari, M.; Najar, T.; M’Rad, M.B.; Casals, R. Relationship between mammary morphology traits and milk yield of Sicilo-Sarde dairy sheep in Tunisia. Small Rumin. Res. 2011, 96, 41–45. [Google Scholar] [CrossRef]
- Albino, R.L.; Marcondes, M.I.; Akers, R.M.; Detmann, E.; Carvalho, B.C.; Silva, T.E. Mammary gland development of dairy heifers fed diets containing increasing levels of metabolisable protein: Metabolisable energy. J. Dairy Res. 2015, 82, 113–120. [Google Scholar] [CrossRef][Green Version]
- Albino, R.L.; Guimarães, S.E.F.; Daniels, K.M.; Fontes, M.M.S.; Machado, A.F.; Dos Santos, G.B.; Marcondes, M.I. Mammary gland ultrasonography to evaluate mammary parenchymal composition in prepubertal heifers. J. Dairy Sci. 2017, 100, 1588–1591. [Google Scholar] [CrossRef] [PubMed]
- Ferreira, T.; Rasband, W.S. ImageJ User Guide-IJ 1.46. Available online: Imagej.nih.gov/ij/docs/guide/ (accessed on 22 November 2019).
- Abràmoff, M.D.; Magalhães, P.J.; Ram, S.J. Image processing with ImageJ. Biophotonics Int. 2004, 11, 36–42. [Google Scholar]
- Molenaar, A.J.; Maclean, P.H.; Gilmour, M.L.; Draganova, I.G.; Symes, C.W.; Margerison, J.K.; McMahon, C.D. Effect of whole-milk allowance on liveweight gain and growth of parenchyma and fat pads in the mammary glands of dairy heifers at weaning. J. Dairy Sci. 2020, 103, 5061–5069. [Google Scholar] [CrossRef] [PubMed]
- Ojala, T.; Pietikainen, M.; Maenpaa, T. Multiresolution gray-scale and rotation invariant texture classification with local binary patterns. IEEE Trans. Pattern Anal. Mach. Intell. 2002, 24, 971–987. [Google Scholar] [CrossRef]
- Strzetelski, J.; Bilik, K.; Niwińska, B.; Skrzyński, G.; Łuczyńska, E. Ultrasound evaluation of the mammary gland structure in preparturient heifers vs. performance of first calvers. J. Anim. Feed Sci. 2004, 13, 7–10. [Google Scholar] [CrossRef]
- Pettigrew, E.; Hickson, R.; Morris, S.; Kenyon, P.; Corner-Thomas, R.; Haslin, E.; Blair, H. The Effect of Age of Dam and Birth Rank on the Reproductive Performance of Ewes as One-and Two-Year-Olds. Animals 2021, 11, 770. [Google Scholar] [CrossRef]
- Dohoo, I.R.; Martin, W.; Stryhn, H.E. Veterinary Epidemiologic Research; AVC Inc.: Charlottetown, EI, Canada, 2003. [Google Scholar]
- Haslin, E.; Corner-Thomas, R.A.; Kenyon, P.R.; Morris, S.T.; Blair, H.T. Impacts of a heavier live weight at breeding on the morphology of mammary glands of non-dairy ewe lambs [Abstract]. Anim. Prod. Sci. 2021, 61, 165. [Google Scholar]
- Makovicky, P.; Milerski, M.; Margetín, M.; Makovicky, P.; Nagy, M. Genetic parameters for the size of udder cisterns in ewes diagnosed by ultrasonography among breeds: Improved Valachian, Tsigai, Lacaune and their crosses. Arch. Zootec. 2015, 64, 403–408. [Google Scholar]
- Jena, M.K.; Jaswal, S.; Kumar, S.; Mohanty, A.K. Molecular mechanism of mammary gland involution: An update. Dev. Biol. 2018, 445, 145–155. [Google Scholar] [CrossRef]
- Akers, R.M. Overview of Mammary Development. In Lactation and the Mammary Gland; Akers, R.M., Ed.; Blackwell Publishing Company: Ames, IA, USA, 2002; pp. 3–44. [Google Scholar]
- Colville, T. Chapter 18. Pregnancy, Development, and Lactation. In Clinical Anatomy and Physiology for Veterinary Technicians, 2nd ed.; Colville, T., Bassert, J.M., Eds.; Elsevier: St Louis, MO, USA, 2007; pp. 405–413. [Google Scholar]
- Boutinaud, M.; Guinard-Flament, J. The number and activity of mammary epithelial cells, determining factors for milk production. Reprod. Nutr. Dev. 2004, 44, 499–508. [Google Scholar] [CrossRef]
- Capuco, A.V.; Wood, D.L.; Baldwin, R.; Mcleod, K.; Paape, M.J. Mammary cell number, proliferation, and apoptosis during a bovine lactation: Relation to milk production and effect of bST. J. Dairy Sci. 2001, 84, 2177–2187. [Google Scholar] [CrossRef]
- Castillo, V.; Such, X.; Caja, G.; Salama, A.A.K.; Albanell, E.; Casals, R. Changes in alveolar and cisternal compartments induced by milking interval in the udder of dairy ewes. J. Dairy Sci. 2008, 91, 3403–3411. [Google Scholar] [CrossRef]


Publisher’s Note: MDPI stays neutral with regard to jurisdictional claims in published maps and institutional affiliations. |
© 2021 by the authors. Licensee MDPI, Basel, Switzerland. This article is an open access article distributed under the terms and conditions of the Creative Commons Attribution (CC BY) license (http://creativecommons.org/licenses/by/4.0/).