Simple Summary
The scaly rockcod (Trematomus loennbergii) is distributed in the Antarctic Ocean and this area is isolated by the Antarctic Circumpolar Current. It is important region to study evolutionary diversity. Trematomus is the main genus, having 11 species, and their habit distribution is well known. However, their genetic and genomic information is not studied. In addition, some species have similar morphology. In this study, a genome survey of T. loennbergii and microsatellite motif analysis were conducted to obtain genomic profile. The fundamental data such as genome size, heterozygosity ratio, duplication ration and microsatellite motifs were obtained. These data will provide a foundation for further whole-genome sequencing and the development of new molecular markers of T. loennbergii.
Abstract
Trematomus loennbergii Regan, 1913, is an evolutionarily important marine fish species distributed in the Antarctic Ocean. However, its genome has not been studied to date. In the present study, whole genome sequencing was performed using next-generation sequencing (NGS) technology to characterize its genome and develop genomic microsatellite markers. The 25-mer frequency distribution was estimated to be the best, and the genome size was predicted to be 815,042,992 bp. The heterozygosity, average rate of read duplication, and sequencing error rates were 0.536%, 0.724%, and 0.292%, respectively. These data were used to analyze microsatellite markers, and a total of 2,264,647 repeat motifs were identified. The most frequent repeat motif was di-nucleotide with 87.00% frequency, followed by tri-nucleotide (10.45%), tetra-nucleotide (1.94%), penta-nucleotide (0.34%), and hexa-nucleotide (0.27%). The AC repeat motif was the most abundant motif among di-nucleotides and among all repeat motifs. Among microsatellite markers, 181 markers were selected and PCR technology was used to validate several markers. A total of 15 markers produced only one band. In summary, these results provide a good basis for further studies, including evolutionary biology studies and population genetics of Antarctic fish species.
1. Introduction
The Antarctic shelf is the deepest ice shelf in the world. The depth of the Ross Ice Shelf, which is the largest ice shelf of Antarctica, is approximately 500 m, which is much deeper than the average depth (130 m) of other continental shelves. Moreover, the Southern Ocean is isolated by the Antarctic Circumpolar Current (ACC), and the temperature of the coastal water is cold with parts of it being frozen, making it an extreme environment. Therefore, the Antarctic Ocean is an important region for biologists to study survival adaptations and evolutionary diversification [,]. In the order Perciformes, Notothenioidei is the dominant suborder of fishes in the Antarctic area according to diversity and biomass [], and fish species belonging to the family Notothenioidei have a variety of characters distinguishing them from other teleost fishes, such as the lack of hemoglobin and AFGP (antifreeze glycoprotein), which protect their body fluids from freezing [,]. The subfamily Trematominae is fundamental to the study of the coastal Antarctic ecosystem and includes only 14 species. Trematomus is the main most well-known genus in this family; it comprises 11 species, and their plasticity and diversity in habit distribution are well-known []. However, it is difficult to clearly distinguish between several Trematomus species because they have very similar morphologies. For example, Trematomus loennbergii and Trematomus lepidorhinus differ only in the absence or presence of scales on the preorbital and lower jaw []. Trematomus loennbergii Regan, 1913, known as the scaly rockcod, and the average length of this species is 20 cm, according to FishBase []. It is widely distributed in the Southern Ocean and is commonly found at a depth of over 300 m []. Its swimming activity is more spontaneous than that of other benthic fishes from the same family. The diet of females and males is similar; they feed on a wide range of prey, and their main food resources are epifaunal and tube-dwelling polychaetes [].
T. loennbergii is an important species for studying evolution in the Antarctic area. Some morphological studies have emphasized the difficulty of distinguishing between this species and similar species. Owing to the development of molecular biology research techniques, especially next-generation sequencing (NGS) technology, genomic data, such as whole genome sequencing data, could be used for this purpose. Recently, some Antarctic species have been studied using this technology, but the genome of T. loennbergii has not been assessed to date. Therefore, low-coverage genome sequencing (e.g., genome surveys by K-mer analysis) needs to be carried out before performing large-scale sequencing to provide a genomic reference. Moreover, microsatellites or simple sequence repeats (SSRs), which consist of one to 10 nucleotides, are widely distributed throughout the genome of eukaryotes [,,]. Therefore, in the present study, we conducted K-mer and QDD analyses to investigate the genome size and repeat sequences of T. loennbergii and to develop new microsatellite markers. These data can provide useful basic information on T. loennbergii genome.
2. Materials and Methods
2.1. Sample Collection and DNA Extraction
A T. loennbergii (Figure 1) was caught in the Ross Sea (77°05′ S, 170°30′ E on CCAMLR Subarea 88.1), Antarctica, and stored in a freezer. The conventional phenol-chloroform method [] was used for DNA extraction from the muscle tissue of frozen specimens. Quality check was conducted using a fragment analyzer (Agilent Technologies, Palo Alto, CA, USA), and DNA quantity was estimated using a Qubit 2.0 Fluorometer (Life Technologies, Carlsbad, CA, USA).
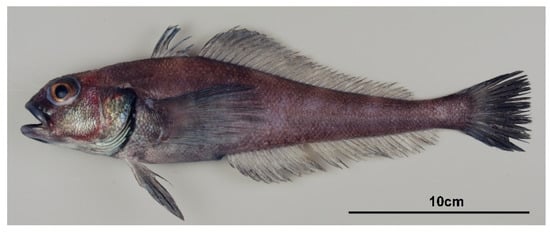
Figure 1.
T. loennbergii from the Ross Sea, Antarctica.
2.2. Library Construction and Sequencing
DNA library preparation was performed according to the Illumina Truseq DNA PCR-Free Library prep protocol. For library sample preparation, 2 μg of genomic DNA for 550 bp insert size was randomly sheared to yield DNA fragments using the Covaris S2 system (Covaris, Woburn, MA, USA). The fragments were blunt-ended, and a single ‘A’ nucleotide was added to the 3′ ends of the fragments for adaptor ligation. After the ligation step with adaptors having different sequences at the 5′ and 3′ ends of each fragment, library quality check was conducted using Bioanalyzer (Agilent Technologies, Santa Clara, CA, USA). The library was clustered on the Illumina cBOT station, and paired ends were sequenced for 101 cycles on an Illumina Novaseq 6000 sequencer (Illumina, San Diego, CA, USA) according to the Illumina cluster and sequencing protocols.
2.3. K-mer Analysis, Genome Assembly, and Microsatellite Analysis
After evaluation of quality values, all clean reads were used for K-mer analysis using Jellyfish and GenomeScope [,]. After estimating genome size, the assembly of T. loennbergii genome was conducted by MaSuRCA []. QDD version 3.1.2 pipeline [] was used to identify the microsatellite motifs of T. loennbergii. The microsatellites repeat units in the genome were analyzed to calculate their length, quantity, and sequence. The following parameters were analyzed: number of mono-nucleotide repeats, di-nucleotides repeats, tri-nucleotide repeats, tetra-nucleotide repeats, penta-nucleotide repeats, and hexa-nucleotide repeat. These repeats were extracted from steps 1, 2 and 3. The parameter of each step was -contig 1, -make_cons 0 and -contig 1, respectively. After QDD analysis, total 181 primer set were selected by following parameters: motifs with more than five repetitions, 100–300 bp amplification product, 18–28 mer primer size and 58–62 °C for melting temperature. Among these primer pairs, 40 sets were randomly selected by 20 bp primer size and 60 °C annealing temperature. The PCR was conducted in total 20 μL including 5 μL genomic DNA (30 ng/μL), 10 μL 2× EmeraldAmp PCR Master Mix (Takara Bio, Shiga, Japan), 1 μL (10 pmole/L) each forward and reverse primers and 3 μL ddH2O. The PCR program was 2 min at 94 °C, followed by 35 cycles of 94 °C for 30 s, 60 °C for 30 s and 70 °C for 1 min, and the final extension was 10 min at 72 °C. The amplified PCR products were separately by 4% agarose gel electrophoresis and the 20 bp DNA ladder (Takara Bio, Shiga, Japan) was used to estimate the PCR product size.
3. Results and Discussion
3.1. Sequencing Data Statistics
In this study, the paired-end method with the Illumina NovaSeq platform was used to generate raw sequence data, and low-quality reads were filtered out. As a result, a total of 53.48 Gb of data were obtained. The data showed that Q20 was 96.3% and Q30 was 91.3% (Table 1). The Illumina NGS platform specifies that high-quality reads should have a Q20 of at least 90% and a Q30 of at least 85% []. Therefore, T. loennbergii sequencing data were highly accurate. Genome assembly and thereby the genome sequencing quality can be influenced by GC content; high GC content can reduce the sequencing coverage and cause sequencing bias. However, GC content between 30% and 50% has no effect on genome sequence quality [,,]. In the present study, the GC content of T. loennbergii was 41.3% (Table 1); thus, it had no effect on the assembly results.

Table 1.
Sequencing data for the genome of T. loennbergii.
3.2. K-mer Analysis and Genome Size Prediction
Using the sequencing data, K-mer analysis was conducted and the 25-mer frequency distribution was the best. The estimated genome size was 815,042,992 bp (Table 2) and it is quite similar to the size of Pogonophryne albipinna (~883.8 Mb) which inhabits the deep waters of the Antarctic Southern Ocean [] but smaller than the Antarctic blackfin icefish Chaenocephalus aceratus (1.06 Gb) []. The genome size of most fish is approximately 1 Gb, except for a few species [], and the estimated genome size of T. loennbergii was similar to that of most fish species. Based on K-mer analysis, the heterozygosity was 0.536% and the average rate of read duplication was 0.724%. The sequencing error rate was 0.292%, and the highest frequency was near 40× coverage (Figure 2).
Table 2.
Statistics of the estimated genome size by GenomeScope.
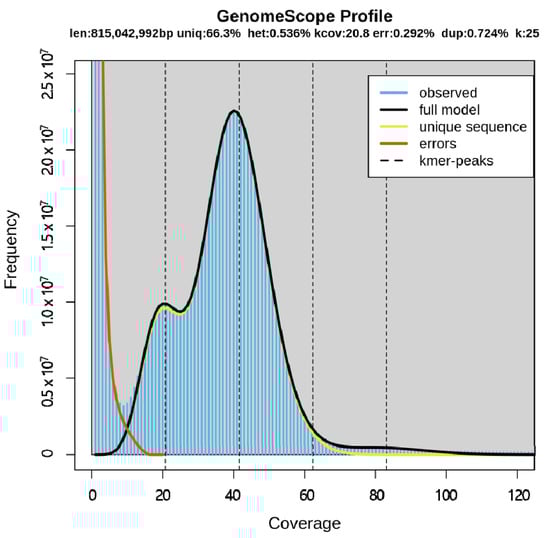
Figure 2.
K-mer analysis (K = 25) of T. loennbergii. The X-axis represents coverage, and the Y-axis represents the frequency at each depth. This profile plot shows the fit of the model (black) to the observed frequency (blue).
3.3. De Novo Assembly
To perform de novo assembly, MaSuRCA [] was used with all clean reads. The total size of contigs was 820,644,295 bp, and the number of contigs was 613,288. The largest contig size was 59,484 bp, and the number of contigs larger than 1 K bp was 192,849 (31.4%). N50 contig length was 148,364 bp and L50 contig number was 1526. GC content was 40.65% and contig having more than 1K nt was 31.4% (Table 3). If heterozygosity rate is lower than 0.5%, it is not difficult to assemble [], and heterozygosity rate of T. loennbergii is ~0.5%. In addition, high quality reads should have at least 85% on Q30 [] and the high quality reads of T. loennbergii were 91.3%.
Table 3.
Statistics of T. loennbergii assembled genome sequences.
The assembly data is a first genome survey of T. loennbergii and it would be useful information for genomic research for Trematomus group. However, to improve whole genome sequencing and de novo assembly data, further study is needed to combine with more advanced technologies such as PacBio long read sequencing and high-throughput chromosome conformation capture (Hi-C).
3.4. Identification of Microsatellite Motifs
Based on the genome assembly, QDD pipeline was used to identified SSR markers and the total number of identified microsatellite motifs was 2,264,647. Among them, di-nucleotide repeats were the most abundant (1,970,270, 87.00%) followed by tri-nucleotide repeats (236,541, 10.45%), tetra-nucleotide repeats (43,907, 1.94%), penta-nucleotide repeats (977,333, 0.34%), and hexa-nucleotide repeats (6196, 0.27%). The tendency of di-nucleotide repeats frequency in the studied species was similar to that in other fish species, such as Pseudosciaena crocea and Megalobrama amblycephala [,]. Furthermore, this result was consistent with data indicating that the repeat frequency decreases with the increase in repeat length because long mutations are related to high mutation rates []. The most frequent repeat motif among the four types of di-nucleotide repeats was the AC/GT repeat, and it was also the most abundant repeat motif (1,394,543, 61.57%) among all repeat motifs. The hexa-nucleotide repeat motif was the least frequent but had the highest number (n = 80) of repeat motif types (Table 4). After this analysis, we selected 181 microsatellite primer pairs (Table S1). Among these primer sets, we randomly chose 40 primer pairs and conducted PCR amplification with T. loennbergii. As a result, 15 primer pairs produced one clear band (Figure 3). Therefore, the present data applied for molecular genetic marker and further validation studies using various Trematomus groups are needed.
Table 4.
Distribution of microsatellite motifs in T. loennbergii.
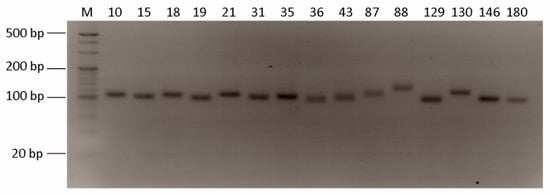
Figure 3.
PCR products of microsatellite in T. loennbergii. M is the 20 bp DNA marker and 4% agarose gel electrophoresis was used. The number is primer pairs order.
4. Conclusions
In the present study, a genome survey was conducted and the estimated genome size of T. loennbergii was reported. Furthermore, microsatellite analysis was performed to study this genome. We found that the genome size was approximately 815.04 Mb, heterozygosity rate was 0.536%, and GC content was 40.65%. In addition, microsatellite motifs analysis showed that the most abundant repeat motifs were di-nucleotide motif and the most abundant repeat type was the AC repeat motif, accounting for 61.57% of the total number of repeats. These findings will be helpful for future studies on population genetics and evolutionary biology of T. loennbergii and related species.
Supplementary Materials
The following are available online at https://www.mdpi.com/article/10.3390/ani11113186/s1, Table S1: List of microsatellite primers of T. loennbergii.
Author Contributions
H.P., Y.-M.C., J.-H.K. and S.J.P. conceived the study. E.C., S.H.K., S.J.L., E.J., J.K. and H.P. performed the genome sequencing, assembly, and analysis. E.C., S.H.K., Y.-M.C. and H.P. wrote the manuscript. All authors contributed to writing and editing the manuscript, collating supplementary information, and creating the figures. All authors have read and agreed to the published version of the manuscript.
Funding
This study was supported by a grant from the project “Ecosystem Structure and Function of Marine Protected Area (MPA) in Antarctica” (PM21060) funded by the Ministry of Oceans and Fisheries (20170336), Korea and a Korea University Grant.
Institutional Review Board Statement
The procedures adopted in this study were performed in accordance with the guidelines of the Animal Welfare Ethical Committee and the Animal Experimental Ethics Committee of the Korea Polar Research Institute (KOPRI, Incheon, Korea).
Data Availability Statement
Data from the T. loennbergii genome project were deposited at NCBI under BioProject number PRJNA610666. The whole-genome sequence was deposited in the Sequence Read Archive (SRA) database under accession number SRX6919726.
Conflicts of Interest
The authors declare that they have no competing interest.
References
- Lautrédou, A.-C.; Hinsinger, D.; Gallut, C.; Cheng, C.-H.; Berkani, M.; Ozouf-Costaz, C.; Cruaud, C.; Lecointre, G.; Dettai, A. Phylogenetic footprints of an Antarctic radiation: The Trematominae (Notothenioidei, Teleostei). Mol. Phylogenet. Evol. 2012, 65, 87–101. [Google Scholar] [CrossRef] [PubMed]
- Lannoo, M.J.; Eastman, J.T. Nervous and sensory system correlates of an epibenthic evolutionary radiation in Antarctic notothenioid fishes, genus Trematomus (Perciformes; Nototheniidae). J. Morphol. 2000, 245, 67–79. [Google Scholar] [CrossRef]
- Near, T.J.; Pesavento, J.J.; Cheng, C.-H.C. Phylogenetic investigations of Antarctic notothenioid fishes (Perciformes: Notothenioidei) using complete gene sequences of the mitochondrial encoded 16S rRNA. Mol. Phylogenet. Evol. 2004, 32, 881–891. [Google Scholar] [CrossRef]
- Clarke, A.; Johnston, I.A. Evolution and adaptive radiation of Antarctic fishes. Trends Ecol. Evol. 1996, 11, 212–218. [Google Scholar] [CrossRef]
- DeVries, A.L.; Cheng, C.H.C. Antifreeze proteins and organismal freezing avoidance in polar fishes. Fish Physiol. 2005, 22, 155–201. [Google Scholar]
- Lautredou, A.-C.; Bonillo, C.; Denys, G.; Cruaud, C.; Ozouf-Costaz, C.; Lecointre, G.; Dettai, A. Molecular taxonomy and identification within the Antarctic genus Trematomus (Notothenioidei, Teleostei): How valuable is barcoding with COI? Polar Sci. 2010, 4, 333–352. [Google Scholar] [CrossRef]
- DeWitt, H.H.; Heemstra, P.C.; Gon, O. Nototheniidae In Fishes of the Southern Ocean; J.L.B. Smith Institute of Ichthyology: Grahamstown, South Africa, 1993; pp. 279–399. [Google Scholar]
- Fishbase. Available online: https://www.fishbase.in/summary/7057 (accessed on 31 October 2021).
- Vacchi, M.; Greco, S.; La Mesa, M. Ichthyological survey by fixed gears in Terra Nova Bay (Antarctica). Fish list and first results. Mem. Biol. Mar. Oceanogr. 1991, 19, 197–202. [Google Scholar]
- La Mesa, M.; Vacchi, M.; Castelli, A.; Diviacco, G. Feeding ecology of two nototheniid fishes, Trematomus hansoni and Trematomus loennbergii, from Terra Nova Bay, Ross Sea. Polar Biol. 1997, 17, 62–68. [Google Scholar] [CrossRef]
- Gemayel, R.; Cho, J.; Boeynaems, S.; Verstrepen, K.J. Beyond junk-variable tandem repeats as facilitators of rapid evolution of regulatory and coding sequences. Genes 2012, 3, 461–480. [Google Scholar] [CrossRef]
- Pérez-Jiménez, M.; Besnard, G.; Dorado, G.; Hernandez, P. Varietal tracing of virgin olive oils based on plastid DNA variation profiling. PLoS ONE 2013, 8, e70507. [Google Scholar] [CrossRef][Green Version]
- Phumichai, C.; Phumichai, T.; Wongkaew, A. Novel chloroplast microsatellite (cpSSR) markers for genetic diversity assessment of cultivated and wild Hevea rubber. Plant Mol. Biol. Rep. 2015, 33, 1486–1498. [Google Scholar] [CrossRef]
- Sambrook, J.; Russell, D.W. Purification of nucleic acids by extraction with phenol: Chloroform. Cold Spring Harb. Protoc. 2006, 2006, pdb.prot4455. [Google Scholar] [CrossRef]
- Marçais, G.; Kingsford, C. A fast, lock-free approach for efficient parallel counting of occurrences of k-mers. Bioinformatics 2011, 27, 764–770. [Google Scholar] [CrossRef] [PubMed]
- Vurture, G.W.; Sedlazeck, F.J.; Nattestad, M.; Underwood, C.J.; Fang, H.; Gurtowski, J.; Schatz, M.C. GenomeScope: Fast reference-free genome profiling from short reads. Bioinformatics 2017, 33, 2202–2204. [Google Scholar] [CrossRef] [PubMed]
- Zimin, A.V.; Marçais, G.; Puiu, D.; Roberts, M.; Salzberg, S.L.; Yorke, J.A. The MaSuRCA genome assembler. Bioinformatics 2013, 29, 2669–2677. [Google Scholar] [CrossRef] [PubMed]
- Meglécz, E.; Pech, N.; Gilles, A.; Dubut, V.; Hingamp, P.; Trilles, A.; Grenier, R.; Martin, J.F. QDD version 3.1: A user-friendly computer program for microsatellite selection and primer design revisited: Experimental validation of variables determining genotyping success rate. Mol. Ecol. Resour. 2014, 14, 1302–1313. [Google Scholar] [CrossRef]
- Li, G.-Q.; Song, L.-X.; Jin, C.-Q.; Li, M.; Gong, S.-P.; Wang, Y.-F. Genome survey and SSR analysis of Apocynum venetum. Biosci. Rep. 2019, 39, BSR20190146. [Google Scholar] [CrossRef]
- Cheung, M.-S.; Down, T.A.; Latorre, I.; Ahringer, J. Systematic bias in high-throughput sequencing data and its correction by BEADS. Nucleic Acids Res. 2011, 39, e103. [Google Scholar] [CrossRef]
- Zhou, W.; Hu, Y.; Sui, Z.; Fu, F.; Wang, J.; Chang, L.; Guo, W.; Li, B. Genome survey sequencing and genetic background characterization of Gracilariopsis lemaneiformis (Rhodophyta) based on next-generation sequencing. PLoS ONE 2013, 8, e69909. [Google Scholar] [CrossRef]
- Shangguan, L.; Han, J.; Kayesh, E.; Sun, X.; Zhang, C.; Pervaiz, T.; Wen, X.; Fang, J. Evaluation of genome sequencing quality in selected plant species using expressed sequence tags. PLoS ONE 2013, 8, e69890. [Google Scholar] [CrossRef][Green Version]
- Jo, E.; Cho, Y.H.; Lee, S.J.; Choi, E.; Kim, J.; Kim, J.-H.; Chi, Y.M.; Park, H. Genome survey and microsatellite motif identification of Poonophryne albipinna. Biosci. Rep. 2021, 41, BSR20210824. [Google Scholar] [CrossRef] [PubMed]
- Kim, B.-M.; Amores, A.; Kang, S.; Ahn, D.-H.; Kim, J.-H.; Kim, I.-C.; Lee, J.H.; Lee, S.G.; Lee, H.; Lee, J.; et al. Antarctic blackfin icefish genome reveals adaptations to extreme environments. Nat. Ecol. Evol. 2019, 3, 469–478. [Google Scholar] [CrossRef]
- Chen, S.; Xu, W.; Liu, Y. Fish genomic research: Decade review and prospect. J. Fish. China 2019, 43, 1–14. [Google Scholar]
- Li, Q.; Li, Z.; Dai, G.; Cao, Y.; Chen, X.; Chen, L.; Shangguan, J.; Ning, Y. Isolation and characterization of eleven microsatellite loci in the marbled rockfish, Sebastiscus marmoratus (Scorpaenidae). Conserv. Genet. Resour. 2014, 6, 53–55. [Google Scholar] [CrossRef]
- Zeng, C.; Gao, Z.; Luo, W.; Liu, X.; Wang, W.; Zhang, X. Characteristics of microsatellites in blunt snout bream (Mega27. lobrama amblycephala) EST sequences using 454 FLX. Acta Hydrobiol. Sin. 2013, 37, 982–988. [Google Scholar]
- Katti, M.V.; Ranjekar, P.K.; Gupta, V.S. Differential Distribution of Simple Sequence Repeats in Eukaryotic Genome Sequences. Mol. Biol. Evol. 2001, 18, 1161–1167. [Google Scholar] [CrossRef] [PubMed]
Publisher’s Note: MDPI stays neutral with regard to jurisdictional claims in published maps and institutional affiliations. |
© 2021 by the authors. Licensee MDPI, Basel, Switzerland. This article is an open access article distributed under the terms and conditions of the Creative Commons Attribution (CC BY) license (https://creativecommons.org/licenses/by/4.0/).