Metagenomic Characterization Reveals Pronounced Seasonality in the Diversity and Structure of the Phyllosphere Bacterial Community in a Mediterranean Ecosystem


 ,
, 
 ,
,
Abstract
1. Introduction
2. Materials and Methods
2.1. Study Site
2.2. Sampling and Sample Processing
2.3. DNA Extraction, Composition and Abundance of Microbial Communities
2.4. Read Processing
2.5. Data Analysis
3. Results
4. Discussion
Supplementary Materials
Author Contributions
Funding
Conflicts of Interest
References
- Vokou, D.; Vareli, K.; Zarali, E.; Karamanoli, K.; Constantinidou, H.-I.A.; Monokrousos, N.; Halley, J.M.; Sainis, I. Exploring biodiversity in the bacterial community of the Mediterranean phyllosphere and its relationship with airborne bacteria. Microb. Ecol. 2012, 64, 714–724. [Google Scholar] [CrossRef]
- Ottesen, A.R.; Gorham, S.; Reed, E.; Newell, M.J.; Ramachandran, P.; Canida, T.; Allard, M.; Evans, P.; Brown, E.; White, J.R. Using a control to better understand phyllosphere microbiota. PLoS ONE 2016, 11, e0163482. [Google Scholar] [CrossRef]
- Martirosyan, V.; Unc, A.; Miller, G.; Doniger, T.; Wachtel, C.; Steinberger, Y. Desert perennial shrubs shape the microbial-community miscellany in laimosphere and phyllosphere space. Microb. Ecol. 2016, 72, 659–668. [Google Scholar] [CrossRef] [PubMed]
- Kembel, S.W.; O’Conner, T.K.; Arnold, H.K.; Hubbell, S.P.; Wright, J.; Green, J.L. Relationships between phyllosphere bacterial communities and plant functional traits in a neotropical forest. Proc. Natl. Acad. Sci. USA 2014, 111, 13715–13720. [Google Scholar] [CrossRef] [PubMed]
- Bringel, F.; Couée, I. Pivotal roles of phyllosphere microorganisms at the interface between functioning and atmospheric trace gas dynamics. Front. Microbiol. 2015, 6, 486. [Google Scholar] [CrossRef] [PubMed]
- Enya, J.; Shinohara, H.; Yoshida, S.; Tsukiboshi, T.; Negishi, H.; Suyama, K.; Tsushima, S. Culturable leaf-associated bacteria on tomato plants and their potential as biological control agents. Microb. Ecol. 2007, 53, 524–536. [Google Scholar] [CrossRef]
- Leff, J.W.; Fierer, N. Bacterial communities associated with the surfaces of fresh fruits and vegetables. PLoS ONE 2013, 8, e0059310. [Google Scholar] [CrossRef]
- Whipps, J.M.; Hand, P.; Pink, D.; Bending, G.D. Phyllosphere microbiology with special reference to diversity and plant genotype. J. Appl. Microbiol. 2008, 105, 1744–1755. [Google Scholar] [CrossRef]
- Fürnkranz, M.; Wanek, W.; Richter, A.; Abell, G.; Rasche, F. Nitrogen fixation by phyllosphere bacteria associated with higher plants and their colonizing epiphytes of a tropical lowland rainforest of Costa Rica. ISME J. 2008, 2, 561–570. [Google Scholar] [CrossRef]
- Vacher, C.; Hampe, A.; Porté, A.J.; Sauer, U.; Company, S.; Morris, C.E. The phyllosphere: Microbial jungle at the plant-climate interface. Annu. Rev. Ecol. Evol. S 2016, 47, 1–24. [Google Scholar] [CrossRef]
- Morris, C.E. Phyllosphere. eLS 2002. [Google Scholar] [CrossRef]
- Bulgarelli, D.; Schlaeppi, K.; Spaepen, S.; van Themaat, E.V.L.; Schulze-Lefert, P. Structure and functions of the bacterial microbiota of plants. Annu. Rev. Plant Biol. 2013, 64, 807–838. [Google Scholar] [CrossRef] [PubMed]
- Barret, M.; Briand, M.; Bonneau, S.; Préveaux, A.; Valière, S.; Bouchez, O.; Hunault, G.; Simoneau, P.; Marie-Agnès Jacques, M.-A. Emergence shapes the structure of the seed-microbiota. Appl. Environ. Microbiol. 2015, 81, 1257–1266. [Google Scholar] [CrossRef] [PubMed]
- Rastogi, G.; Coaker, G.L.; Leveau, J.H.J. New insights into the structure and function of phyllosphere microbiota through high-throughput molecular approaches. FEMS Microbiol. Lett. 2013, 348, 1–10. [Google Scholar] [CrossRef]
- Wilkinson, D.M.; Koumoutsaris, S.; Mitchell, E.A.D.; Bey, I. Modelling the effect of size on the aerial dispersal of microorganisms. J. Biogeogr. 2012, 39, 89–97. [Google Scholar] [CrossRef]
- Lymperopoulou, D.S.; Adams, R.I.; Lindow, S.E. Contribution of vegetation to the microbial composition of nearby outdoor air. Appl. Environ. Microbiol. 2016, 82, 3822–3833. [Google Scholar] [CrossRef]
- Yang, C.H.; Crowley, D.E.; Borneman, J.; Keen, N.T. Microbial phyllosphere populations are more complex than previously realized. Proc. Natl. Acad. Sci. USA 2001, 98, 3889–3894. [Google Scholar] [CrossRef]
- Delmotte, N.; Knief, C.; Chaffron, S.; Innerebner, G.; Roschitzki, B.; Schlapbach, R.; Von Mering, C.; Vorholt, J.A. Community proteogenomics reveals insights into the physiology of phyllosphere bacteria. Proc. Natl. Acad. Sci. USA 2009, 106, 16428–16433. [Google Scholar] [CrossRef]
- Witzel, K.; Neugart, S.; Ruppel, S.; Schreiner, M.; Wiesner, M.; Baldermann, S. Recent progress in the use of ‘omics’ technologies in brassicaceous vegetables. Front. Plant Sci. 2015, 6, 244. [Google Scholar] [CrossRef]
- Kim, M.; Singh, D.; Lai-Hoe, A.; Go, R.; Rahim, R.A.; Ainuddin, A.N.; Chun, J.; Adams, J.M. Distinctive phyllosphere bacterial communities in tropical trees. Microb. Ecol. 2012, 63, 674–681. [Google Scholar] [CrossRef]
- De Costa, D.M.; Rathnayake, R.M.P.S.; De Costa, W.A.J.M.; Kumari, W.M.D.; Dissanayake, D.M.N. Variation of phyllosphere microflora of different rice varieties in Sri Lanka and its relationship to leaf anatomical and physiological characters. J. Agron. Crop Sci. 2006, 192, 209–220. [Google Scholar] [CrossRef]
- Rastogi, G.; Sbodio, A.; Tech, J.J.; Suslow, T.V.; Coaker, G.L.; Leveau, J.H.J.L. Leaf microbiota in an agroecosystem: Spatio-temporal variation in bacterial community composition on field-grown lettuce. ISME J. 2012, 2, 1812–1822. [Google Scholar] [CrossRef] [PubMed]
- Finkel, O.M.; Burch, A.Y.; Lindow, S.E.; Post, A.F.; Belkin, S. Geographical location determines the population structure in phyllosphere microbial communities of a salt-excreting desert tree. Appl. Environ. Microbiol. 2011, 77, 7647–7655. [Google Scholar] [CrossRef]
- Jackson, C.R.; Denney, W.C. Annual and seasonal variation in the phyllosphere bacterial community associated with leaves of the southern magnolia (Magnolia grandiflora). Microb. Ecol. 2011, 61, 113–122. [Google Scholar] [CrossRef]
- Bowers, R.M.; McLetchie, S.; Knight, R.; Fierer, N. Spatial variability in airborne bacterial communities across land-use types and their relationship to the bacterial communities of potential source environments. ISME J. 2011, 5, 601–612. [Google Scholar] [CrossRef]
- Lambais, M.R.; Crowley, D.E.; Cury, J.C.; Büll, R.C.; Rodrigues, R.R. Bacterial diversity in tree canopies of the Atlantic forest. Science 2006, 312, 1917. [Google Scholar] [CrossRef]
- Lambais, M.R.; Barrera, S.E.; Santos, E.C.; Crowley, D.E.; Jumpponen, A. Phyllosphere Metaproteomes of Trees from the Brazilian Atlantic Forest Show High Levels of Functional Redundancy. Microb. Ecol. 2017, 73, 123–134. [Google Scholar] [CrossRef]
- Laforest-Lapointe, I.; Messier, C.; Kembel, S.W. Host species identity, site and time drive temperate tree phyllosphere bacterial community structure. Microbiome 2016, 4, 27. [Google Scholar] [CrossRef]
- Redford, A.J.; Bowers, R.M.; Knight, R.; Linhart, Y.; Fierer, N. The ecology of the phyllosphere: Geographic and phylogenetic variability in the distribution of bacteria on tree leaves. Environ. Microbiol. 2010, 12, 2885–2893. [Google Scholar] [CrossRef]
- Baldotto, L.E.B.; Olivares, F.L. Phylloepiphytic interaction between bacteria and different plant species in a tropical agricultural system. Can. J. Microbiol. 2008, 54, 918–931. [Google Scholar] [CrossRef]
- Peñuelas, J.; Rico, L.; Ogaya, R.; Jump, A.S.; Terradas, J. Summer season and long-term drought increase the richness of bacteria and fungi in the foliar phyllospherem of Quercus ilex in a mixed Mediterranean forest. Plant Biol. 2012, 14, 565–575. [Google Scholar] [CrossRef] [PubMed]
- Yadav, R.K.P.; Halley, J.M.; Karamanoli, K.; Constantinidou, H.I.; Vokou, D. Bacterial populations on the leaves of Mediterranean plants: Quantitative features and testing of distribution models. Environ. Exp. Bot. 2004, 52, 63–77. [Google Scholar] [CrossRef]
- Yadav, R.K.P.; Karamanoli, K.; Vokou, D. Bacterial colonization of the phyllosphere of Mediterranean perennial species as influenced by leaf structural and chemical features. Microb. Ecol. 2005, 50, 185–196. [Google Scholar] [CrossRef] [PubMed]
- Yadav, R.K.P.; Papatheodorou, E.M.; Karamanoli, K.; Constantinidou, H.I.; Vokou, D. Abundance and diversity of the phyllosphere bacterial communities of Mediterranean perennial plants that differ in leaf chemistry. Chemoecology 2008, 18, 217–226. [Google Scholar] [CrossRef]
- Yadav, R.K.P.; Bosabalidis, A.M.; Vokou, D. Leaf structural features of Mediterranean perennial species: Plasticity and life form specificity. J. Biol. Res. 2004, 2, 21–34. [Google Scholar]
- Oakes, M.I.; Kahan, L.; Lake, J. DNA-hybridization electron microscopy: Tertiary structure of 16S rRNA. J. Mol. Biol. 1989, 211, 907–991. [Google Scholar] [CrossRef]
- Hodkinson, B.P.; Lutzoni, F. A microbiotic survey of lichen-associated bacteria reveals a new lineage from the Rhizobiales. Symbiosis 2009, 49, 163–180. [Google Scholar] [CrossRef]
- Borrel, G.; Lehours, A.C.; Crouzet, O.; Jézéquel, D.; Rockne, K.; Kulczak, A.; Duffaud, E.; Joblin, K.; Fonty, G. Stratification of Archaea in the deep sediments of a freshwater meromictic lake: Vertical shift from methanogenic to uncultured archaeal lineages. PLoS ONE 2012, 7, e43346. [Google Scholar] [CrossRef]
- Schloss, P.D.; Westcott, S.L.; Ryabin, T.; Hall, J.R.; Hartmann, M.; Hollister, E.B.; Lesniewski, R.A.; Oakley, B.B.; Parks, D.H.; Robinson, C.J.; et al. Introducing mothur: Open-source, platform-independent, community-supported software for describing and comparing microbial communities. Appl. Environ. Microbiol. 2009, 75, 7537–7541. [Google Scholar] [CrossRef]
- Schloss, P.D.; Gevers, D.; Westcott, S.L. Reducing the effects of PCR amplification and sequencing artifacts on 16S rRNA-based studies. PLoS ONE 2011, 6, e27310. [Google Scholar] [CrossRef]
- Quast, C.; Pruesse, E.; Yilmaz, P.; Gerken, J.; Schweer, T.; Yarza, P.; Peplies, J.; Glöckner, F.O. The SILVA ribosomal RNA gene database project: Improved data processing and web-based tools. Nucl. Acids Res. 2013, 41, D590–D596. [Google Scholar] [CrossRef] [PubMed]
- Edgar, R.C. Search and clustering orders of magnitude faster than BLAST. Bioinformatics 2010, 26, 2460–2461. [Google Scholar] [CrossRef] [PubMed]
- Richards, T.A.; Leonard, G.; Mahé, F.; del Cmpo, J.; Romac, S.; Jones, M.D.M.; Maguire, F.; Dunthorn, M.; De Vargas, C.; Massana, R.; et al. Molecular diversity and distribution of marine fungi across 130 european environmental samples. Proc. R. Soc. B 2015, 282, 20152243. [Google Scholar] [CrossRef] [PubMed]
- Pruesse, E.; Peplies, J.; Glöckner, F.O. SINA: Accurate high-throughput multiple sequence alignment of ribosomal RNA genes. Bioinformatics 2012, 28, 1823–1829. [Google Scholar] [CrossRef]
- Hammer, Ø.; Harper, D.A.T.; Ryan, P.D. PAST: Paleontological statistics software package for education and data analysis. Paleontol. Electron. 2001, 4, 4. [Google Scholar]
- Clarke, K.R.; Gorley, R.N. Primer v6: User Manual/Tutorial; PRIMER-E: Plymouth, UK, 2006. [Google Scholar]
- Clarke, K.R.; Warwick, R.M. Similarity-based testing for community pattern: The two-way layout with no replication. Mar. Biol. 1994, 118, 167–176. [Google Scholar] [CrossRef]
- Galand, P.E.; Casamayor, E.O.; Kirchman, D.L.; Lovejoy, C. Ecology of the rare microbial biosphere of the Arctic Ocean. Proc. Natl. Acad. Sci. USA 2009, 106, 22427–22432. [Google Scholar] [CrossRef]
- Pedrós-Alió, C. The rare bacterial biosphere. Annu. Rev. Mar. Sci. 2012, 4, 449–466. [Google Scholar] [CrossRef]
- Hugoni, M.; Taib, N.; Debroas, D.; Domaizon, I.; Jouan Dufournel, I.; Bronner, G.; Salter, I.; Agogue, H.; Mary, I.; Galand, P.E. Structure of the rare archaeal biosphere and seasonal dynamics of active ecotypes in surface coastal waters. Proc. Natl. Acad. Sci. USA 2013, 11, 6004–6009. [Google Scholar] [CrossRef]
- Levins, R. Evolution in Changing Environments; Princeton University Press: Princeton, NJ, USA, 1968. [Google Scholar]
- Pandit, S.N.; Kolasa, J.; Cottenie, K. Contrasts between habitat generalists and specialists: An empirical extension to the basic metacommunity framework. Ecology 2009, 90, 2253–22562. [Google Scholar] [CrossRef]
- Székely, A.J.; Langenheder, S. The importance of species sorting differs between habitat generalists and specialists in bacterial communities. FEMS Microbiol. Ecol. 2014, 87, 102–112. [Google Scholar] [CrossRef] [PubMed]
- Reshef, D.N.; Reshef, Y.A.; Finucane, H.K.; Grossman, S.R.; McVean, G.; Turnbaugh, P.J.; Lander, E.S.; Mitzenmacher, M.; Sabeti, P.C. Detecting novel associations in large data sets. Science 2011, 334, 1518–1524. [Google Scholar] [CrossRef] [PubMed]
- Smoot, M.E.; Ono, K.; Ruscheinski, J.; Wang, P.L.; Ideker, T. Cytoscape 2.8: New features for data integration and network visualization. Bioinformatics 2011, 27, 431–432. [Google Scholar] [CrossRef] [PubMed]
- Tosadori, G.; Bestvina, I.; Spoto, F.; Laudanna, C.; Scardoni, G. Creating, generating and comparing random network models with Network Randomizer. F1000Research 2016, 5, 2524. [Google Scholar] [CrossRef]
- Horowitz, I.L. Contemporary Earth Science; Amsco School Pubns Inc.: New York, NY, USA, 1976; Available online: https://hypertextbook.com/facts/2000/RachelChu.shtml (accessed on 1 August 2019).
- Steele, J.A.; Countway, P.D.; Xia, L.; Vigil, P.D.; Beman, J.M.; Kim, D.Y.; Chow, C.-E.T.; Sachdeva, R.; Jones, A.C.; Schwalbach, M.S.; et al. Marine bacterial, archaeal and protistan association networks reveal ecological linkages. ISME J. 2011, 5, 1414–1425. [Google Scholar] [CrossRef] [PubMed]
- Xie, W.Y.; Su, J.Q.; Zhu, Y.G. Phyllosphere bacterial community of floating macrophytes in paddy soil environments as revealed by Illumina high-throughput sequencing. Appl. Environ. Microb. 2015, 81, 522–532. [Google Scholar] [CrossRef]
- Lopez-Velasco, G.; Carder, P.A.; Welbaum, G.E.; Ponder, M.A.; Notes, A. Diversity of the spinach (Spinacia oleracea) spermosphere and phyllosphere bacterial communities. FEMS Microbiol. Lett. 2013, 346, 146–154. [Google Scholar] [CrossRef]
- Knief, C.; Ramette, A.; Frances, L.; Alonso-Blanco, C.; Vorholt, J.A. Site and plant species are important determinants of the Methylobacterium community composition in the plant phyllosphere. ISME J. 2010, 4, 719–728. [Google Scholar] [CrossRef]
- Unterseher, M.; Jumpponen, A.; Öpik, M.; Tedersoo, L.; Moora, M.; Dormann, C.F.; Schnittler, M. Species abundance distributions and richness estimations in fungal meagenomics—Lessons learned from community ecology. Mol. Ecol. 2011, 20, 275–285. [Google Scholar] [CrossRef]
- Constantinidou, H.A.; Hirano, S.S.; Baker, L.S.; Upper, C.D. Atmospheric dispersal of ice nucleation-active bacteria: The role of rain. Phytopathology 1990, 80, 934–937. [Google Scholar] [CrossRef]
- Vorholt, J.A. Microbial life in the phyllosphere. Nat. Rev. Microbiol. 2012, 10, 828–840. [Google Scholar] [CrossRef] [PubMed]
- Copeland, J.K.; Yuan, L.; Layeghifard, M.; Wang, P.; Guttman, D. Seasonal community succession of the phyllosphere microbiome. Mol. Plant Microbe Interact. 2015, 28, 274–285. [Google Scholar] [CrossRef] [PubMed]
- Maignien, L.; DeForce, E.A.; Chafee, M.E.; Eren, A.M.; Simmons, S.L. Ecological succession and stochastic variation in the assembly of Arabidopsis thaliana phyllosphere communities. mBIO 2014, 5, e00682-13. [Google Scholar] [CrossRef] [PubMed]
- Grégoire, P.; Bohli, M.; Cayol, J.L.; Joseph, M.; Guasco, S.; Dubourg, K.; Cambar, J.; Michotey, V.; Bonin, P.; Fardeau, M.L.; et al. Caldilinea tarbellica sp. nov., a filamentous, thermophilic, anaerobic bacterium isolated from a deep hot aquifer in the Aquitaine Basin. Int. J. Syst. Evol. Microbiol. 2011, 61, 1436–1441. [Google Scholar] [CrossRef] [PubMed]
- Xia, Y.; Wang, Y.; Wang, Y.; Chin, F.Y.L.; Zhang, T. Cellular adhesiveness and cellulolytic capacity in Anaerolineae revealed by omics-based genome interpretation. Biotechnol. Biofuels 2016, 69, 111. [Google Scholar] [CrossRef] [PubMed]
- Ruiz Pérez, C.A.; Restrepo, S.; Zambrano, M.M. Microbial and functional diversity within the phyllosphere of Espeletia sp. in an Andean high mountain ecosystem. Appl. Environ. Microbiol. 2016, 82, 1807–1817. [Google Scholar] [CrossRef]
- Dunne, J.A.; Williams, R.J.; Martinez, N.D. Network structure and biodiversity loss in food webs: Robustness increases with connectance. Ecol. Lett. 2002, 5, 558–567. [Google Scholar] [CrossRef]
- Tilman, D.; Lehman, C.; Thompson, K. Plant diversity and ecosystem productivity: Theoretical considerations. Proc. Natl. Acad. Sci. USA 1997, 94, 1857–1861. [Google Scholar] [CrossRef]
- Mitter, B.; Pfaffenbichler, N.; Sessitsch, A. Plant-microbe partnerships in 2020. Microb. Biotechnol. 2016, 9, 635–640. [Google Scholar] [CrossRef]


| Attribute | Summer | Winter | d.f. | t-Value | p-Value | |
|---|---|---|---|---|---|---|
| Bacterial 16S rRNA gene copies g−1 plant tissue | 2.3 ± 0.52 (× 108) | 8.8 ± 4.32 (× 108) | 8 | −1.57 | 0.15 | ns |
| Number of OTUs per sample (OTU richness) | 233.8 ± 22.39 | 146.0 ± 10.85 | 8 | 3.91 | 0.004 | ** |
| Number of OTUs in only one sample | 30.4 ± 5.62 | 8.9 ± 1.52 | 8 | 3.48 | 0.01 | ** |
| Simpson (1-D) index | 0.9 ± 0.02 | 0.9 ± 0.02 | 8 | 1.40 | 0.19 | ns |
| Shannon (H) index | 3.6 ± 0.18 | 2.9 ± 0.15 | 8 | 2.44 | 0.04 | * |
| Pielou’s Evenness (J) index | 0.68 ± 0.02 | 0.59 ± 0.03 | 8 | 2.67 | 0.01 | ** |
| Bacterial 16S rRNA gene copies m−3 air | 2.45 × 10⁶ | 1.72 × 10⁶ | ||||
| Bacterial 16S rRNA gene copies g−1 air | 1.96 × 10³ | 1.38 × 10³ | ||||
| Type of Bacterial OTUs | Number | Relative Overall Contribution (%) | Relative within Group Contribution (%) |
|---|---|---|---|
| OTUs in the database (after normalization) | 890 | ||
| OΤUS in the phyllosphere | 869 | 98 | |
| OTUs in the air | 157 | 18 | |
| Abundant OTUs (>1% of all reads) | 15 | 2 | |
| Rare OTUs (<0.1% of all reads) | 794 | 89 | |
| Generalist OTUs based on the Levins’ index | 10 | 1 | |
| Specialist OTUs based on the Levins’ index | 788 | 89 | |
| OTUs on leaves in summer | 750 | 84 | 86 1 |
| OTUs on leaves in winter | 420 | 47 | 48 1 |
| OTUs in the air in summer | 128 | 14 | 81 2 |
| OTUs in the air in winter | 86 | 10 | 55 2 |
| Abundant OTUs on leaves (>1% of all reads) | 14 | 2 | 2 1 |
| Rare OTUs on leaves (<0.1% of all reads) | 770 | 87 | 89 1 |
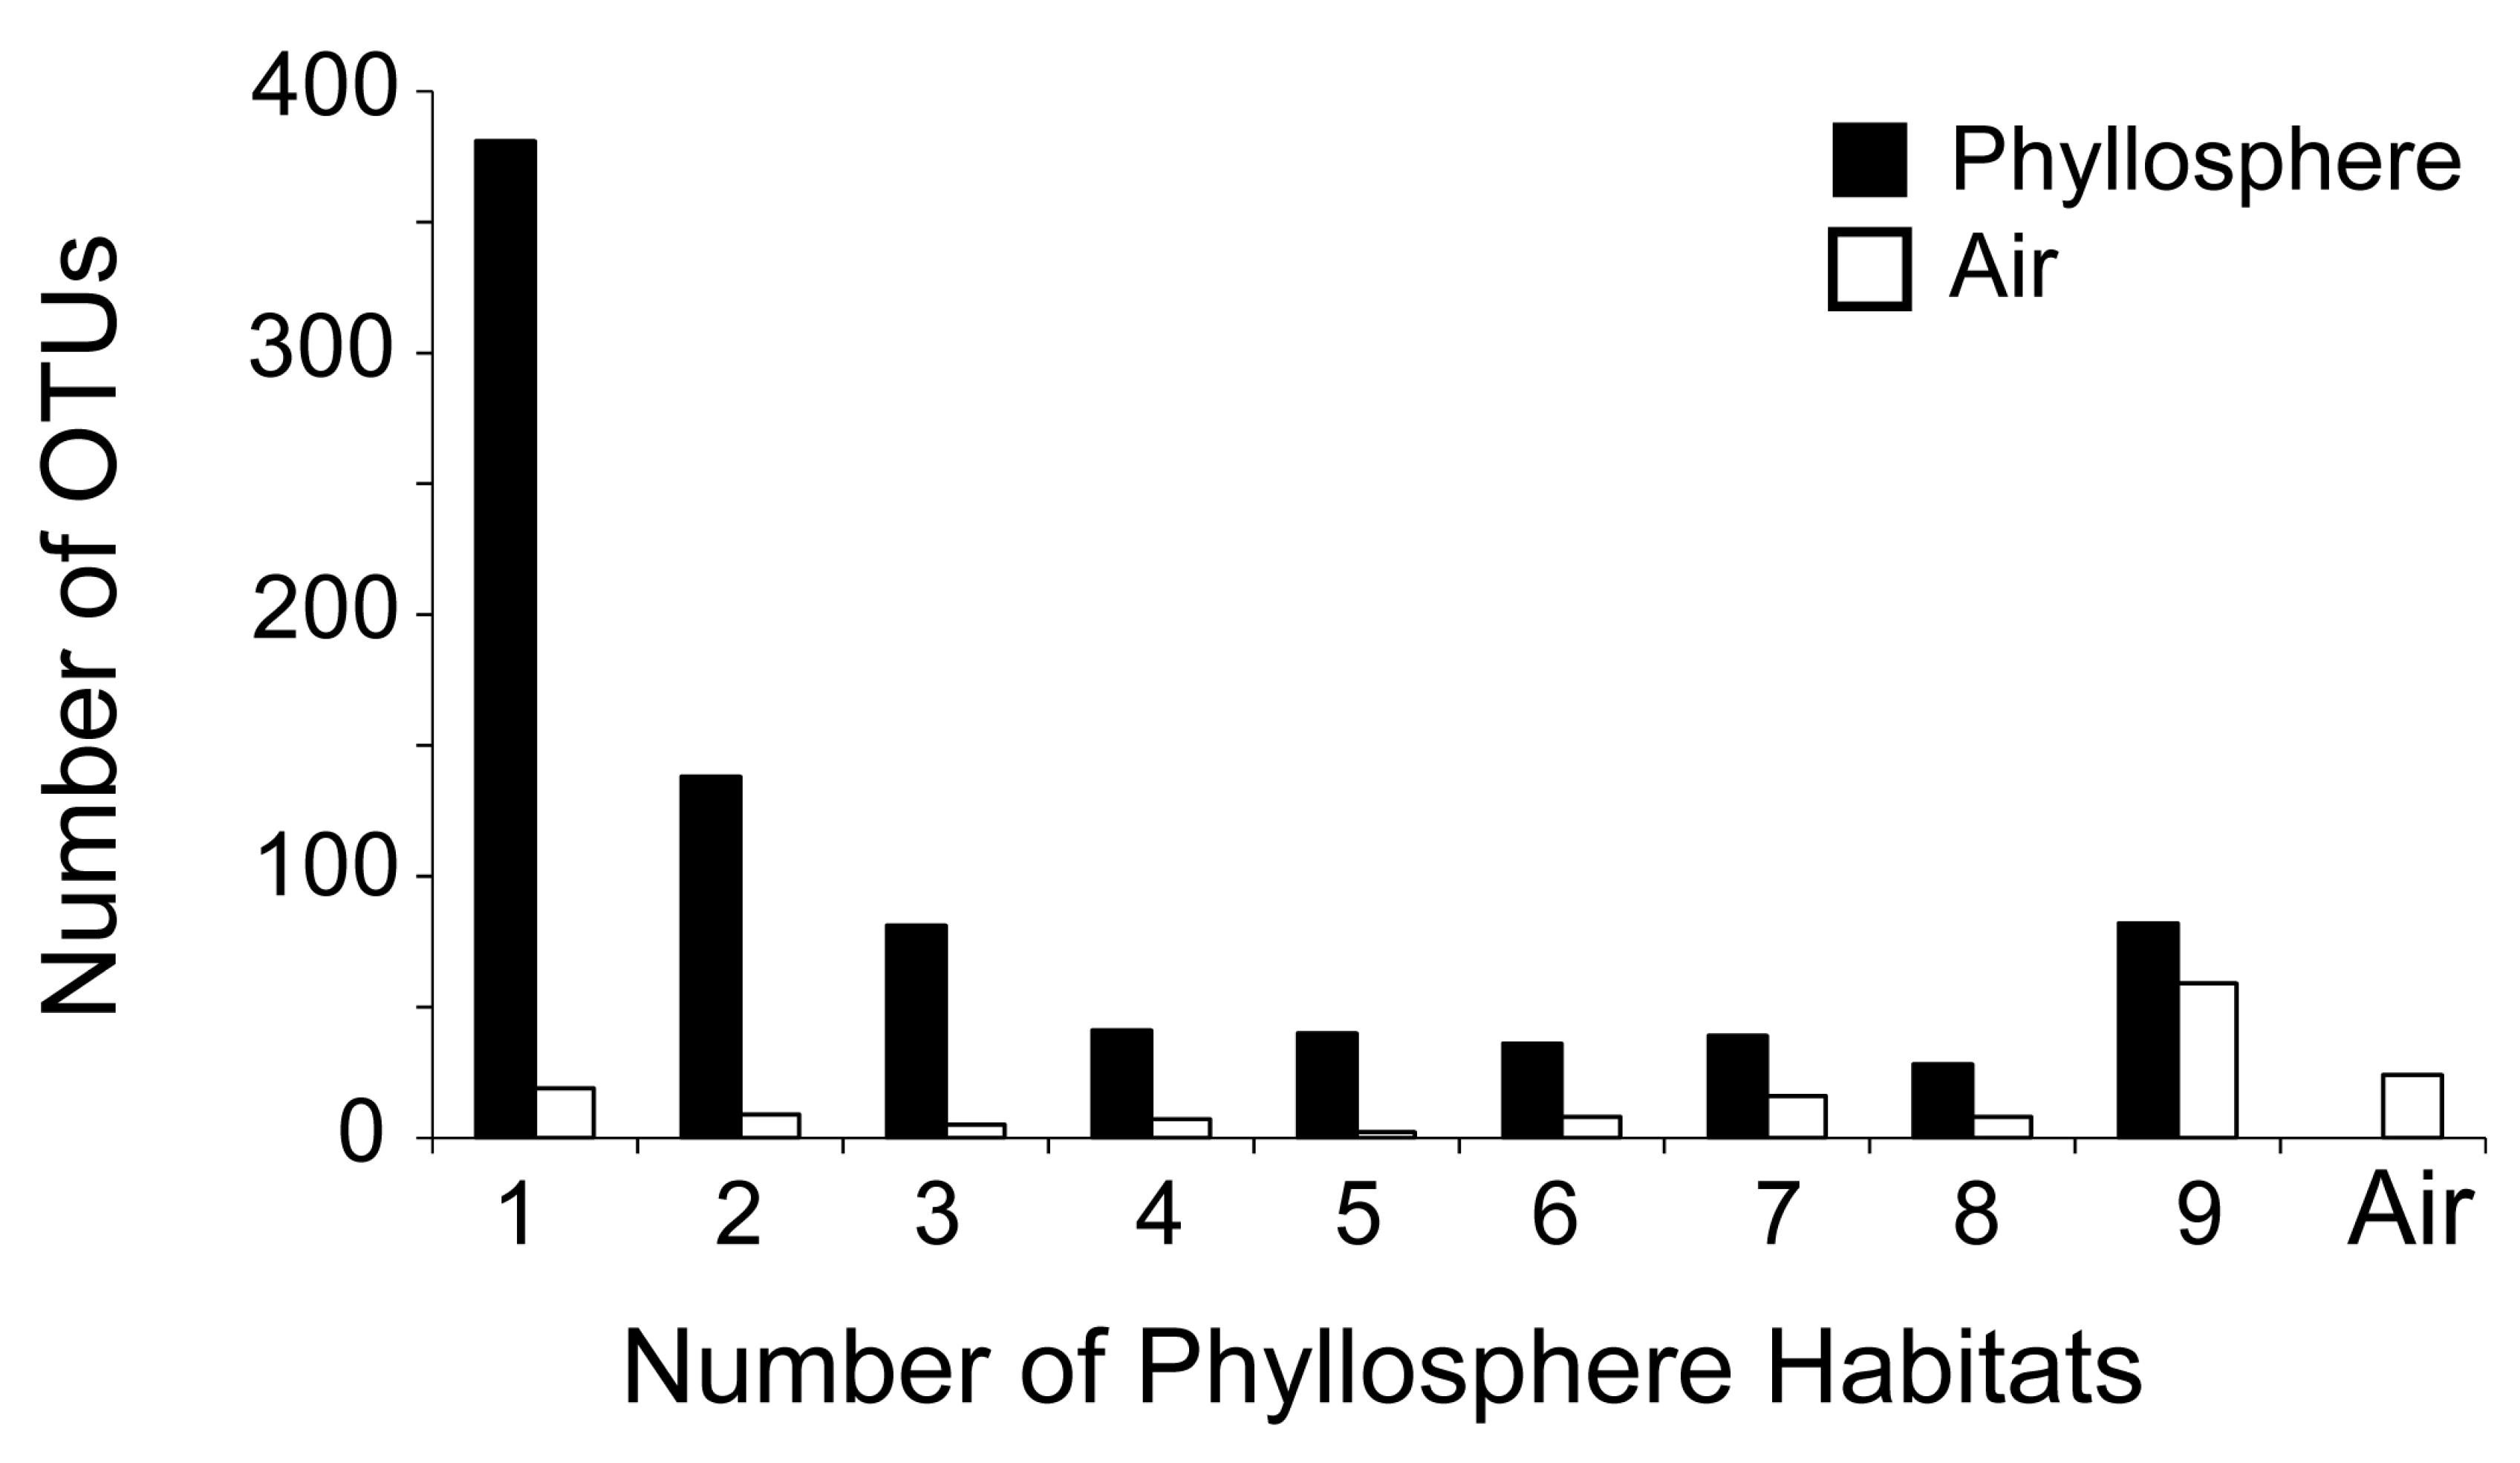
| OTUs on all habitats (species) (universal OTUs) | 82 | 9 | 9 1 |
| OTUs on only one habitat (species) | 381 | 43 | 44 1 |
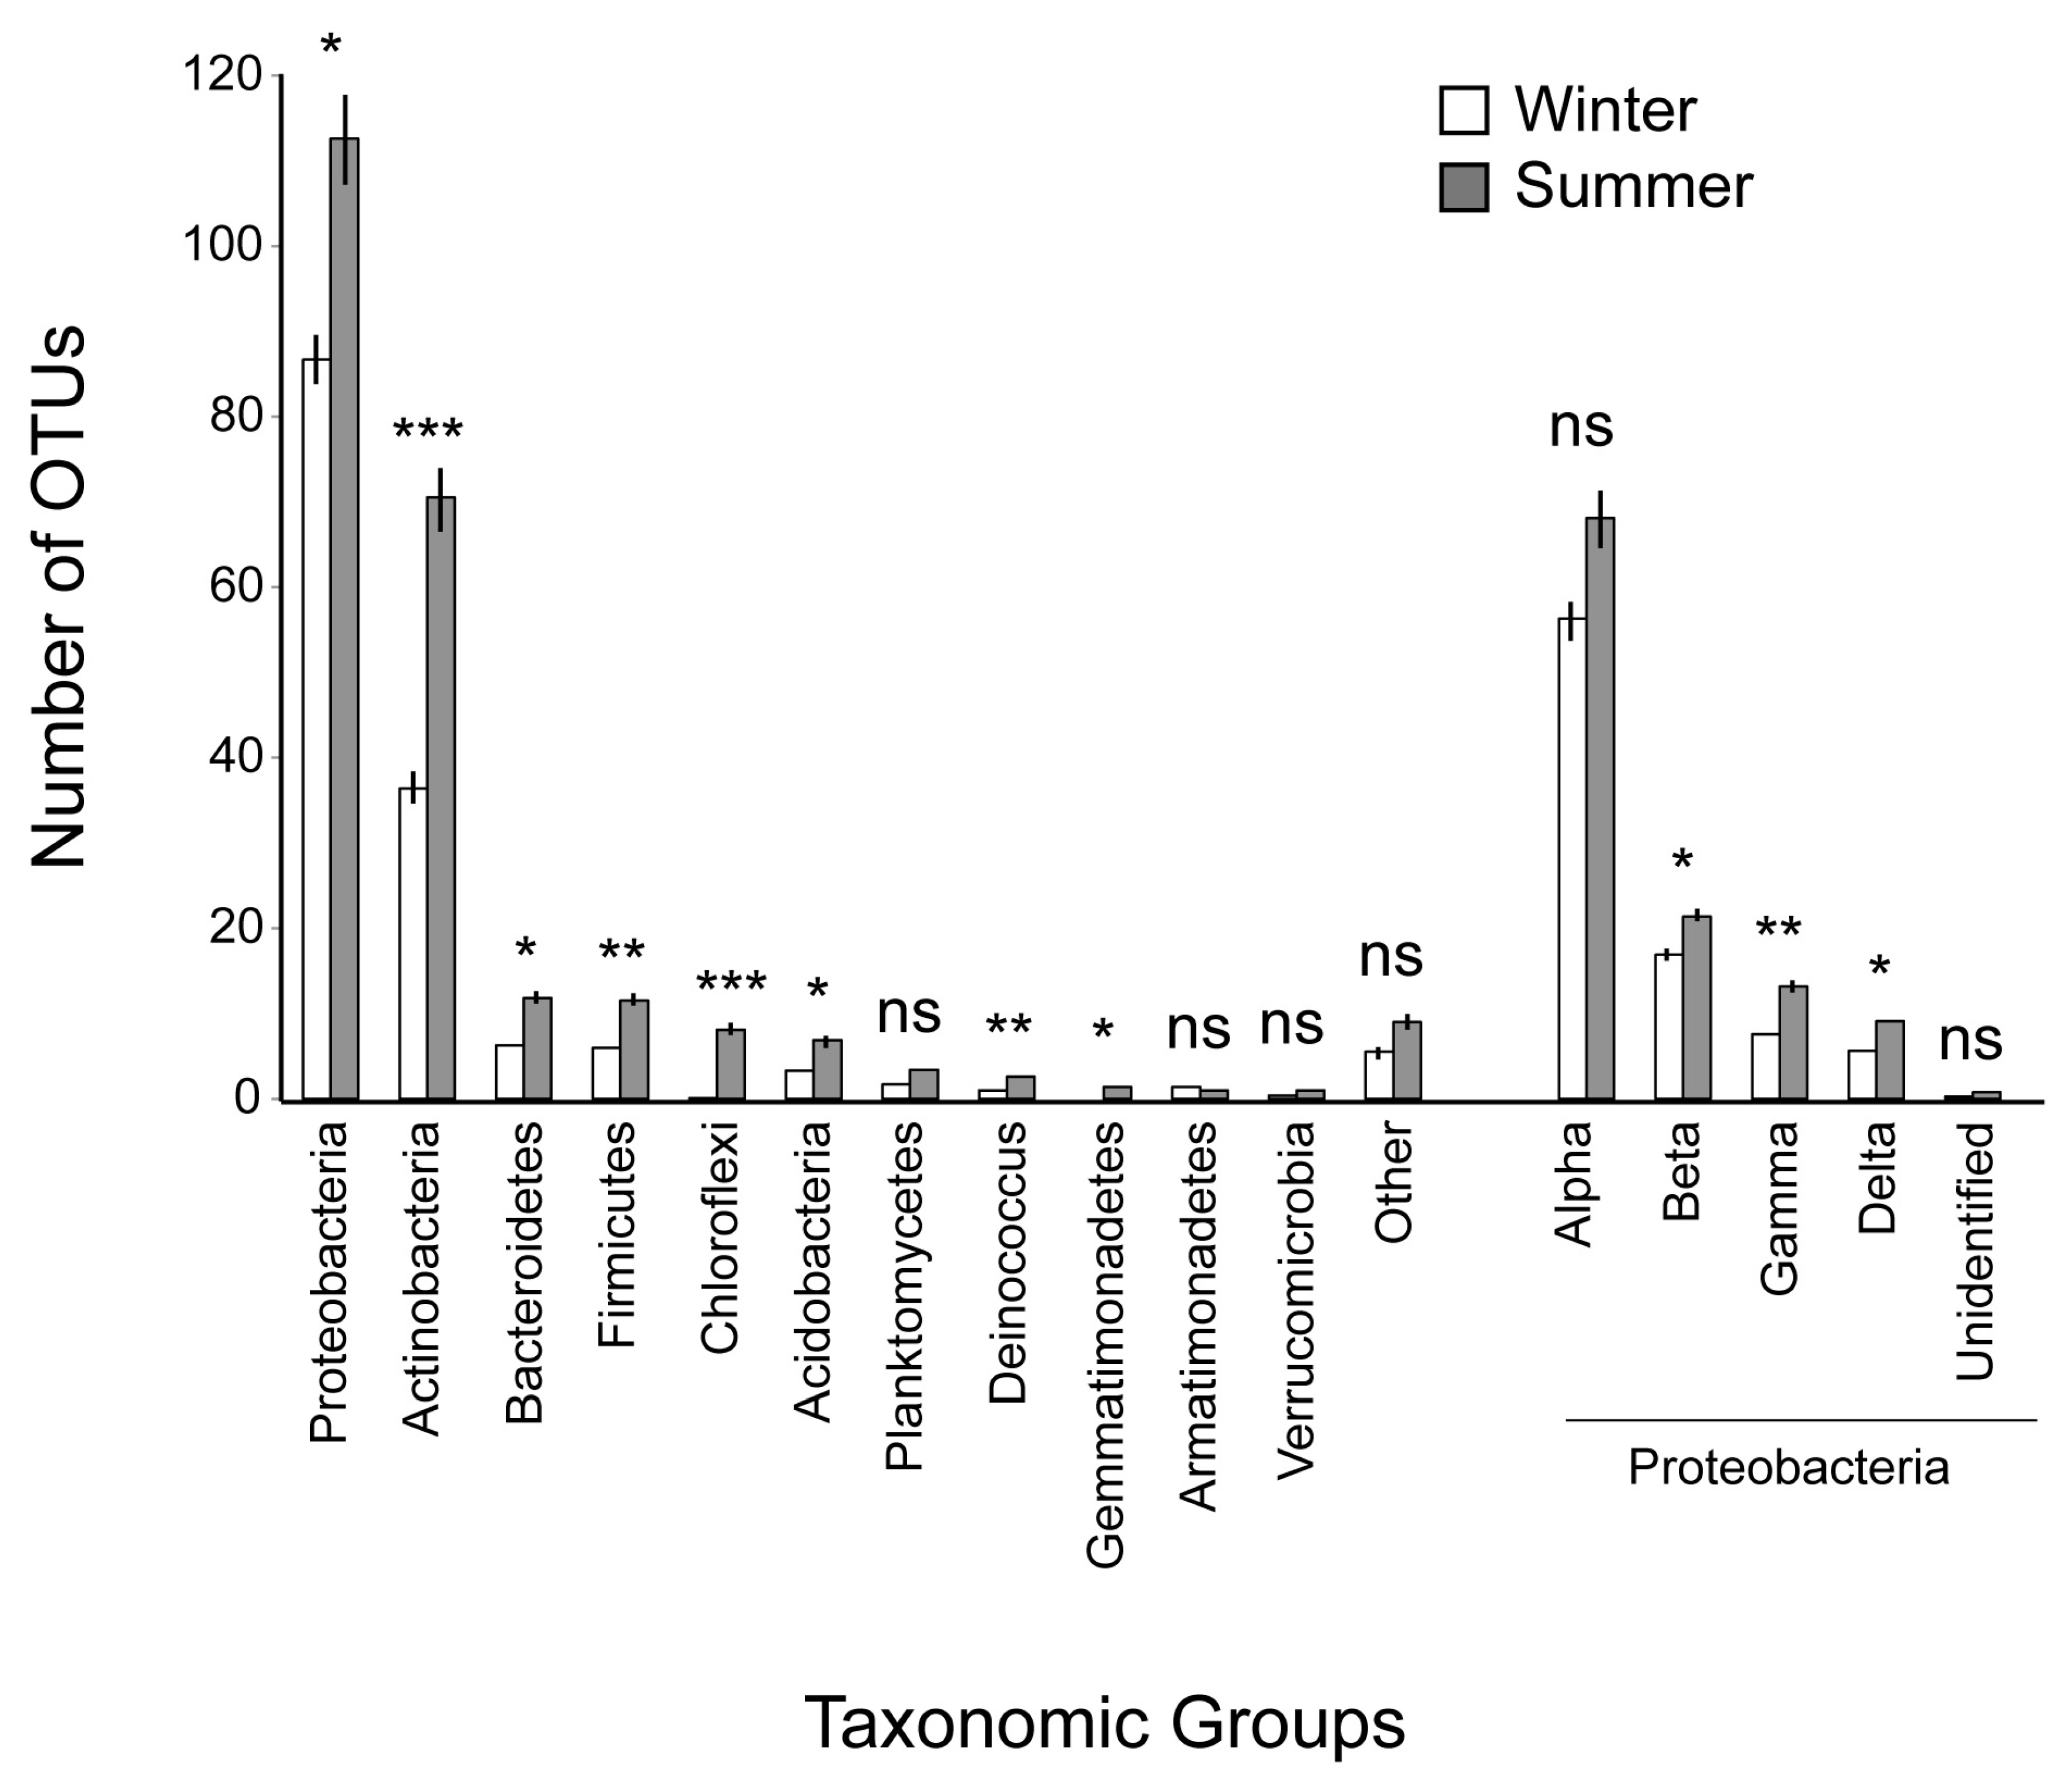
| Bacterial Group | OTU Abundance | |||||
|---|---|---|---|---|---|---|
| Summer | Winter | df | t-Value | p-Value | ||
| Proteobacteria | 2870.9 ± 218.80 | 3371.9 ± 290.7 | 8 | −1.54 | 0.16 | ns |
| Actinobacteria | 1543.8 ± 160.20 | 1126.6 ± 272.2 | 8 | 1.59 | 0.149 | ns |
| Firmicutes | 87.2 ± 22.47 | 17.0 ± 4.4 | 8 | 3.12 | 0.014 | * |
| Bacteroidetes | 80.9 ± 11.63 | 286.2 ± 257.1 | 8 | −0.789 | 0.45 | ns |
| Acidobacteria | 18.2 ± 4.81 | 62.3 ± 20.2 | 8 | −2.23 | 0.055 | ns |
| Deinococcus | 34.6 ± 24.14 | 7.6 ± 4.8 | 8 | 1.12 | 0.29 | ns |
| Chloroflexi | 29.1 ± 7.57 | 0.1 ± 0.1 | 8 | 3.82 | 0.005 | ** |
| Planctomycetes | 7.8 ± 1.31 | 10.6 ± 6.5 | 8 | −0.41 | 0.69 | ns |
| Gemmatimonadetes | 2.3 ± 0.85 | 0 | 8 | 2.55 | 0.03 | * |
| Armatimonadetes | 0.2 ± 0.24 | 0.6 ± 0.5 | 8 | −0.8 | 0.44 | ns |
| Verrucomicrobia | 0.1 ± 0.11 | 0.2 ± 0.2 | 8 | −1 | 0.35 | ns |
| Other | 66.9 ± 24.73 | 31.9 ± 11.1 | 8 | 1.41 | 0.19 | ns |
| Proteobacteria classes | ||||||
| Alphaproteobacteria | 1750.7 ± 167.37 | 2761.7 ± 257.5 | 8 | −3.39 | 0.009 | ** |
| Betaproteobacteria | 759.4 ± 135.77 | 369.8 ± 120.9 | 8 | 2.16 | 0.046 | * |
| Gammaproteobacteria | 304.7 ± 157.91 | 212.0 ± 102.3 | 8 | 0.94 | 0.37 | ns |
| Deltaproteobacteria | 54.8 ± 12.72 | 28.3 ± 9.2 | 8 | 2.064 | 0.07 | ns |
| Unidentified | 1.3 ± 0.48 | 0.1 ± 0.1 | 8 | 2.81 | 0.022 | * |
| Orders | Phyllosphere | Air | ||
|---|---|---|---|---|
| Number of OTUs | Rank by Number of OTUs | Number of OTUs | Rank by Number of OTUs | |
| Rhizobiales | 89 | 1 | 18 | 1 |
| Rhodospirillales | 57 | 2 | 6 | 8 |
| Micrococcales | 53 | 3 | 12 | 4 |
| Sphingomonadales | 48 | 4 | 14 | 3 |
| Burkholderiales | 47 | 5 | 16 | 2 |
| Propionibacteriales | 44 | 6 | 10 | 6 |
| Rhodobacterales | 36 | 7 | 3 | 12 |
| Myxococcales | 25 | 8 | 1 | |
| Bacillales | 25 | 8 | 7 | 7 |
| Cytophagales | 24 | 10 | 2 | |
| Flavobacteriales | 22 | 11 | 11 | 5 |
| Frankiales | 21 | 12 | 5 | 9 |
| Acidimicrobiales | 18 | 13 | 0 | |
| Plantkomycetales | 16 | 14 | 0 | |
| Caulobacterales | 14 | 15 | 2 | |
| Corynebacteriales | 14 | 15 | 4 | 10 |
| Enterobacteriales | 14 | 15 | 4 | 10 |
| OTUs | Putative Affiliation | Presence and Local Abundance in the Air and the Phyllosphere Samples | |||||||||
|---|---|---|---|---|---|---|---|---|---|---|---|
| Air | Quercus coccifera | Arbutus unedo | Phillyrea latifolia | Pistacia lentiscus | Myrtus communis | Calamintha nepeta | Cistus incanus | Lavandula stoechas | Melissa officinalis | ||
| Abundant | |||||||||||
| OTU003 | Alphaproteobacteria Methylobacterium sp.1 | + | + | + | + | + | + | √ | + | + | + |
| OTU004 | Alphaproteobacteria Sphingomonas faeni | + | + | + | + | + | + | + | + | + | √ |
| OTU005 | Alphaproteobacteria Rhizobiales | + | + | √ | + | + | √ | + | √ | √ | + |
| OTU007 * | Gammaproteobacteria Pseudomonas sp. | + | √ | + | + | + | + | √ | √ | + | √ |
| OTU008 | Actinobacteria Friedmanniella sp. | + | + | + | + | √ | + | + | + | + | + |
| OTU009 | Betaproteobacteria Hydrogenophaga sp. | √ | + | + | + | + | + | + | + | √ | + |
| OTU012 | Actinobacteria Amnibacterium sp. | + | √ | + | + | + | + | + | + | + | + |
| OTU013 | Actinobacteria Propionibacterium acne | √ | + | + | + | + | + | + | + | √ | + |
| OTU020 * | Bacteroidetes Chryseobacterium sp. | + | + | + | + | + | + | + | + | + | √ |
| OTU023 | Alphaproteobacteria Rhizobiales | + | + | + | + | + | √ | + | + | + | + |
| OTU024 | Alphaproteobacteria Methylobacterium sp.2 | + | + | + | + | + | + | + | + | + | √ |
| OTU033 * | Betaproteobacteria Ralstonia pickettii S | √ | + | + | + | + | + | + | + | √ | √ |
| OTU041 * | Gammaproteobacteria Buchnera aphidicola | + | + | + | + | + | + | √ | + | √ | + |
| OTU045 * | Actinobacteria Kineococcus sp. | + | + | + | √ | + | + | + | + | + | + |
| OTU072 * | Firmicutes Tumebacillus sp. | √ | + | + | + | + | √ | + | + | √ | √ |
| Universal OTUs, Generalists | |||||||||||
| OTU001 | Alphaproteobacteria Sphingomonas sp.1 | + | + | + | + | + | + | + | + | + | + |
| OTU003 | Alphaproteobacteria Methylobacterium sp.1 | + | + | + | + | + | + | √ | + | + | + |
| OTU006 | Actinobacteria Frigoribacterium sp. | + | + | + | + | + | + | + | + | + | + |
| OTU010 | Alphaproteobacteria Sphingomonas sp.2 | + | + | + | + | + | + | + | + | + | + |
| OTU016 | Actinobacteria Curtobacterium flaccumfaciens | + | + | + | + | + | + | + | + | + | + |
| OTU021 | Alphaproteobacteria Acetobacteraceae | + | + | + | + | + | + | + | + | + | + |
| OTU026 | Actinobacteria Kineococcus sp. | + | + | + | + | + | + | + | + | + | + |
| OTU040 | Alphaproteobacteria Rhizobium sp. | + | + | + | + | + | + | + | + | + | + |
| OTU042 | Alphaproteobacteria Roseomonas aerophila | + | + | + | + | + | + | + | + | + | + |
| OTU152 # | Alphaproteobacteria Methylobacterium sp.2 # | + | + | + | + | + | + | + | + | + | |
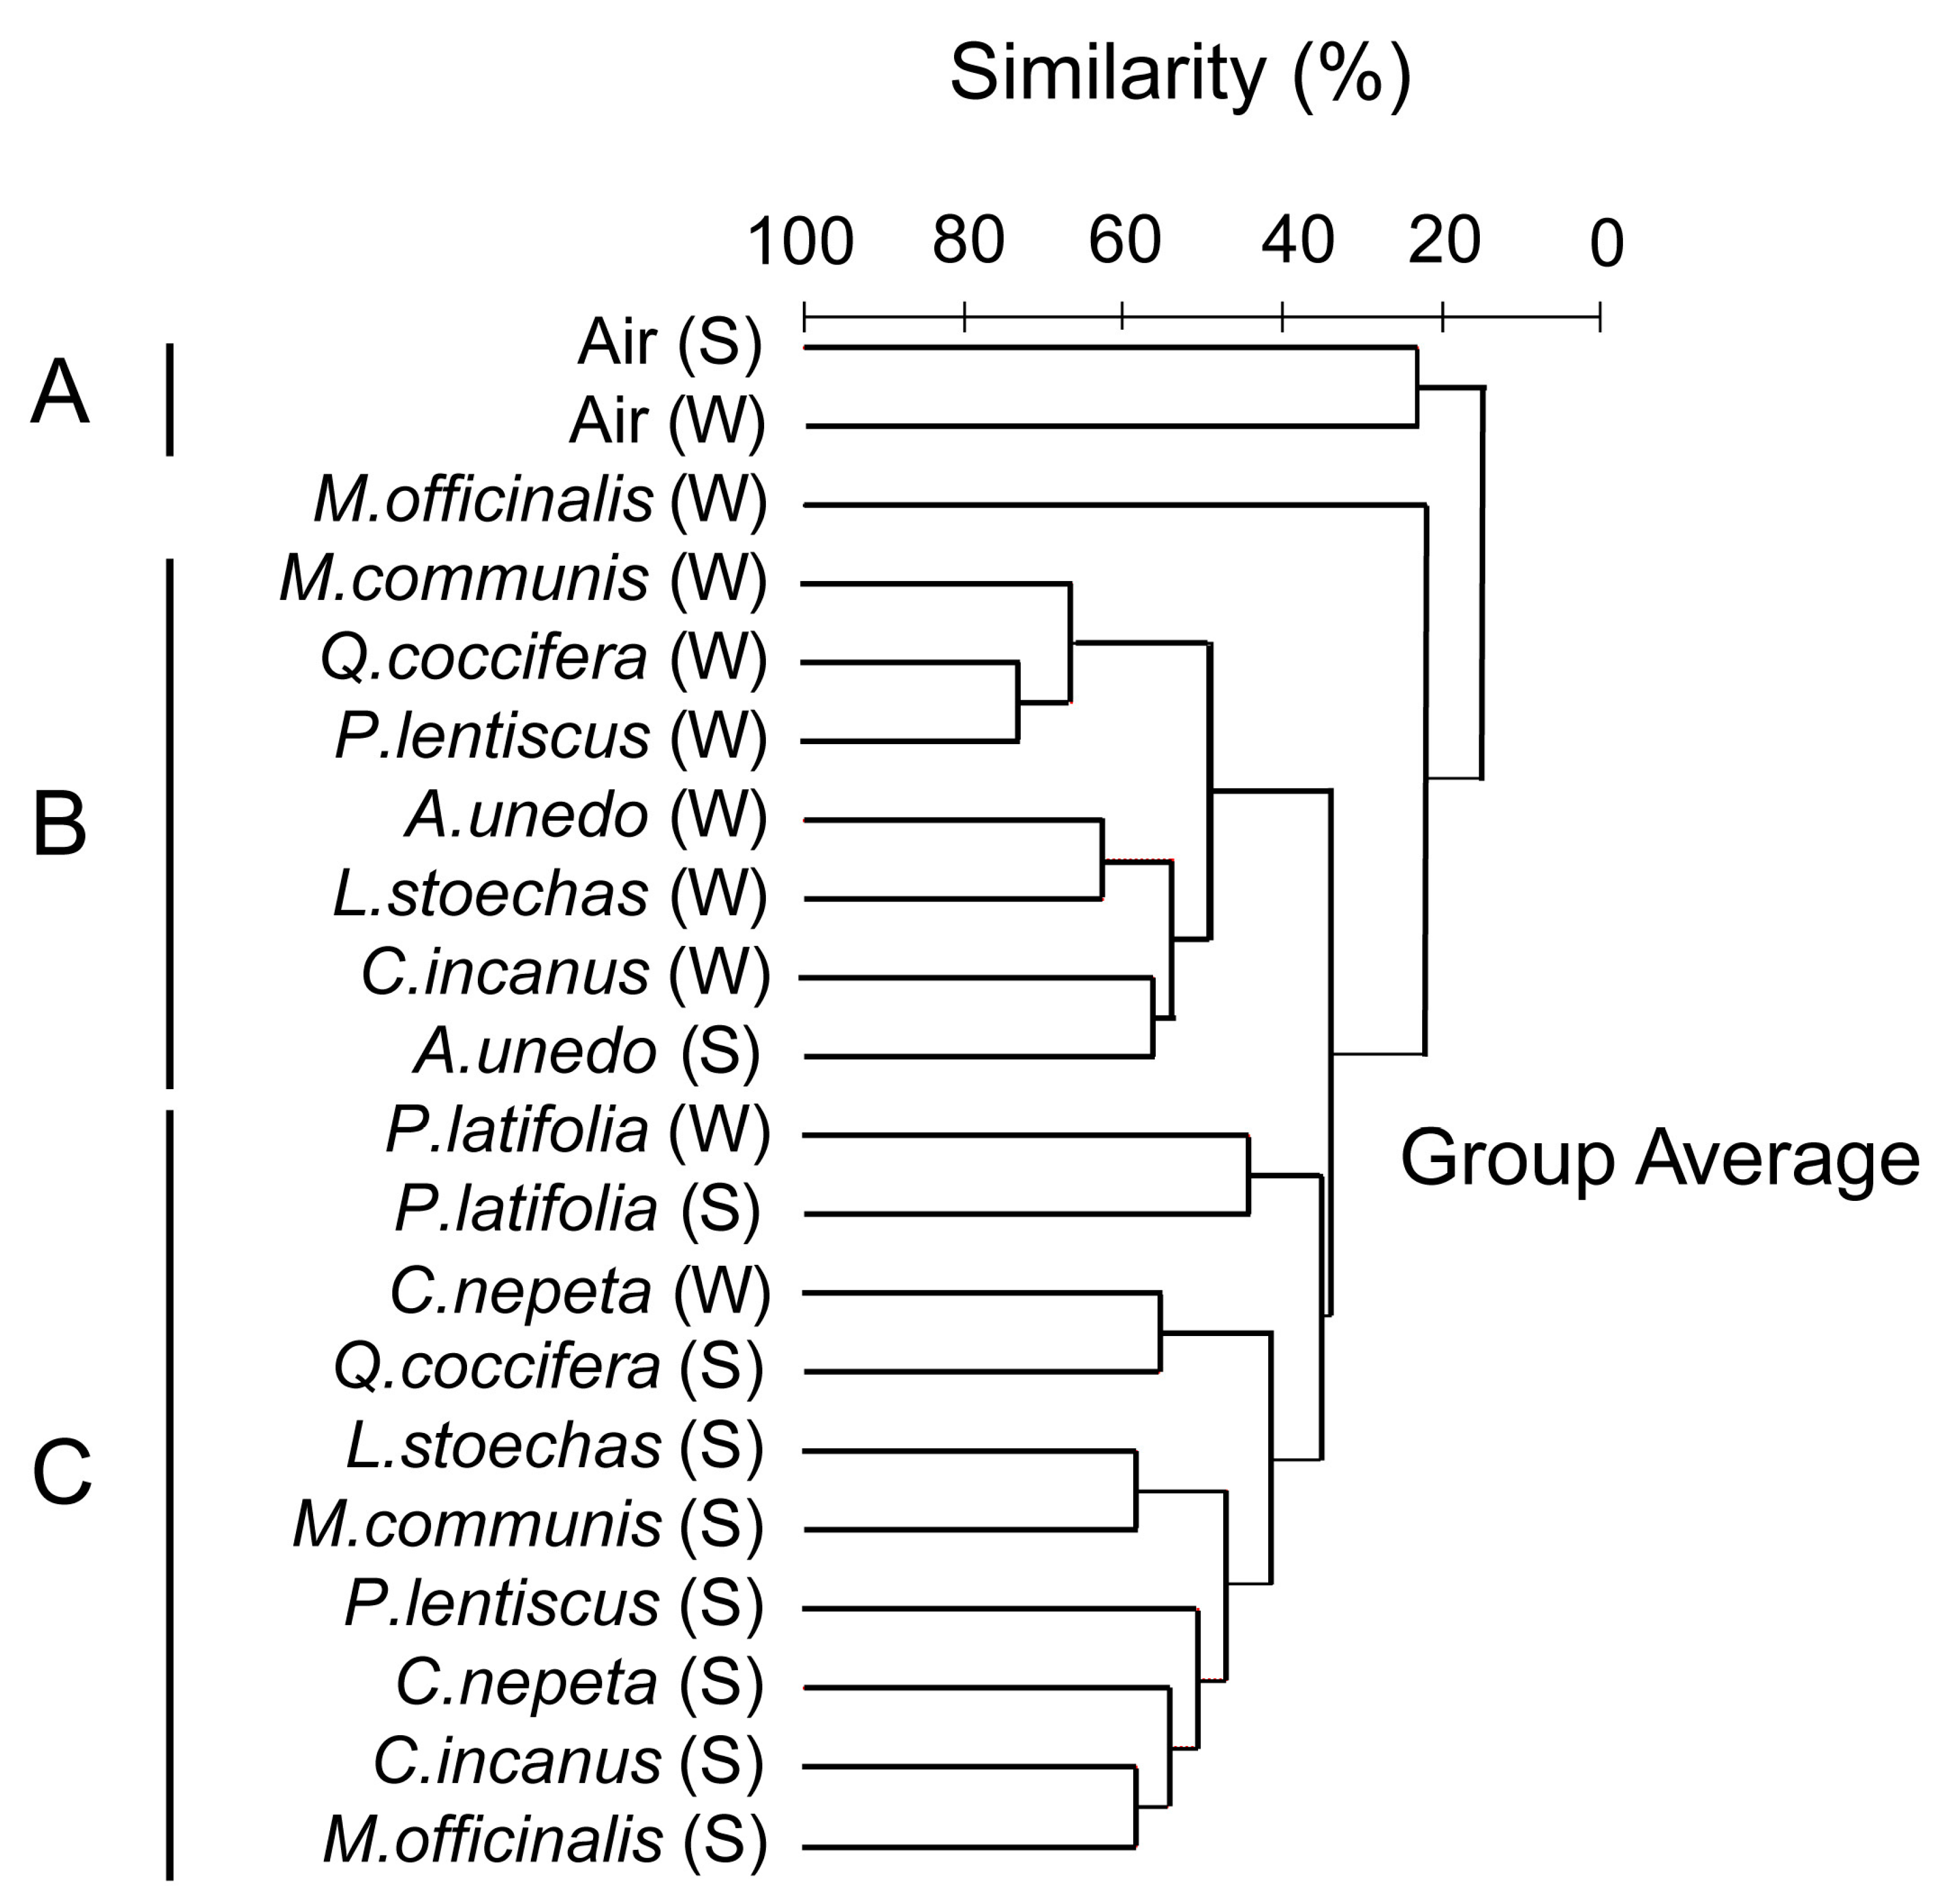
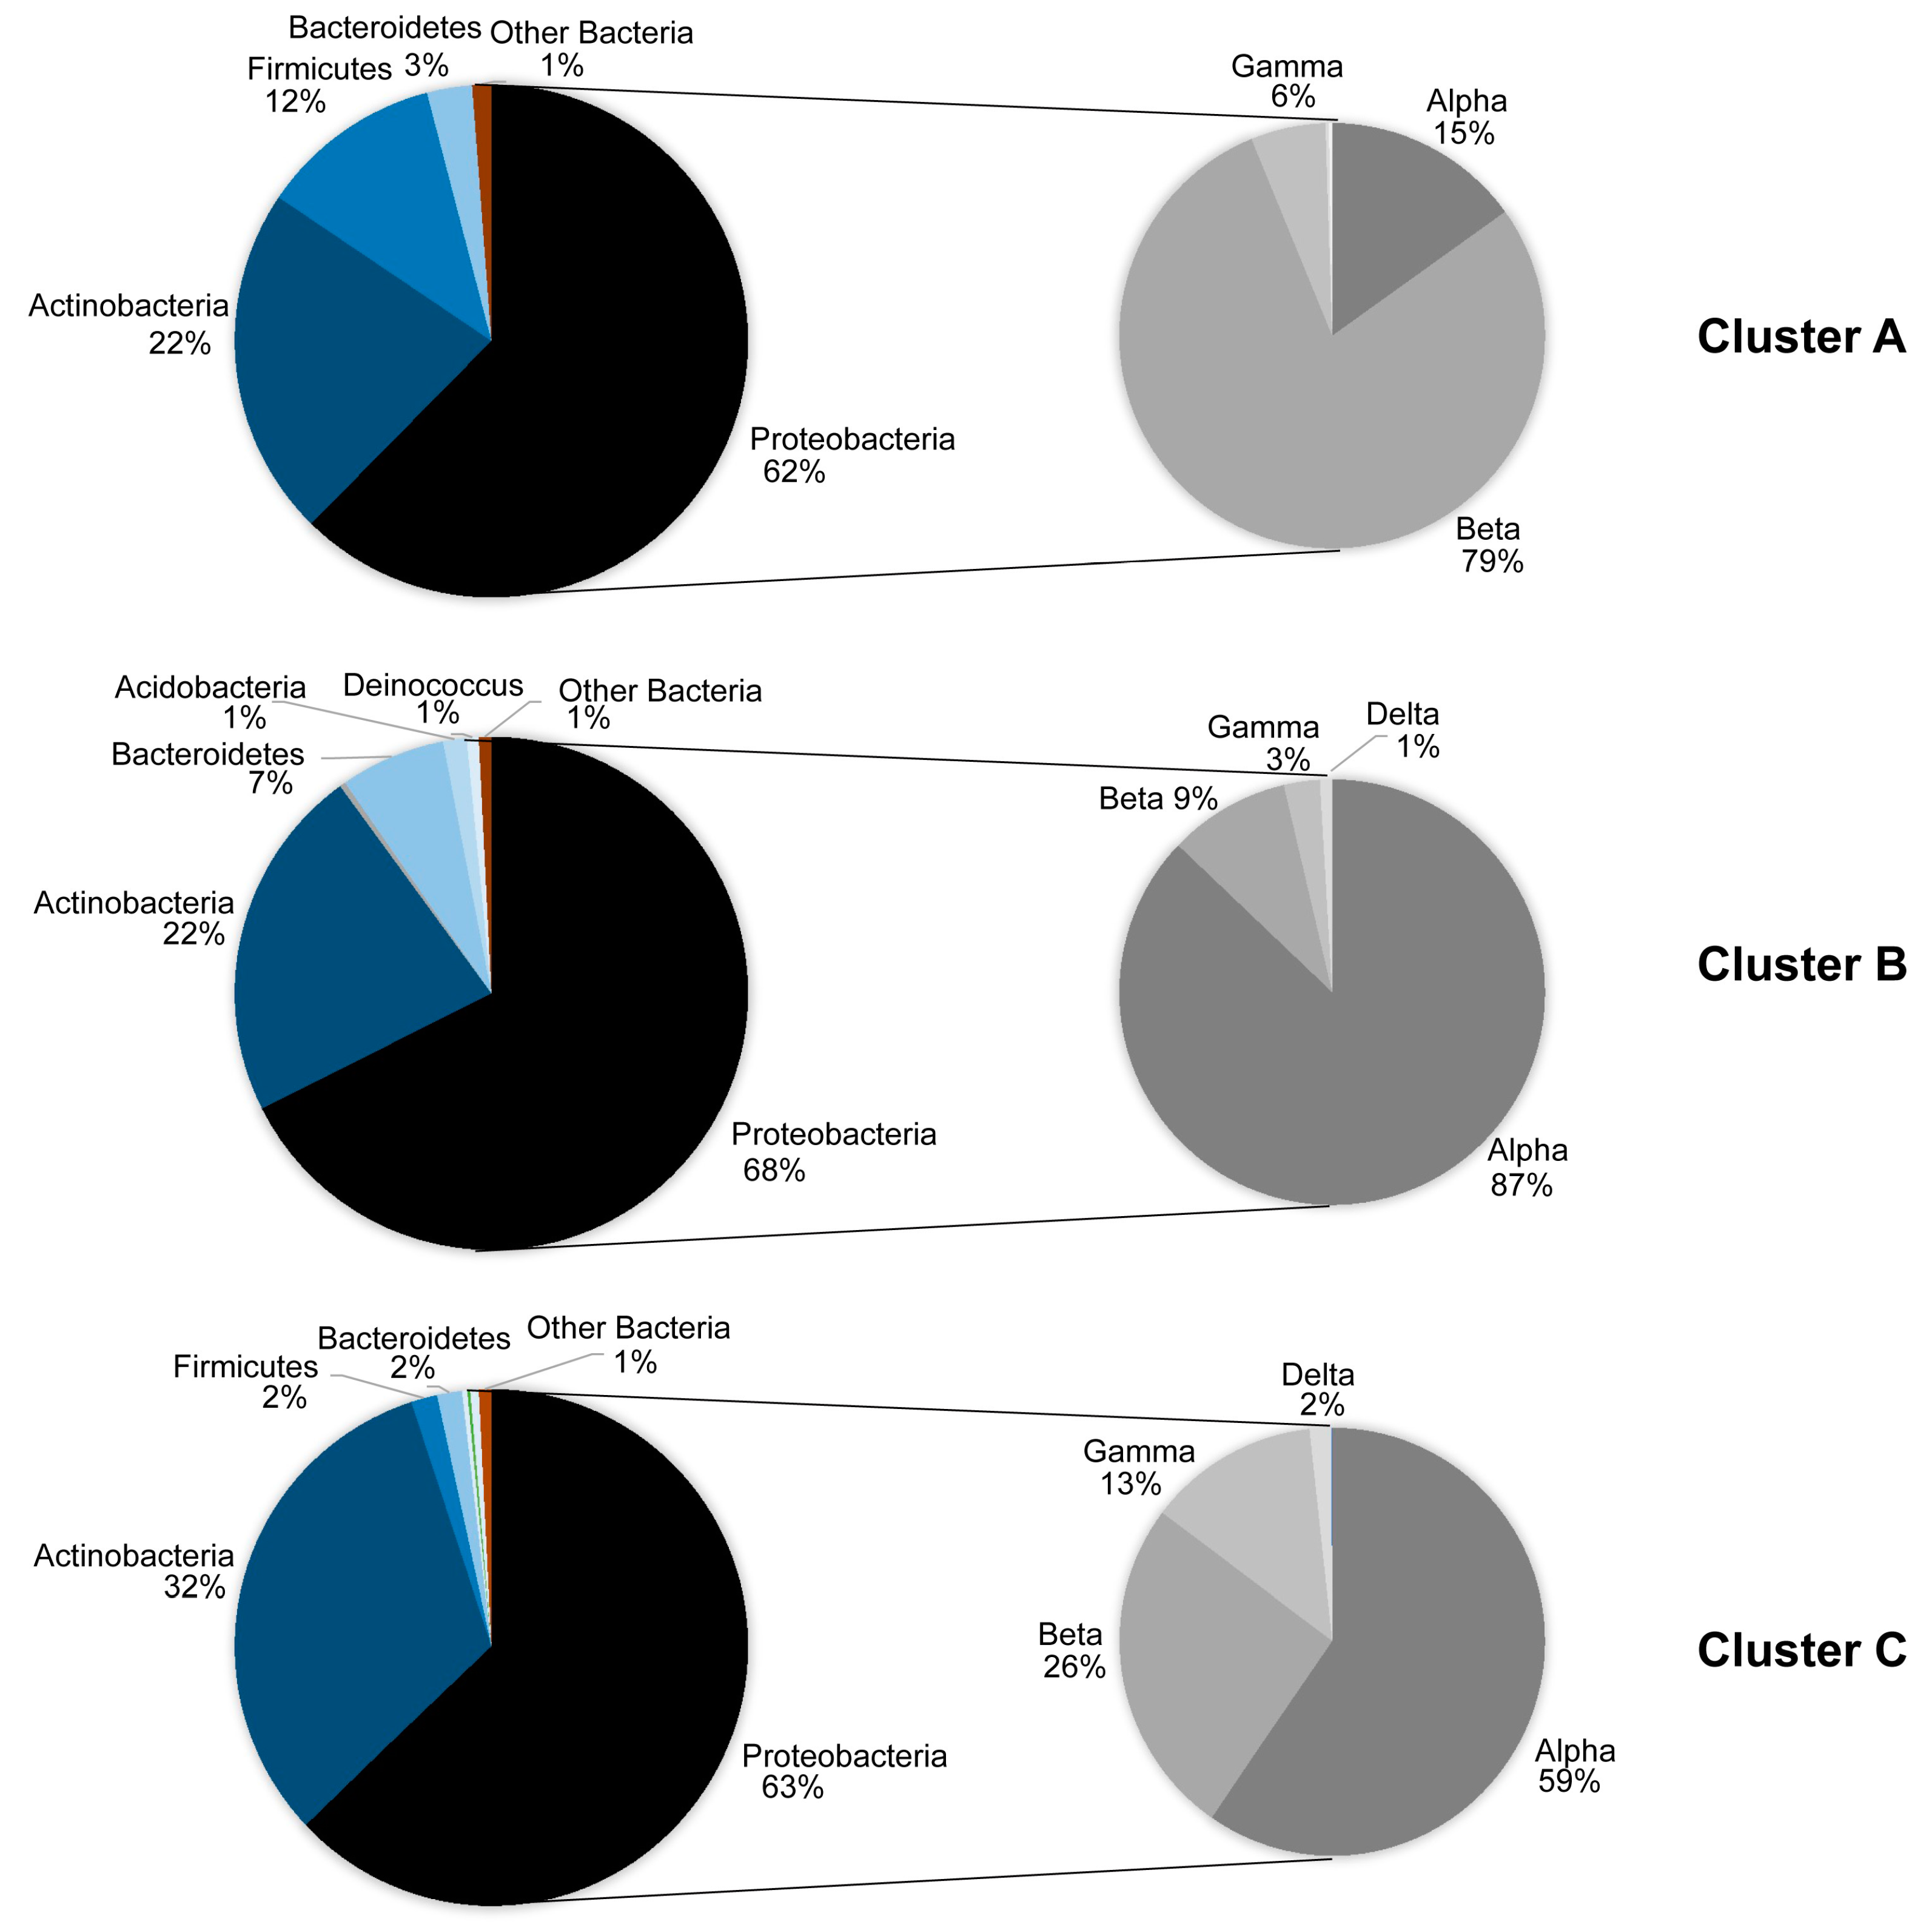
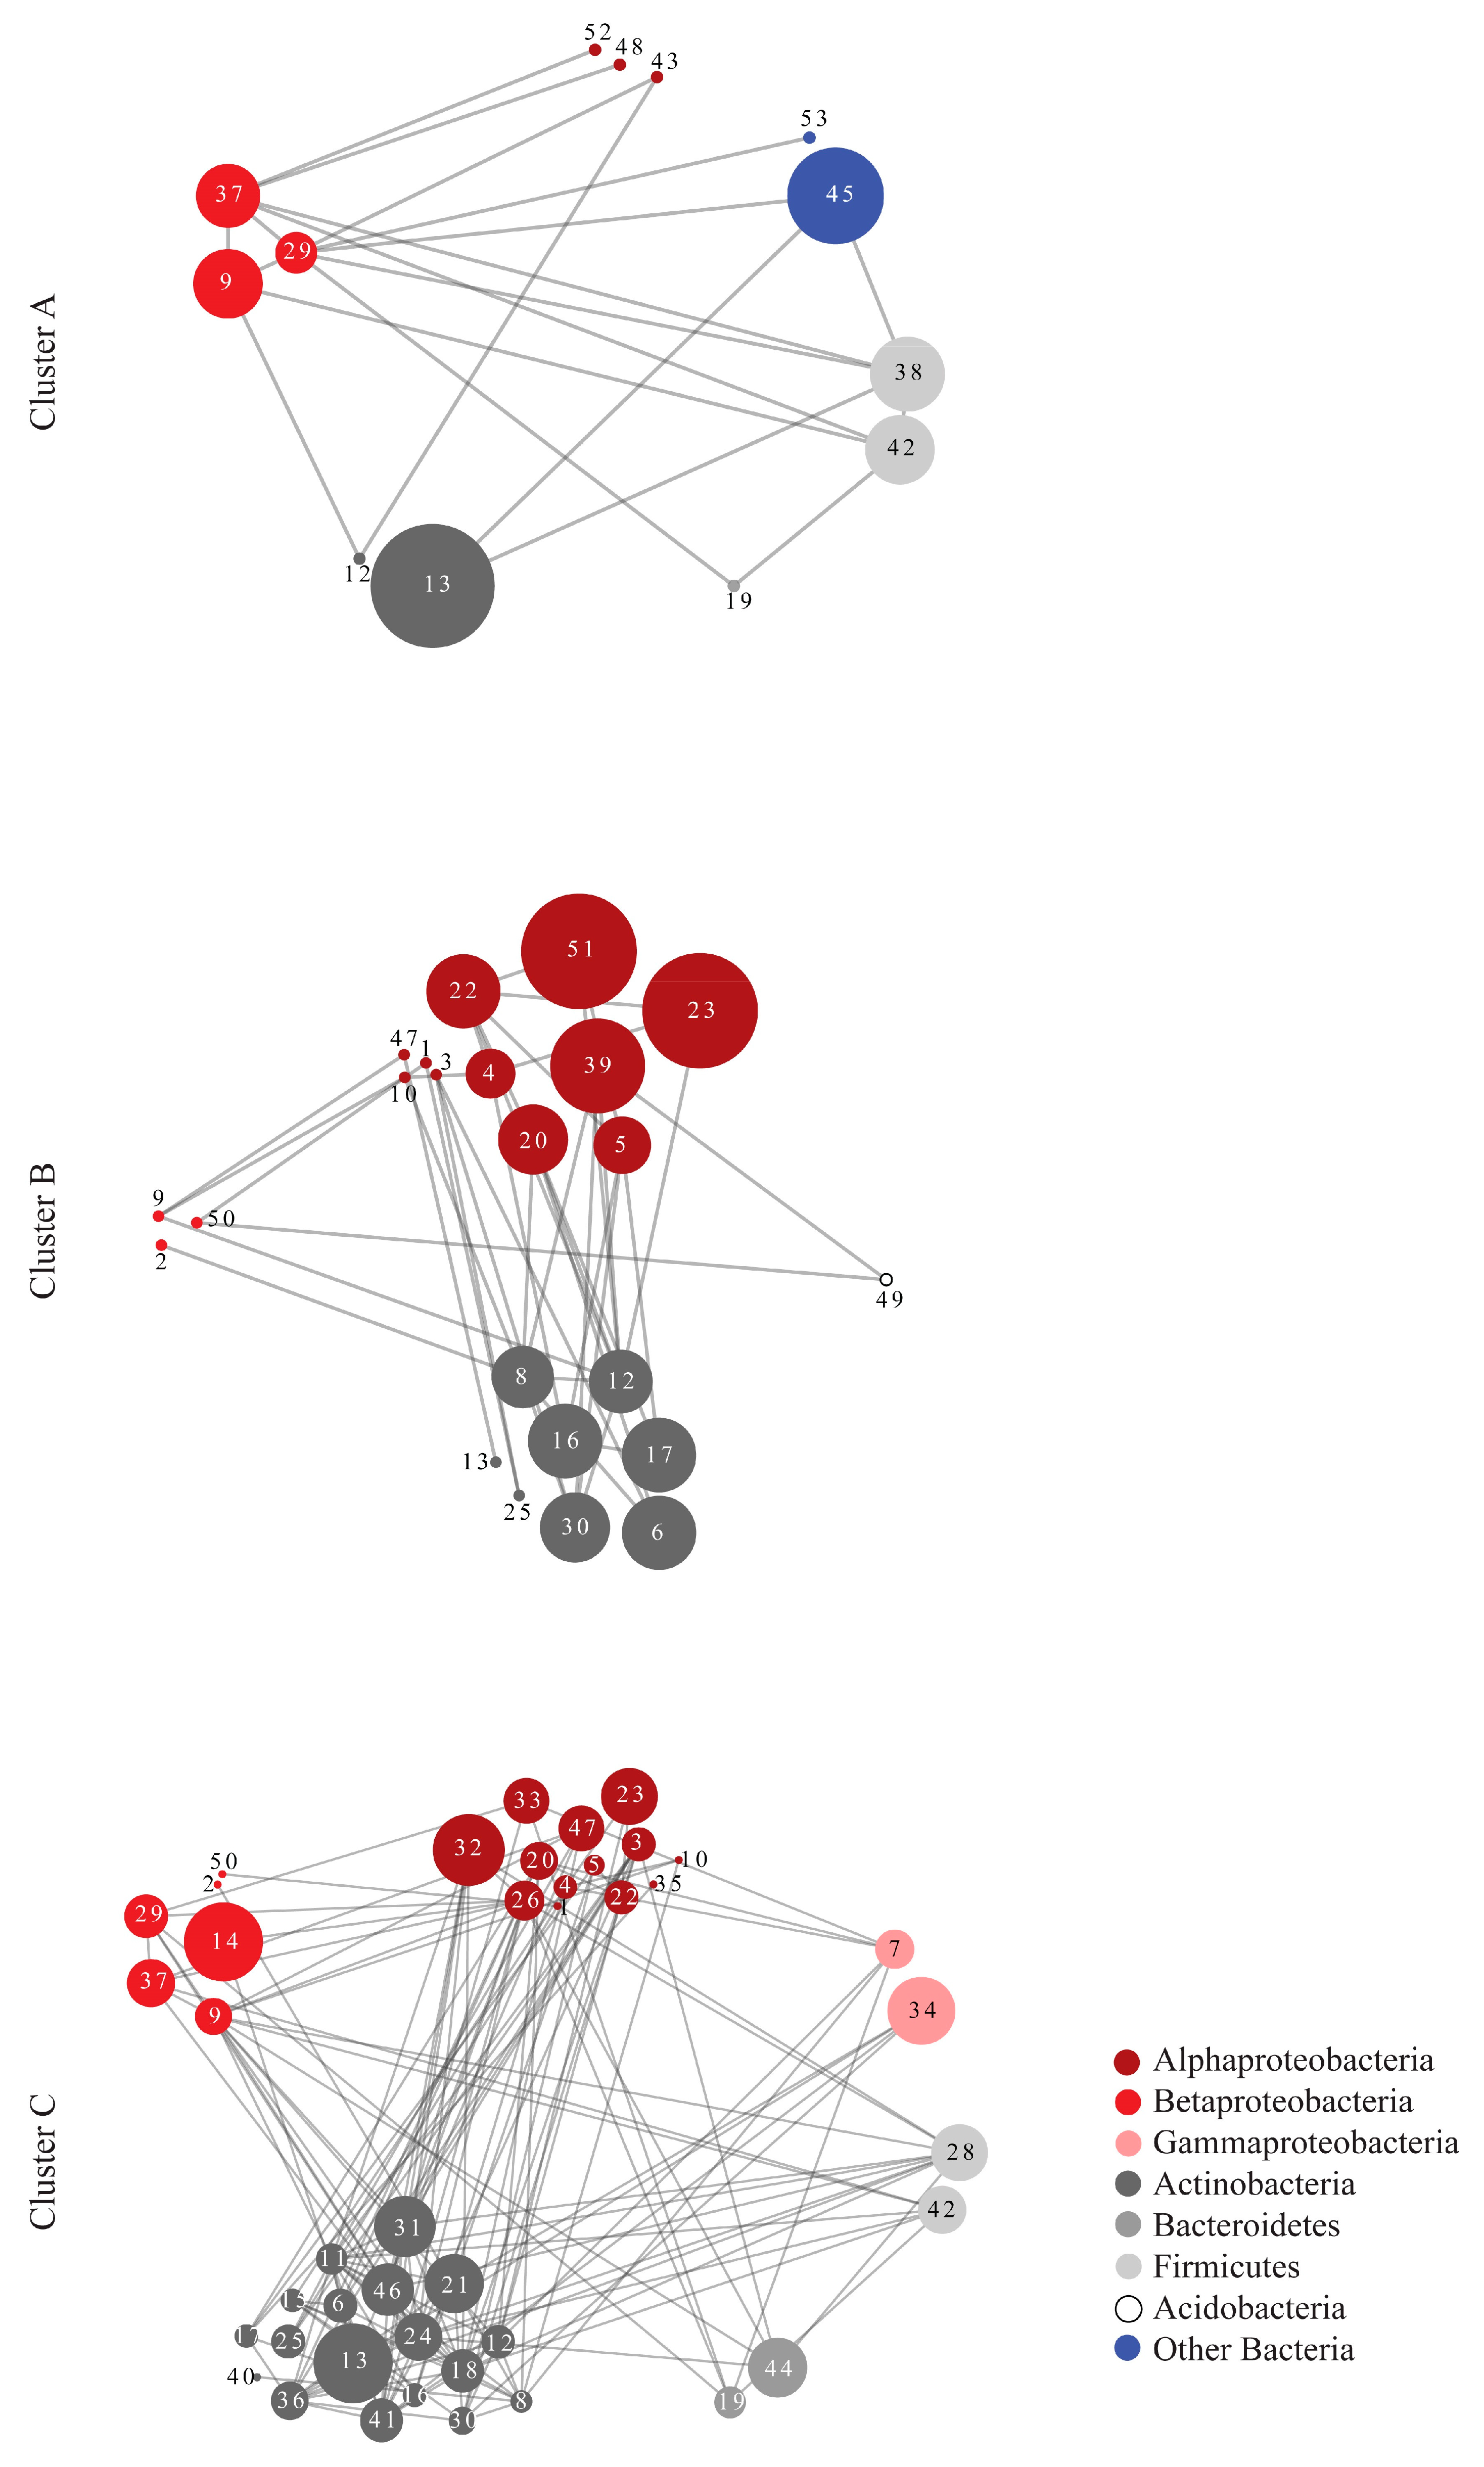
| Network Topological Parameters | Cluster A | Random Network A | Cluster B | Random Network B | Cluster C | Random Network C |
|---|---|---|---|---|---|---|
| Nodes | 13 | 13 | 23 | 23 | 43 | 43 |
| Edges (pairs) | 20 | 20 | 40 | 40 | 142 | 142 |
| Clustering coefficient | 0.242 | 0.231 | 0.201 | 0.137 | 0.404 | 0.169 |
| Connected components | 1 | 1 | 1 | 2 | 1 | 1 |
| Network diameter | 4 | 5 | 7 | 5 | 6 | 4 |
| Network radius | 2 | 3 | 4 | 3 | 3 | 3 |
| Network centralization | 0.386 | 0.189 | 0.225 | 0.225 | 0.285 | 0.135 |
| Shortest paths | 156 | 156 | 506 | 462 | 1806 | 1806 |
| Characteristic path length | 2.051 | 2.231 | 2.763 | 2.333 | 2.408 | 2.163 |
| Avg. number of neighbors | 3.077 | 3.077 | 3.478 | 3.478 | 6.605 | 6.605 |
| Network density | 0.256 | 0.256 | 0.158 | 0.158 | 0.157 | 0.157 |
| Network heterogeneity | 0.617 | 0.412 | 0.508 | 0.555 | 0.619 | 0.332 |
© 2019 by the authors. Licensee MDPI, Basel, Switzerland. This article is an open access article distributed under the terms and conditions of the Creative Commons Attribution (CC BY) license (http://creativecommons.org/licenses/by/4.0/).
Share and Cite
Vokou, D.; Genitsaris, S.; Karamanoli, K.; Vareli, K.; Zachari, M.; Voggoli, D.; Monokrousos, N.; Halley, J.M.; Sainis, I. Metagenomic Characterization Reveals Pronounced Seasonality in the Diversity and Structure of the Phyllosphere Bacterial Community in a Mediterranean Ecosystem. Microorganisms 2019, 7, 518. https://doi.org/10.3390/microorganisms7110518
Vokou D, Genitsaris S, Karamanoli K, Vareli K, Zachari M, Voggoli D, Monokrousos N, Halley JM, Sainis I. Metagenomic Characterization Reveals Pronounced Seasonality in the Diversity and Structure of the Phyllosphere Bacterial Community in a Mediterranean Ecosystem. Microorganisms. 2019; 7(11):518. https://doi.org/10.3390/microorganisms7110518
Chicago/Turabian StyleVokou, Despoina, Savvas Genitsaris, Katerina Karamanoli, Katerina Vareli, Marina Zachari, Despoina Voggoli, Nikolaos Monokrousos, John Maxwell Halley, and Ioannis Sainis. 2019. "Metagenomic Characterization Reveals Pronounced Seasonality in the Diversity and Structure of the Phyllosphere Bacterial Community in a Mediterranean Ecosystem" Microorganisms 7, no. 11: 518. https://doi.org/10.3390/microorganisms7110518
APA StyleVokou, D., Genitsaris, S., Karamanoli, K., Vareli, K., Zachari, M., Voggoli, D., Monokrousos, N., Halley, J. M., & Sainis, I. (2019). Metagenomic Characterization Reveals Pronounced Seasonality in the Diversity and Structure of the Phyllosphere Bacterial Community in a Mediterranean Ecosystem. Microorganisms, 7(11), 518. https://doi.org/10.3390/microorganisms7110518