Article

Comparison of Lipid Content in Nine Dinoflagellate Species Using Flow Cytometry

Advanced Institute of Convergence Technology, Suwon 16229, Republic of Korea
*
Authors to whom correspondence should be addressed.
Microorganisms 2025, 13(1), 44; https://doi.org/10.3390/microorganisms13010044
Submission received: 3 December 2024 / Revised: 25 December 2024 / Accepted: 27 December 2024 / Published: 30 December 2024
(This article belongs to the Special Issue Research on Biology of Dinoflagellates)

Abstract

:
The lipid content of nine dinoflagellates was analyzed using flow cytometry to compare lipid levels. Additionally, the correlation between lipid content, cell size, and carbon content in dinoflagellates was evaluated using BODIPY 505/515 staining. The flow cytometry side scatter (SSC) effectively represented relative cell size, showing a linear relationship with the equivalent spherical diameter (ESD). Larger cells exhibited higher relative lipid content; however, lipid accumulation was influenced by nutritional modes and habitats, with mixorophic and benthic species displaying higher lipid content than heterotrophic species. A comparison of fluorescent dyes revealed that Nile Red overestimated lipid content, suggesting overlap with chlorophyll autofluorescence. Flow cytometry analysis with BODIPY 505/515 demonstrated a linear correlation with the sulfo-phospho-vanillin (SPV) method, enabling determination of actual lipid content using FL1 fluorescence and the slope value. As the carbon content increased, the lipid content initially increased rapidly but plateaued at higher carbon levels, indicating saturation. These findings suggest that relative fluorescence via flow cytometry provides an effective means to estimate the lipid content and carbon content as a function of cell size.

1. Introduction

Marine dinoflagellates contain large amounts of high-quality lipids [1,2]. As major contributors to the marine food web, they play crucial ecological roles and are often associated with the formation of red tides [3,4]. Owing to their explosive and extensive blooms with high cell concentrations, they are considered a potential source of biofuel [5,6,7,8,9]. Thus, knowing the lipid content and lipid productivity of each species is very important when selecting target species or potential candidates as a source of biofuel. Some studies have been conducted for selecting the optimal species of dinoflagellate as a candidate for lipid production [10,11,12].
However, analyzing the lipid content of marine dinoflagellate species often requires clonal cultures and large amounts of biomass. Establishing clonal cultures for some dinoflagellates can be challenging, and mass cultivation of these species is time-consuming and labor-intensive. For instance, direct lipid extraction methods, such as those developed by Folch et al. [13] and Bligh and Dyer [14], which use chloroform and methanol, require substantial biomass. To address this limitation, several studies have explored methods for estimating lipid content in marine plankton species using smaller amounts of biomass. One example is the sulfo-phospho-vanillin method [15,16,17,18,19].
Flow cytometry is a rapid and effective method for quantitative analysis of individual cells in a moving fluid. Microalgae are ideal for flow cytometry analysis because they are unicellular and contain photosynthetic pigments that exhibit autofluorescence [20]. Moreover, the flow cytometric measurement of algal lipid content is one of the most cost-effective and time-efficient methods for labeling cells with lipophilic fluorescent dyes [21,22].
Traditionally, algal lipid content has been measured using flow cytometry in cells labeled with Nile Red [6,23,24]. However, Nile Red fluorescence emission often overlaps with chlorophyll autofluorescence, leading to spectral interference [22,25]. To address this limitation, BODIPY 505/515 (4,4-Difluoro-1,3,5,7-Tetramethyl-4-Bora-3a,4a-Diaza-s-Indacene) was investigated as an alternative fluorescent dye for algal lipid analysis [21,22,25,26]. BODIPY 505/515 has a narrower emission spectrum than Nile Red and its fluorescence emission is significantly offset by chlorophyll autofluorescence, thereby eliminating spectral interference [26,27].
In this study, we assessed the applicability of flow cytometry for accurate lipid estimation in dinoflagellates. We analyzed the lipid content of nine dinoflagellate species (Amphidinium carterae, Kryptoperidinium triquetrum, Prorocentrum cordatum, Alexandrium minutum, Oxyrrhis marina, Scrippsiella acuminata, Ostreopsis ovata, Prorocentrum micans, Lingulaulax polyedra) using flow cytometry with a fluorescent dye. Additionally, correlations were established between the estimated lipid content, cell size, lipid content measured using the sulfo-phospho-vanillin (SPV) method, and carbon content.

2. Materials and Methods

2.1. Preparation of Experimental Organisms

We prepared nine dinoflagellate species for comparison, including one benthic dinoflagellate and one heterotrophic dinoflagellate (Table 1). Cultures were grown at 20 °C in enriched f/2-Si seawater medium [28] under continuous illumination of 20 μE m−2 s−1 provided by cool white fluorescent lights, except for O. marina. Yeast was used to culture the heterotrophic dinoflagellate O. marina at 20 °C in autoclaved seawater.
Experimental organisms were cultured in 2 L polycarbonate bottles containing 1 L of f/2-Si medium. Each culture was grown for over one week until the end of the exponential growth phase to stationary phase, with cell concentrations exceeding 3000 cells mL−1. A 10 mL sample from each culture was fixed with Lugol’s solution for cell concentration counts, and another 10 mL sample was prepared for flow cytometric analysis.
The mean equivalent spherical diameter (ESD) ± standard deviation was measured using an electronic particle counter (Coulter Multisizer II; Coulter Corporation, Miami, FL, USA).
The biovolume (μm3) of each dinoflagellate was calculated using the method described by Hillebrand et al. [29]. The biovolume was calculated using the ESD and the equation for spherical-shaped cells.
B V = 4 3 · π · r 3
Once cell biovolume was calculated, carbon content per cell (pg cell−1) was assessed using conversion factors from the literature described by Menden-Deuer and Lessard [30] (pg C cell−1 = 0.216 × BV0.939). The calculated carbon content was compared to the lipid content estimated using flow cytometry.

2.2. Staining of Algal Cells Using Fluorescent Dyes

The algal cells were stained with BODIPY 505/515 (4,4-Difluoro-1,3,5,7-Tetramethyl-4-Bora-3a,4a-Diaza-s-Indacene; Sigma-Aldrich, St Louise, MO, USA) following a protocol adapted from Cooper et al. [14]. BODIPY 505/515 was dissolved in anhydrous dimethyl sulfoxide (DMSO) to prepare a 10 mM stock solution, which was stored in an amber bottle to protect it from light. For staining, 2 μL of the stock solution was added to 10 mL of live phytoplankton samples to achieve a final concentration of 2 μM. The samples were incubated for 10 min at room temperature.
For Nile Red staining, the cultured cells were stained using a modified protocol from Dempster and Sommerfeld [31]. A working solution of Nile Red (NR; Sigma-Aldrich, St Louise, MO, USA) was prepared by dissolving NR in acetone (0.1 mg mL−1). For staining, 50 μL of the working solution was added to 10 mL of the cultures, gently vortexed, and incubated in the dark at 37 °C for 10 min.

2.3. Flow Cytometric Analysis

The relative fluorescence of lipids was determined using a FACSCalibur flow cytometer (BD Biosciences, San Jose, CA, USA) equipped with a 488 nm argon laser. The fluorescence of cells labeled with BODIPY 505/515 was measured in the FL1 channel using a FITC filter for green light (530 ± 15 nm). For cells labeled with Nile Red, fluorescence was collected in the FL2 channel to capture yellow and orange light (560–640 nm). Approximately 3000 cells were analyzed for each sample, and fluorescence signals were recorded using logarithmic amplification. Non-stained cells were used as autofluorescence controls. To estimate cell size, side-scattered light (SSC) was used because the experimental cells were mostly spherical in shape.
The photomultiplier voltage was adjusted according to the size and fluorescence characteristics of the organism. Flow cytometry is typically employed to examine picoplankton and nanoplankton samples; it necessitated adjustments to the voltage settings to analyze marine dinoflagellates, which have dimensions ranging from 5 to 50 μm.
To ensure consistent detection across all experimental organisms, we mixed A. carterae (9.8 μm, smallest) and L. polyedra (38 μm, largest) and measured SSC and FL1 fluorescence using BODIPY 505/515 and FL2 fluorescence using Nile Red. The voltage was adjusted to accommodate the size range and maximum fluorescence of both the dyes. The final voltage gain settings used for analysis were Forward Scatter (FSC) = E00, Side Scatter (SSC) = 250, green fluorescence (FL1) = 220, and orange fluorescence (FL2) = 300.
To isolate the experimental organism population, gates were established to exclude nonfluorescent particles. The gated algal populations typically constituted the dominant events detected (Figure 1). Measurements of the gated algal populations were performed in triplicate for each experimental species.

3. Results and Discussion

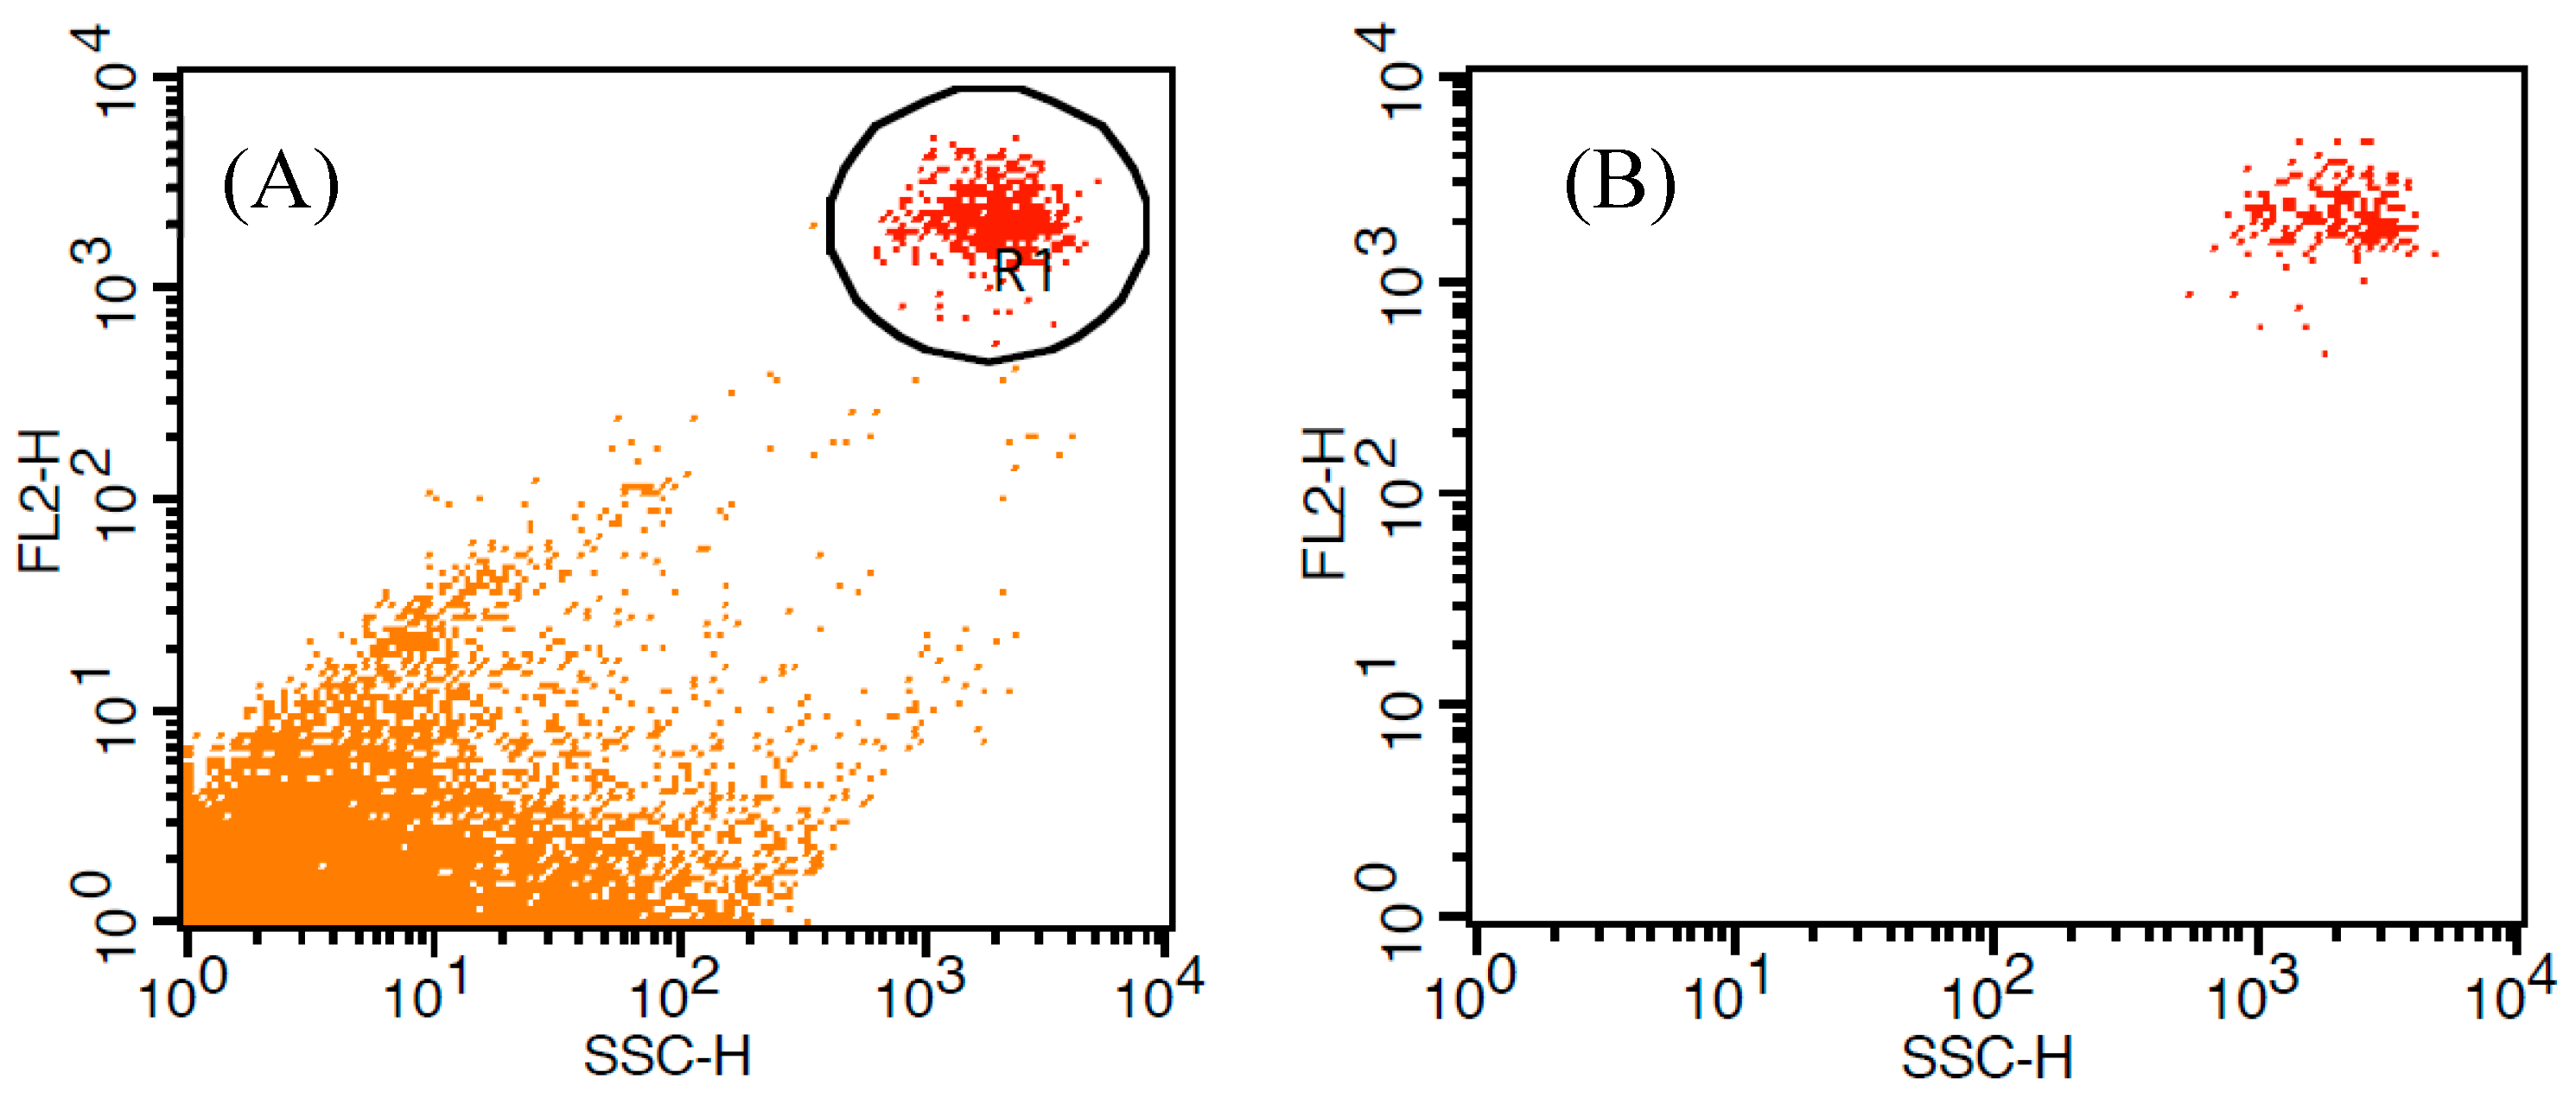
3.1. Flow Cytometric Analysis of Lipid Contents Using BODIPY 505/515

The FL1 fluorescence of BODIPY 505/515-stained cells and side scatter (size factor) detected by flow cytometry are shown in Figure 2. The lipid content of the experimental dinoflagellate species, estimated by FL1 fluorescence, increased with the side scatter (size factor) measured by flow cytometry (Figure 2, Table 2). A linear relationship (R2 = 0.86, Figure 3) was observed between two size factors: side scatter (SSC) from flow cytometry and equivalent spherical diameter (ESD, μm) from a Coulter Multisizer. As most experimental species had spherical cell shapes, the SSC absorbance closely matched the ESD and effectively represented the relative cell size.
The correlation between relative lipid content (BODIPY 505/515 fluorescence) and two size factors was compared for the dinoflagellate species (Figure 4). Both size factors were significantly correlated with BODIPY 505/515 fluorescence, with larger cells exhibiting a higher relative lipid content. When the size was measured using flow cytometry (SSC), O. ovata displayed greater fluorescence than the other dinoflagellate species examined (Figure 4A).
Similarly, when the size was determined as the equivalent spherical diameter (ESD) using a Coulter Multisizer, P. micans and O. ovata exhibited comparable ESD sizes; however, O. ovata displayed significantly higher FL1 fluorescence (Figure 4B). The size of P. micans was underestimated when measured by flow cytometry, likely because of its distinctive cell shape, which is the form of teardrop with a wide valve and appears lenticular in the lateral view as a result of compression.

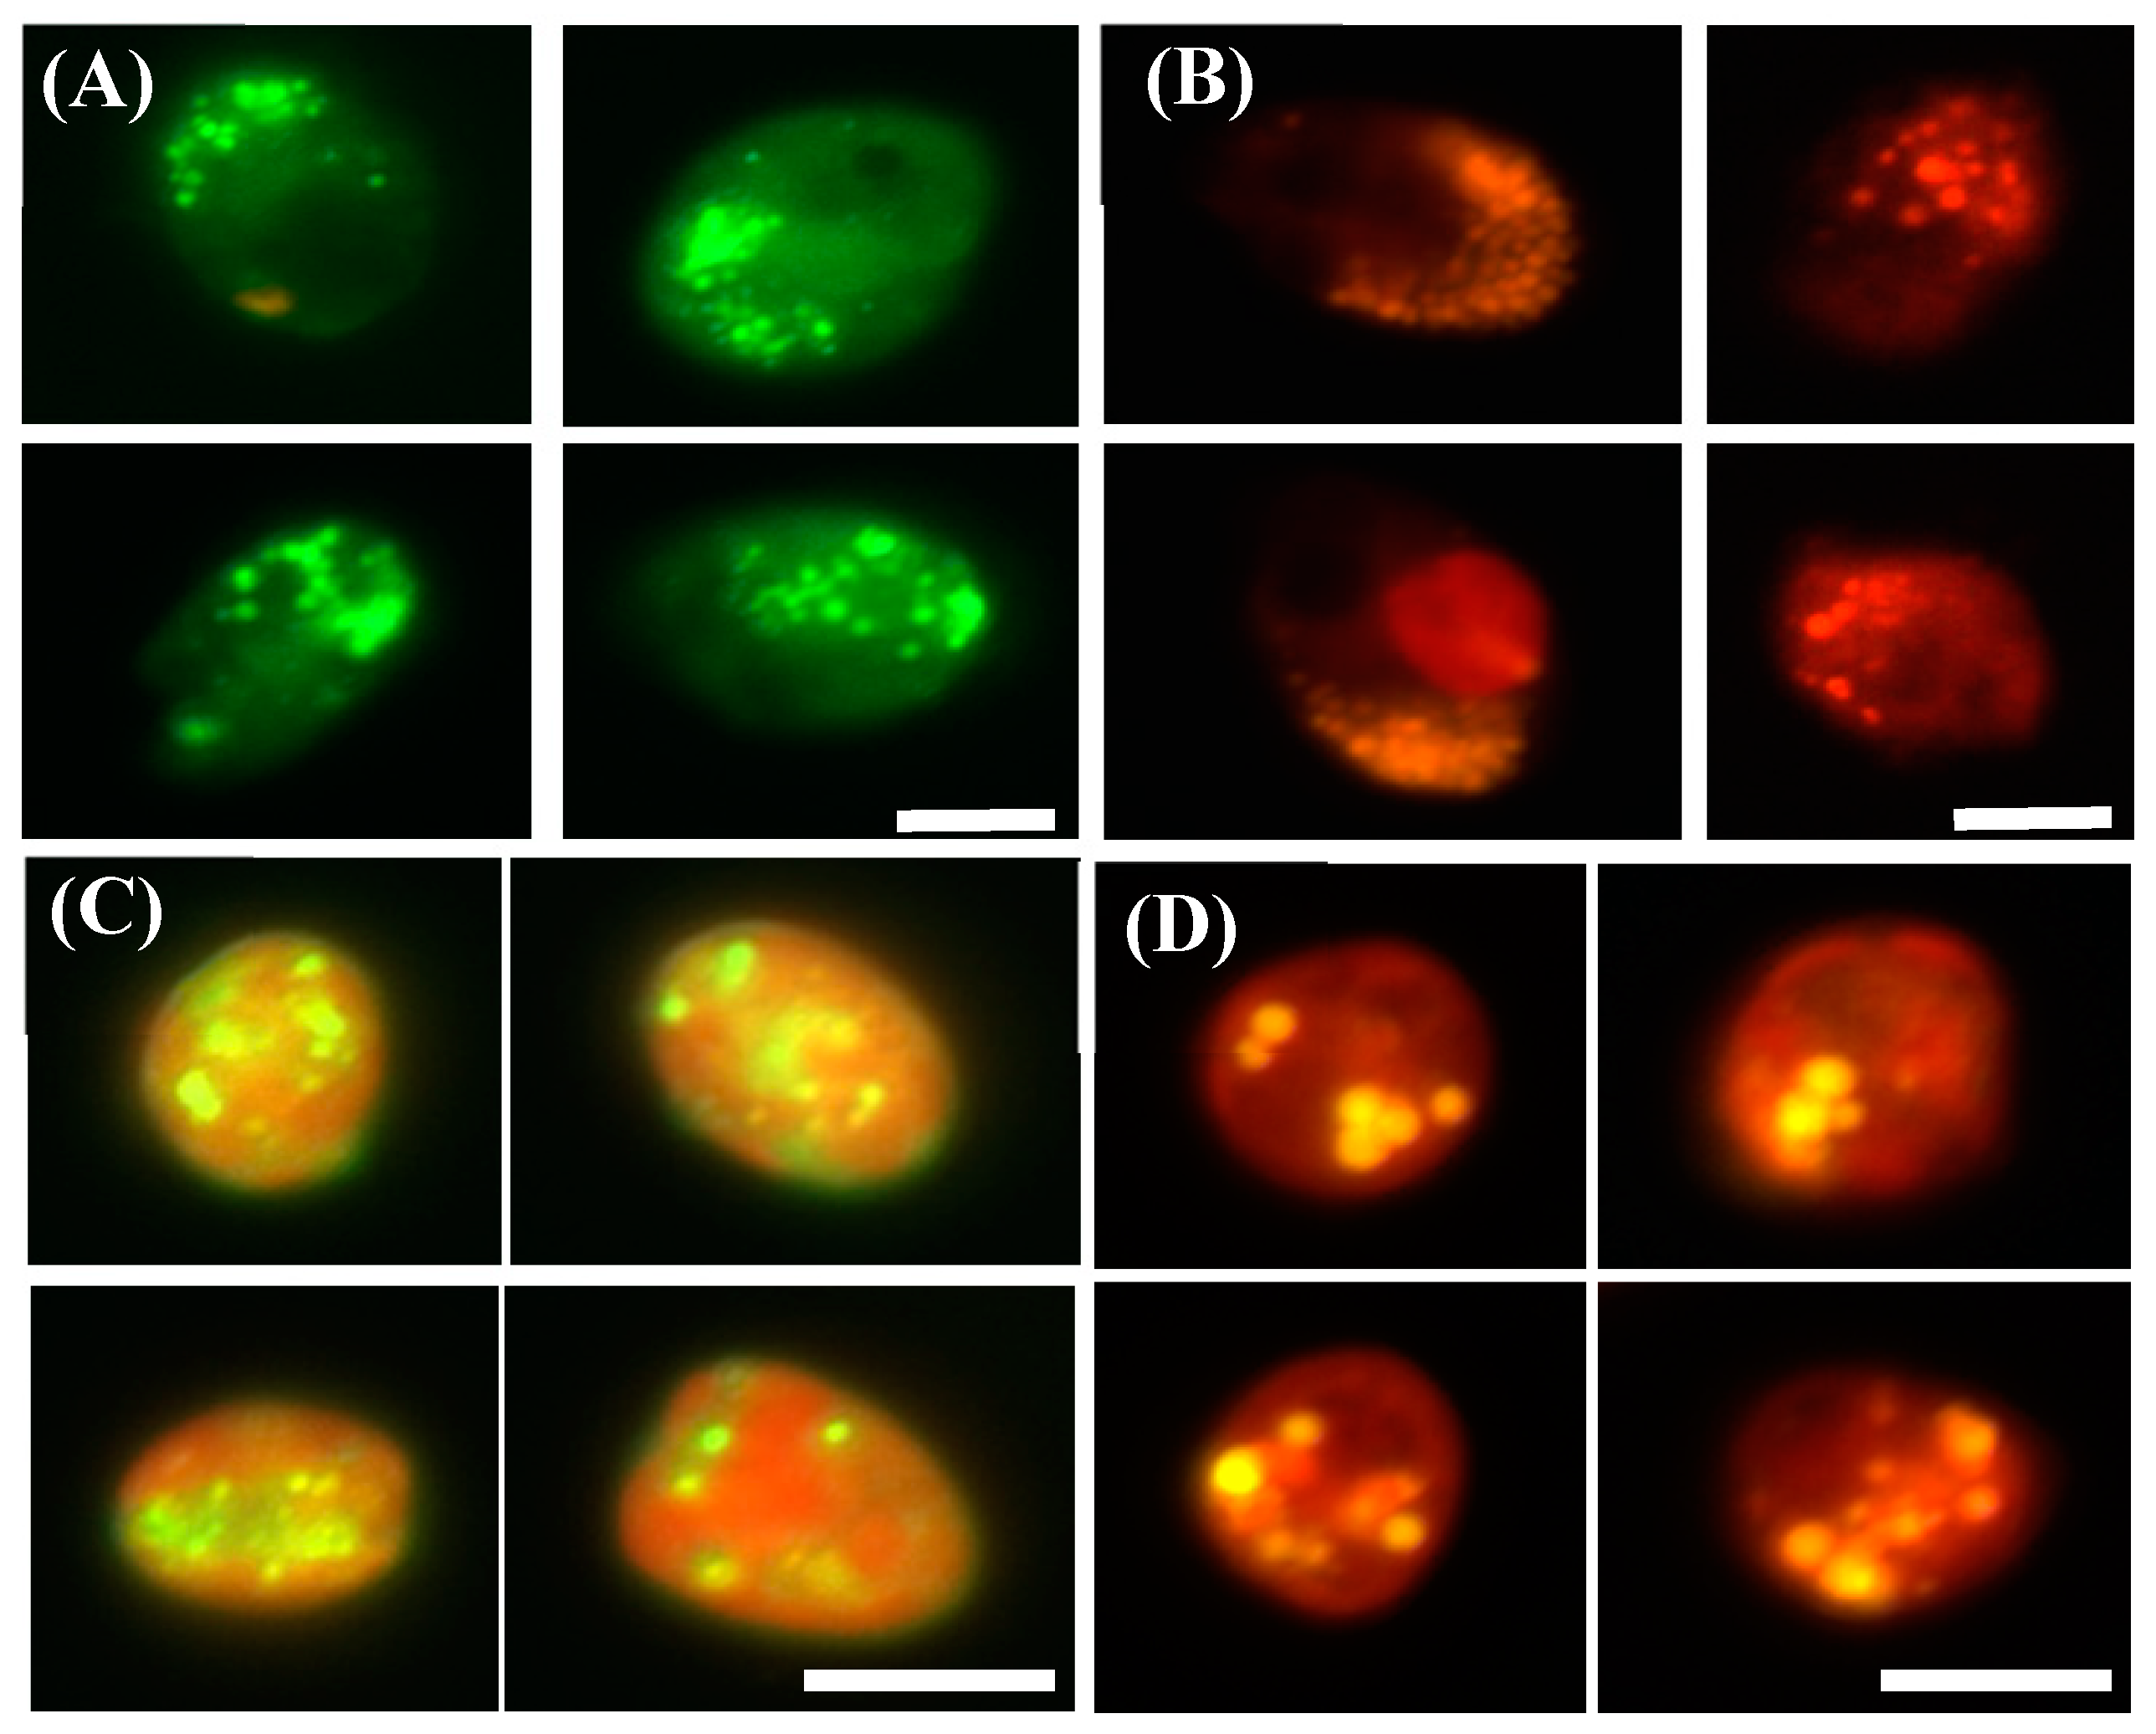
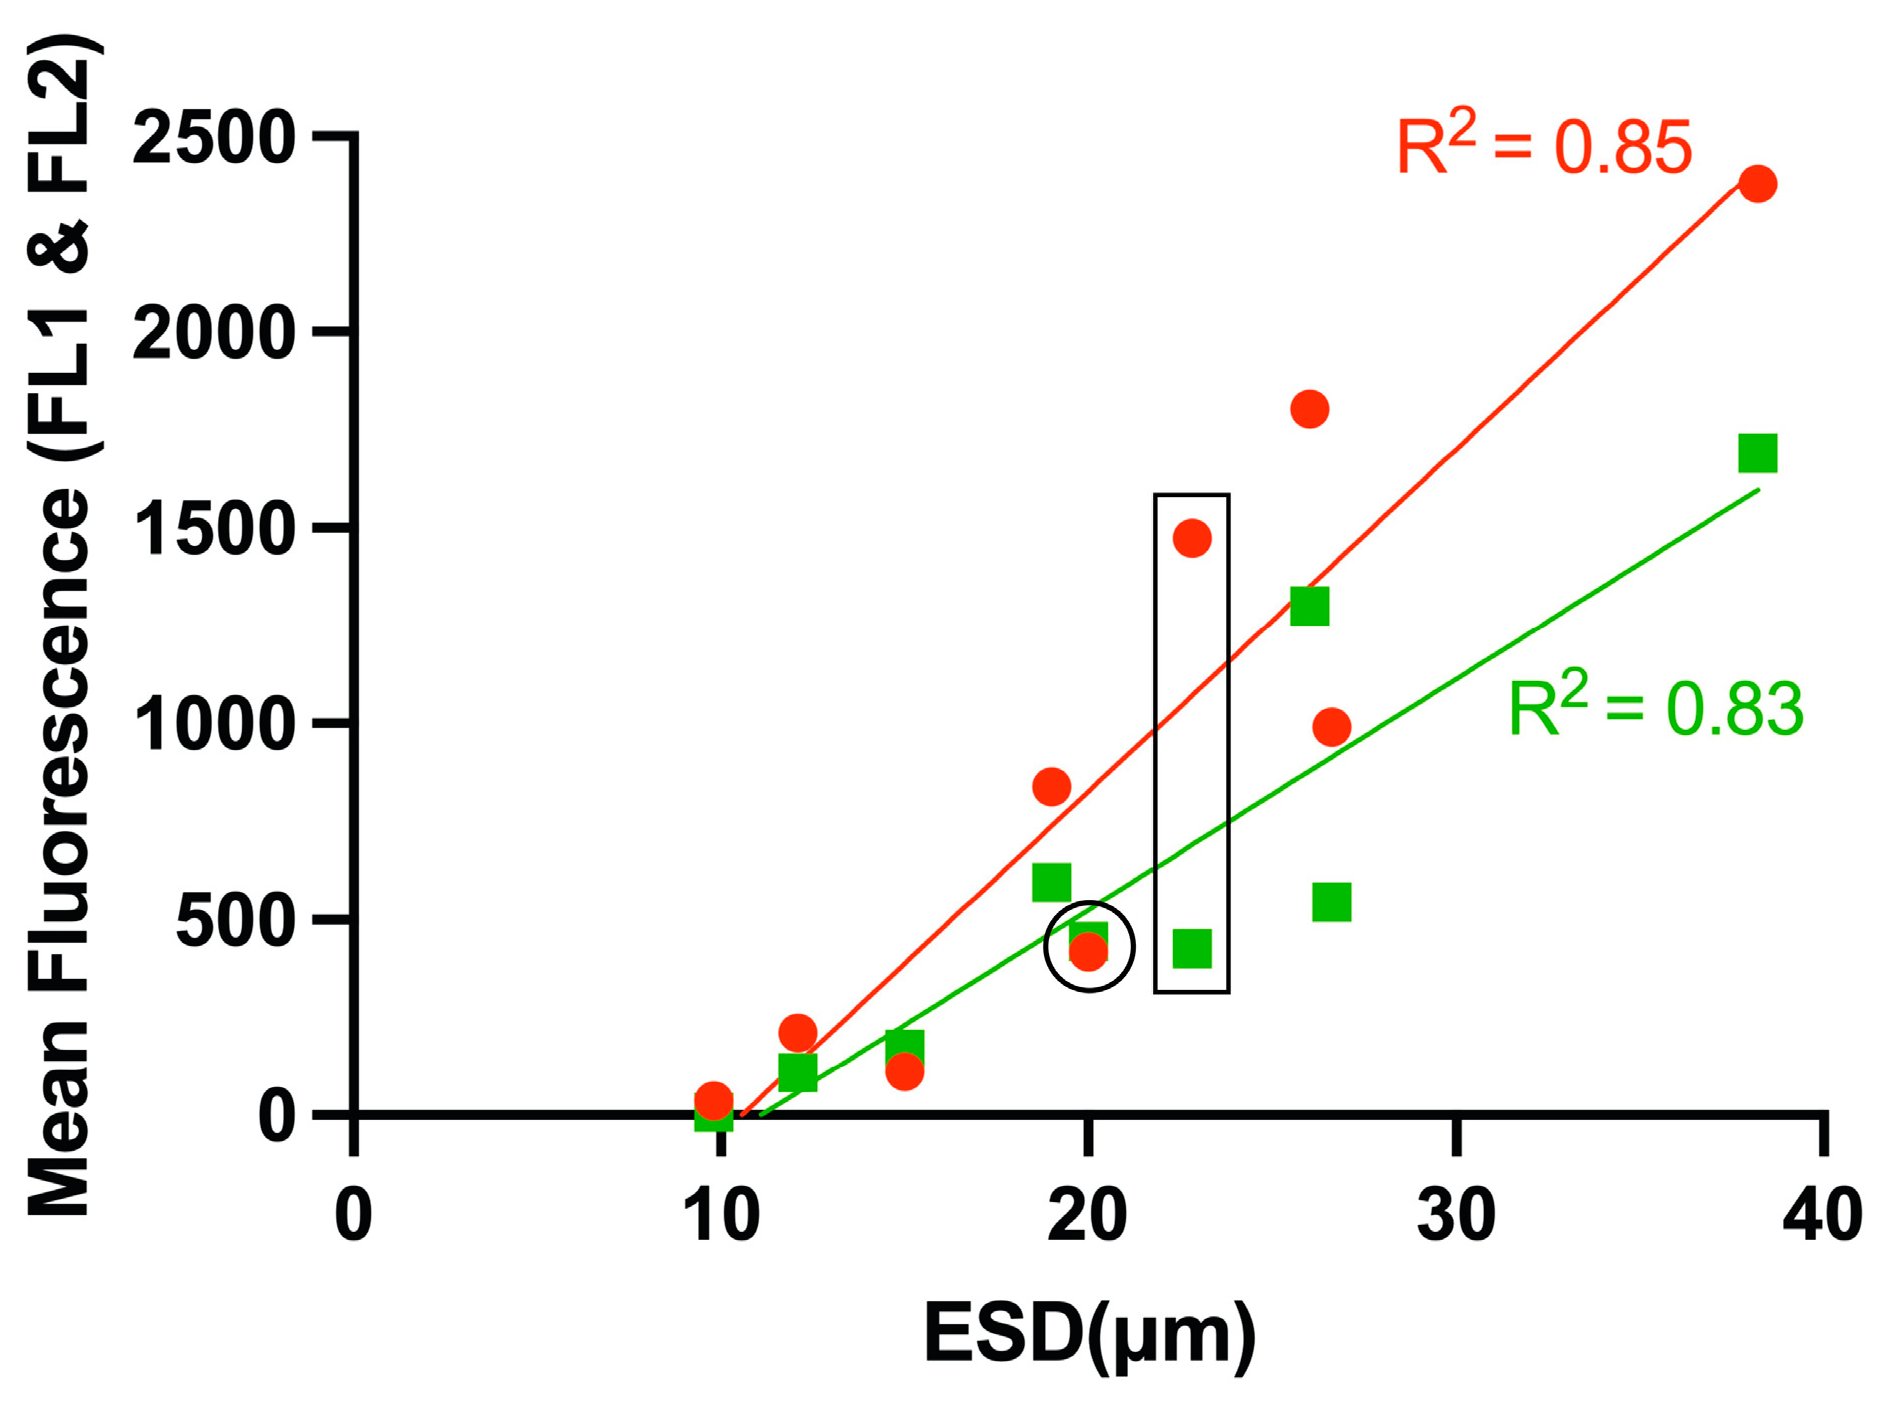
3.2. Comparision of Fluorescent Dyes (BODIPY 505/515 vs. Nile Red)

For decades, Nile Red has been widely used to stain lipid droplets in microalgal cells. Previous studies reported that diatoms and dinoflagellates are more suitable for fluorescent measurement due to the cell wall structure. Consequently, Nile Red and BODIPY 505/515 staining can be used as high-throughput approaches without the need for pre-treatment [32]. However, many studies have highlighted several issues associated with the use of Nile Red. Its major disadvantages include limited photostability, interference with chlorophyll fluorescence, and difficulty permeating certain microalgal species [33].
Recent research has identified BODIPY 505/515 as a superior marker to Nile Red for visualizing lipid content [26,34]. We compared the heterotrophic dinoflagellate O. marina and the mixotrophic dinoflagellate P. cordatum after staining with both Nile Red and BODIPY 505/515 and observed them under an epifluorescence microscope (Figure 5). In O. marina, regardless of whether Nile Red or BODIPY 505/515 was used, only lipid droplets were visible, owing to the absence of pigments (Figure 5A,B). In contrast, in P. cordatum, orange-red fluorescence was observed across the cell under both the FITC long-pass and rhodamine filters, indicating background interference from cellular pigments (Figure 5C,D).
When we measured FL2 fluorescence in cells stained with Nile Red, S. acuminata exhibited significantly higher FL2 fluorescence than similarly sized species (Figure 6). S. acuminata has a thinner theca than other experimental species and displays very high chlorophyll autofluorescence when observed under an epifluorescence microscope. In contrast, the heterotrophic dinoflagellate O. marina showed relatively lower FL2 fluorescence than the similarly sized species, likely because it has no chlorophyll pigment (Table 2, Figure 6).
We also compared the mean fluorescence of experimental species and their equivalent spherical diameters (ESD) when stained with Nile Red and BODIPY 505/515 (Figure 6). The fluorescence intensity of Nile Red showed a linear correlation with ESD (R2 = 0.85), and the correlation coefficient was similar than that observed for BODIPY fluorescence (R2 = 0.83). While both stains exhibited a linear correlation between mean fluorescence and ESD, the Nile Red correlation exhibited a steeper gradient, indicating a potential overestimation of lipid content with this dye.

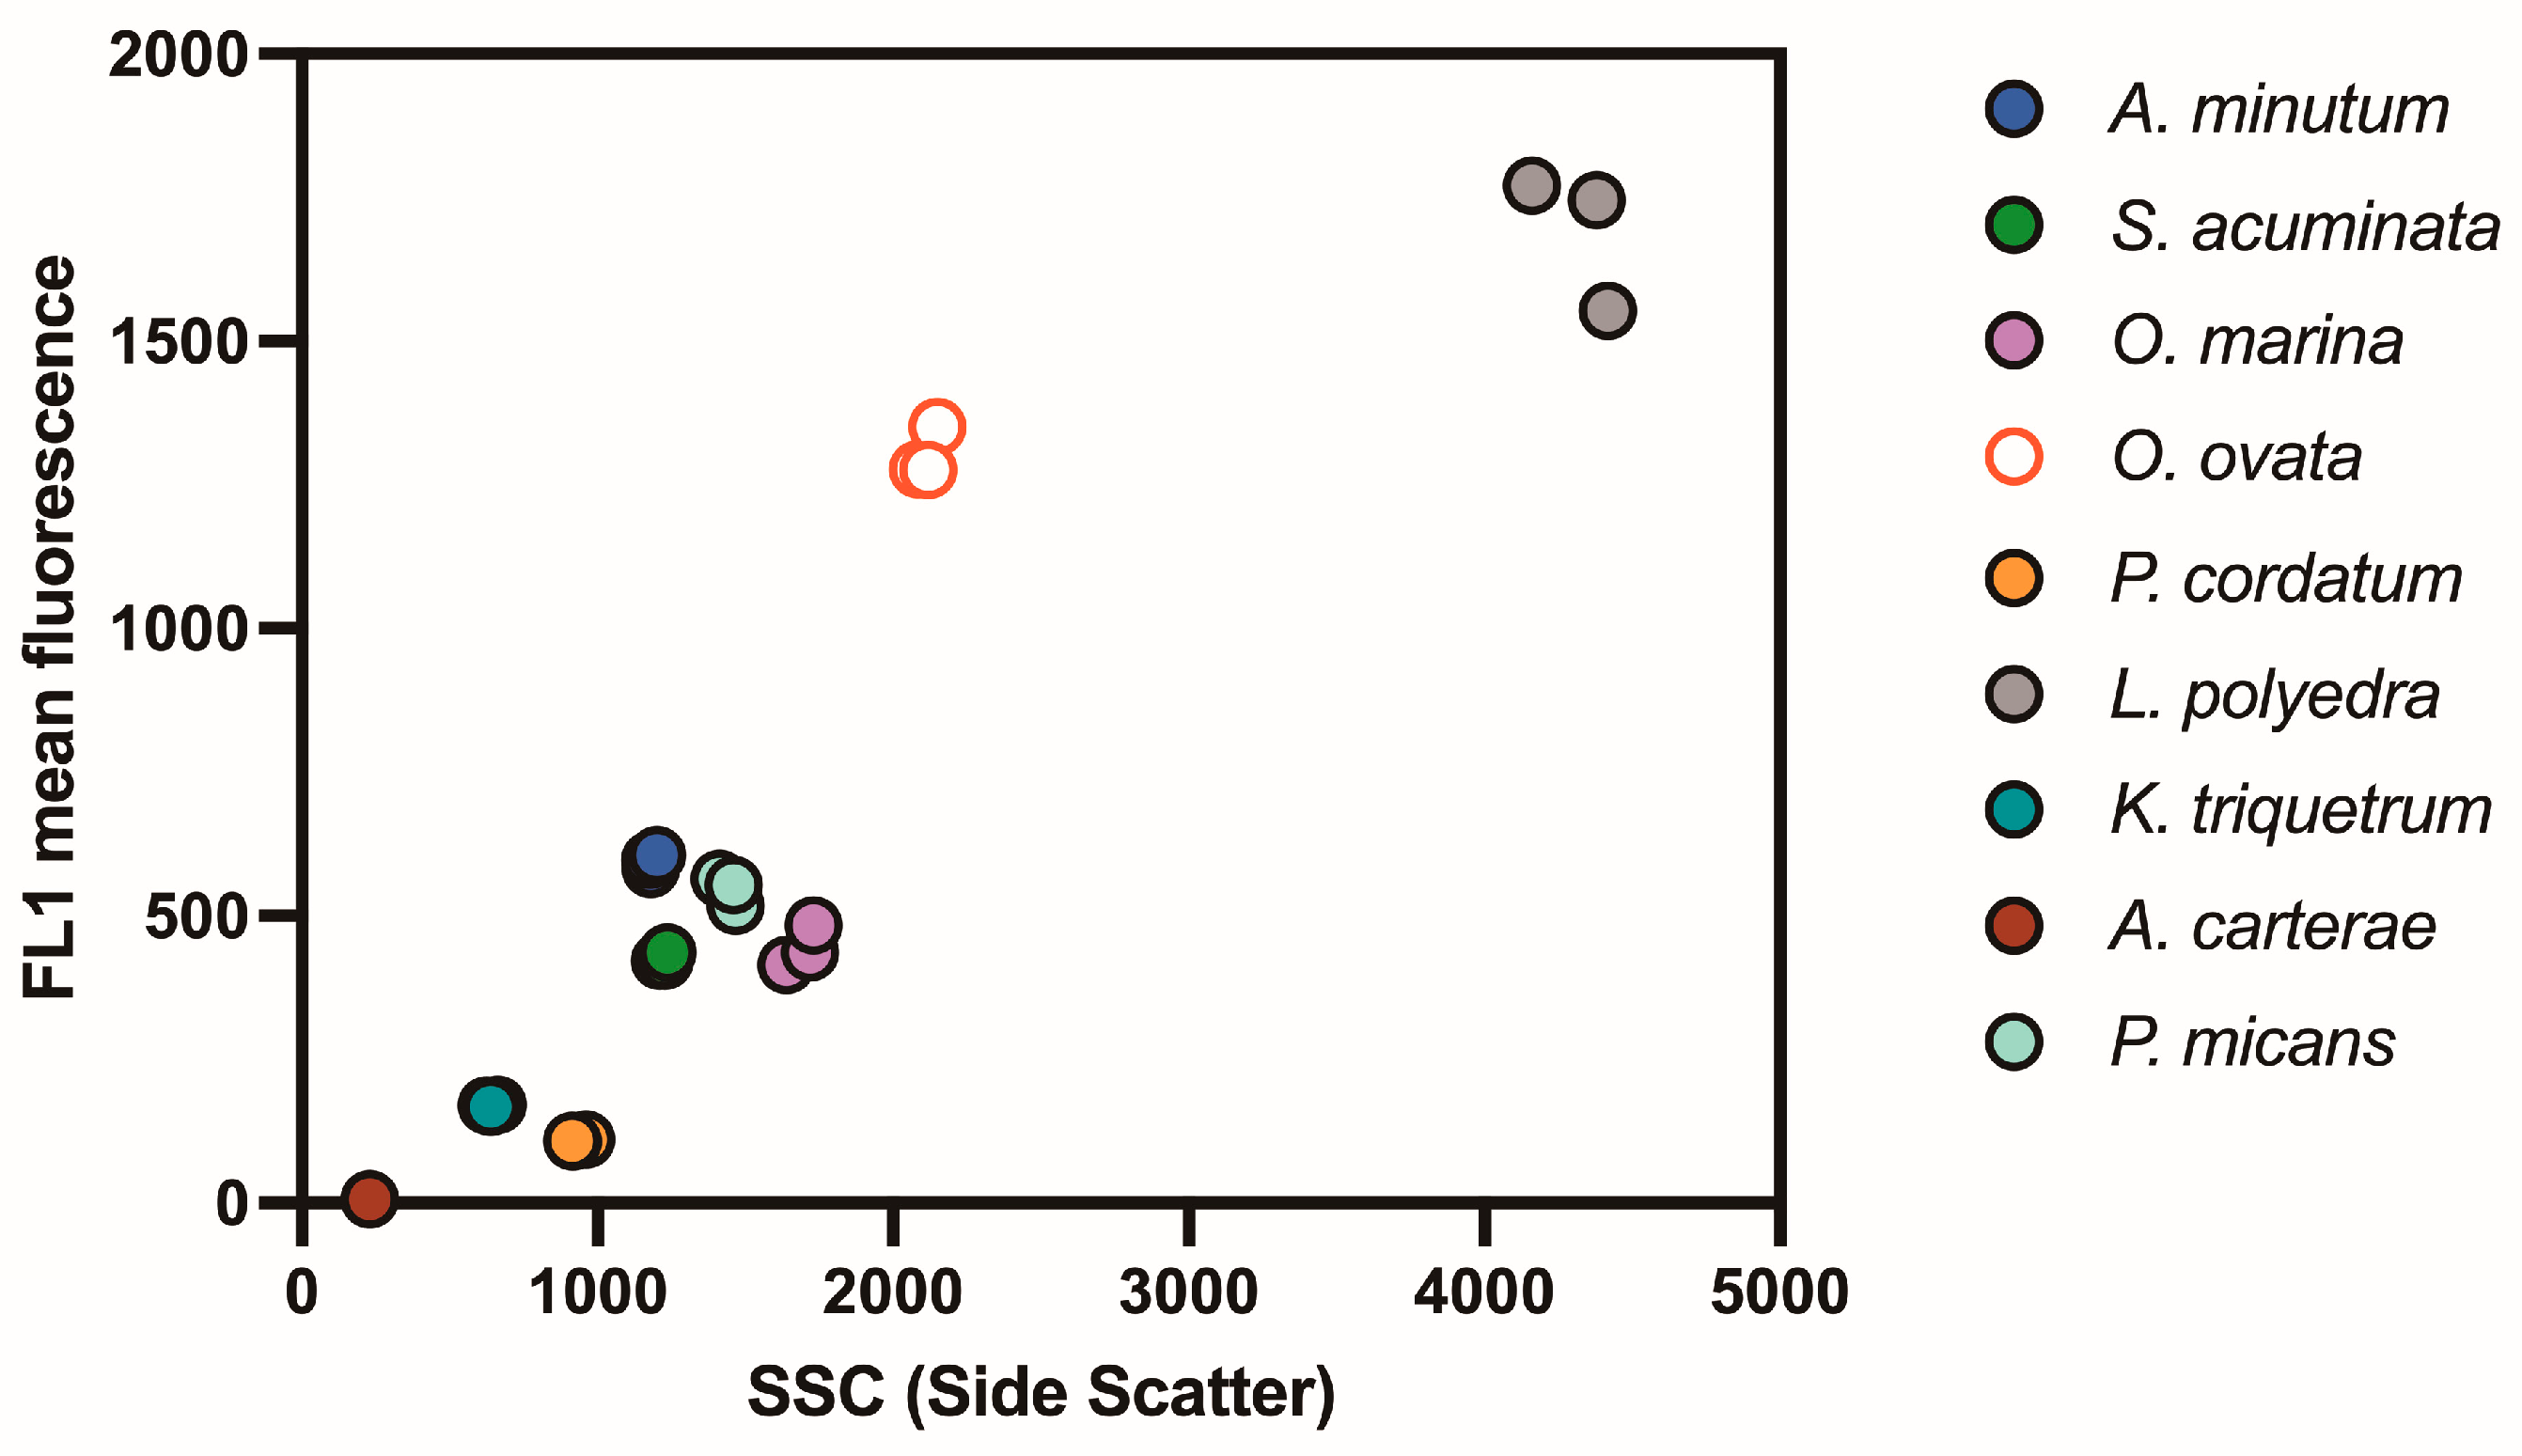
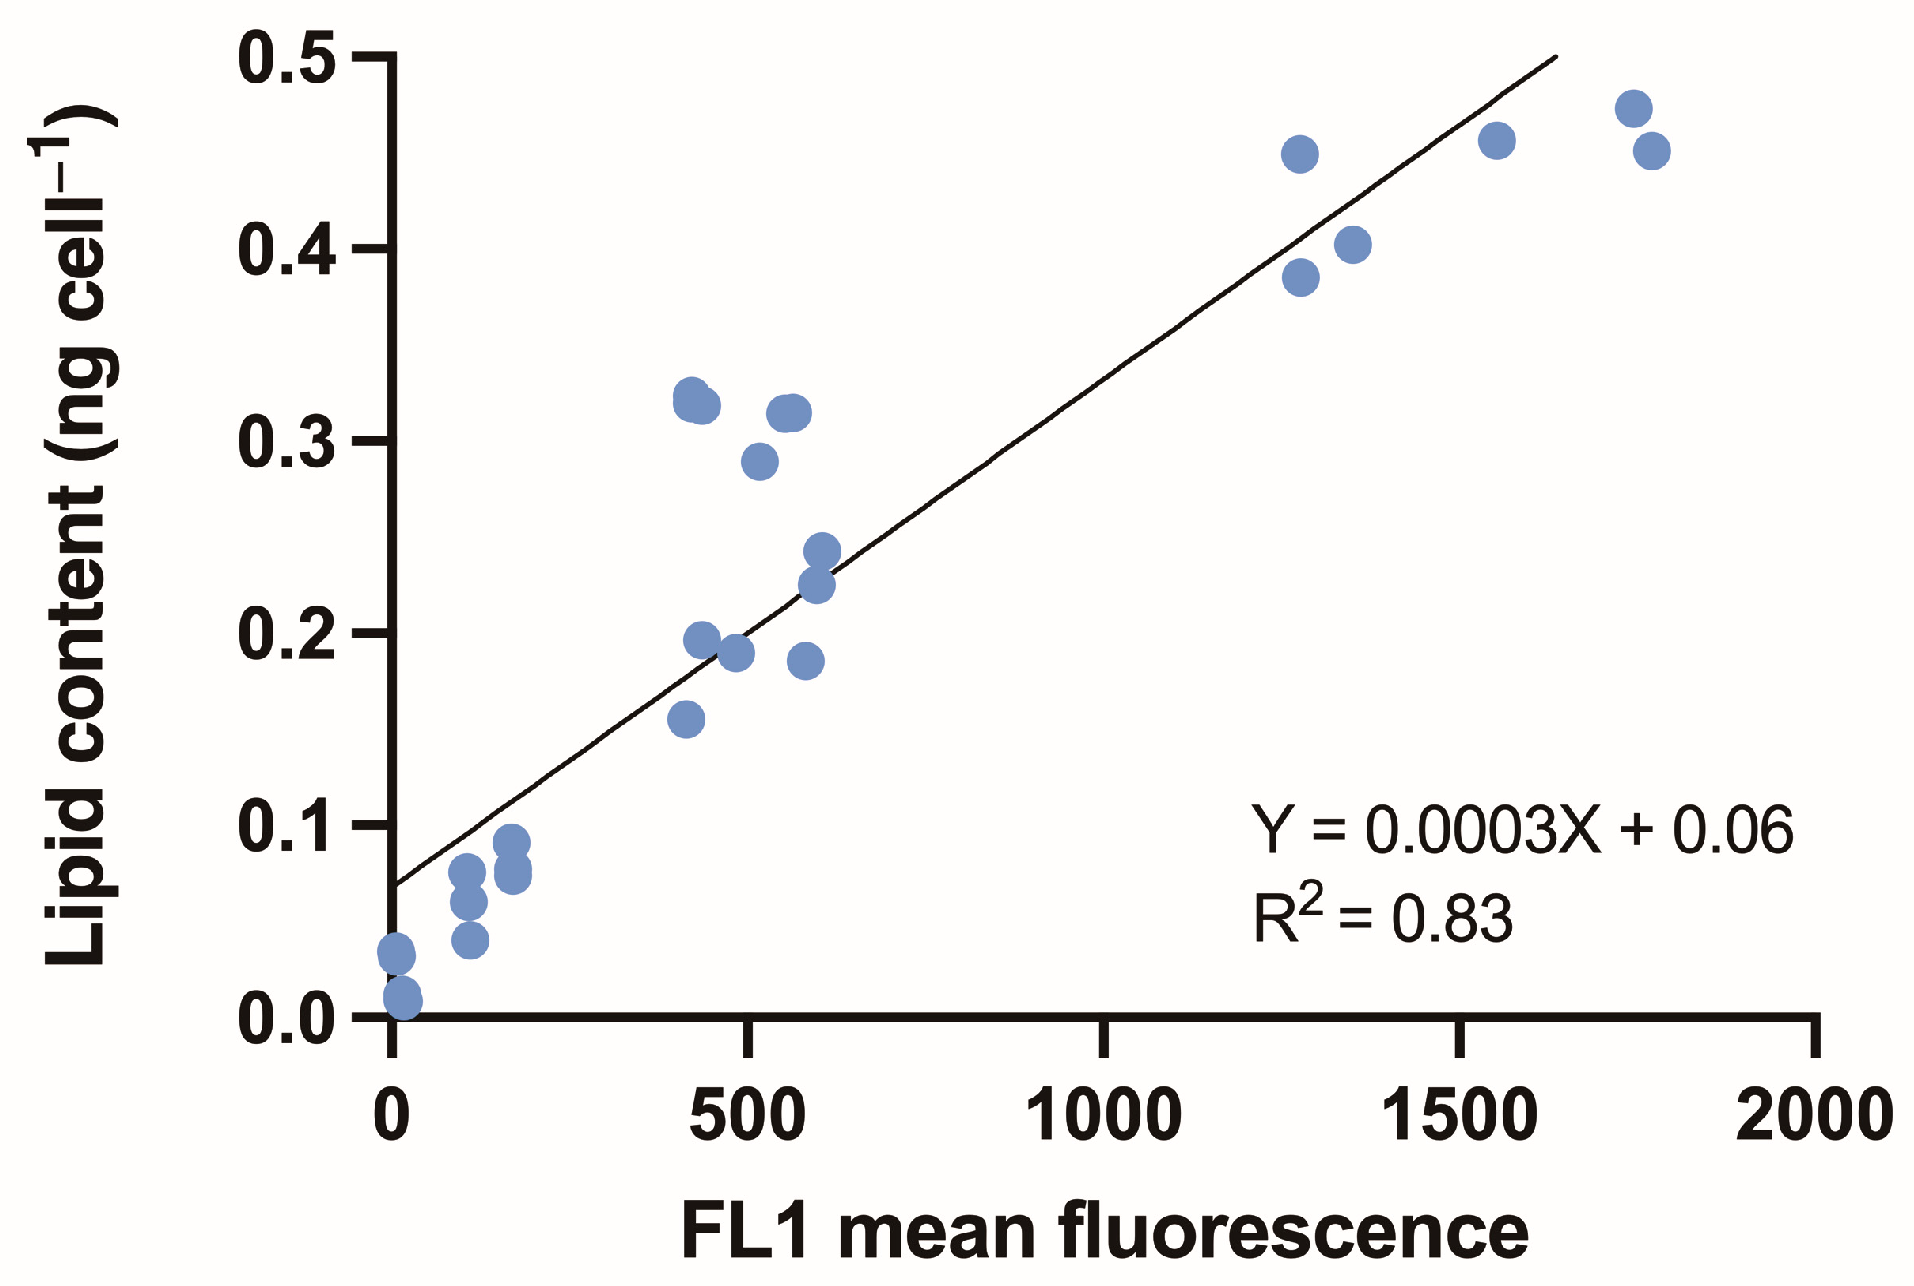
3.3. Estimating Lipid Content Using Relative Fluorescence

The formation of lipids is strongly correlated with algal growth, which is affected by environmental conditions such as light intensity and nutrient concentration [35,36,37]. Changes in light intensity can positively or negatively affect lipid production. Moreover, nitrogen starvation has often been reported to lead to an increase in lipid accumulation [38]. Therefore, it is crucial to monitor changes in lipid content during cultivation using rapid and simple methods to optimize the conditions for mass production of microalgae [5,19]. This study revealed a significant correlation between the relative lipid content estimated by flow cytometry using BODIPY 505/515, and the lipid content determined by the sulfo-phospho-vanillin (SPV) reaction in the experimental species (Table 2, Figure 7). The actual lipid content was estimated using the established flow cytometry conditions and BODIPY 505/515 staining by applying the slope value (multiplying FL1 fluorescence by 0.0003 and adding 0.06). Thus, the flow cytometry configurations established in this study offer an efficient and rapid flow cytometric technique for estimating lipid content in dinoflagellate species.
Previous studies have demonstrated a strong correlation between flow cytometric determination of lipid content and direct analytical methods, such as the Blight–Dyer extraction method or gas chromatography [16,39]. Our study revealed a strong correlation between flow cytometry and the SPV method for determining lipid content. Therefore, both flow cytometry and the SPV method are effective techniques that require only a small amount of biological material, enabling rapid quantification of dinoflagellate lipids without complex extraction steps.

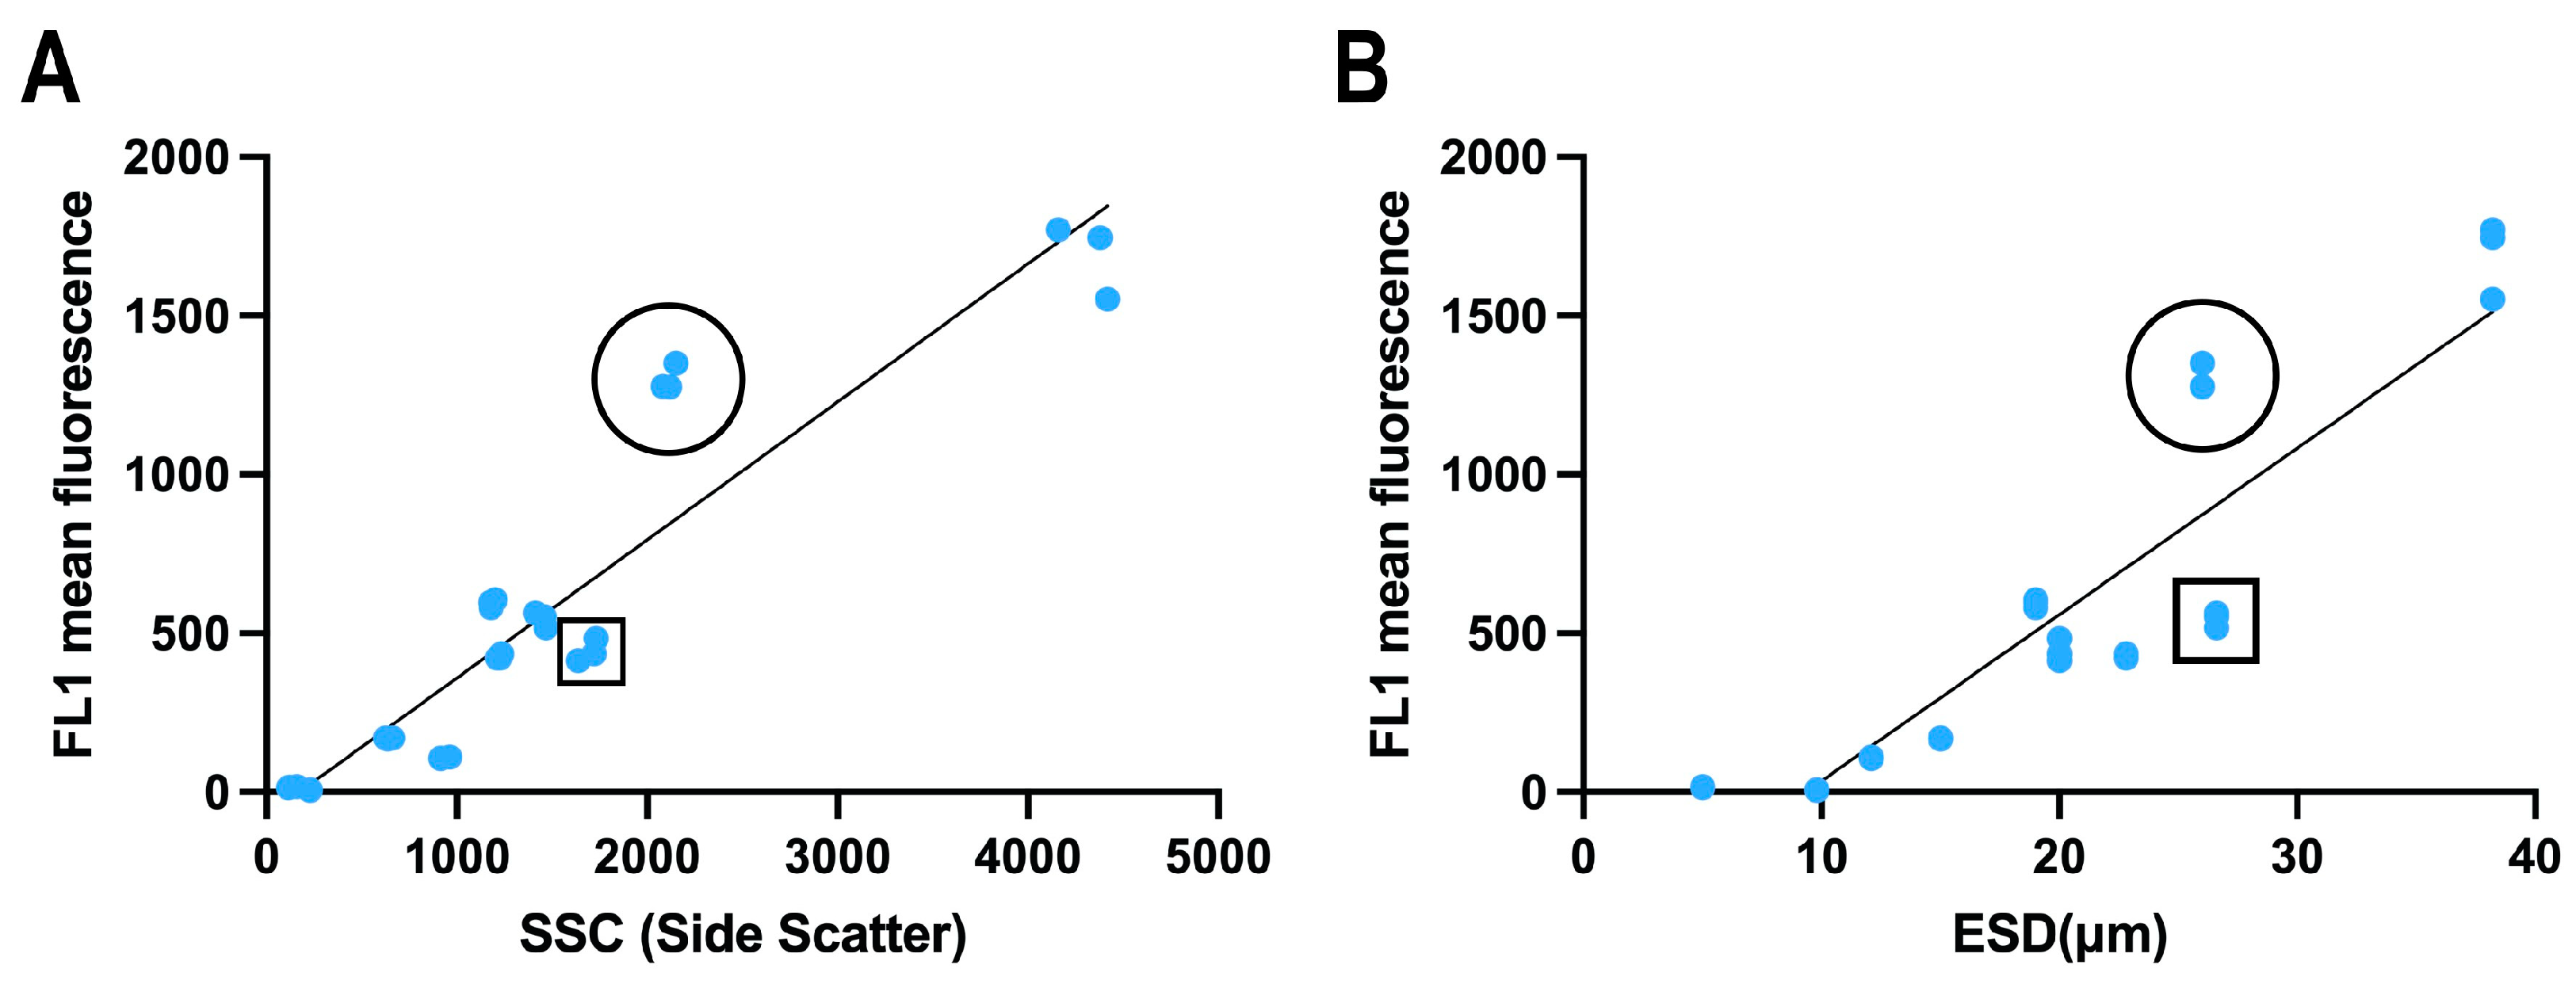
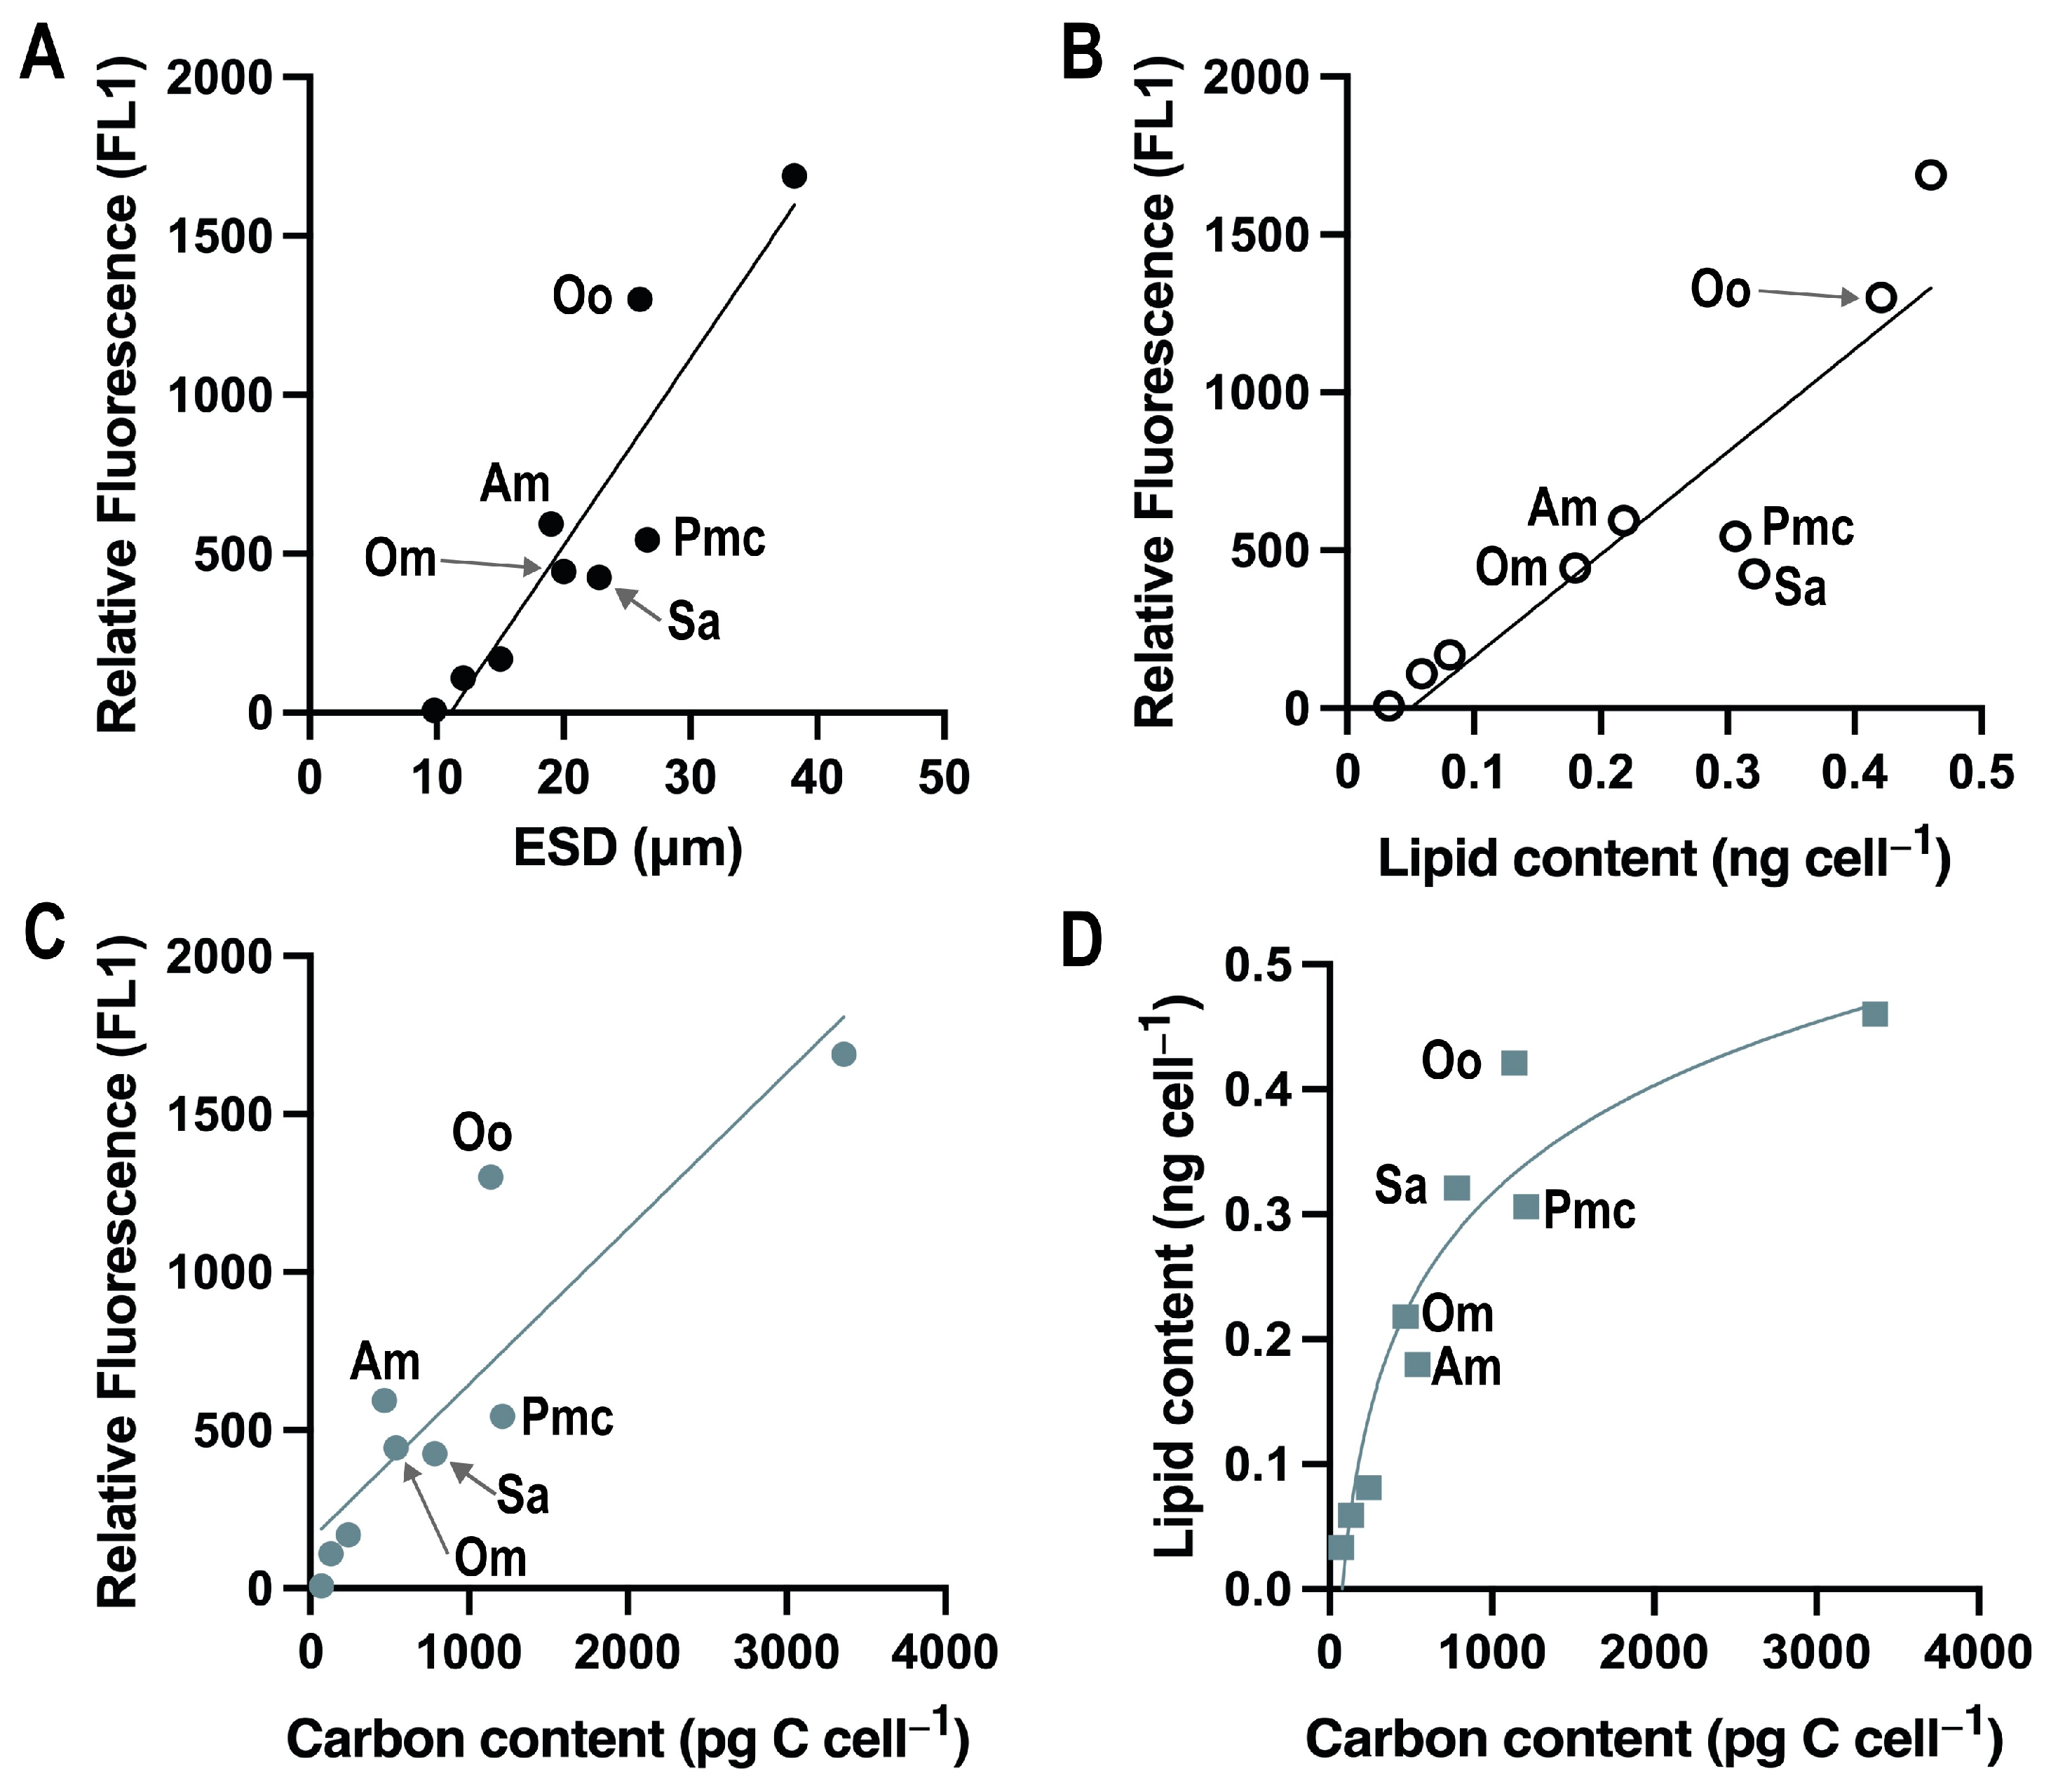
3.4. Comparison of Relative Fluorescence with Size, Lipid Concentration and Carbon Content

Dinoflagellates play an important role as primary producers in marine food webs by converting atmospheric carbon dioxide into organic matter via photosynthesis [40,41]. A portion of this organic matter is stored within the cells in the form of lipids [42,43]. Dinoflagellate sterols, a component of their lipids, are often used as biomarkers to understand their productivity and ecological roles [44]. Estimating the carbon retention of individual plankton species as a primary producer in marine ecosystem is essential for assessing their productivity and its influence on carbon dynamics and the global carbon cycle [45]. In this study, we aimed to compare lipid content with carbon content to evaluate their applicability in productivity and ecological studies.
We compared the relative lipid content measured by flow cytometry with the carbon content calculated based on the cell size. When we compared the relative fluorescence (FL1) with size, lipid content, and carbon content, some species deviated from the general trend (Figure 8).
In a comparison between A. minutum and O. marina, which have similar sizes, the mixotrophic A. minutum exhibited a 20% higher lipid content than the heterotrophic O. marina. Similarly, when comparing O. ovata and P. micans, both capable of photosynthesis, the relative fluorescence of O. ovata was 2.4 times higher, and its lipid content was 40% greater than that of P. micans (Figure 8, Table 2). The relatively low lipid content of heterotrophic dinoflagellates (in the absence of prey) and high lipid content in benthic dinoflagellates suggest that the nutritional mode and habitat of dinoflagellates influence their cellular lipid content. The majority of dinoflagellate species used in this study had a spherical shape; therefore, the carbon content calculated based on cell volume and ESD showed a similar trend. Figure 8D illustrates a positive, non-linear correlation between carbon content (pg C cell−1) and lipid content (ng cell−1), with an R2 value of 0.90, signifying a strong relationship. The lipid content initially increased rapidly as the carbon content increased, but plateaued at higher carbon levels, suggesting a saturation effect.

4. Conclusions

This study demonstrates the effectiveness of flow cytometry with BODIPY 505/515 in estimating the lipid content of dinoflagellates. These findings demonstrate a strong correlation between the relative fluorescence, lipid content, and cell size, facilitating accurate lipid quantification. A straightforward equation was derived to estimate actual lipid content: 0.0003 × FL1 + 0.06. Furthermore, the relationship between the carbon content and lipid content revealed a saturation effect at higher carbon levels. These results underscore the value of flow cytometry as a rapid and efficient method for estimating lipid and carbon contents across diverse dinoflagellate species, offering a significant advantage over conventional extraction-based methods for large-scale studies.

Author Contributions

Conceptualization, J.P. and. E.Y.Y.; Investigation and methodology, S.J.M., J.-H.H. and H.L.; validation and formal analysis, S.J.M. and J.-H.H.; data curation, J.P. and S.J.M.; writing—original draft preparation, J.P., E.Y.Y. and H.L.; writing—review and editing, J.P. All authors have read and agreed to the published version of the manuscript.

Funding

This research was supported by the (24AI007) of Advanced Institute of Convergence Technology (AICT), Suwon, Republic of Korea, and also supported by the National Research Foundation of Korea (NRF) grant (NRF-2022M3I6A1086447) to J.P. funded by the government of Republic of Korea (MSIT).

Institutional Review Board Statement

Not applicable.

Informed Consent Statement

Not applicable.

Data Availability Statement

The original contributions presented in this study are included in the article. Further inquiries can be directed to the corresponding authors.

Acknowledgments

We thank H.J. Jeong of Seoul National University for supporting the use of flow cytometry. We thank the reviewers for their comments.

Conflicts of Interest

The authors declare no conflicts of interest.

References

  1. Piretti, M.V.; Pagliuca, G.; Boni, L.; Pistocchi, R.; Diamante, M.; Gazzotti, T. Investigation of 4-methyl sterols from cultured dinoflagellate algal strains. J. Phycol. 1997, 33, 61–67. [Google Scholar] [CrossRef]
  2. Mansour, M.P.; Volkman, J.K.; Jackson, A.E.; Blackburn, S.I. The fatty acid and sterol composition of five marine dinoflagellates. J. Phycol. 1999, 35, 710–720. [Google Scholar] [CrossRef]
  3. Muscatine, L. The role of symbiotic algae in carbon and energy flux in reef corals. In Coral Reefs: Ecosystems of the World; Dubinski, Z., Ed.; Elsevier: New York, NY, USA, 1990; pp. 75–87. [Google Scholar]
  4. Jeong, H.J.; Yoo, Y.D.; Kim, J.S.; Seong, K.A.; Kang, N.S.; Kim, T.H. Growth, feeding and ecological roles of mixotrophic and heterotrophic dinoflagellates in marine planktonic food webs. Ocean Sci. J. 2010, 45, 65–91. [Google Scholar] [CrossRef]
  5. de la Jara, A.; Mendoza, H.; Martel, A.; Molina, C.; Nordströn, L.; de la Rosa, V.; Díaz, R. Flow cytometric determination of lipid content in a marine dinoflagellate, Crypthecodinium cohnii. J. Appl. Phycol. 2003, 15, 433–438. [Google Scholar] [CrossRef]
  6. Fuentes-Grünewald, C.; Garcés, E.; Rossi, S.; Camp, J. Use of the dinoflagellate Karlodinium veneficum as a sustainable source of biodiesel production. J. Ind. Microbiol. Biotechnol. 2009, 36, 1215–1224. [Google Scholar] [CrossRef]
  7. Hallegraeff, G.M. A review of harmful algal blooms and their apparent global increase. Phycologia 1993, 32, 79–99. [Google Scholar] [CrossRef]
  8. Anderson, D.M. Turning back to red tide. Nature 1997, 388, 513–514. [Google Scholar] [CrossRef]
  9. Park, J.Y.; Jeong, H.J.; Yoo, Y.D.; Yoon, E.Y. Mixotrophic dinoflagellate red tides in Korean waters: Distribution and ecophysiology. Harmful Algae 2013, 30, S28–S40. [Google Scholar] [CrossRef]
  10. Fuentes-Grünewald, C.; Garcés, E.; Alacid, E.; Rossi, S.; Camp, J. Biomass and lipid production of dinoflagellates and raphidophytes in indoor and outdoor photobioreactors. Mar. Biotechnol. 2013, 15, 37–47. [Google Scholar] [CrossRef]
  11. Xu, S.J.; Wu, K.C.; Chan, S.C.Y.; Yau, Y.H.; Chan, K.K.; Lee, F.W.F. Investigation of growth, lipid productivity, and fatty acid profiles in marine bloom-forming dinoflagellates as potential feedstock for biodiesel. J. Mar. Sci. Eng. 2020, 8, 381. [Google Scholar] [CrossRef]
  12. Gui, J.; Chen, S.; Luo, G.; Wu, Z.; Fan, Y.; Yao, L.; Xu, H. Nutrient deficiency and an algicidal bacterium improved the lipid profiles of a novel promising oleaginous dinoflagellate, Prorocentrum donghaiense, for biodiesel production. Appl. Environ. Microbiol. 2021, 87, e01159-21. [Google Scholar] [CrossRef]
  13. Folch, J.; Lees, M.; Sloane Stanley, G.H. A simple method for the isolation and purification of total lipides from animal tissues. J. Biol. Chem. 1957, 226, 497–509. [Google Scholar] [CrossRef] [PubMed]
  14. Bligh, E.G.; Dyer, W.J. A rapid method of total lipid extraction and purification. Can. J. Biochem. Physiol. 1959, 37, 911–917. [Google Scholar] [CrossRef] [PubMed]
  15. Cheng, Y.S.; Zheng, Y.; VanderGheynst, J.S. Rapid quantitative analysis of lipids using a colorimetric method in a microplate format. Lipids 2011, 46, 95–103. [Google Scholar] [CrossRef] [PubMed]
  16. Hao, Z.D.; Liu, P.H.; Yang, X.; Shi, J.; Zhang, S. Screening method for lipid-content microalgae based on sulfo-phospho-vanillin reaction. Adv. Mater. Res. 2013, 610, 3532–3535. [Google Scholar] [CrossRef]
  17. Byreddy, A.R.; Gupta, A.; Barrow, C.J.; Puri, M. A quick colorimetric method for total lipid quantification in microalgae. J. Microbiol. Methods 2016, 125, 28–32. [Google Scholar] [CrossRef] [PubMed]
  18. Mishra, S.K.; Suh, W.I.; Farooq, W.; Moon, M.; Shrivastav, A.; Park, M.S.; Yang, J.W. Rapid quantification of microalgal lipids in aqueous medium by a simple colorimetric method. Bioresour. Technol. 2014, 155, 330–333. [Google Scholar] [CrossRef] [PubMed]
  19. Park, J.; Jeong, H.J.; Yoon, E.Y.; Moon, S.J. Easy and rapid quantification of lipid contents of marine dinoflagellates using the sulpho-phospho-vanillin method. Algae 2016, 31, 391–401. [Google Scholar] [CrossRef]
  20. Marie, D.; Simon, N.; Vaulot, D. Phytoplankton cell counting by flow cytometry. In Algal Culturing Techniques; Anderson, R.A., Ed.; Elsevier Academic Press: San Diego, CA, USA, 2005; pp. 253–267. [Google Scholar]
  21. Cirulis, J.T.; Strasser, B.C.; Scott, J.A.; Ross, G.M. Optimization of staining conditions for microalgae with three lipophilic dyes to reduce precipitation and fluorescence variability. Cytometry A 2012, 81, 618–626. [Google Scholar] [CrossRef] [PubMed]
  22. Hyka, P.; Lickova, S.; Přibyl, P.; Melzoch, K.; Kovar, K. Flow cytometry for the development of biotechnological processes with microalgae. Biotechnol. Adv. 2013, 31, 2–16. [Google Scholar] [CrossRef]
  23. Cooksey, K.E.; Guckert, J.B.; Williams, S.A.; Callis, P.R. Fluorometric determination of the neutral lipid content of microalgal cells using Nile red. J. Microbiol. Methods 1987, 6, 333–345. [Google Scholar] [CrossRef]
  24. Elsey, D.; Jameson, D.; Raleigh, B.; Cooney, M.J. Fluorescent measurement of microalgal neutral lipids. J. Microbiol. Methods 2007, 68, 639–642. [Google Scholar] [CrossRef]
  25. Govender, T.; Ramanna, L.; Rawat, I.; Bux, F. BODIPY staining, an alternative to the Nile Red fluorescence method for the evaluation of intracellular lipids in microalgae. Bioresour. Technol. 2012, 114, 507–511. [Google Scholar] [CrossRef] [PubMed]
  26. Cooper, M.S.; Hardin, W.R.; Petersen, T.W.; Cattolico, R.A. Visualizing “green oil” in live algal cells. J. Biosci. Bioeng. 2010, 109, 198–201. [Google Scholar] [CrossRef] [PubMed]
  27. Chen, W.; Zhang, C.; Song, L.; Sommerfeld, M.; Hu, Q. A high throughput Nile red method for quantitative measurement of neutral lipids in microalgae. J. Microbiol. Methods 2009, 77, 41–47. [Google Scholar] [CrossRef]
  28. Guillard, R.R.L.; Ryther, J.H. Studies of marine planktonic diatoms. I. Cyclotella nana Hustedt and Detonula confervacea (Cleve) Gran. Can. J. Microbiol. 1962, 8, 229–239. [Google Scholar] [CrossRef] [PubMed]
  29. Hillebrand, H.; Dürselen, C.D.; Kirschtel, D.; Pollingher, U.; Zohary, T. Biovolume calculation for pelagic and benthic microalgae. J. Phycol. 1999, 35, 403–424. [Google Scholar] [CrossRef]
  30. Menden-Deuer, S.; Lessand, E. Carbon to volume relationships for dinoflagelaltes, diatoms, and other protest plankton. Limnol. Oceanogr. 2000, 45, 569–579. [Google Scholar] [CrossRef]
  31. Dempster, T.A.; Sommerfeld, M.R. Effects of environmental conditions on growth and lipid accumulation in Nitzschia communis (Bacillariophyceae). J. Phycol. 1998, 34, 712–721. [Google Scholar] [CrossRef]
  32. Wu, S.; Zhang, B.; Huang, A.; Huan, L.; He, L.; Lin, A.; Wang, G. Detection of intracellular neutral lipid content in the marine microalgae Prorocentrum micans and Phaeodactylum tricornutum using Nile red and BODIPY 505/515. J. Appl. Phycol. 2014, 26, 1659–1668. [Google Scholar] [CrossRef]
  33. Laurens, L.M.; Wolfrum, E.J. Rapid compositional analysis of microalgae by NIR spectroscopy. NIR News 2012, 23, 9–11. [Google Scholar] [CrossRef]
  34. De la Hoz Siegler, H.; Ayidzoe, W.; Ben-Zvi, A.; Burrell, R.E.; McCaffrey, W.C. Improving the reliability of fluorescence-based neutral lipid content measurements in microalgal cultures. Algal Res. 2012, 1, 176–184. [Google Scholar] [CrossRef]
  35. Nzayisenga, J.C.; Farge, X.; Groll, S.L.; Sellstedt, A. Effects of light intensity on growth and lipid production in microalgae grown in wastewater. Biotechnol. Biofuels 2020, 13, 4. [Google Scholar] [CrossRef]
  36. Cheirsilp, B.; Torpee, S. Enhanced growth and lipid production of microalgae under mixotrophic culture condition: Effect of light intensity, glucose concentration and fed-batch cultivation. Bioresour. Technol. 2012, 110, 510–516. [Google Scholar] [CrossRef]
  37. Seo, S.H.; Ha, J.S.; Yoo, C.; Srivastava, A.; Ahn, C.Y.; Cho, D.H.; Oh, H.M. Light intensity as major factor to maximize biomass and lipid productivity of Ettlia sp. in CO2-controlled photoautotrophic chemostat. Bioresour. Technol. 2017, 244, 621–628. [Google Scholar] [CrossRef] [PubMed]
  38. Pancha, I.; Chokshi, K.; Mishra, S. Enhanced biofuel production potential with nutritional stress amelioration through optimization of carbon source and light intensity in Scenedesmus sp. CCNM 1077. Bioresour. Technol. 2015, 179, 565–572. [Google Scholar] [CrossRef]
  39. Mendoza Guzmán, H.; de la Jara Valido, A.; Carmona Duarte, L.; Freijanes Presmanes, K. Analysis of interspecific variation in relative fatty acid composition: Use of flow cytometry to estimate unsaturation index and relative polyunsaturated fatty acid content in microalgae. J. Appl. Phycol. 2011, 23, 7–15. [Google Scholar] [CrossRef]
  40. Stoecker, D.K.; Hansen, P.J.; Caron, D.A.; Mitra, A. Mixotrophy in the marine plankton. Ann. Rev. Mar. Sci. 2017, 9, 311–335. [Google Scholar] [CrossRef]
  41. Ser-Giacomi, E.; Zinger, L.; Malviya, S.; De Vargas, C.; Karsenti, E.; Bowler, C.; De Monte, S. Ubiquitous abundance distribution of non-dominant plankton across the global ocean. Nat. Ecol. Evol. 2018, 2, 1243–1249. [Google Scholar] [CrossRef] [PubMed]
  42. Lee, R.F.; Hagen, W.; Kattner, G. Lipid storage in marine zooplankton. Mar. Ecol. Prog. Ser. 2006, 307, 273–306. [Google Scholar] [CrossRef]
  43. Jónasdóttir, S.H. Fatty acid profiles and production in marine phytoplankton. Mar. Drugs 2019, 17, 151. [Google Scholar] [CrossRef] [PubMed]
  44. Cao, Z.; Bi, R.; Zhang, C.; Cui, J.; Li, L.; Ding, Y.; Zhao, M. Quantification of multiple environmental controls on lipid biomarkers in common marine diatoms and dinoflagellates. Mar. Biol. 2023, 170, 136. [Google Scholar] [CrossRef]
  45. Jeong, H.J.; Yoo, Y.D.; Lee, K.; Kang, H.C.; Kim, J.S.; Kim, K.Y. Annual carbon retention of a marine-plankton community in the eutrophic Masan Bay, based on daily measurements. Mar. Biol. 2021, 168, 69. [Google Scholar] [CrossRef]
Figure 1. Gating of dinoflagellate Prorocentrum micans to exclude non-fluorescent particles, bacteria, and detritus. (A) P. micans labelled with Nile Red and fluorescence measurements using FL2. R1 was the selected gate that contained labelled P. micans only. (B) Measurement of the gated population (R1 only).
Microorganisms 13 00044 g001
Figure 2. Flow cytometry analysis of lipid content in experimental dinoflagellate species with BODIPY 505/515 and Side Scatter (SSC) as size factors.
Microorganisms 13 00044 g002
Figure 3. Correlation between experimental cell size measured with a Coulter counter (X-axis, ESD) and flow cytometry (SSC: Side Scatter Detector fluorescence). R2 value is 0.86.
Microorganisms 13 00044 g003
Figure 4. Correlation between the lipid content of nine dinoflagellate species labelled with BODIPY 505/515 and the size factor. (A) Size factor measured by flow cytometry (SSC); (B) size measured by Coulter Multisizer (ESD). Open circles indicate Ostreopsis ovata and open squares indicate Prorocentrum micans. R2 value is 0.87 and 0.81, respectively.
Microorganisms 13 00044 g004
Figure 5. Lipid bodies were labeled with a lipophilic fluorescent dye under an epifluorescence microscope. (A) Heterotrophic Oxyrrhis marina labelled with BODIPY 505/515 was observed using an FITC (green emission) long-pass filter. (B) O. marina labelled with Nile Red was observed using a rhodamine (red emission) filter. (C) Prorocentrum cordatum labelled with BODIPY 505/515, observed using an FITC (green emission) long-pass filter. Orange-red fluorescence indicates chlorophyll autofluorescence. (D) P. cordatum labelled with Nile Red using a rhodamine (red emission) filter. The lipid bodies showed different colors (orange) with chlorophyll autofluorescence (red). Scale bar = 10 µm.
Microorganisms 13 00044 g005
Figure 6. Comparison of lipid content of nine dinoflagellate species labelled with BODIPY 505/515 and Nile Red. Red and green indicate Nile Red and BODIPY 505/515 measurements, respectively. The slope of the linear correlation between the size and lipid content was steeper with Nile Red stain. Open circles indicate Oxyrrhis marina, which has no pigment (heterotrophic), and the elongated rectangle indicates Scrippsiella acuminate. R2 value is 0.85 and 0.83, respectively.
Microorganisms 13 00044 g006
Figure 7. Correlation between BODIPY 505/515 fluorescence and lipid content estimated by the sulfo-phosphor-vanillin reaction in nine dinoflagellate species (three readings per species). The actual lipid content could be estimated multiplying FL1 fluorescence by 0.0003 and adding 0.06. R2 value is 0.83.
Microorganisms 13 00044 g007
Figure 8. Correlations between BODIPY 505/515 fluorescence (FL1) and size (ESD; (A)), lipid content ([20]; (B)) and carbon content (C) of nine dinoflagellate species, and correlation between lipid content and carbon content (D). Oo = O. ovata; Am.= A. minutum; Pmc, P. micans; Sa, S. acuminata; Om, O. marina.
Microorganisms 13 00044 g008
Table 1. List of experimental organisms, trophic modes, and sources.
ClassSpecies NameTrophic ModeOrigin
DinoflagellatesAmphidinium carteraeMixotrophUSA
Kryptoperidinium triquetrumMixotrophMasan bay, Republic of Korea
Prorocentrum cordatumMixotrophKunsan, Republic of Korea
Alexandrium minutumMixotrophCCMP 113
Oxyrrhis marinaHeterotrophKunsan, Republic of Korea
Scrippsiella acuminataMixotrophJeju, Republic of Korea
Ostreopsis ovataAutotrophJeju, Republic of Korea
Prorocentrum micansMixotrophShiwha, Republic of Korea
Lingulaulax polyedraMixotrophUSA
Table 2. Mean equivalent spherical diameter (ESD, μm), relative fluorescence (FL1, FL2) measured by flow cytometry (SSC, FL1 with BODIPY 505/515, FL2 with Nile Red), actual lipid content analyzed using the sulfo-phospho-vanillin (SPV) method [19] and carbon content of the experimental species.
Species NameESD (μm)Relative Fluorescence (Average)Lipid Conc.
(ng Cell−1)
Carbon Contents
(pg Cell−1)
SSCFL1 (BODIPY 505/515)FL2
(Nile Red)
[19]
Amphidinium carterae9.8229.46.836.80.033 ± 0.00472.8
Prorocentrum cordatum12.1930.5108.6210.80.059 ± 0.018131.8
Krytoperidinium triquetrum15641.6169.7111.00.081 ± 0.009241.4
Alexandrium minutum191185.8594.4838.40.218 ± 0.029469.9
Oxyrrhis marina201696.2444.6417.10.180 ± 0.022542.9
Scrippsiella acuminata22.81224.5426.61474.80.321 ± 0.002785.3
Ostreopsis ovata262117.21301.41803.00.421 ± 0.0331136.9
Prorocentrum micans26.61447.1544.7991.20.306 ± 0.0151212.4
Lingulaulax polyedra38.24319.71689.72378.40.460 ± 0.0123360.5
Disclaimer/Publisher’s Note: The statements, opinions and data contained in all publications are solely those of the individual author(s) and contributor(s) and not of MDPI and/or the editor(s). MDPI and/or the editor(s) disclaim responsibility for any injury to people or property resulting from any ideas, methods, instructions or products referred to in the content.

