


Differential Host Gene Expression in Response to Infection by Different Mycobacterium tuberculosis Strains—A Pilot Study

Abstract
1. Introduction
2. Materials and Methods
2.1. Cell Line and M. tuberculosis Strains
2.2. RNA Isolation and Processing
2.3. Microarray Analysis for Differential Gene Expression
2.4. Functional Enrichment Analysis
3. Results
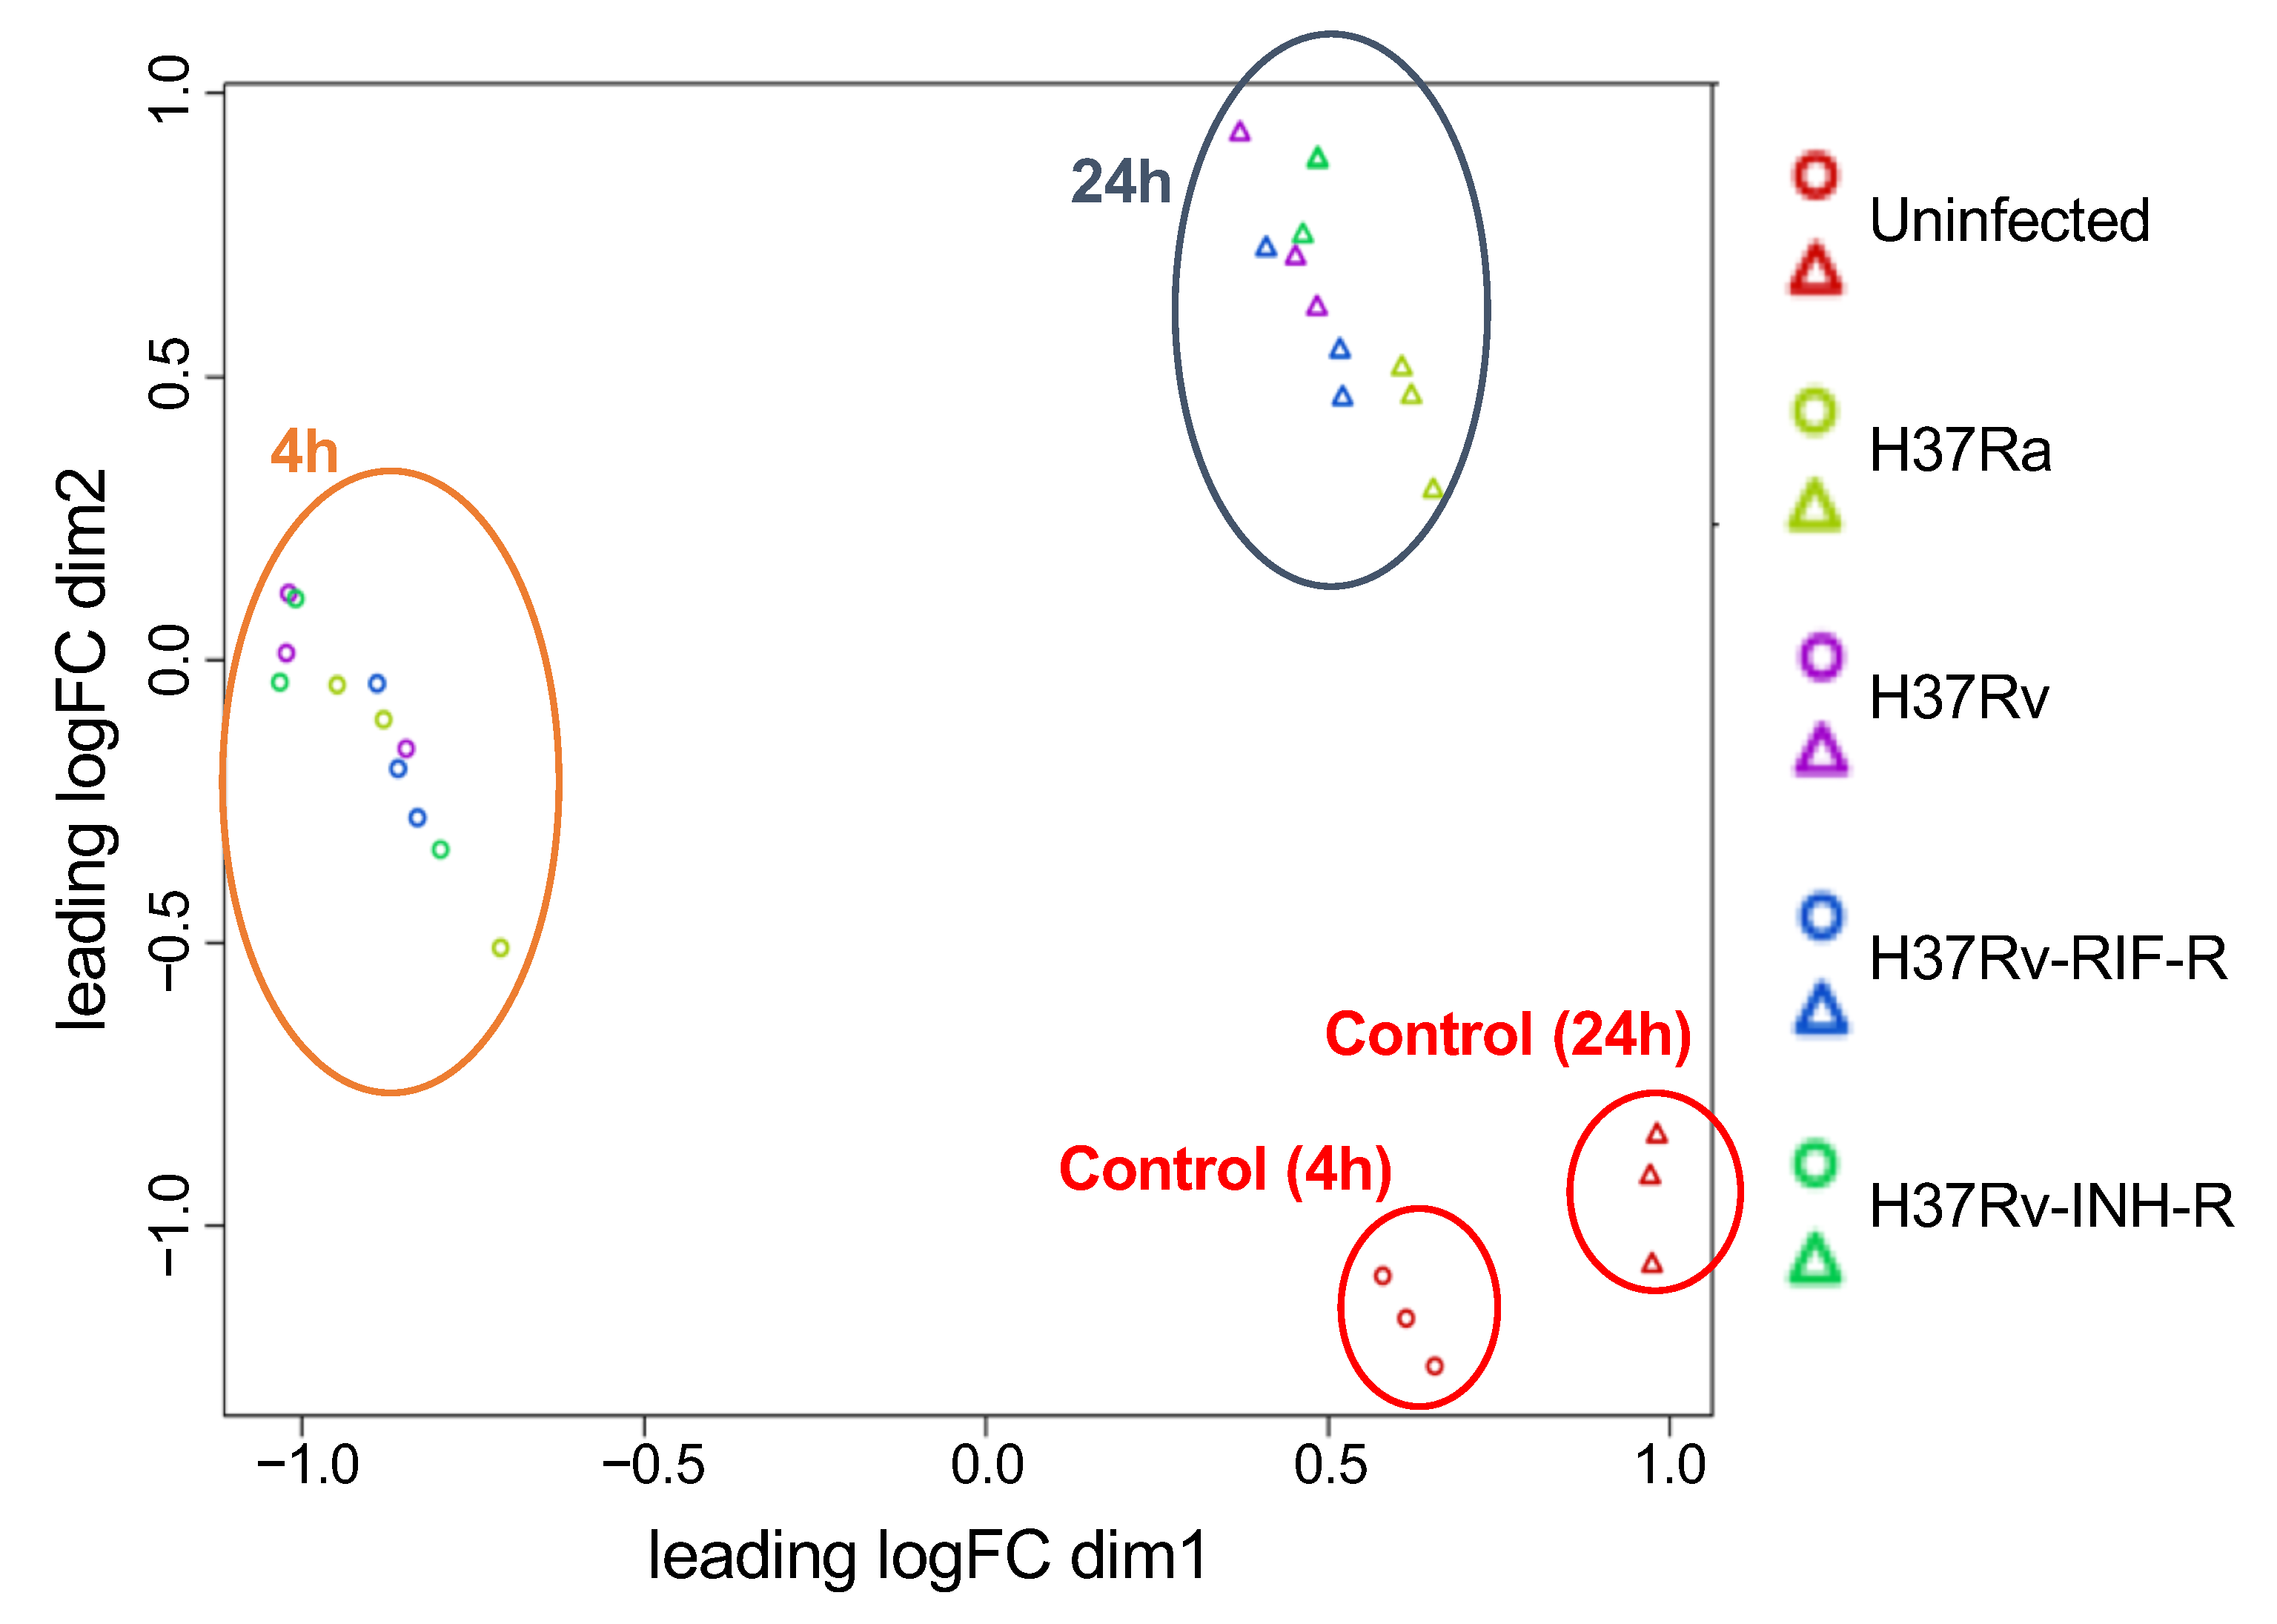
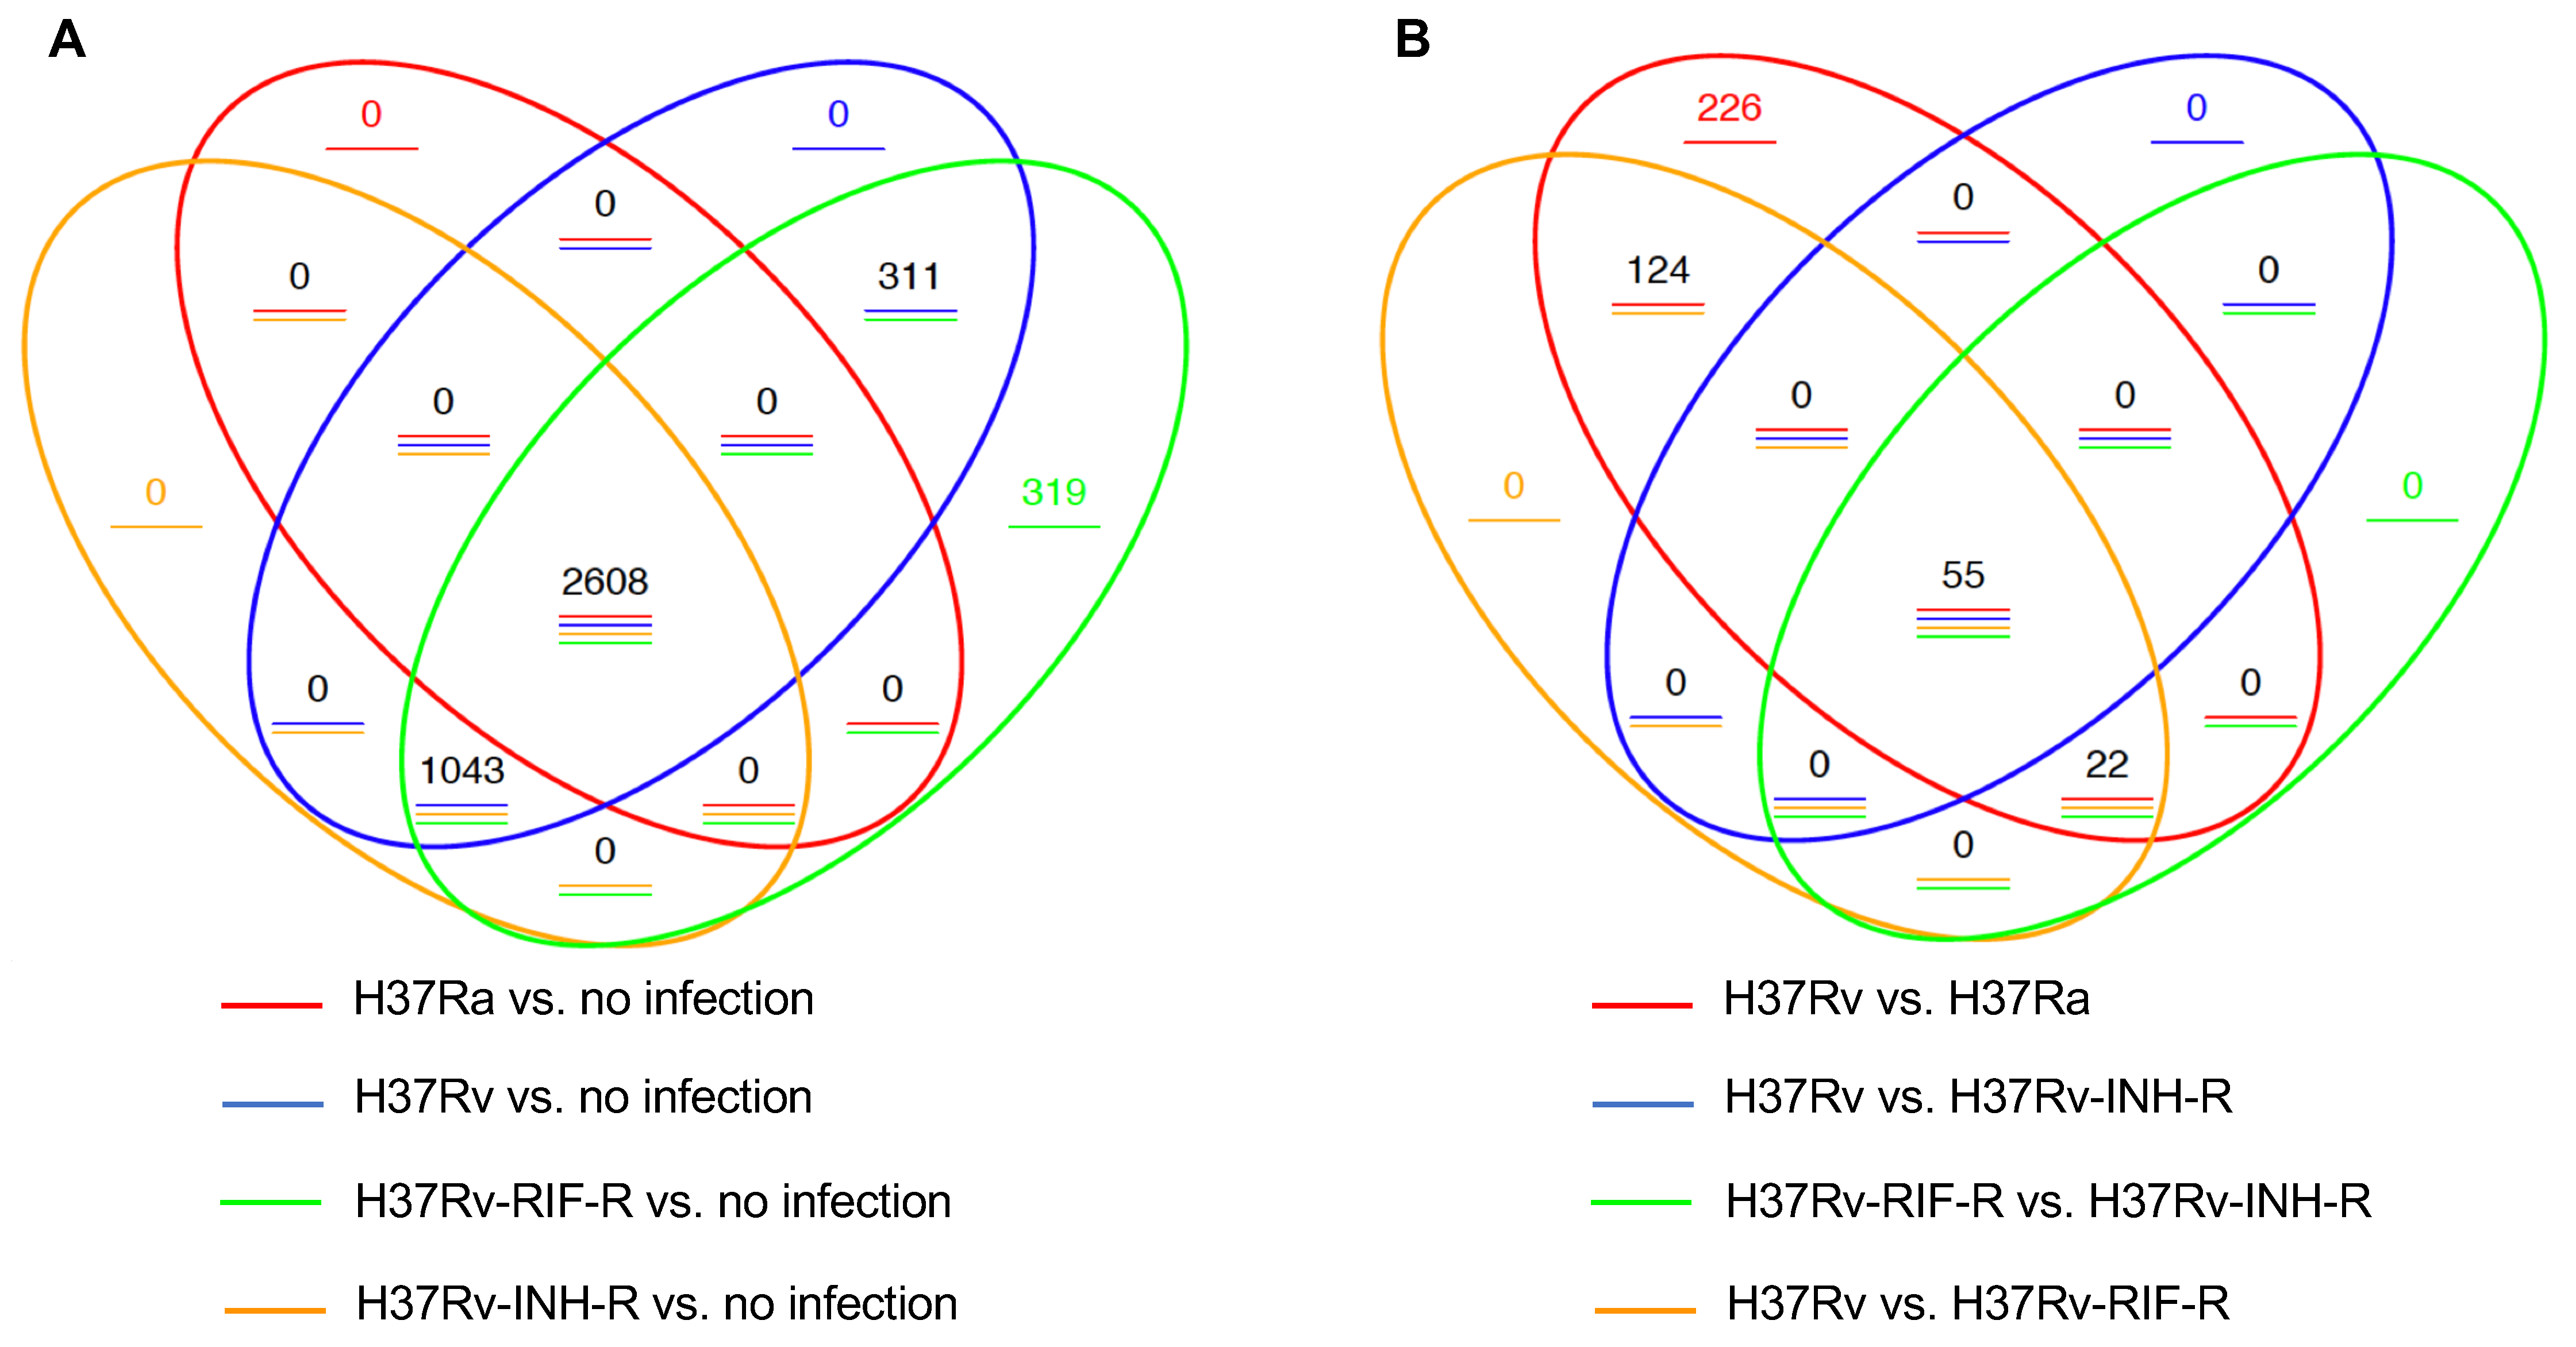
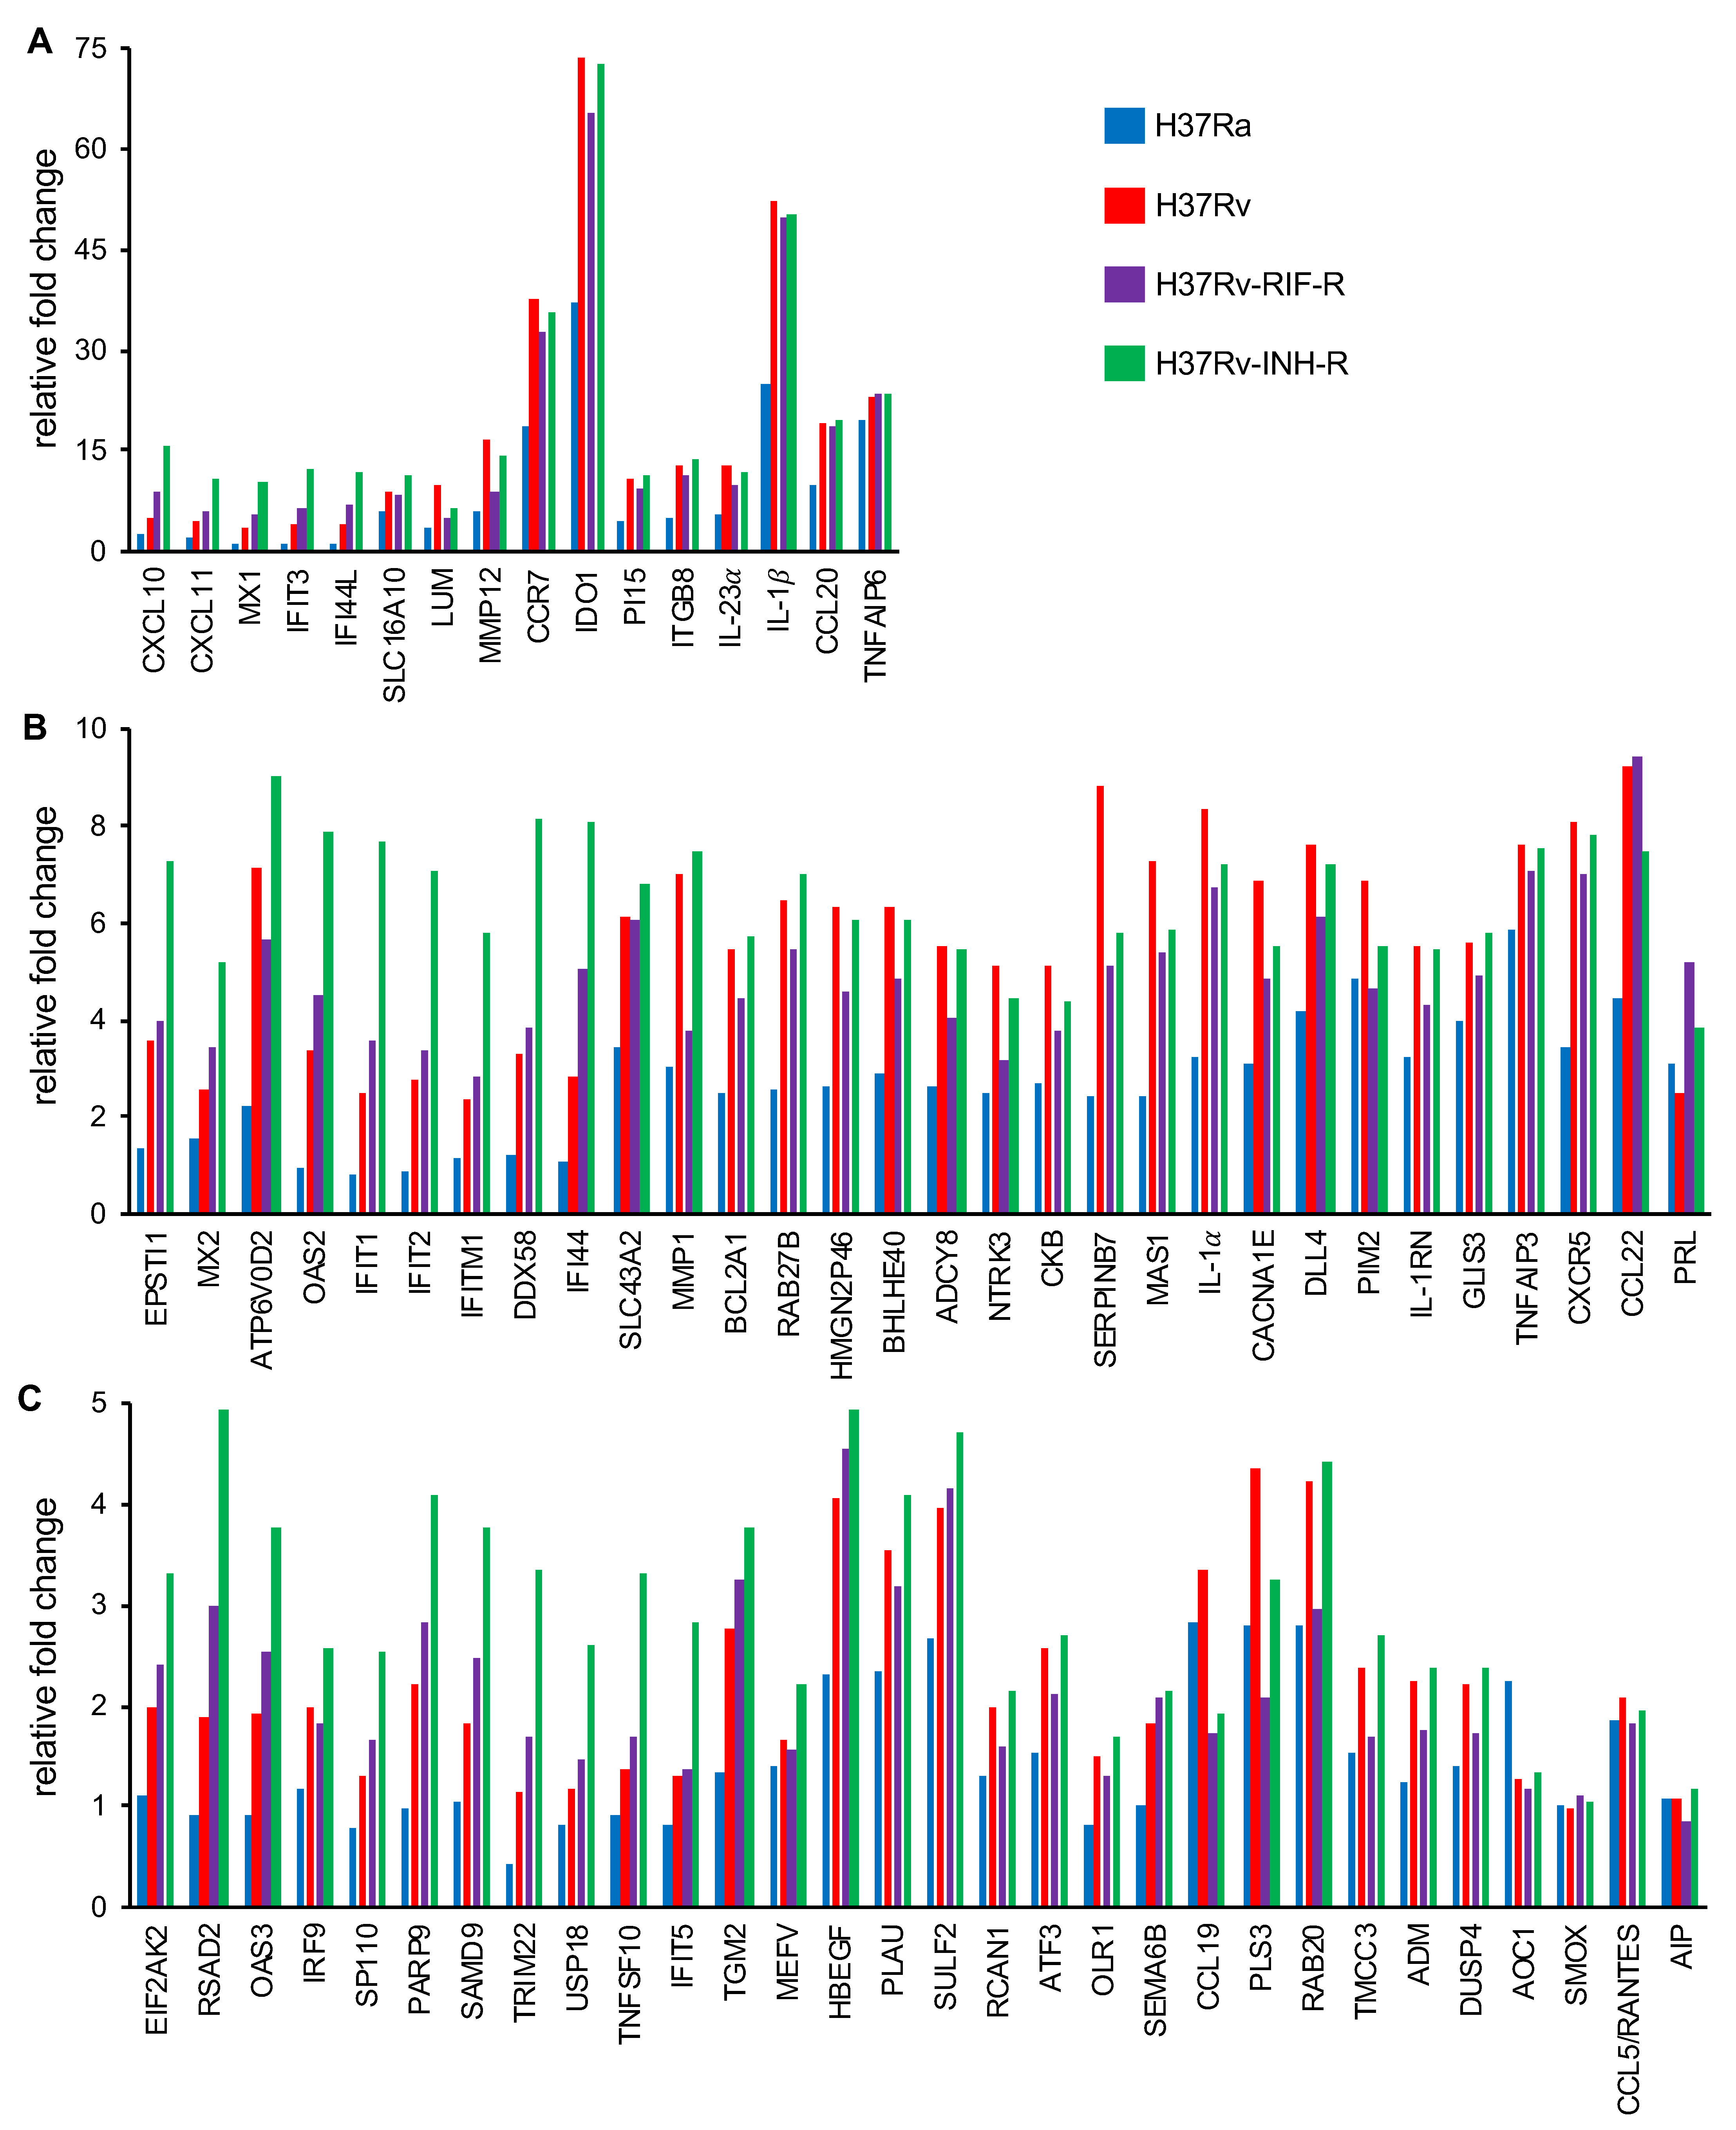
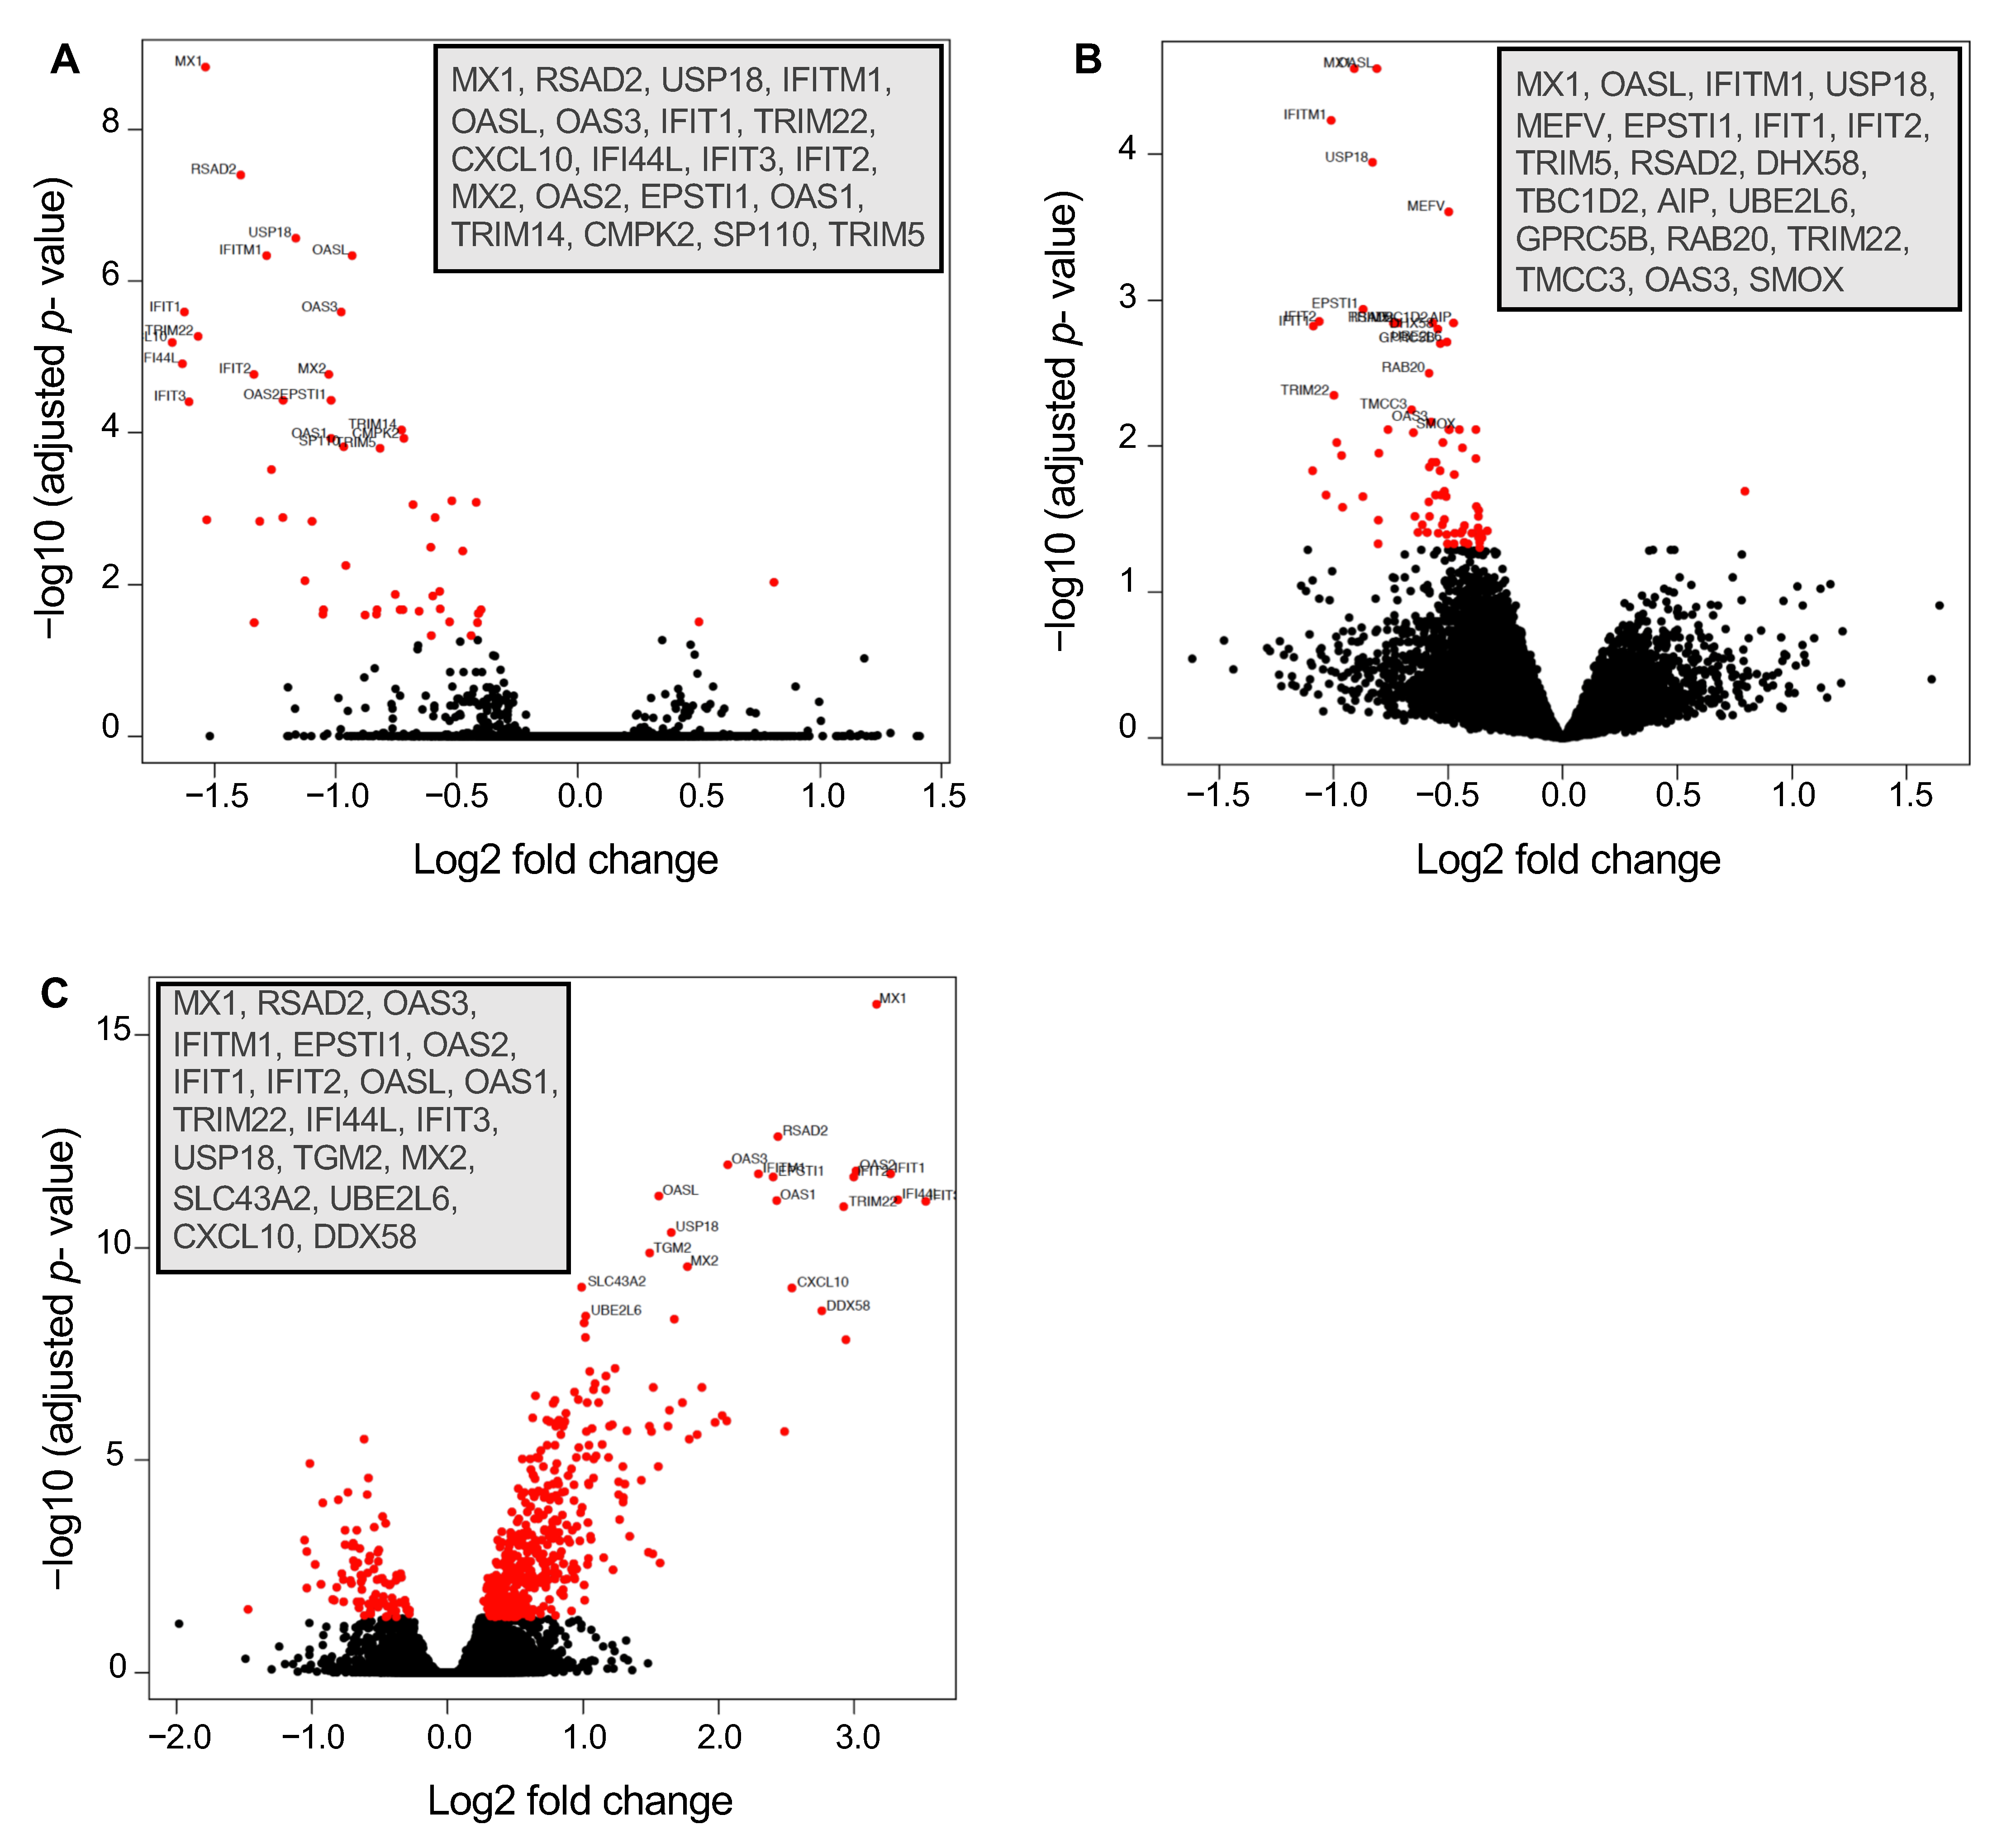
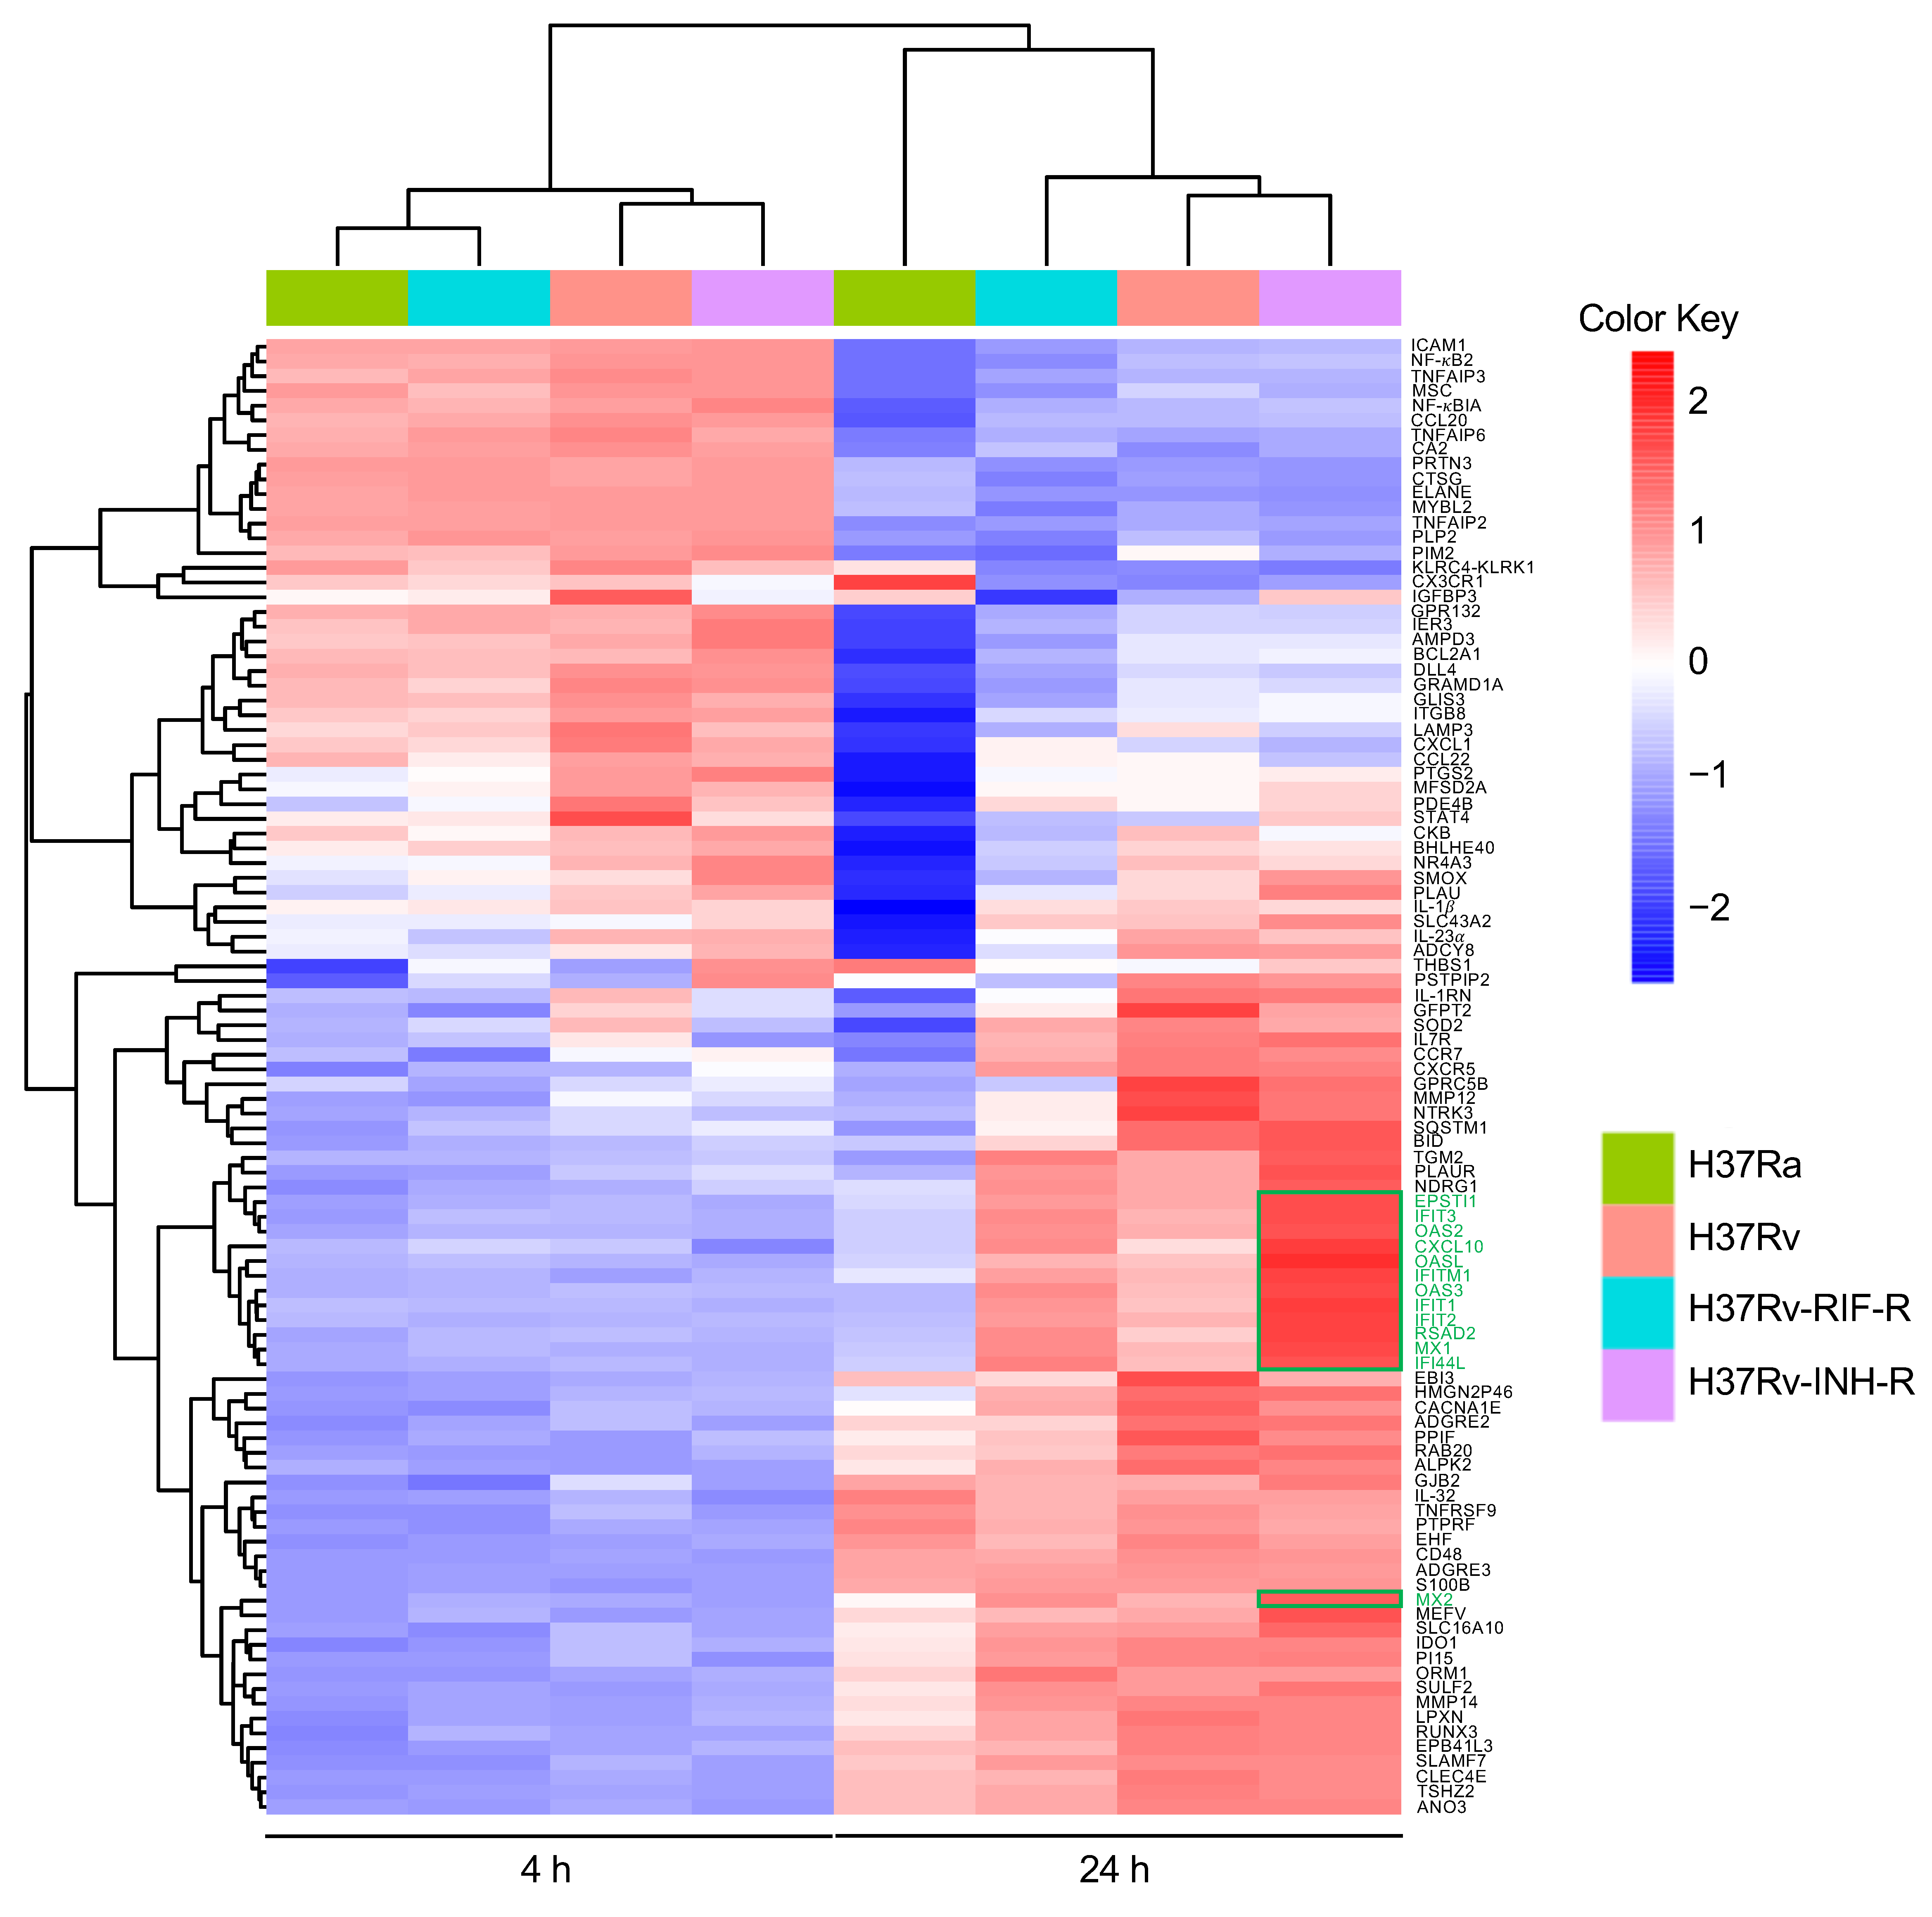
3.1. Identification of Differentially Expressed Genes
3.2. Differential Gene Expression in Isoniazid-Resistant M. tuberculosis Infection
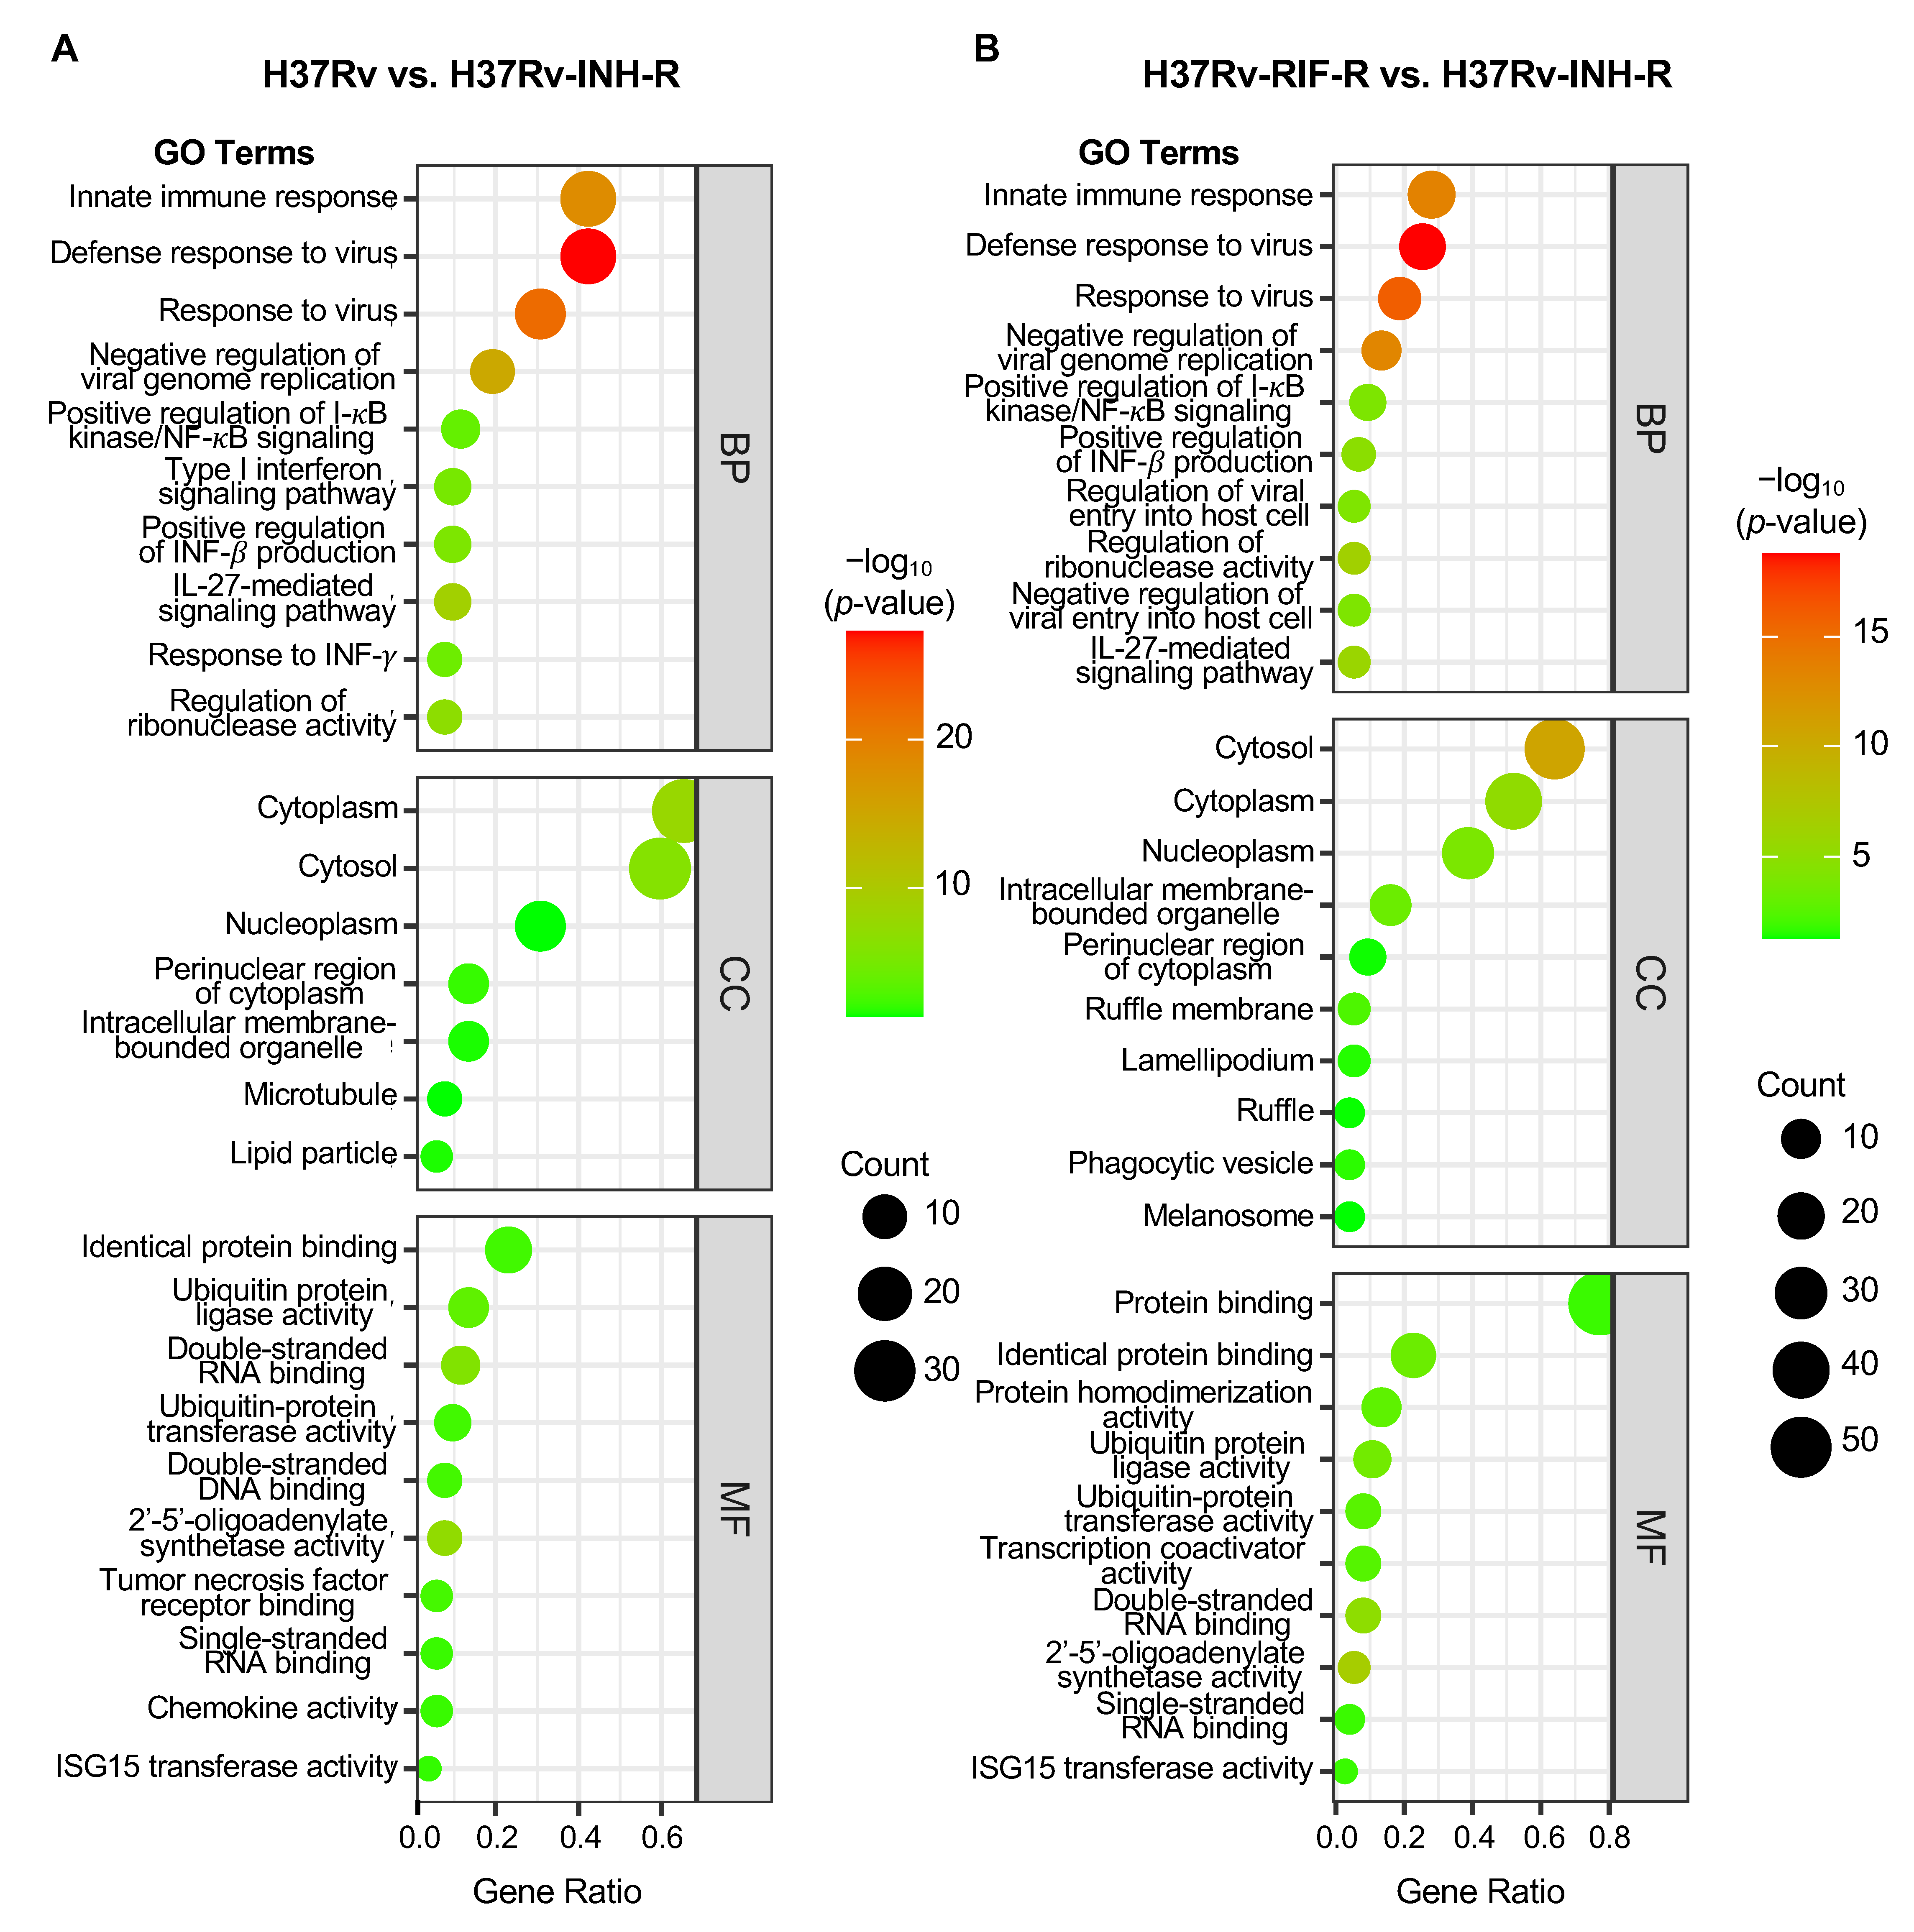
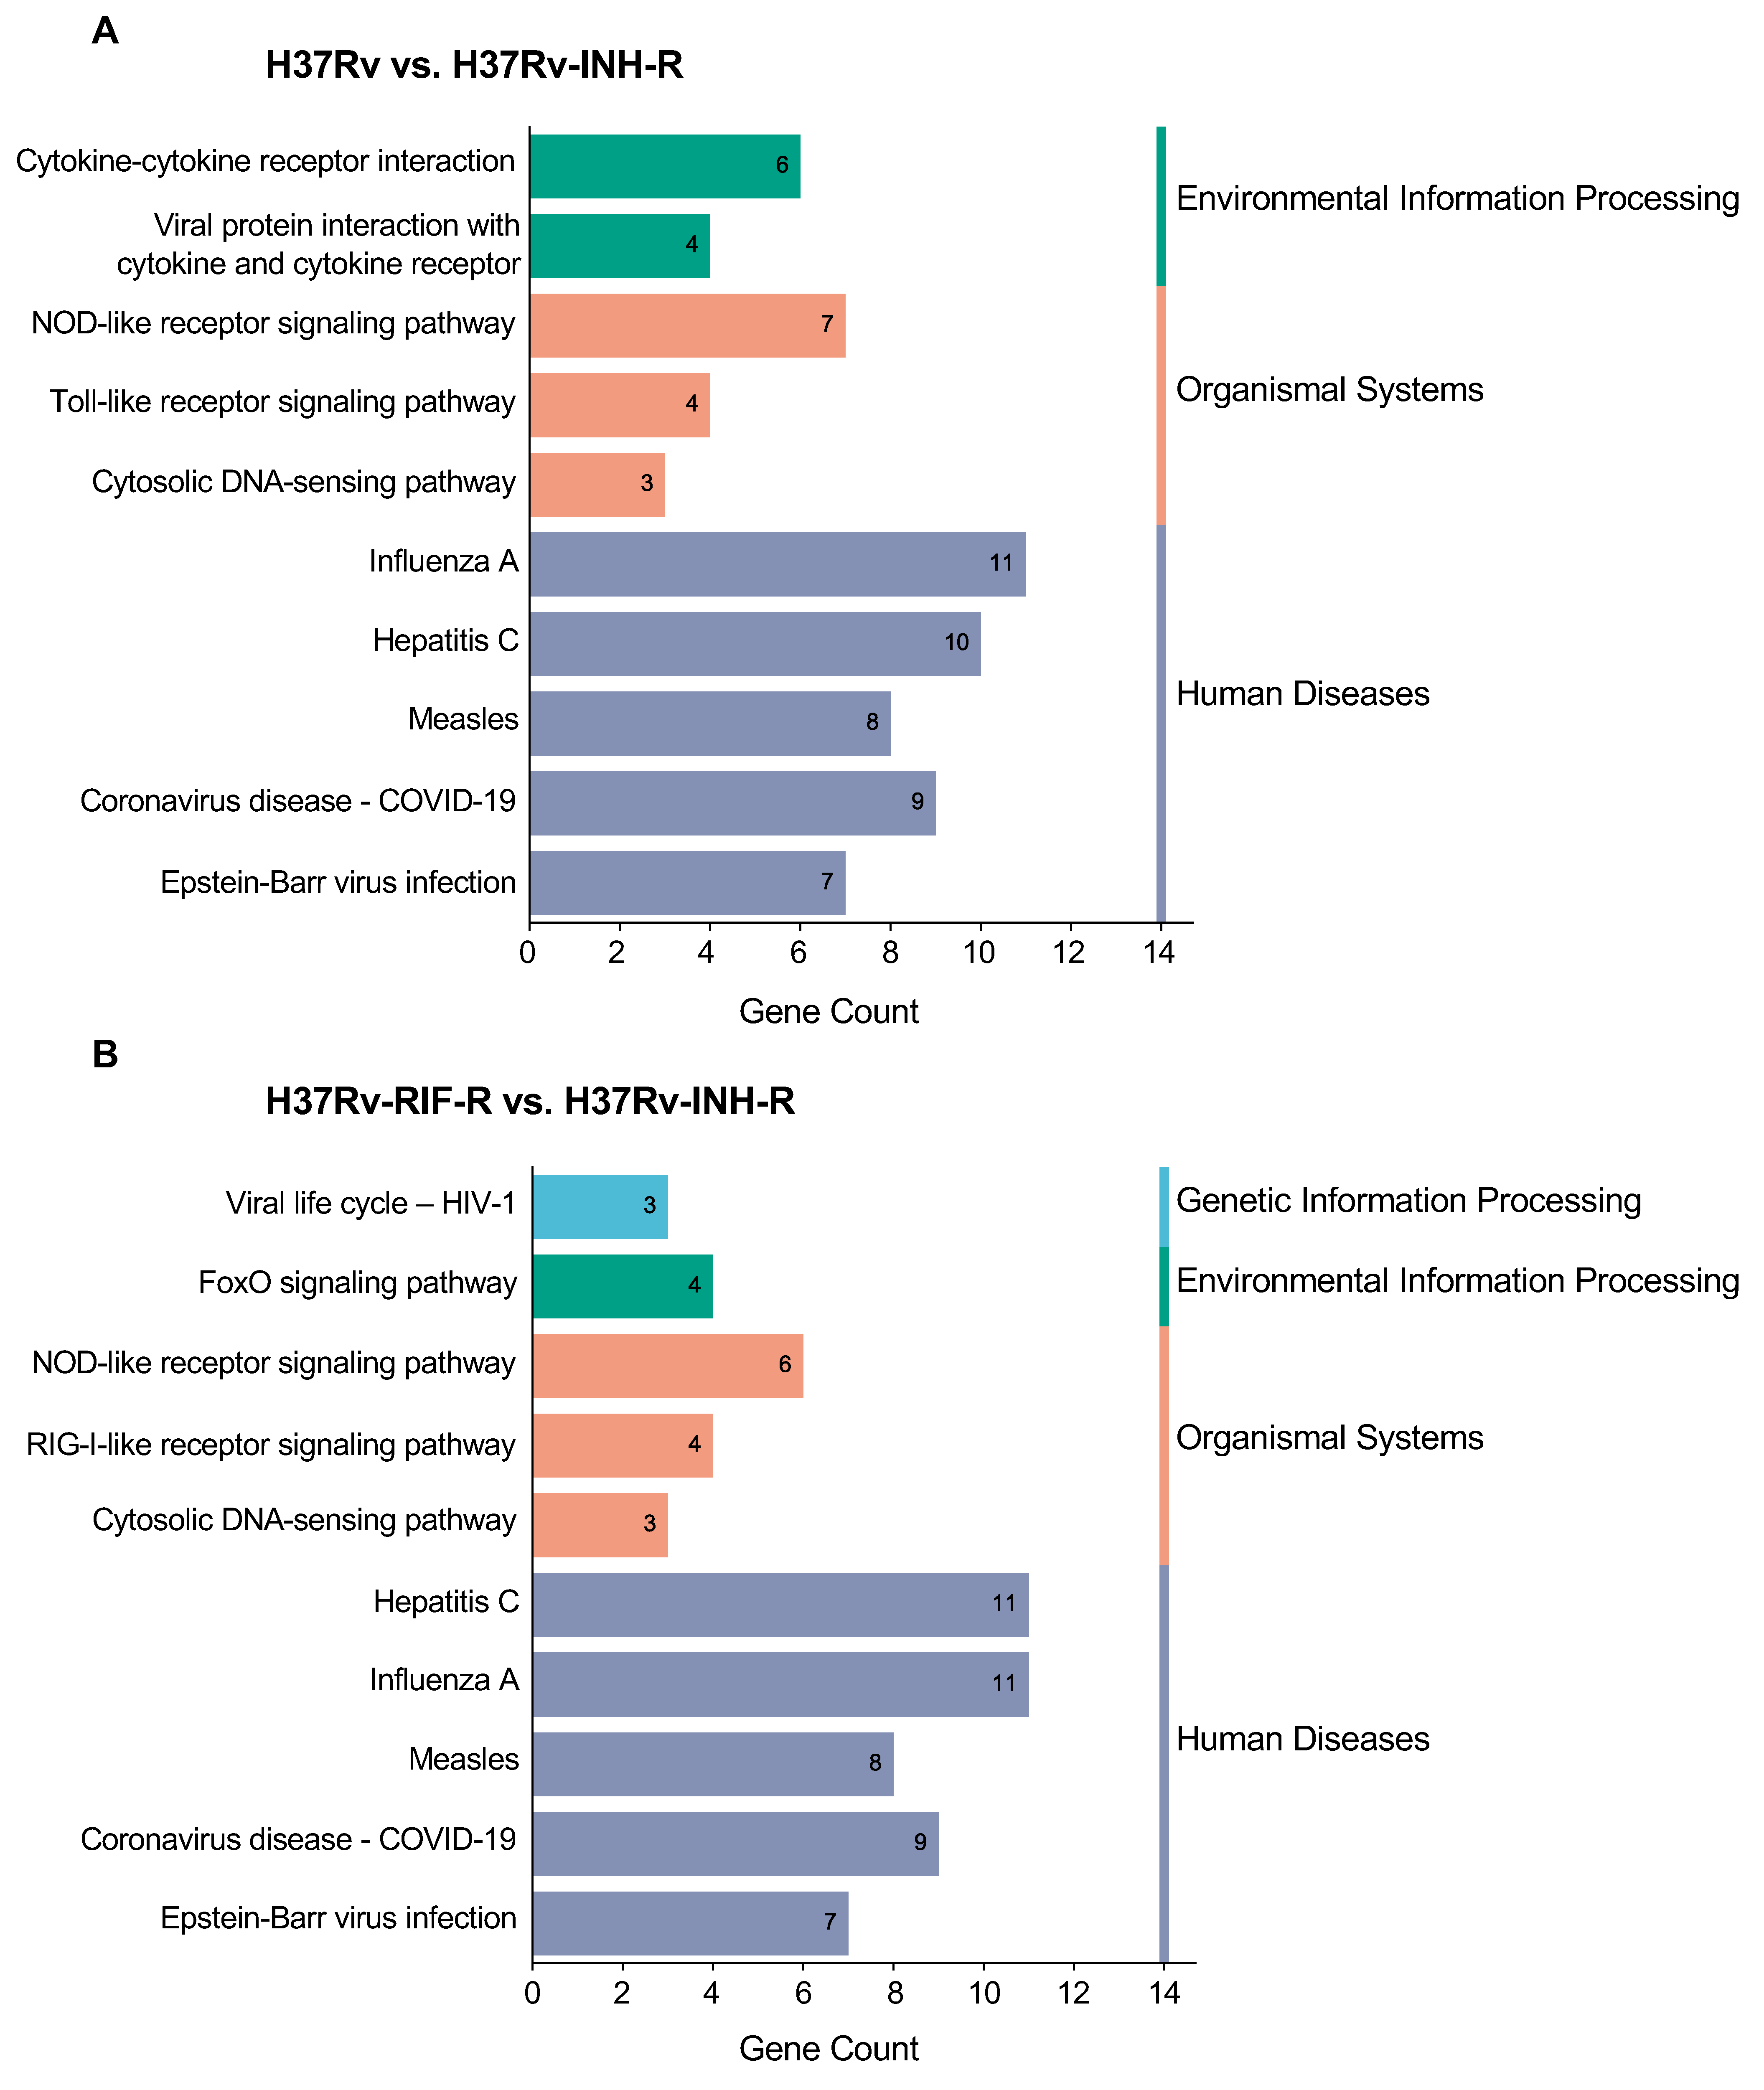
3.3. GO and KEGG Enrichment of DEGs in Immune System-Related Pathways
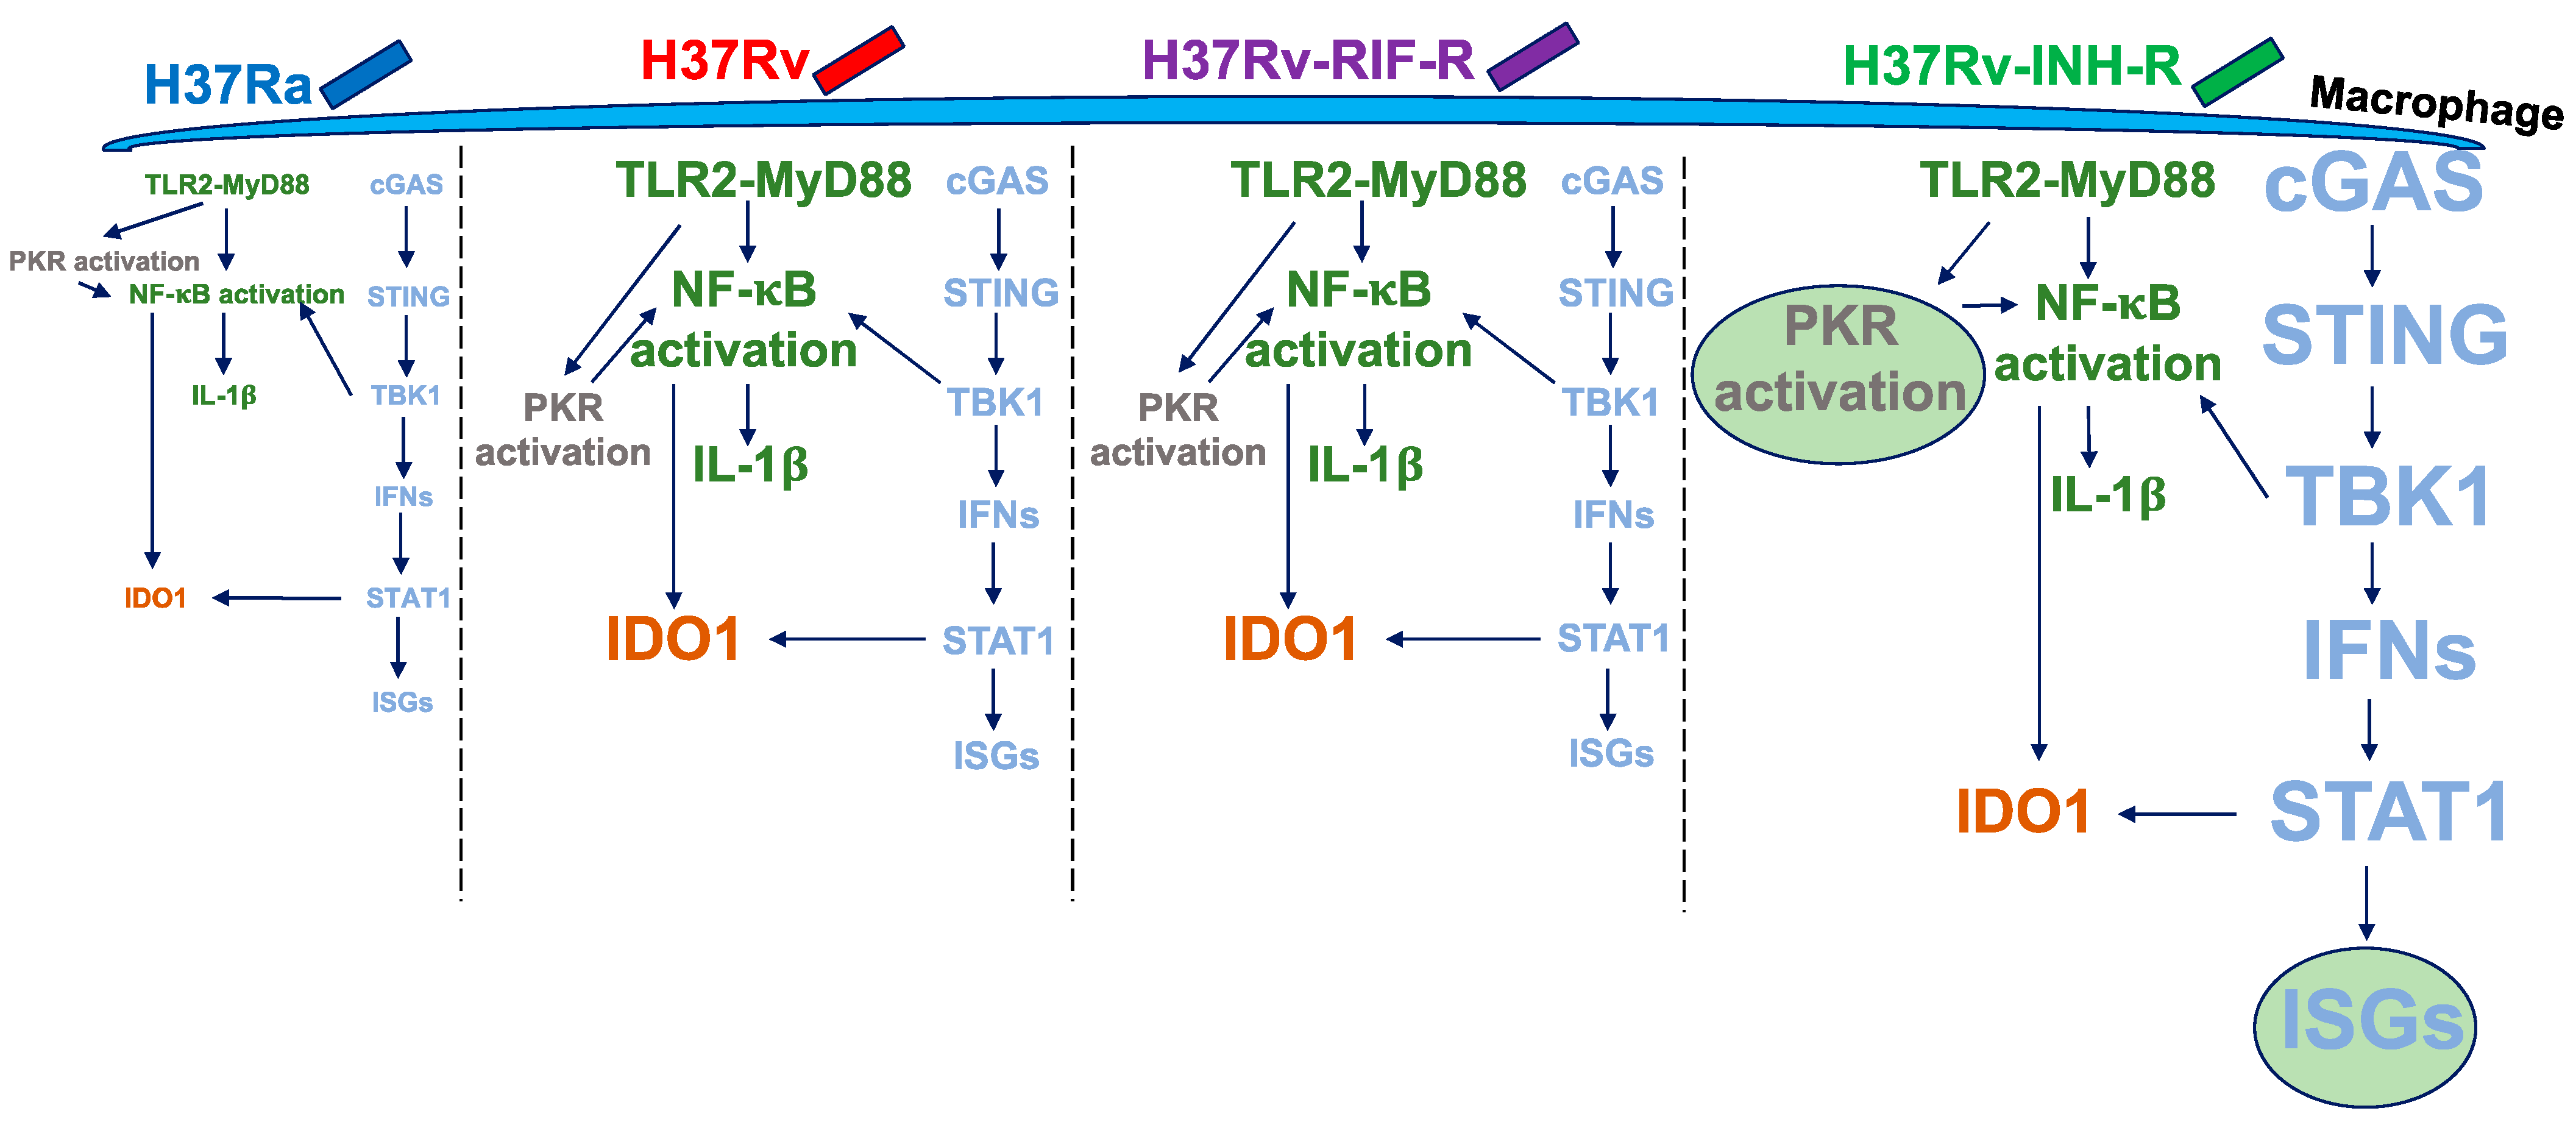
4. Discussion
5. Conclusions
Author Contributions
Funding
Data Availability Statement
Acknowledgments
Conflicts of Interest
References
- World Health Organization (WHO). Global Tuberculosis Report 2022. Available online: https://www.who.int/teams/global-tuberculosis-programme/tb-reports/global-tuberculosis-report-2022 (accessed on 22 June 2023).
- Chakaya, J.; Petersen, E.; Nantanda, R.; Mungai, B.N.; Migliori, G.B.; Amanullah, F.; Lungu, P.; Ntoumi, F.; Kumarasamy, N.; Maeurer, M.; et al. The WHO global tuberculosis 2021 report—Not so good news and turning the tide back to end TB. Int. J. Infect. Dis. 2022, 124, S26–S29. [Google Scholar] [CrossRef] [PubMed]
- Velayati, A.A.; Farnia, P.; Masjedi, M.R. The totally drug resistant tuberculosis (TDR-TB). Int. J. Clin. Exp. Med. 2013, 6, 307–309. [Google Scholar] [PubMed]
- Klopper, M.; Warren, R.M.; Hayes, C.; van Pittius, N.C.G.; Streicher, E.M.; Müller, B.; Sirgel, F.A.; Chabula-Nxiweni, M.; Hoosain, E.; Coetzee, G.; et al. Emergence and spread of extensively and totally drug-resistant tuberculosis, South Africa. Emerg. Infect. Dis. 2013, 19, 449–455. [Google Scholar] [CrossRef] [PubMed]
- Zhan, L.; Wang, J.; Wang, L.; Qin, C. The correlation of drug resistance and virulence in Mycobacterium tuberculosis. Biosaf. Health 2020, 2, 18–24. [Google Scholar] [CrossRef]
- Dean, A.S.; Tosas Auguet, O.; Glaziou, P.; Zignol, M.; Ismail, N.; Kasaeva, T.; Floyd, K. 25 years of surveillance of drug-resistant tuberculosis: Achievements, challenges, and way forward. Lancet Infect. Dis. 2022, 22, e191–e196. [Google Scholar] [CrossRef]
- Getahun, H.; Matteelli, A.; Abubakar, I.; Aziz, M.A.; Baddeley, A.; Barreira, D.; Den Boon, S.; Borroto Gutierrez, S.M.; Bruchfeld, J.; Burhan, E.; et al. Management of latent Mycobacterium tuberculosis infection: WHO guidelines for low tuberculosis burden countries. Eur. Respir. J. 2015, 46, 1563–1576. [Google Scholar] [CrossRef]
- Niederweis, M.; Danilchanka, O.; Huff, J.; Hoffmann, C.; Engelhardt, H. Mycobacterial outer membranes: In search of proteins. Trends Microbiol. 2010, 18, 109–116. [Google Scholar] [CrossRef]
- Velayati, A.A.; Farnia, P.; Ibrahim, T.A.; Haroun, R.Z.; Kuan, H.O.; Ghanavi, J.; Farnia, P.; Kabarei, A.N.; Tabarsi, P.; Omar, A.R.; et al. Differences in cell wall thickness between resistant and nonresistant strains of Mycobacterium tuberculosis: Using transmission electron microscopy. Chemotherapy 2009, 55, 303–307. [Google Scholar] [CrossRef]
- Velayati, A.A.; Farnia, P.; Masjedi, M.R.; Ibrahim, T.A.; Tabarsi, P.; Haroun, R.Z.; Kuan, H.O.; Ghanavi, J.; Varahram, M. Totally drug-resistant tuberculosis strains: Evidence of adaptation at the cellular level. Eur. Respir. J. 2009, 34, 1202–1203. [Google Scholar] [CrossRef]
- Cox, J.S.; Chen, B.; McNeil, M.; Jacobs, W.R. Complex lipid determines tissue-specific replication of Mycobacterium tuberculosis in mice. Nature 1999, 402, 79–83. [Google Scholar] [CrossRef]
- Barry, C.E. Interpreting cell wall ‘virulence factors’ of Mycobacterium tuberculosis. Trends Microbiol. 2001, 9, 237–241. [Google Scholar] [CrossRef] [PubMed]
- Mendelson, M.; Walters, S.; Smith, I.; Kaplan, G. Strain-specific mycobacterial lipids and the stimulation of protective immunity to tuberculosis. Tuberculosis 2005, 85, 407–413. [Google Scholar] [CrossRef] [PubMed]
- Rocha-Ramírez, L.M.; Estrada-García, I.; López-Marín, L.M.; Segura-Salinas, E.; Méndez-Aragón, P.; van Soolingen, D.; Torres-González, R.; Chacón-Salinas, R.; Estrada-Parra, S.; Maldonado-Bernal, C.; et al. Mycobacterium tuberculosis lipids regulate cytokines, TLR-2/4 and MHC class II expression in human macrophages. Tuberculosis 2008, 88, 212–220. [Google Scholar] [CrossRef] [PubMed]
- Takayama, K.; Wang, L.; David, H.L. Effect of isoniazid on the in vivo mycolic acid synthesis, cell growth, and viability of Mycobacterium tuberculosis. Antimicrob. Agents Chemother. 1972, 2, 29–35. [Google Scholar] [CrossRef]
- Glickman, M.S.; Cox, J.S.; Jacobs, W.R. A novel mycolic acid cyclopropane synthetase is required for cording, persistence, and virulence of Mycobacterium tuberculosis. Mol. Cell 2000, 5, 717–727. [Google Scholar] [CrossRef]
- Goossens, S.N.; Sampson, S.L.; Van Rie, A. Mechanisms of drug-induced tolerance in Mycobacterium tuberculosis. Clin. Microbiol. Rev. 2020, 34, e00141-20. [Google Scholar] [CrossRef]
- Shui, W.; Gilmore, S.A.; Sheu, L.; Liu, J.; Keasling, J.D.; Bertozzi, C.R. Quantitative proteomic profiling of host−pathogen interactions: The macrophage response to Mycobacterium tuberculosis lipids. J. Proteome Res. 2009, 8, 282–289. [Google Scholar] [CrossRef]
- Nieto R, L.M.; Mehaffy, C.; Dobos, K.M. Comparing isogenic strains of Beijing genotype Mycobacterium tuberculosis after acquisition of isoniazid resistance: A proteomics approach. Proteomics 2016, 16, 1376–1380. [Google Scholar] [CrossRef]
- Nieto R, L.M.; Mehaffy, C.; Islam, M.N.; Fitzgerald, B.; Belisle, J.; Prenni, J.; Dobos, K. Biochemical characterization of isoniazid-resistant Mycobacterium tuberculosis: Can the analysis of clonal strains reveal novel targetable pathways? Mol. Cell. Proteom. 2018, 17, 1685–1701. [Google Scholar] [CrossRef]
- Telenti, A.; Imboden, P.; Marchesi, F.; Lowrie, D.; Cole, S.; Colston, M.J.; Matter, L.; Schopfer, K.; Bodmer, T. Detection of rifampicin-resistance mutations in Mycobacterium tuberculosis. Lancet 1993, 341, 647–650. [Google Scholar] [CrossRef]
- Chandra, P.; Grigsby, S.J.; Philips, J.A. Immune evasion and provocation by Mycobacterium tuberculosis. Nat. Rev. Microbiol. 2022, 20, 750–766. [Google Scholar] [CrossRef] [PubMed]
- Liu, C.H.; Liu, H.; Ge, B. Innate immunity in tuberculosis: Host defense vs pathogen evasion. Cell. Mol. Immunol. 2017, 14, 963–975. [Google Scholar] [CrossRef] [PubMed]
- Zhai, W.; Wu, F.; Zhang, Y.; Fu, Y.; Liu, Z. The immune escape mechanisms of Mycobacterium tuberculosis. Int. J. Mol. Sci. 2019, 20, 340. [Google Scholar] [CrossRef]
- O’Garra, A.; Redford, P.S.; McNab, F.W.; Bloom, C.I.; Wilkinson, R.J.; Berry, M.P.R. The immune response in tuberculosis. Annu. Rev. Immunol. 2013, 31, 475–527. [Google Scholar] [CrossRef]
- BoseDasgupta, S.; Pieters, J. Macrophage-microbe interaction: Lessons learned from the pathogen Mycobacterium tuberculosis. Semin. Immunopathol. 2018, 40, 577–591. [Google Scholar] [CrossRef] [PubMed]
- Wassermann, R.; Gulen, M.F.; Sala, C.; Perin, S.G.; Lou, Y.; Rybniker, J.; Schmid-Burgk, J.L.; Schmidt, T.; Hornung, V.; Cole, S.T.; et al. Mycobacterium tuberculosis differentially activates cGAS- and inflammasome-dependent intracellular immune responses through ESX-1. Cell Host Microbe 2015, 17, 799–810. [Google Scholar] [CrossRef] [PubMed]
- Zhou, X.; Yang, J.; Zhang, Z.; Zhang, L.; Zhu, B.; Lie, L.; Huang, Y.; Ma, R.; Zhou, C.; Hu, S.; et al. Different signaling pathways define different interferon-stimulated gene expression during mycobacteria infection in macrophages. Int. J. Mol. Sci. 2019, 20, 663. [Google Scholar] [CrossRef]
- Correa-Macedo, W.; Cambri, G.; Schurr, E. The interplay of human and Mycobacterium tuberculosis genomic variability. Front. Genet. 2019, 10, 865. [Google Scholar] [CrossRef]
- Pattanaik, K.P.; Sengupta, S.; Jit, B.P.; Kotak, R.; Sonawane, A. Host-mycobacteria conflict: Immune responses of the host vs. the mycobacteria TLR2 and TLR4 ligands and concomitant host-directed therapy. Microbiol. Res. 2022, 264, 127153. [Google Scholar] [CrossRef]
- López, B.; Aguilar, D.; Orozco, H.; Burger, M.; Espitia, C.; Ritacco, V.; Barrera, L.; Kremer, K.; Hernandez-Pando, R.; Huygen, K.; et al. A marked difference in pathogenesis and immune response induced by different Mycobacterium tuberculosis genotypes. Clin. Exp. Immunol. 2003, 133, 30–37. [Google Scholar] [CrossRef]
- Caws, M.; Thwaites, G.; Dunstan, S.; Hawn, T.R.; Lan, N.T.N.; Thuong, N.T.T.; Stepniewska, K.; Huyen, M.N.T.; Bang, N.D.; Loc, T.H.; et al. The influence of host and bacterial genotype on the development of disseminated disease with Mycobacterium tuberculosis. PLoS Pathog. 2008, 4, e1000034. [Google Scholar] [CrossRef] [PubMed]
- Krishnan, N.; Malaga, W.; Constant, P.; Caws, M.; Tran, T.H.C.; Salmons, J.; Nguyen, T.N.L.; Nguyen, D.B.; Daffé, M.; Young, D.B.; et al. Mycobacterium tuberculosis lineage influences innate immune response and virulence and is associated with distinct cell envelope lipid profiles. PLoS ONE 2011, 6, e23870. [Google Scholar] [CrossRef] [PubMed]
- Parwati, I.; van Crevel, R.; van Soolingen, D. Possible underlying mechanisms for successful emergence of the Mycobacterium tuberculosis Beijing genotype strains. Lancet Infect. Dis. 2010, 10, 103–111. [Google Scholar] [CrossRef] [PubMed]
- Portevin, D.; Gagneux, S.; Comas, I.; Young, D. Human macrophage responses to clinical isolates from the Mycobacterium tuberculosis complex discriminate between ancient and modern lineages. PLoS Pathog. 2011, 7, e1001307. [Google Scholar] [CrossRef]
- Pandey, A.K.; Yang, Y.; Jiang, Z.; Fortune, S.M.; Coulombe, F.; Behr, M.A.; Fitzgerald, K.A.; Sassetti, C.M.; Kelliher, M.A. NOD2, RIP2 and IRF5 play a critical role in the type I interferon response to Mycobacterium tuberculosis. PLoS Pathog. 2009, 5, e1000500. [Google Scholar] [CrossRef]
- Watson, R.O.; Bell, S.L.; MacDuff, D.A.; Kimmey, J.M.; Diner, E.J.; Olivas, J.; Vance, R.E.; Stallings, C.L.; Virgin, H.W.; Cox, J.S. The cytosolic sensor cGAS detects Mycobacterium tuberculosis DNA to induce type I interferons and activate autophagy. Cell Host Microbe 2015, 17, 811–819. [Google Scholar] [CrossRef]
- Weindel, C.G.; Bell, S.L.; Vail, K.J.; West, K.O.; Patrick, K.L.; Watson, R.O. LRRK2 maintains mitochondrial homeostasis and regulates innate immune responses to Mycobacterium tuberculosis. eLife 2020, 9, e51071. [Google Scholar] [CrossRef]
- Vrieling, F.; Kostidis, S.; Spaink, H.P.; Haks, M.C.; Mayboroda, O.A.; Ottenhoff, T.H.M.; Joosten, S.A. Analyzing the impact of Mycobacterium tuberculosis infection on primary human macrophages by combined exploratory and targeted metabolomics. Sci. Rep. 2020, 10, 7085. [Google Scholar] [CrossRef]
- Lee, M.L.; Kuo, F.C.; Whitmore, G.A.; Sklar, J. Importance of replication in microarray gene expression studies: Statistical methods and evidence from repetitive cDNA hybridizations. Proc. Natl. Acad. Sci. USA 2000, 97, 9834–9839. [Google Scholar] [CrossRef]
- Ritchie, M.E.; Phipson, B.; Wu, D.; Hu, Y.; Law, C.W.; Shi, W.; Smyth, G.K. limma powers differential expression analyses for RNA-sequencing and microarray studies. Nucleic Acids Res. 2015, 43, e47. [Google Scholar] [CrossRef]
- Benjamini, Y.; Hochberg, Y. Controlling the false discovery rate: A practical and powerful approach to multiple testing. J. R. Stat. Soc. Ser. B Stat. Methodol. 1995, 57, 289–300. [Google Scholar] [CrossRef]
- Chen, H.; Boutros, P.C. VennDiagram: A package for the generation of highly-customizable Venn and Euler diagrams in R. BMC Bioinformatics 2011, 12, 35. [Google Scholar] [CrossRef] [PubMed]
- Shade, A.; Handelsman, J. Beyond the Venn diagram: The hunt for a core microbiome. Environ. Microbiol. 2012, 14, 4–12. [Google Scholar] [CrossRef] [PubMed]
- Huang, D.W.; Sherman, B.T.; Lempicki, R.A. Systematic and integrative analysis of large gene lists using DAVID bioinformatics resources. Nat. Protoc. 2009, 4, 44–57. [Google Scholar] [CrossRef]
- Sherman, B.T.; Hao, M.; Qiu, J.; Jiao, X.; Baseler, M.W.; Lane, H.C.; Imamichi, T.; Chang, W. DAVID: A web server for functional enrichment analysis and functional annotation of gene lists (2021 update). Nucleic Acids Res. 2022, 50, W216–W221. [Google Scholar] [CrossRef]
- Madhvi, A.; Mishra, H.; Leisching, G.R.; Mahlobo, P.Z.; Baker, B. Comparison of human monocyte derived macrophages and THP1-like macrophages as in vitro models for M. tuberculosis infection. Comp. Immunol. Microbiol. Infect. Dis. 2019, 67, 101355. [Google Scholar] [CrossRef]
- Shah, P.T.; Tufail, M.; Wu, C.; Xing, L. THP-1 cell line model for tuberculosis: A platform for in vitro macrophage manipulation. Tuberculosis 2022, 136, 102243. [Google Scholar] [CrossRef]
- Fontán, P.; Aris, V.; Ghanny, S.; Soteropoulos, P.; Smith, I. Global transcriptional profile of Mycobacterium tuberculosis during THP-1 human macrophage infection. Infect. Immun. 2008, 76, 717–725. [Google Scholar] [CrossRef]
- Pu, W.; Zhao, C.; Wazir, J.; Su, Z.; Niu, M.; Song, S.; Wei, L.; Li, L.; Zhang, X.; Shi, X.; et al. Comparative transcriptomic analysis of THP-1-derived macrophages infected with Mycobacterium tuberculosis H37Rv, H37Ra and BCG. J. Cell. Mol. Med. 2021, 25, 10504–10520. [Google Scholar] [CrossRef]
- Park, C.Y.; Krishnan, A.; Zhu, Q.; Wong, A.K.; Lee, Y.-S.; Troyanskaya, O.G. Tissue-aware data integration approach for the inference of pathway interactions in metazoan organisms. Bioinformatics 2015, 31, 1093–1101. [Google Scholar] [CrossRef]
- Steenken, W., Jr.; Gardner, L.U. History of H37 strain of tubercle bacillus. Am. Rev. Tuberc. 1946, 54, 62–66. [Google Scholar] [PubMed]
- Gautam, U.S.; Mehra, S.; Kaushal, D. In-Vivo gene signatures of Mycobacterium tuberculosis in C3HeB/FeJ mice. PLoS ONE 2015, 10, e0135208. [Google Scholar] [CrossRef] [PubMed]
- Simper, J.D.; Perez, E.; Schlesinger, L.S.; Azad, A.K. Resistance and susceptibility immune factors at play during Mycobacterium tuberculosis infection of macrophages. Pathogens 2022, 11, 1153. [Google Scholar] [CrossRef] [PubMed]
- Juffermans, N.P.; Florquin, S.; Camoglio, L.; Verbon, A.; Kolk, A.H.; Speelman, P.; van Deventer, S.J.; van Der Poll, T. Interleukin-1 signaling is essential for host defense during murine pulmonary tuberculosis. J. Infect. Dis. 2000, 182, 902–908. [Google Scholar] [CrossRef]
- Sugawara, I.; Yamada, H.; Hua, S.; Mizuno, S. Role of interleukin (IL)-1 type 1 receptor in mycobacterial infection. Microbiol. Immunol. 2001, 45, 743–750. [Google Scholar] [CrossRef]
- Fremond, C.M.; Togbe, D.; Doz, E.; Rose, S.; Vasseur, V.; Maillet, I.; Jacobs, M.; Ryffel, B.; Quesniaux, V.F.J. IL-1 receptor-mediated signal is an essential component of MyD88-dependent innate response to Mycobacterium tuberculosis infection. J. Immunol. 2007, 179, 1178–1189. [Google Scholar] [CrossRef]
- Lee, M.-R.; Chang, L.-Y.; Chang, C.-H.; Yan, B.-S.; Wang, J.-Y.; Lin, W.-H. Differed IL-1 beta response between active TB and LTBI cases by ex vivo stimulation of human monocyte-derived macrophage with TB-specific antigen. Dis. Markers 2019, 2019, 7869576. [Google Scholar] [CrossRef]
- Romagnoli, A.; Petruccioli, E.; Palucci, I.; Camassa, S.; Carata, E.; Petrone, L.; Mariano, S.; Sali, M.; Dini, L.; Girardi, E.; et al. Clinical isolates of the modern Mycobacterium tuberculosis lineage 4 evade host defense in human macrophages through eluding IL-1β-induced autophagy. Cell Death Dis. 2018, 9, 624. [Google Scholar] [CrossRef]
- Novikov, A.; Cardone, M.; Thompson, R.; Shenderov, K.; Kirschman, K.D.; Mayer-Barber, K.D.; Myers, T.G.; Rabin, R.L.; Trinchieri, G.; Sher, A.; et al. Mycobacterium tuberculosis triggers host type I IFN signaling to regulate IL-1β production in human macrophages. J. Immunol. 2011, 187, 2540–2547. [Google Scholar] [CrossRef]
- Mishra, A.; Akhtar, S.; Jagannath, C.; Khan, A. Pattern recognition receptors and coordinated cellular pathways involved in tuberculosis immunopathogenesis: Emerging concepts and perspectives. Mol. Immunol. 2017, 87, 240–248. [Google Scholar] [CrossRef]
- Cheung, B.K.W.; Lee, D.C.W.; Li, J.C.B.; Lau, Y.-L.; Lau, A.S.Y. A role for double-stranded RNA-activated protein kinase PKR in Mycobacterium-induced cytokine expression. J. Immunol. 2005, 175, 7218–7225. [Google Scholar] [CrossRef] [PubMed]
- Smyth, R.; Berton, S.; Rajabalee, N.; Chan, T.; Sun, J. Protein kinase R restricts the intracellular survival of Mycobacterium tuberculosis by promoting selective autophagy. Front. Microbiol. 2021, 11, 613963. [Google Scholar] [CrossRef] [PubMed]
- Deb, A.; Haque, S.J.; Mogensen, T.; Silverman, R.H.; Williams, B.R. RNA-dependent protein kinase PKR is required for activation of NF-kappa B by IFN-gamma in a STAT1-independent pathway. J. Immunol. 2001, 166, 6170–6180. [Google Scholar] [CrossRef] [PubMed]
- Deng, J.; Lu, P.D.; Zhang, Y.; Scheuner, D.; Kaufman, R.J.; Sonenberg, N.; Harding, H.P.; Ron, D. Translational repression mediates activation of nuclear factor kappa B by phosphorylated translation initiation factor 2. Mol. Cell. Biol. 2004, 24, 10161–10168. [Google Scholar] [CrossRef]
- Yu, H.; Peng, C.; Zhang, C.; Stoian, A.M.M.; Tazi, L.; Brennan, G.; Rothenburg, S. Maladaptation after a virus host switch leads to increased activation of the pro-inflammatory NF-κB pathway. Proc. Natl. Acad. Sci. USA 2022, 119, e2115354119. [Google Scholar] [CrossRef]
- Fallahi-Sichani, M.; Kirschner, D.E.; Linderman, J.J. NF-κB signaling dynamics play a key role in infection control in tuberculosis. Front. Physiol. 2012, 3, 170. [Google Scholar] [CrossRef]
- Bai, X.; Feldman, N.E.; Chmura, K.; Ovrutsky, A.R.; Su, W.-L.; Griffin, L.; Pyeon, D.; McGibney, M.T.; Strand, M.J.; Numata, M.; et al. Inhibition of nuclear factor-kappa B activation decreases survival of Mycobacterium tuberculosis in human macrophages. PLoS ONE 2013, 8, e61925. [Google Scholar] [CrossRef]
- Chakrabarti, A.; Banerjee, S.; Franchi, L.; Loo, Y.-M.; Gale, M.; Núñez, G.; Silverman, R.H. RNase L activates the NLRP3 inflammasome during viral infections. Cell Host Microbe 2015, 17, 466–477. [Google Scholar] [CrossRef]
- Banerjee, S. RNase L and the NLRP3-inflammasome: An old merchant in a new trade. Cytokine Growth Factor Rev. 2016, 29, 63–70. [Google Scholar] [CrossRef]
- Gusho, E.; Baskar, D.; Banerjee, S. New advances in our understanding of the “unique” RNase L in host pathogen interaction and immune signaling. Cytokine 2020, 133, 153847. [Google Scholar] [CrossRef]
- Jacobo-Delgado, Y.M.; Rodríguez-Carlos, A.; Serrano, C.J.; Rivas-Santiago, B. Mycobacterium tuberculosis cell-wall and antimicrobial peptides: A mission impossible? Front. Immunol. 2023, 14, 1194923. [Google Scholar] [CrossRef] [PubMed]
- Allué-Guardia, A.; García, J.I.; Torrelles, J.B. Evolution of drug-resistant Mycobacterium tuberculosis strains and their adaptation to the human lung environment. Front. Microbiol. 2021, 12, 612675. [Google Scholar] [CrossRef] [PubMed]
- Schami, A.; Islam, M.N.; Belisle, J.T.; Torrelles, J.B. Drug-resistant strains of Mycobacterium tuberculosis: Cell envelope profiles and interactions with the host. Front. Cell. Infect. Microbiol. 2023, 13, 1274175. [Google Scholar] [CrossRef] [PubMed]
- Ramaswamy, S.V.; Reich, R.; Dou, S.-J.; Jasperse, L.; Pan, X.; Wanger, A.; Quitugua, T.; Graviss, E.A. Single nucleotide polymorphisms in genes associated with isoniazid resistance in Mycobacterium tuberculosis. Antimicrob. Agents Chemother. 2003, 47, 1241–1250. [Google Scholar] [CrossRef]
- Hazbón, M.H.; Brimacombe, M.; del Valle, M.B.; Cavatore, M.; Guerrero, M.I.; Varma-Basil, M.; Billman-Jacobe, H.; Lavender, C.; Fyfe, J.; García-García, L.; et al. Population genetics study of isoniazid resistance mutations and evolution of multidrug-resistant Mycobacterium tuberculosis. Antimicrob. Agents Chemother. 2006, 50, 2640–2649. [Google Scholar] [CrossRef]
- Vilchèze, C.; Jacobs, W.R. The mechanism of isoniazid killing: Clarity through the scope of genetics. Annu. Rev. Microbiol. 2007, 61, 35–50. [Google Scholar] [CrossRef]
- Da Silva, P.E.A.; Palomino, J.C. Molecular basis and mechanisms of drug resistance in Mycobacterium tuberculosis: Classical and new drugs. J. Antimicrob. Chemother. 2011, 66, 1417–1430. [Google Scholar] [CrossRef]
- Sun, G.; Luo, T.; Yang, C.; Dong, X.; Li, J.; Zhu, Y.; Zheng, H.; Tian, W.; Wang, S.; Barry, C.E.; et al. Dynamic population changes in Mycobacterium tuberculosis during acquisition and fixation of drug resistance in patients. J. Infect. Dis. 2012, 206, 1724–1733. [Google Scholar] [CrossRef]
- Palomino, J.C.; Martin, A. Drug resistance mechanisms in Mycobacterium tuberculosis. Antibiotics 2014, 3, 317–340. [Google Scholar] [CrossRef]
- Cohen, K.A.; Abeel, T.; Manson McGuire, A.; Desjardins, C.A.; Munsamy, V.; Shea, T.P.; Walker, B.J.; Bantubani, N.; Almeida, D.V.; Alvarado, L.; et al. Evolution of extensively drug-resistant tuberculosis over four decades: Whole genome sequencing and dating analysis of Mycobacterium tuberculosis isolates from KwaZulu-Natal. PLoS Med. 2015, 12, e1001880. [Google Scholar] [CrossRef]
- Unissa, A.N.; Subbian, S.; Hanna, L.E.; Selvakumar, N. Overview on mechanisms of isoniazid action and resistance in Mycobacterium tuberculosis. Infect. Genet. Evol. 2016, 45, 474–492. [Google Scholar] [CrossRef] [PubMed]
- Dookie, N.; Rambaran, S.; Padayatchi, N.; Mahomed, S.; Naidoo, K. Evolution of drug resistance in Mycobacterium tuberculosis: A review on the molecular determinants of resistance and implications for personalized care. J. Antimicrob. Chemother. 2018, 73, 1138–1151. [Google Scholar] [CrossRef]
- Cohen, T.; Becerra, M.C.; Murray, M.B. Isoniazid resistance and the future of drug-resistant tuberculosis. Microb. Drug Resist. 2004, 10, 280–285. [Google Scholar] [CrossRef] [PubMed]
- Seifert, M.; Catanzaro, D.; Catanzaro, A.; Rodwell, T.C. Genetic mutations associated with isoniazid resistance in Mycobacterium tuberculosis: A systematic review. PLoS ONE 2015, 10, e0119628. [Google Scholar] [CrossRef] [PubMed]
- Valafar, S.J. Systematic review of mutations associated with isoniazid resistance points to continuing evolution and subsequent evasion of molecular detection, and potential for emergence of multidrug resistance in clinical strains of Mycobacterium tuberculosis. Antimicrob. Agents Chemother. 2021, 65, e02091-20. [Google Scholar] [CrossRef] [PubMed]
- Borrell, S.; Gagneux, S. Infectiousness, reproductive fitness and evolution of drug-resistant Mycobacterium tuberculosis. Int. J. Tuberc. Lung Dis. 2009, 13, 1456–1466. [Google Scholar] [PubMed]
- Ford, C.B.; Shah, R.R.; Maeda, M.K.; Gagneux, S.; Murray, M.B.; Cohen, T.; Johnston, J.C.; Gardy, J.; Lipsitch, M.; Fortune, S.M. Mycobacterium tuberculosis mutation rate estimates from different lineages predict substantial differences in the emergence of drug-resistant tuberculosis. Nat. Genet. 2013, 45, 784–790. [Google Scholar] [CrossRef]
- Izu, A.; Cohen, T.; Degruttola, V. Bayesian estimation of mixture models with prespecified elements to compare drug resistance in treatment-naïve and experienced tuberculosis cases. PLoS Comput. Biol. 2013, 9, e1002973. [Google Scholar] [CrossRef]
- Eldholm, V.; Monteserin, J.; Rieux, A.; Lopez, B.; Sobkowiak, B.; Ritacco, V.; Balloux, F. Four decades of transmission of a multidrug-resistant Mycobacterium tuberculosis outbreak strain. Nat. Commun. 2015, 6, 7119. [Google Scholar] [CrossRef]
- Manson, A.L.; Cohen, K.A.; Abeel, T.; Desjardins, C.A.; Armstrong, D.T.; Barry, C.E.; Brand, J.; TBResist Global Genome Consortium; Chapman, S.B.; Cho, S.-N.; et al. Genomic analysis of globally diverse Mycobacterium tuberculosis strains provides insights into the emergence and spread of multidrug resistance. Nat. Genet. 2017, 49, 395–402. [Google Scholar] [CrossRef]
- Stagg, H.R.; Lipman, M.C.; McHugh, T.D.; Jenkins, H.E. Isoniazid-resistant tuberculosis: A cause for concern? Int. J. Tuberc. Lung Dis. 2017, 21, 129–139. [Google Scholar] [CrossRef] [PubMed]
- Smith, C.M.; Baker, R.E.; Proulx, M.K.; Mishra, B.B.; Long, J.E.; Park, S.W.; Lee, H.-N.; Kiritsy, M.C.; Bellerose, M.M.; Olive, A.J.; et al. Host-pathogen genetic interactions underlie tuberculosis susceptibility in genetically diverse mice. eLife 2022, 11, e74419. [Google Scholar] [CrossRef] [PubMed]
- Zak, D.E.; Penn-Nicholson, A.; Scriba, T.J.; Thompson, E.; Suliman, S.; Amon, L.M.; Mahomed, H.; Erasmus, M.; Whatney, W.; Hussey, G.D.; et al. A blood RNA signature for tuberculosis disease risk: A prospective cohort study. Lancet 2016, 387, 2312–2322. [Google Scholar] [CrossRef] [PubMed]
- Warsinske, H.; Vashisht, R.; Khatri, P. Host-response-based gene signatures for tuberculosis diagnosis: A systematic comparison of 16 signatures. PLoS Med. 2019, 16, e1002786. [Google Scholar] [CrossRef]
- Mulenga, H.; Zauchenberger, C.-Z.; Bunyasi, E.W.; Mbandi, S.K.; Mendelsohn, S.C.; Kagina, B.; Penn-Nicholson, A.; Scriba, T.J.; Hatherill, M. Performance of diagnostic and predictive host blood transcriptomic signatures for tuberculosis disease: A systematic review and meta-analysis. PLoS ONE 2020, 15, e0237574. [Google Scholar] [CrossRef]
- Vargas, R.; Abbott, L.; Bower, D.; Frahm, N.; Shaffer, M.; Yu, W.-H. Gene signature discovery and systematic validation across diverse clinical cohorts for TB prognosis and response to treatment. PLoS Comput. Biol. 2023, 19, e1010770. [Google Scholar] [CrossRef]
- Madamarandawala, P.; Rajapakse, S.; Gunasena, B.; Madegedara, D.; Magana-Arachchi, D. A host blood transcriptional signature differentiates multi-drug/rifampin-resistant tuberculosis (MDR/RR-TB) from drug susceptible tuberculosis: A pilot study. Mol. Biol. Rep. 2023, 50, 3935–3943. [Google Scholar] [CrossRef]


| GO Category | GO Term | Description | Gene Number | p-Value | Fold Enrichment | Bonferroni | FDR |
|---|---|---|---|---|---|---|---|
| BP | GO:0051607 | Defense response to virus | 22 | 5.12 × 10⁻²⁸ | 36.71 | 1.91 × 10⁻²⁵ | 1.78 × 10⁻²⁵ |
| GO:0009615 | Response to virus | 16 | 1.03 × 10⁻²² | 56.31 | 3.83 × 10⁻²⁰ | 1.78 × 10⁻²⁰ | |
| GO:0045087 | Innate immune response | 22 | 4.35 × 10⁻¹⁹ | 13.8 | 1.62 × 10⁻¹⁶ | 5.03 × 10⁻¹⁷ | |
| GO:0045071 | Negative regulation of viral genome replication | 10 | 2.00 × 10⁻¹⁵ | 84.16 | 7.45 × 10⁻¹³ | 1.73 × 10⁻¹³ | |
| GO:0070106 | Interleukin-27-mediated signaling pathway | 5 | 1.26 × 10⁻⁹ | 276.53 | 4.70 × 10⁻⁷ | 8.75 × 10⁻⁸ | |
| GO:0060700 | Regulation of ribonuclease activity | 4 | 1.52 × 10⁻⁷ | 309.71 | 5.67 × 10⁻⁵ | 8.78 × 10⁻⁶ | |
| GO:0032728 | Positive regulation of interferon-β production | 5 | 3.42 × 10⁻⁶ | 47.21 | 0.0013 | 1.70 × 10⁻⁴ | |
| GO:0060337 | Type I interferon signaling pathway | 5 | 8.97 × 10⁻⁶ | 37.22 | 0.0033 | 3.89 × 10⁻⁴ | |
| GO:0034341 | Response to interferon-γ | 4 | 4.27 × 10⁻⁵ | 57.35 | 0.016 | 0.0016 | |
| GO:0043123 | Positive regulation of I-κB kinase/NF-κB signaling | 6 | 1.41 × 10⁻⁴ | 11.73 | 0.051 | 0.0045 | |
| CC | GO:0005737 | Cytoplasm | 34 | 1.35 × 10⁻⁸ | 2.44 | 1.08 × 10⁻⁶ | 1.08 × 10⁻⁶ |
| GO:0005829 | Cytosol | 31 | 8.20 × 10⁻⁷ | 2.27 | 6.56 × 10⁻⁵ | 3.28 × 10⁻⁵ | |
| GO:0048471 | Perinuclear region of cytoplasm | 7 | 0.0085 | 3.84 | 0.494 | 0.226 | |
| GO:0005811 | Lipid particle | 3 | 0.027 | 11.53 | 0.887 | 0.463 | |
| GO:0043231 | Intracellular membrane-bounded organelle | 7 | 0.029 | 2.92 | 0.904 | 0.463 | |
| GO:0005874 | Microtubule | 4 | 0.044 | 4.98 | 0.973 | 0.517 | |
| GO:0005654 | Nucleoplasm | 16 | 0.045 | 1.63 | 0.975 | 0.517 | |
| MF | GO:0001730 | 2′-5′-oligoadenylate synthetase activity | 4 | 6.94 × 10⁻⁸ | 370.84 | 8.88 × 10⁻⁶ | 8.26 × 10⁻⁶ |
| GO:0003725 | Double-stranded RNA binding | 6 | 1.48 × 10⁻⁶ | 30.07 | 1.89 × 10⁻⁴ | 8.79 × 10⁻⁵ | |
| GO:0061630 | Ubiquitin-protein ligase activity | 7 | 2.51 × 10⁻⁴ | 7.7 | 0.032 | 0.01 | |
| GO:0005164 | Tumor necrosis factor receptor binding | 3 | 0.0032 | 34.77 | 0.339 | 0.072 | |
| GO:0003690 | Double-stranded DNA binding | 4 | 0.0036 | 12.68 | 0.374 | 0.072 | |
| GO:0042802 | Identical protein binding | 12 | 0.0041 | 2.62 | 0.413 | 0.072 | |
| GO:0004842 | Ubiquitin-protein transferase activity | 5 | 0.0042 | 7.42 | 0.421 | 0.072 | |
| GO:0003727 | Single-stranded RNA binding | 3 | 0.0071 | 23.18 | 0.601 | 0.102 | |
| GO:0008009 | Chemokine activity | 3 | 0.0077 | 22.25 | 0.630 | 0.102 | |
| GO:0042296 | ISG15 transferase activity | 2 | 0.0105 | 185.42 | 0.742 | 0.125 |
| GO Category | GO Term | Description | Gene Number | p-Value | Fold Enrichment | Bonferroni | FDR |
|---|---|---|---|---|---|---|---|
| BP | GO:0051607 | Defense response to virus | 19 | 1.73 × 10⁻¹⁹ | 22.33 | 1.08 × 10⁻¹⁶ | 1.05 × 10⁻¹⁶ |
| GO:0009615 | Response to virus | 14 | 1.10 × 10⁻¹⁶ | 34.70 | 6.91 × 10⁻¹⁴ | 3.32 × 10⁻¹⁴ | |
| GO:0045087 | Innate immune response | 21 | 3.16 × 10⁻¹⁴ | 9.28 | 1.97 × 10⁻¹¹ | 6.36 × 10⁻¹² | |
| GO:0045071 | Negative regulation of viral genome replication | 10 | 6.14 × 10⁻¹⁴ | 59.27 | 3.82 × 10⁻¹¹ | 9.26 × 10⁻¹² | |
| GO:0060700 | Regulation of ribonuclease activity | 4 | 4.51 × 10⁻⁷ | 218.11 | 2.80 × 10⁻⁴ | 5.43 × 10⁻⁵ | |
| GO:0070106 | Interleukin-27-mediated signaling pathway | 4 | 1.57 × 10⁻⁶ | 155.79 | 9.75 × 10⁻⁴ | 1.58 × 10⁻⁴ | |
| GO:0032728 | Positive regulation of interferon-β production | 5 | 1.44 × 10⁻⁵ | 33.25 | 0.01 | 0.001 | |
| GO:0046596 | Regulation of viral entry into host cell | 4 | 6.64 × 10⁻⁵ | 49.57 | 0.04 | 0.005 | |
| GO:0046597 | Negative regulation of viral entry into host cell | 4 | 7.62 × 10⁻⁵ | 47.41 | 0.046 | 0.005 | |
| GO:0043123 | Positive regulation of I-κB kinase/NF-κB signaling | 7 | 8.08 × 10⁻⁵ | 9.64 | 0.049 | 0.005 | |
| CC | GO:0005829 | Cytosol | 48 | 1.98 × 10⁻¹¹ | 2.42 | 2.78 × 10⁻⁹ | 2.76 × 10⁻⁹ |
| GO:0005737 | Cytoplasm | 39 | 6.74 × 10⁻⁶ | 1.93 | 9.43 × 10⁻⁴ | 4.68 × 10⁻⁴ | |
| GO:0005654 | Nucleoplasm | 29 | 1.13 × 10⁻⁴ | 2.04 | 0.016 | 0.005 | |
| GO:0043231 | Intracellular membrane-bounded organelle | 12 | 5.72 × 10⁻⁴ | 3.45 | 0.077 | 0.02 | |
| GO:0032587 | Ruffle membrane | 4 | 0.0056 | 11.02 | 0.542 | 0.154 | |
| GO:0045335 | Phagocytic vesicle | 3 | 0.0256 | 11.92 | 0.974 | 0.594 | |
| GO:0030027 | Lamellipodium | 4 | 0.0308 | 5.80 | 0.987 | 0.613 | |
| GO:0048471 | Perinuclear region of cytoplasm | 7 | 0.0460 | 2.65 | 0.997 | 0.677 | |
| GO:0001726 | Ruffle | 3 | 0.0491 | 8.35 | 0.999 | 0.677 | |
| GO:0042470 | Melanosome | 3 | 0.0527 | 8.02 | 0.999 | 0.677 | |
| MF | GO:0001730 | 2′-5′-oligoadenylate synthetase activity | 4 | 2.11 × 10⁻⁷ | 259.08 | 3.86 × 10⁻⁵ | 3.78 × 10⁻⁵ |
| GO:0003725 | Double-stranded RNA binding | 6 | 9.12 × 10⁻⁶ | 21.01 | 0.002 | 8.16 × 10⁻⁴ | |
| GO:0061630 | Ubiquitin-protein ligase activity | 8 | 2.92 × 10⁻⁴ | 6.15 | 0.052 | 0.017 | |
| GO:0042802 | Identical protein binding | 17 | 5.37 × 10⁻⁴ | 2.59 | 0.093 | 0.024 | |
| GO:0042803 | Protein homodimerization activity | 10 | 0.0017 | 3.56 | 0.27 | 0.061 | |
| GO:0004842 | Ubiquitin-protein transferase activity | 6 | 0.0026 | 6.22 | 0.3835 | 0.079 | |
| GO:0003713 | Transcription coactivator activity | 6 | 0.0034 | 5.87 | 0.4627 | 0.087 | |
| GO:0003727 | Single-stranded RNA binding | 3 | 0.0144 | 16.19 | 0.9296 | 0.271 | |
| GO:0005515 | Protein binding | 58 | 0.0146 | 1.19 | 0.9325 | 0.271 | |
| GO:0042296 | ISG15 transferase activity | 2 | 0.0151 | 129.54 | 0.9387 | 0.271 |
| KEGG Term | Description | Gene Number | p Value | Fold Enrichment | Bonferroni | FDR |
|---|---|---|---|---|---|---|
| hsa05164 | Influenza A | 11 | 3.61 × 10⁻¹⁰ | 16.49 | 2.89 × 10⁻⁸ | 2.64 × 10⁻⁸ |
| hsa05160 | Hepatitis C | 10 | 3.85 × 10⁻⁹ | 16.33 | 3.08 × 10⁻⁷ | 1.40 × 10⁻⁷ |
| hsa05162 | Measles | 8 | 6.44 × 10⁻⁷ | 14.76 | 5.16 × 10⁻⁵ | 1.57 × 10⁻⁵ |
| hsa05171 | Coronavirus disease—COVID-19 | 9 | 1.63 × 10⁻⁶ | 9.95 | 1.30 × 10⁻⁴ | 2.97 × 10⁻⁵ |
| hsa04621 | NOD-like receptor signaling pathway | 7 | 5.41 × 10⁻⁵ | 9.75 | 0.004 | 7.90 × 10⁻⁴ |
| hsa05169 | Epstein–Barr virus infection | 7 | 9.10 × 10⁻⁵ | 8.88 | 0.007 | 0.001 |
| hsa04060 | Cytokine–cytokine receptor interaction | 6 | 0.0046 | 5.21 | 0.307 | 0.048 |
| hsa04061 | Viral protein interaction with cytokine and cytokine receptor | 4 | 0.0062 | 10.26 | 0.390 | 0.056 |
| hsa04620 | Toll-like receptor signaling pathway | 4 | 0.0069 | 9.86 | 0.424 | 0.056 |
| hsa04623 | Cytosolic DNA-sensing pathway | 3 | 0.0234 | 12.21 | 0.849 | 0.155 |
| KEGG Term | Description | Gene Number | p Value | Fold Enrichment | Bonferroni | FDR |
|---|---|---|---|---|---|---|
| hsa05160 | Hepatitis C | 11 | 5.50 × 10⁻⁹ | 13.06 | 6.88 × 10⁻⁷ | 6.72 × 10⁻⁷ |
| hsa05164 | Influenza A | 11 | 1.26 × 10⁻⁸ | 11.99 | 1.57 × 10⁻⁶ | 7.67 × 10⁻⁷ |
| hsa05162 | Measles | 8 | 6.67 × 10⁻⁶ | 10.73 | 8.33 × 10⁻⁴ | 2.71 × 10⁻⁴ |
| hsa05171 | Coronavirus disease—COVID-19 | 9 | 2.23 × 10⁻⁵ | 7.23 | 0.003 | 6.81 × 10⁻⁴ |
| hsa05169 | Epstein–Barr virus infection | 7 | 5.89 × 10⁻⁴ | 6.46 | 0.071 | 0.014 |
| hsa04621 | NOD-like receptor signaling pathway | 6 | 0.0026 | 6.08 | 0.277 | 0.053 |
| hsa04622 | RIG-I-like receptor signaling pathway | 4 | 0.0057 | 10.66 | 0.514 | 0.100 |
| hsa04068 | FoxO signaling pathway | 4 | 0.0309 | 5.69 | 0.980 | 0.471 |
| hsa03250 | Viral life cycle—HIV-1 | 3 | 0.0428 | 8.88 | 0.996 | 0.523 |
| hsa04623 | Cytosolic DNA-sensing pathway | 3 | 0.0428 | 8.88 | 0.996 | 0.523 |
Disclaimer/Publisher’s Note: The statements, opinions and data contained in all publications are solely those of the individual author(s) and contributor(s) and not of MDPI and/or the editor(s). MDPI and/or the editor(s) disclaim responsibility for any injury to people or property resulting from any ideas, methods, instructions or products referred to in the content. |
© 2024 by the authors. Licensee MDPI, Basel, Switzerland. This article is an open access article distributed under the terms and conditions of the Creative Commons Attribution (CC BY) license (https://creativecommons.org/licenses/by/4.0/).
Share and Cite
Megawati, D.; Armitige, L.Y.; Tazi, L. Differential Host Gene Expression in Response to Infection by Different Mycobacterium tuberculosis Strains—A Pilot Study. Microorganisms 2024, 12, 2146. https://doi.org/10.3390/microorganisms12112146
Megawati D, Armitige LY, Tazi L. Differential Host Gene Expression in Response to Infection by Different Mycobacterium tuberculosis Strains—A Pilot Study. Microorganisms. 2024; 12(11):2146. https://doi.org/10.3390/microorganisms12112146
Chicago/Turabian StyleMegawati, Dewi, Lisa Y. Armitige, and Loubna Tazi. 2024. "Differential Host Gene Expression in Response to Infection by Different Mycobacterium tuberculosis Strains—A Pilot Study" Microorganisms 12, no. 11: 2146. https://doi.org/10.3390/microorganisms12112146
APA StyleMegawati, D., Armitige, L. Y., & Tazi, L. (2024). Differential Host Gene Expression in Response to Infection by Different Mycobacterium tuberculosis Strains—A Pilot Study. Microorganisms, 12(11), 2146. https://doi.org/10.3390/microorganisms12112146