Abstract
Digital hydraulics is a discrete technology that integrates advanced dynamic system controls, digital electronics, and machine learning to enhance fluid power systems’ performance, overall efficiency, and controllability. A mechanically actuated inline three-piston variable displacement digital pump was previously proposed and designed. The inline three-piston pump incorporates complex mechanical and hydraulic subsystems and highly coupled mechanisms. The complexity of the utilized subsystems poses challenges when assessing the viability of the conceptual design. Therefore, this work focuses on designing, developing, and implementing a collaborative virtual platform involving a digitized module showcasing the internal mechanical structure of the digital pump utilizing mixed reality (MR) technology. MR technology is acknowledged as the forthcoming evolution of the human–machine interface in the real–virtual environment utilizing computers and wearables. This technology permits running simulations that examine the complexity of highly coupled systems, like the digital pump, where understanding the physical phenomenon is far too intricate. The developed MR platform permits multiple users to collaborate in a synchronized immersive MR environment to study and analyze the applicability of the pump’s design and the adequacy of the operated mechanisms. The collaborative MR platform was designed and developed on the Unity game engine, employing Microsoft Azure and Photon Unity Networking to set up the synchronized MR environment. The platform involves a fully interactive virtual module on the digital pump design, developed in multiple stages using Microsoft’s Mixed Reality Tool Kit (MRTK) for Unity and deployed in the synchronized MR environment through a HoloLens 2 MR headset. A research study involving 71 participants was carried out at Purdue University. The study’s objective was to explore the impact of the collaborative MR environment on understanding the complexity and operation of the digital pump. It also sought to assess the effectiveness of MR in facilitating collaboration among fluid power stakeholders in a synchronized digital reality setting to study, diagnose, and control their complex systems. Surveys were designed and completed by all 71 participants after experiencing the MR platform. The results indicate that approximately 75% of the participants expressed positive attitudes toward their overall MR platform experience, with particular appreciation for its immersive nature and the synchronized collaborative environment it provided. More than 70% of the participants agreed that the pump’s collaborative MR platform was essential for studying and understanding the complexity and intricacy of the digital pump’s mechanical structure. Overall, the results demonstrate that the MR platform effectively facilitates the visualization of the complex pump’s internal structure, inspection of the assembly of each of the involved subsystems, and testing the applicability of the complicated mechanisms.
1. Introduction
Fluid power has developed research areas and scholarly activities that serve widespread industries, e.g., agriculture, transportation, construction, aerospace, manufacturing, and many other industrial applications requiring high actuation power [1,2]. It uses pressurized fluid, typically hydraulic oil, to generate, monitor, control, and transmit high forces and power densities [3]. Besides achieving high power-to-weight ratios, hydraulics allows a fast dynamic response, flexibility in power transmission, ease of operation, and controllability [4]. The utilized hydraulic oil also serves as a self-lubricant and assists in heat transfer and contamination control due to its oxidation stability, wear resistance, low freezing point, high boiling point, and relatively large bulk modulus [5]. Given all these advantages, hydraulic systems are ideal for applications requiring high reliability, fast energy capture, and accuracy operations like construction vehicles, material handling equipment, military operations, and other high-actuation power applications [6].
Despite the significance of fluid power technology, many existing fluid power systems are ineffective in terms of efficiency [7]. Studies reveal that most fluid power systems achieve efficiencies between 9% and 60%, depending on the application, with an average efficiency of less than 22% [8]. This deficiency of fluid power systems has been investigated by many researchers with the goal of improving hydraulic system efficiency. Some researchers have been addressing this problem by studying and analyzing the hydrodynamic phenomena of hydraulic components in the hydraulic system using Computational Fluid Dynamic (CFD) simulations [9]. For instance, in [10], theoretical and experimental research on hydraulic processes in the hydraulic drives of transportation machines is presented. A study has been conducted to examine the effect of the hydrodynamic process on fluid flow characteristics. The analysis was based on 3D numerical simulations using Reynolds-Averaged Navier–Stokes equations.
Given all these implemented efforts, it was revealed that the deficiency in fluid power systems’ performance is highly associated with the employed hydraulic units/components and the system’s configuration [11,12]. The hydraulic components’ efficiency significantly impacts the fluid power systems’ overall efficiency. The variable displacement pump is a critical hydraulic unit in most fluid power systems [13]. It is the heart of such systems, and its efficiency notably affects the performance of fluid power systems due to leakage and other mechanical losses [14,15]. Existing positive displacement pumps can achieve high performances when operating at full displacements; however, they become inefficient under certain operating conditions, where their efficiencies drop as low as 20% at partial power operating conditions [16]. Therefore, this research gap could be addressed by incorporating digital hydraulic technology into fluid power systems due to its significant potential to improve the overall efficiency of fluid power systems.
Digital hydraulics is a subfield of fluid power that integrates advanced dynamic system controls, digital electronics, and machine learning to improve fluid power systems’ performance, overall efficiency, and reliability [12]. It is a discrete technology that replaces conventional valves with on/off valves at a system level to control the output flow by applying discrete modulated digital signals [17,18]. This technology is utilized for high-efficiency and novel hydraulic systems due to its multiple benefits over conventional hydraulic continuous technologies [1]. For instance, it allows for minimizing energy losses caused by fluid throttling in typical hydraulic systems, thus improving their overall performance [19]. One branch of digital hydraulics is high-speed switching, which describes various operating techniques [17]. High-speed switching, also known as a switching system, allows us to control the system’s output fluid by applying high-speed continuous switching and thus produces fluid flow with various discrete values [17]. Given the significance of digital hydraulic technology and its high potential for addressing fluid power challenges through new approaches [15], a state-of-the-art mechanically actuated digital pump/motor was proposed and designed utilizing high-speed switching on/off valves. The proposed digital pump is an inline three-piston pump consisting of three independent displacement chambers, each with one high-speed switching on/off valve, and could be utilized in many applications to generate controllable hydraulic power with high efficiency [20]. The complexity of the utilized technology resulted in complex mechanical and hydraulic designs, thus requiring an efficient design tool to assist throughout the design validation process. Thus, throughout this work, state-of-the-art Mixed Reality (MR) technology was employed to create a digital representation of the complex digital pump and the involved mechanisms to study and analyze the applicability of the design and adequacy of the operated mechanisms. A virtual MR platform involving interactive modules showcasing the pump’s mechanical actuation is developed. The platform establishes a framework for future studies that contributes to enhancing engineering design decisions by studying systems’ mechanical actuation through digital reality technologies.
The rest of this paper is organized as follows. Section 2 presents the significance of digitization in mechanical engineering and how it could be used as an efficient design tool to address engineering design gaps before the manufacturing and operation phases. Then, it introduces three digitized technologies that can be used for mechanical design validation. Section 3 exhibits the digital pump’s mechanical structure, presenting its complex sub-systems and their highly coupled mechanisms. Section 4 discusses the development of the MR platform involving the interactive pump module. It presents the methodology for setting up the synchronized MR setting and developing the digitized interactive pump module. Section 5 presents the research study generated for inspecting the MR platforms’ applicability in understanding the complexity of the pump’s design. This section exhibits the adopted experimental design and the employed evaluation methodology. Section 6 presents and discusses the significant study findings. Finally, Section 6 presents the conclusions about the work.
2. Digitization: An Effective Mechanical Design Tool
The significance of the mechanical design validation phase requires engineers to employ more flexible and intuitive design tools to allow for future analysis and process integration [21,22]. Among these tools, the utilization of 3D scanning/printing appears as a method to generate physical prototypes of engineering products [23]. In addition, 3D scanning/printing is the process of scanning physical objects and developing detailed, interactive digital models. This capability allows engineers to generate complex geometries/shapes to serve as prototypes for testing and validating the design [24]. Besides 3D scanning/printing, product lifecycle management (PLM) software is employed as a design management tool to study all aspects of a product’s lifecycle, from design and development to manufacturing and service. PLM significantly helps engineers control the product development process and improve collaboration and communication between different teams [25]. While these techniques have been proven to be effective, their full adoption adds some challenges, primarily related to the high cost of materials, technical maintenance requirements, and utilities [26,27]. Furthermore, such techniques are neither engaging nor immersive [27,28,29].
To this end, and with all the rapid technological advancements, digitization, also known as the creation of virtual representations of physical objects, can be an adequate design tool utilized throughout the design optimization and validation process to reinforce the quality of the final model, overcoming some of the challenges associated with the existing design tools. Digitization uses high-tech visualization media to introduce the digital representation of physical assets, processes, or systems, all of which facilitate testing and inspection processes [30,31]. Such virtual representation assists in examining the viability of new designs and alterations during the project preparation stage and identifying critical issues before the construction phase. Amidst many digitized technologies, extended reality (XR) technology is acknowledged as the forthcoming evolution of the human–machine interface in the real–virtual environment utilizing computers and wearables [32]. The XR technology refers to the human–machine interface in the real–virtual environment utilizing computers and wearables [33], where it involves virtual reality (VR), augmented reality (AR), mixed reality (MR), and all that comes within, as highlighted in Figure 1.
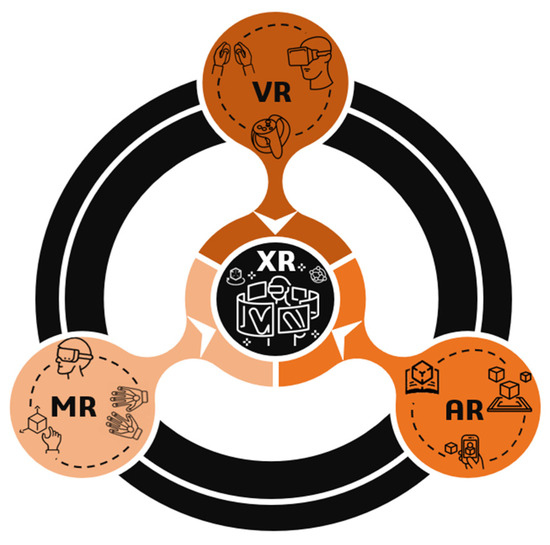
Figure 1.
Extended reality: an integration of VR, AR, and MR.
For instance, VR is the technology that permits the generation of fully computer-simulated environments in which everything is digitized. As shown in Figure 1, VR uses smart-wear techs like headsets, skin electronics, hand controllers, and many other wearable technologies to create a realistic, visceral experience to allow users to achieve a sense of presence and immersion that tricks the user’s senses into thinking they are being immersed [34]. While VR detaches the user from reality, AR introduces a new practice of visualization that allows interaction with the real surroundings by superimposing the rendered visuals on reality [35]. As shown in Figure 1, AR technology allows overlaying digital objects in the real world via smart devices, like phones, screens, or displays, which are widely available and affordable [36]. This technology is widely employed in manufacturing and mechanical design, where it serves as a technical assistant, permitting manufacturers and designers to scrutinize, examine, and diagnose the overall scheme of tools, equipment, and other fittings [37].
On top of VR and AR, MR is state-of-the-art XR technology, an extension of VR and AR. As illustrated in Figure 1, MR digitizes virtual objects interacting with the environment by seamlessly merging the physical world and digital content, producing an immersive environment where individuals can collectively interact with the virtual and real worlds [38]. MR allows for visual coherence by making rendered visuals a natural component of the surrounding real world [39]. It permits engineers, designers, and manufacturers to visualize and interact with virtual copies of complicated mechanical systems. Engineers can use this technology to interact with 3D digital objects in the real world, merging their substantial environment with the predesigned virtual world through a smooth human–computer interface [40,41]. Also, such technology permits running mechanical simulations in an MR setting to examine the complexity of highly coupled systems where understanding the physical phenomenon is far too intricate to solve analytically [42]. Therefore, with all its features, MR technology, the subset of XR, is a promising tool for optimizing and validating the mechanical design of the digital pump using virtual–real object interaction.
3. Mechanical Structure of the Digital Pump
The intended digital pump is a variable displacement inline three-piston pump consisting of three independent displacement chambers, each with one on/off mechanically actuated valve at the low-pressure side and a check valve at the high-pressure side. The low-pressure valve is a normally closed cartridge on/off valve modified for mechanical actuation. Figure 2 shows a schematic for one of the three displacement chambers with its corresponding low- and high-pressure valves. This configuration has many advantages. It eliminates the shear losses between the valve plate and the cylinder and reduces leakage paths between the plate/chamber block. Furthermore, such a configuration allows operating the pump in different operating strategies (partial flow-diverting, partial flow-limiting, sequential flow-diverting, and sequential flow-limiting) by varying the timing of the valves relative to the piston stroke through a cam–follower mechanism [20].

Figure 2.
Schematic illustrating the mechanically actuated valve proof-of-concept configuration.
The figure below shows that the low-pressure valve is connected to one cam set via a follower, and thus, it is mechanically actuated via a cam–follower mechanism. The cam–follower mechanism allows us to control the valve’s opening and closing, thus enabling pump operation in different strategies. Furthermore, the cam profile can be varied using a phasing mechanism (presented in the later sections), which allows us to change the valve’s state at the low-pressure port. Thus, achieving the desired displacement and favorable operation is dependent on the valves’ opening areas and response times [12]. For instance, manipulating the valve’s state (opening/closing) enables varying the volume of the displacement chambers to achieve variable pump displacement using a partial flow-diverting strategy. The partial flow-diverting strategy is an operating strategy that allows us to divert the flow from the displacement chamber back to the low-pressure port (suction line) during a portion of the pumping stroke instead of delivering it into the high-pressure port (discharge line). This strategy allows us to achieve displacements between 0% and 100% by controlling the amount of the fluid diverted back to the low-pressure port. A detailed explanation of the partial flow-diverting operating mode is presented in [43].
Therefore, the configuration presented in Figure 2 allows us to achieve higher efficiencies, especially at lower displacements, thus serving many hydraulic applications. With this configuration, the pump could be utilized in many hydraulic applications, especially those with fluctuating input power, such as wind power [44] and actively controlled vehicle suspension [45].
After briefly discussing the proof-of-concept mechanically actuated valve configuration, the rest of this section presents the internal mechanical structure of the pump (adopted mechanisms and basic sub-systems).
The digital pump utilizes two highly coupled mechanisms: the phasing mechanism responsible for varying the orientation of the cams with different cam profiles, thus achieving different pump displacements, and the cam–follower mechanism responsible for valve actuation. The internal mechanical structure of the pump incorporates four complex sub-systems: (1) the upper worm gear shaft and gear brackets, (2) cam-gear unit for phasing mechanism, (3) cam–follower unit for valve actuation, and (4) valve manifold unit, as shown in Figure 3. As shown in the figure, sub-system (1) comprises the inner and outer worm shafts, the worm gears, the corresponding driven gears, and pump brackets. Sub-system (2) encompasses two parallel shafts (the cam-gear shaft and the conventional gear shaft) that can be rotated relative to one another and the pump’s main shaft.
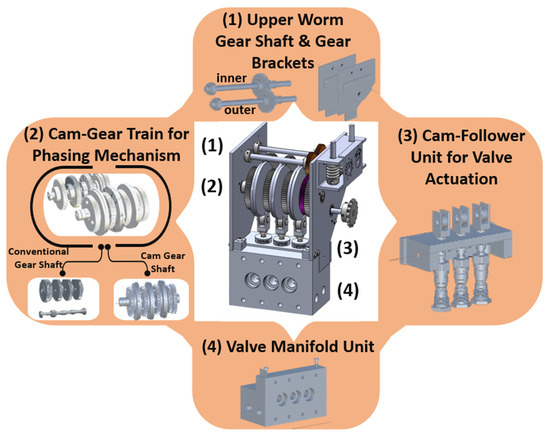
Figure 3.
Diagram illustrating the four mechanical structure units of the digital pump.
3.1. Phasing Mechanism
Figure 4 shows sub-systems (1) and (2) that allow for the phasing mechanism. The figure shows that the cam-gear shaft in sub-system (2) involves three main sets of cams assembled in the cam-gear shaft at different rotation angles. Each set comprises two half-masking cams ( and ) that are mechanically locked to the phasing gears on the cam-gear shaft and can be phased relative to one another to achieve different cam profiles. This cam configuration allows for achieving different cam profiles, thus attaining different pump displacements (0% to 100%). Achieving the required cam profile using the phasing mechanism requires synchronizing the cam-gear shaft rotation with the intended cam rotation in sub-system (2) using the inner and the outer upper worm gear shafts of sub-system (1). The two external gears on the inner and outer upper worm gear shafts of sub-system (1), shown in orange in Figure 4, are meshed with the two ring gears, shown in purple in Figure 4, that are attached to the carrier gears of sub-system (2). Therefore, controlling the rotation of each of the input shafts of the upper worm gear shafts allows us to control the rotation of the ring gears, enabling control of the rotation of the half-masking cams to achieve different cam orientations. For instance, rotating the inner upper worm gear shaft enables a rotational motion at the ring gear on the conventional gear shaft of sub-system (2). This rotational motion will be transmitted to the cam-gear shaft of sub-system (2) using the phasing gear mechanism. Then, as the cam-gear shaft rotates, the half-making cams will rotate to achieve a particular cam profile. On the other hand, rotating the outer upper worm gear shaft enables rotating the ring gear on the cam-gear shaft of sub-system (2), which allows for altering the orientation of the half-masking cams. Therefore, the upper worm gear shafts of sub-system (1) are responsible for controlling the orientation of the half-masking cams in the three cam sets of sub-system (2) using the phasing gear mechanism of sub-system (2) to achieve different cam profiles, thus attaining variable pump displacement.
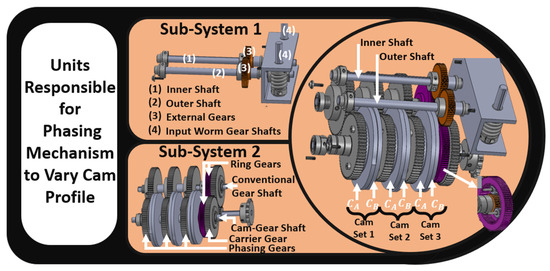
Figure 4.
Diagram showing the two sub-systems responsible for the phasing mechanism.
3.2. Cam–Follower Mechanism
Besides sub-systems (1) and (2), sub-system (3) (cam–follower unit for valve actuation) comprises three followers, the followers’ mount bracket, and the three mechanically actuated valves mounted inside sub-system (4) (the valve manifold), as shown in Figure 5. As shown in Figure 5, each valve is connected to one of the three cam sets of sub-system (2) through a roller follower. Thus, the valves’ opening and closing are controlled using the cam–follower mechanism, where the rotational motion at the cam is converted to a linear motion at the follower, enabling the actuation of the corresponding valve. Given that the three cam sets have different rotational angles, the variation in the cam profiles allows for the actuation of the valves one at a time. Therefore, changing cam profiles using the phasing mechanisms allows us to vary the valves’ opening and closing, enabling variable pump displacement.
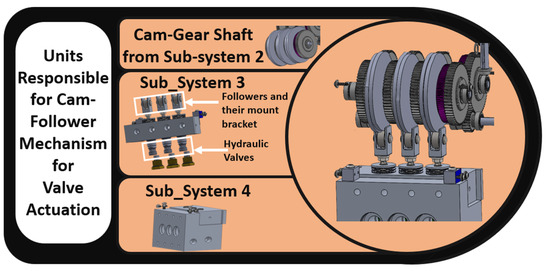
Figure 5.
Diagram showing the two sub-systems responsible for the cam–follower mechanism for valve actuation.
4. Research Study: The Impact of MR Environment on Understanding the Complexity of the Pump Design
Given the complexity of the utilized units and the corresponding mechanisms, understanding the pump’s operation and validating the mechanical design before the manufacturing stage is an intricate process. For such reasons, a collaborative MR platform involving a digitized interactive module on the mechanical structure of the pump was developed using Microsoft’s Mixed Reality Tool Kit (MRTK) for the Unity game engine [46,47] and deployed in an MR environment through HoloLens 2, an MR headset. The MR platform enables engineers to collaborate in a synchronized MR environment, where they can visualize the internal structure of the complex unit, inspect the assembly of each of the involved sub-systems, and test the applicability of the complicated mechanisms. The platform’s collaborative nature allows users to study and diagnose the design in a safe virtual environment mimicking real-industry settings. Besides visualization, manipulation, and interaction, the MR platform allows for additional features like displaying technical information on the pump, guiding operators throughout the assembly process, and other specialized options.
After developing the MR platform, a research study was conducted to inspect the impact of the collaborative MR environment in understanding the complexity and operation of the digital pump. Besides studying the MR environment’s applicability in understanding the pump’s complexity, this study aims to investigate the effectiveness of MR in allowing fluid power stack holders to collaborate in a synchronized digital reality setting to study, diagnose, and control their complex systems. For conducting the study, the interactive MR platform, including the digitized module of the pump’s mechanical structure, was developed and optimized in a synchronized MR environment. The platform was then tested with 71 participants (junior mechanical engineers) registered in the MET:230 Fluid Power course at Purdue University, where they experienced the MR platform as one of their course lab sessions.
The rest of this section presents the development procedure of the MR platform, the adopted experimental design for the conducted research study, and the utilized evaluation methodology for collecting and analyzing the data.
4.1. Development of MR Platform for Design Validation
A collaborative digitized MR platform for studying the pump’s mechanical structure and complex mechanisms was developed in a synchronized MR environment. Figure 6 illustrates the adopted methodology for the MR platform setup, highlighting the different software/hardware employed for setting up a synchronized MR environment and developing the pump’s MR module.
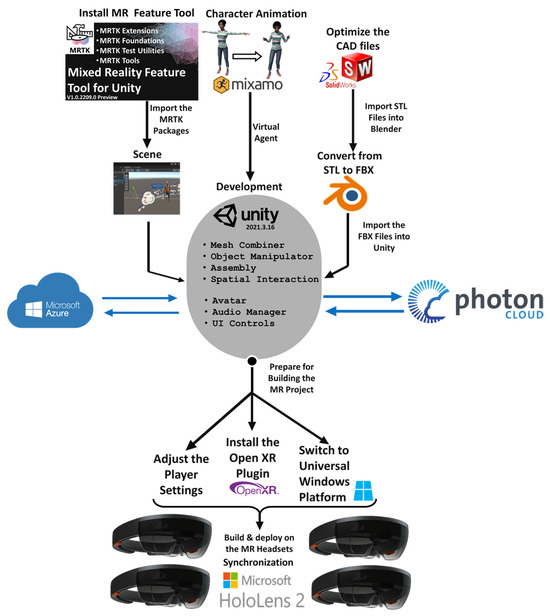
Figure 6.
Diagram illustrating the MR setup.
As shown in Figure 6, throughout the MR platform development, Unity game endive version 2021.3.16, a cross-platform game engine developed by Unity Technologies [48], is utilized for generating a spatial interactive MR scene involving the 3D digital representation of the pump’s mechanical structure. The MR scene was generated on Unity by setting up the MR playspace by downloading the MR Feature Tool Kit [49]. This tool kit allows XR developers to add and update MRTK packages in Unity projects. Thus, the MR Feature Took Kit enabled us to add the basic MRTK packages (MRTK Foundations, MRTK Extensions, MRTK Test Utilities, and MRTK Tools) to the Unity project. SolidWorks, a modeling CAD software, and Blender, an open-source 3D computer graphics software [50], were also utilized for developing and optimizing the pump’s 3D model before importing it as FBX Unity assets into the MR playspace in Unity. Furthermore, a 3D character animation platform (Mixamo) was employed to import 3D animated characters into the MR scene to serve as virtual agents (avatars) for giving instructions and guiding the users, thus enhancing their overall experience.
The MR platform must be designed to allow multiple users (up to four) to collaborate in a synchronized MR environment to study and analyze the pump’s design. For this reason, Microsoft Azure, a cloud computing platform [51], and Photon Cloud, a software as a service (SaaS) solution for developing multiplayer games [52], were employed and integrated with Unity to allow for synchronizing up to four Microsoft HoloLens 2 (MR Headsets). So, a Photon Unity account was created, where the required codes were purchased to automatically connect to the Photon Network, which allowed access to the various components and user settings of Photon Unity. Then, a server setting was set up to allow users to have access to control events in a collaborative MR environment. This allows users to have the option of connecting to regional servers using the MR headsets. The MR headset (HoloLens 2), a head-mounted see-through display, is a holographic device that provides an MR experience. It comprises translucent glasses allowing the user to navigate physical reality with immersive holograms to generate virtual experiences [53].
After the synchronized MR platform was set up, an interactive module on the digital pump’s mechanical structure was designed within the synchronized MR setting in three phases (phase 1: component creation, phase 2: assembly of sub-systems, and phase 3: assembly of the entire pump), as illustrated in Figure 7. The following sub-sections provide a detailed explanation of each of the three phases.
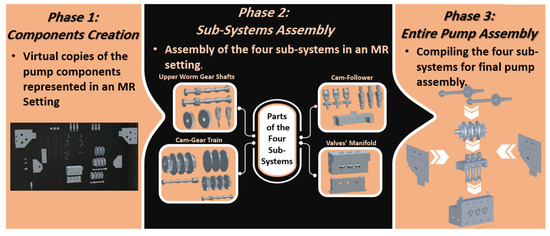
Figure 7.
Diagram illustrating the three phases of developing the pump’s MR model.
4.1.1. Phase 1: Component Creation
In this phase, the pump’s mechanical components, developed using SolidWorks Software, were exported as FBX files supported by Unity through Blender software to create virtual copies in an MR setting. FBX data files involving the 3D CAD files were imported as new assets into Unity to develop the required MRTK project. The imported assets (pump’s 3D components of the four units) were positioned and organized in the required scene as unity game objects (Figure 8). Then, unity scripts were built and compiled using (UnityEngine), (UnityEngine.Events), (System.Collections), (System.Collections.Generic), (HoloToolKit.Unity.Buttons) to allow for various types of interactions, spatial awareness, eye/hand tracking, and user–interface controls that support HoloLens 2 articulated hand input. This adopted procedure enabled the creation of a user–interface MR environment to visualize and interact with the pump components. The project was then deployed and installed on HoloLens 2 to test the visualization of the pump components in an MR environment, as shown in Figure 9. The figure shows how the pump’s components were displayed as virtual digital copies in our research lab for user–interface interaction in an MR setting.
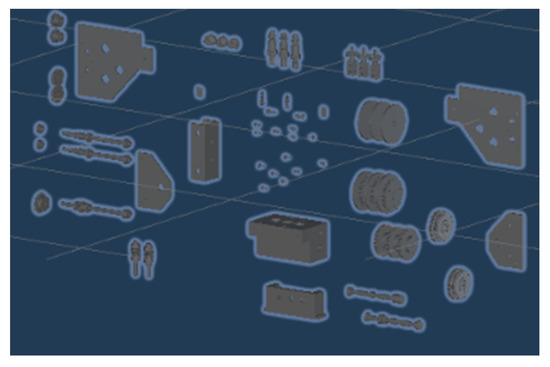
Figure 8.
Pump components in a graphic user interface (GUI) for unity.
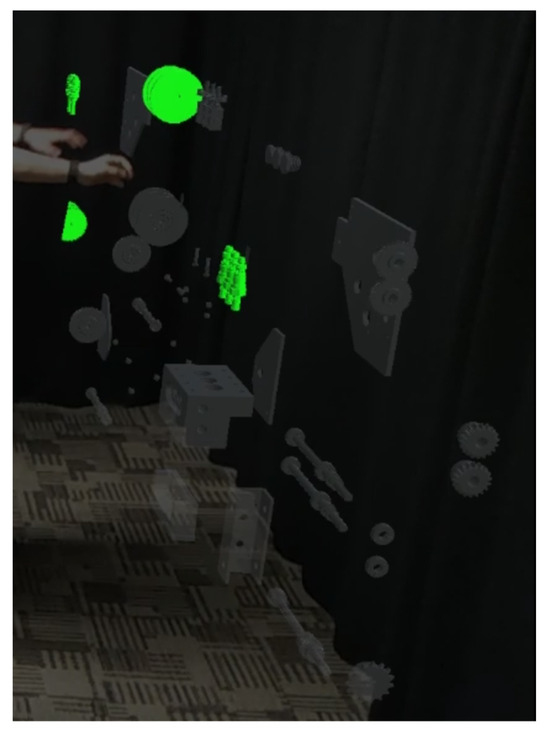
Figure 9.
Interacting with the digital copies of the pump’s components in an MR setting.
4.1.2. Phase 2: Sub-System Assembly
Throughout this phase, the virtual assembly process of the digital MR representations of the four sub-systems created in phase 1 was executed. It comprised three stages: gear meshing for the Unity game engine, the shafts’ concentricity, and components’ compilation. The three stages of assembly were conducted using 3ds Max software, where the FBX CAD data files created in phase 1 were converted into STL files supported by 3ds max. Like phase 1, the assembly file was converted back into FBX and imported as a new asset into Unity. Also, a user–interface MR environment for the entire assembly was created. The required scripts (object manipulator, near grabbable interaction class, and constraint manager) were added to allow users to grab, manipulate, scale, and assemble the sub-systems with tracked hands. The virtual agent was added in this phase to give instructions and guide the user throughout this assembly process. The updated project was installed on HoloLens 2 to visualize and test the assembly of the four sub-systems in an MR environment, as shown in Figure 10.
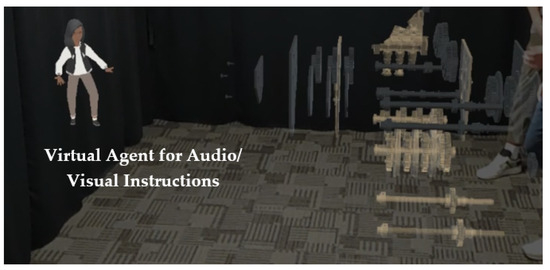
Figure 10.
The assembly process of the four sub-systems in an MR setting.
Figure 10 shows the four sub-systems of the digital pump virtually displayed in our research lab and a virtual agent standing at the corner of the room to direct the team and assist them while assembling the sub-systems. Therefore, this phase tests the visualization of the internal structure of the digital pump and the assembly of the sub-systems and prepares for the entire pump’s assembly (phase 3).
4.1.3. Phase 3: Entire Pump Assembly
In this phase, the entire pump’s assembly was executed by compiling the four subsystems assembled in phase 2, as shown in Figure 11. A methodology similar to the one in phase 2 was adopted to allow the execution of the entire assembly. For instance, object manipulator and grabbable interaction class scripts were built and compiled to allow users to grab and manipulate the four previously assembled sub-systems to perform the final pump assembly. The MRTK application built in phases 1 and 2 was then modified, where new user–interface buttons and voice notes were added to allow users to interact with the model. Also, additional features were added, like displaying the components’ technical information and guiding users throughout the assembly process with audio and visual instructions. Finally, the MR project (developed MR platform) was built and deployed using OpenXR through Universal Windows Platform on the four MR headsets.
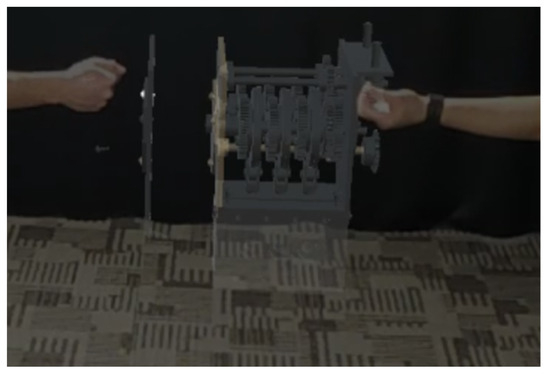
Figure 11.
Assembly process of the whole digital pump.
4.2. Experimental Design
The research study was conducted with 71 junior fluid power engineers registered in the MET:23000 Fluid Power course at Purdue University and was administered as follows. The MET: 230 course involved around 71 participants, all junior mechanical engineers, divided into five sections, each comprising 14 to 15 individuals. Due to the limited number of MR headsets, participants per section were divided into two groups: Group 1 and Group 2, each with 6 to 9 individuals. Also, given the collaborative nature of the MR platform, every three participants per group experienced the MR platform simultaneously (see Figure 12), where they were immersed in a synchronized MR environment to collaborate and interact while assembling and studying the pump design. Thus, the study was conducted in multiple experiments over the five sections in two consecutive weeks (in week 1, two to three experiments per section for Group 1 were conducted and in week 2, two to three experiments per section for Group 2 were conducted). This approach ensured that all participants could experience the MR platform, facilitating study management and data collection.

Figure 12.
Three participants engaged in conducting the MR experiment.
Each experiment, i.e., experiencing the MR platform, took 40 mins on average. Eight Microsoft HoloLens 2 headsets (MR headsets) were employed throughout the entire research study, where four headsets were used simultaneously throughout one experiment, while the remaining four were kept charged to be ready for the following experiment. Three of the four synchronized headsets were worn by the three participants, and the fourth one served as a video recorder for data collection to record and track the participants’ activities throughout the experiment (see Figure 12).
Surveys were designed and completed by the 71 participants who fully experienced the MR platform. The developed surveys aimed to evaluate the effectiveness of the MR platform in providing users with an immersive environment in which they can understand the complexity of the pump’s design and interact with the sought-after mechanisms. Qualtrics, b online survey platform [54], was utilized to import and manage survey reports and acquire sought-after data.
After experiencing the MR platform, the three participants in the experiment engaged in focus group discussions (see Figure 13), where they shared their experiences, discussed encountered problems (if any), and reflected on how the MR platform aided their understanding of the complexity of the pump design. Subsequently, the three participants were guided by one of the research teams to complete the survey questions on Qualtrics. While the three participants completed the surveys, the other three individuals in the group were asked to experience the MR platform. Similarly, the three participants experienced the platform, participated in focus groups to discuss their experiences, and completed the sought-after surveys. The procedure was applied consistently across all the other sections. Unique identifiers were assigned after survey completion, ensuring that subject names were no longer included in the data, thereby maintaining the confidentiality of the time-series data.
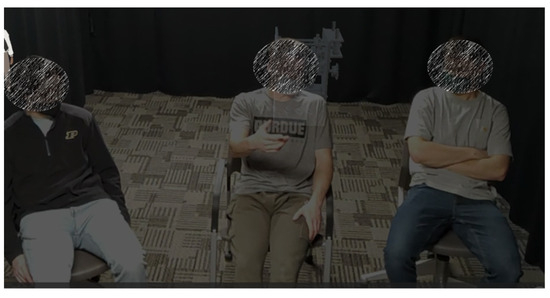
Figure 13.
The three participants engaged in focus group discussions right after conducting the experiment.
4.3. Assessment Methodology
Surveys were designed and completed by all 71 participants after experiencing the MR platform to study and inspect the platform’s effect on understanding the complexity of the pump’s design. The surveys consist of two survey sets (Set 1 and Set 2) comprising Likert-Scale-type questions, a unidimensional scaling methodology that allows for measuring participants’ attitudes [55]. Survey Set 1 (S1) involved eight questions (see Table 1) that aimed to assess the technical aspect of the MR platform, i.e., immersive nature, sense of presence, and controllability. Survey Set 2 (S2) comprised six questions (see Table 2) that measured the impact of the MR platform on understanding the complexity of the pump’s design and mechanical actuation in fluid power systems. The surveys were carried out and analyzed through Qualtrics, which allowed us to acquire and manage the Likert-type scale data. The acquired data were based on the 1 to 5 bipolar scale rating and thus can be analyzed using qualitative statistical analysis, like descriptive analysis, e.g., conducting mean and standard deviation analysis and generating bar graphs and charts. Such qualitative analysis techniques are authoritative and comparatively simple for analyzing the participants’ attitudes toward persuasion research.

Table 1.
Set 1 (S1) survey questions for assessing the immersive nature and controllability of the MR platform.

Table 2.
Set 2 (S2) survey questions for assessing the effect of the MR platform on understanding the complexity of the pump’s design.
As shown in Table 1, the questions in S1 are represented by a series of declarative statements to measure the participants’ internal perspective level toward the immersive nature and features of the MR platform. For instance, Q1 to Q4 enables us to inspect the technical aspects of the MR platform. It allows for examining the immersive nature and visceral experience provided by the MR platform, i.e., good immersion, presence/depth, user interface, etc. The rest of the Likert-scale questions, i.e., Q5 to Q8, of S1 allow for exploring the effect of the platform’s immersive nature on the participants’ level of concentration and engagement throughout the experiment. They also aim to rate the significance of the collaborative MR platform on the participants among each other and their interactions with the virtual assets. The following bipolar scale was adopted for this set of Likert-scale questions (S1): (1 not at all, 2 not so well, 3 somewhat well, 4 very well, and 5 extremely well).
Similarly, the questions in S2, shown in Table 2, are also exemplified in a series of statements for gauging feedback and information regarding the participants’ perspectives toward the MR platform. However, unlike S1 questions, S2 questions aimed to collect data regarding the platform’s applicability in understanding, studying, and diagnosing the complexity of mechanical designs, like the mechanical structure of the digital fluid power pump. For instance, the adopted questions measure the impact of representing the pump components/subsystems as virtual assets in an MR setting on understanding the associated complex mechanism. They assess whether the MR simulation helps to visualize the pump’s subsystems, thus improving the individuals’ understanding of the complex mechanisms. The following bipolar scale was adopted for this set of Likert-scale questions (S2): (1 strongly disagree, 2 disagree, 3 neither disagree nor agree, 4 agree, 5 strongly agree).
5. Data Analysis: Results Discussion
The Likert-scale data acquired from questions in S1 and S2 were analyzed using descriptive analysis via the Qualtrics platform by computing significant statistical measures like the mean and standard deviation and reporting the data through statistical diagrams and charts. The following subsections present and discuss the study findings based on the participants’ responses to the Likert-scale questions in S1 and S2. The results of S1 questions are reported in Table 3 and Figure 14, while those of S2 are reported in Table 4 and Figure 15.

Table 3.
Means and standard deviation for the Likert-scale questions in S1.
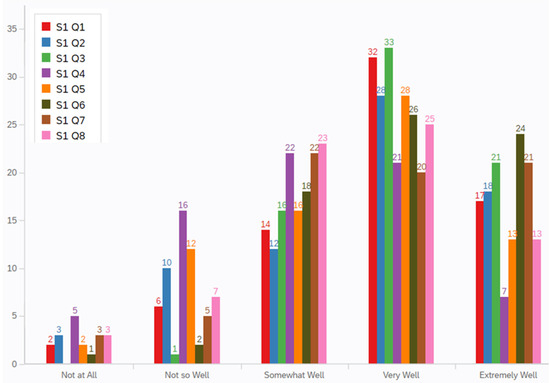
Figure 14.
Statistical diagram illustrating the Likert-scale data collected from the participants’ responses to the six questions in set S1.

Table 4.
Means and standard deviation for the Likert-scale questions in S2.
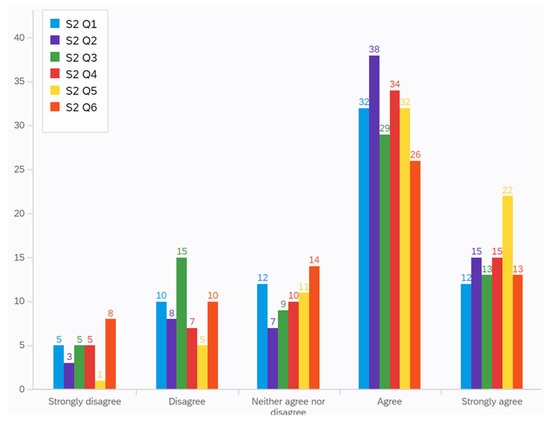
Figure 15.
Statistical diagram illustrating the Likert-scale data collected from the participants’ responses to the six questions in set S2.
5.1. Data Discussion of Particpants’ Response to Questions of S1
Table 3 and Figure 14 provide an overview of the participants’ responses to S1 questions. Specifically, Table 3 presents the mean and standard deviation for each question within S1, while Figure 14 supports the provided information with a visually informative bar chart.
The results in Table 3 show that S1 Q3 comes in first place, displaying the highest mean (M = 4.04) and lowest standard deviation (SD = 0.76), which reveals that the majority of participants’ responses ranged from “Very Well” to “Extremely Well”. Figure 14 visually reinforces this finding with light green bars, demonstrating that the participants had a highly favorable experience with the MR environment and could quickly adapt to it. Specifically, 54 out of the 71 participants (76%) reported responses falling within the “Very Well” and “Extremely Well” categories. Among this group, 33 out of the 54 (61%) reported “Very Well”, while the remaining 21 out of the 54 (39%) reported “Extremely Well”.
S1 Q6 comes in second place with a mean M = 3.99 and a standard deviation SD = 0.91. These statistical results indicate that most of the participants’ responses were “Very Well”, revealing that the participants had a positive attitude toward examining the digital pump’s mechanical structure from multiple viewpoints in an MR setting. This trend is evident in Figure 14, represented by dark green bars. Approximately 70% of the participants (50 out of 71) reported an experience ranging from “Very Well” to “Extremely Well” while studying and inspecting the pump’s mechanical structure in the MR environment. Within this 70% distribution, 26 out of the 50 (51%) reported “Very Well”, while the remaining 24 out of the 50 (48%) reported “Extremely Well”.
Besides S1 Q3 and S1 Q6, S1 Q1 comes in third place with a mean M = 3.79 and a standard deviation SD = 0.99, directly followed by S1 Q7 in the fourth place, with a mean M = 3.72 and a standard deviation SD = 1.09. The results of both questions are promising, as also illustrated in Figure 14. For instance, the result of S1 Q1 (represented by the red bars) shows that 45 out of 71 (69%) reported responses divided between “Very Well” and “Extremely Well”. Among the 69%, the majority (71%) reported “Very Well”, while the remaining (38%) reported “Extremely Well”. These findings indicate that a significant portion of the participants were fully immersed in the MR environment, which emphasizes the strength and potential of MR technology in providing a visceral, immersive experience. Furthermore, the results of S1 Q7 (represented by brown bars) also appear promising, although not to the same extent as S1 Q1. Figure 14 shows that the participants’ responses to S1 Q7 were divided as follows: 3 out of 71 (4%) reported “Not at All”, 5 out of 71 (7%) reported “Not so Well”, 22 out of 71 (31%) reported “Somewhat Well”, 20 out of 71 (28%) reported “Very Well”, and the remaining, i.e., 21 out of 71 (30%), reported “Extremely Well”. Thus, most participants responded, “Somewhat Well” and “Extremely Well,” indicating that the MR platform is pretty well designed and implemented to allow for moving and interacting with the virtual representation of the digital pump.
The results of questions S1 Q2 and S1 Q4 come in fifth and sixth place, respectively, where S1 Q2 had a mean and standard deviation of M = 3.68 and SD = 1.12, while those of S1 Q4 were M = 3.65 and SD = 1.02. S1 Q2 and S1 Q4 aimed to study the effect of the visual aspects and sensations throughout the MR platform on the participants’ performance. Thus, the results of S1 Q2 and S1 Q4 indicate that the participants had almost neutral to good attitudes toward both the visual aspects and sensations of the MR environment. Figure 14 supports this result, where the results of S1 Q2 (represented by the blue bars) show that 28 out of 71 (39%) responded “Very Well”, 18 out of 71 (25%) “Extremely Well”, 12 out of 71 (17%) “Somewhat Well”, and the remaining were divided between “Not so Well” and “Not at All.” On the other hand, the results of S1 Q4 (represented by the purple bars) show that 22 out of 71 (31%) responded “Somewhat Well”, 21 out of 71 (29%) “Very Well”, and the remaining were divided between “Extremely Well”, “Not so Well”, and “Not at All.” Thus, most of the participants responded “Very Well” to S1 Q2 and “Somewhat Well” to S1 Q4, reflecting good attitudes toward the MR environment’s visual aspects while neutral attitudes toward their perception and sense of movement within the MR environment. For further studying these results, additional analysis could be conducted to study the correlation between the results, thus understanding the relation between the user’s sense of immersion and the visual aspects.
Finally, participants’ responses to questions S1 Q5 and S1 Q8 resulted in similar outcomes; both questions had the same mean M = 3.54 and slightly varying standard deviations (SD = 1.06 for S1 Q5 and SD = 1.03 for S1 Q8). These results can be visually illustrated in Figure 14, where 58% (41 out of 71) of the responses to question S1 Q5 (represented by orange bars) and 54% (38 out of 71) of the responses to question S1 Q8 (represented by pink bars) were divided between “Very Well” and “Extremely Well.” In addition, 23% (16 out of 71) of the responses to S1 Q5 and 32% (23 out of 71) of the responses to S1 Q8 were rated as “Somewhat Well”, and the remaining were divided between “Not so Well” and “Not at All.” S1 Q5 and S1 Q8 aimed to study the effectiveness and applicability of the MR platform on the users’ levels of concentration and engagement while assembling and studying the pump design. Therefore, the findings of S1 Q5 and S1 Q8 reveal that the participants had very good attitudes toward examining the pump’s subsystems and mechanisms and were engaged while assembling and studying the pump design.
Therefore, the participants’ responses to S1 questions showed promising results but also revealed areas for improvement. The overall results were affected by the color/theme scheme of the MR platform, which lacked vibrant visual color aids, as well as the utilized control events. The interactive model of the pump was developed with no visual aids, i.e., the pump’s components and sub-systems were implemented in one color (gray). Furthermore, some of the utilized control events were not always smooth, causing technical issues while completing the required task, all of which exposed participants to frustration and dissatisfaction at some point in the experiment. However, such results could be enhanced by optimizing and refining the interactive MR platform and re-conducting the study.
5.2. Data Discussion of Participants’ Response to Questions of S2
Table 4 and Figure 15 report the data from the participants’ responses to the S2 questions. Similar to Table 3 and Figure 14, Table 4 shows the statistical metrics (mean and standard deviation) for each question within S2, while Figure 15 complements this data with a visually informative bar chart. The data reported in Table 4 show that S2 Q5 has the highest mean (M = 3.97) and lowest standard deviation (SD = 0.93), indicating that most participants agree that the virtual assembly and study of the digital pump through the MR platform was convenient, practicable, and feasible. This result is further emphasized in Figure 15 (yellow bars), which reveals that a significant majority of the participants, 54 out of 71 (76%), exhibited a positive attitude towards the virtual assembly of the pump within an MR environment. This 76% is divided as follows: 45% (32 out of the 71 individuals) agree that the virtual pump assembly was smooth and achievable; the rest, 31% (22 out of the 71), strongly agree with this statement.
Furthermore, Table 4 shows that the participants’ responses to questions S2 Q1, S2 Q2, and S2 Q4 are also promising, where the generated means are greater than 3.5, closer to 4 (M = 3.51 for S2 Q1, M = 76 for S2 Q2, and M = 3.66 for S2 Q4). This indicates that most participants agree that the MR platform helped them understand the pump’s complex mechanical design and the mechanically actuated valve operation by studying and visualizing the phasing and cam–follower mechanisms. The results of S2 Q1, S2 Q2, and S2 Q4 are further investigated and supported in Figure 15. As shown in the Figure, most of the participants’ responses to S2 Q1, S2 Q2, and S2 Q4 (illustrated in the blue, purple, and red bars) were positive, divided between “Agree” and “Strongly Agree”. In total, 44 participants out of 71 (61%) claimed that the MR platform allowed for the visualization of the pump’s phasing mechanism, thus understating the operation of the cam phasing; similarly, 53 out of 71 (75%) stated that the utilization of MR technology helped them understand the cam–follower mechanism; 49 out of the 71 (69%) claimed that the overall experience was beneficial, where it enhanced their understanding of the complex pump mechanisms.
On the other hand, the participants’ responses to the rest of the questions, S2 Q3 and S2 Q6, were positive, with M = 3.42 > 3 for S2 Q3 and M = 3.37 > 3 for S2 Q6. The results indicate that the participants appreciated the utilization of MR technology for presenting and illustrating the complex design and mechanisms of the digitally actuated mechanical pump. However, they claimed that the interactive MR modules of the digital pump did not help anticipate the difference between the mechanical and electrical operation of digital pumps. This result makes sense, given that the pump’s MR module was only pivoted on mechanically actuated digital pumps and did not incorporate any electrical actuation. This is also shown in Figure 15 from the participants’ responses to S2 Q3 and S2 Q6, illustrated in the green and orange bars, where 29 out of the 71 participants (41%) agree with the statement of S2 Q3 and 26 out of the 71 participants (36%) agree with the statement of S2 Q6. However, despite the promising results, further analysis will be conducted to investigate the problem further.
Therefore, the study findings reveal that the majority of the participants (>75%) had positive attitudes toward their overall experience of the MR platform, especially the immersive nature and synchronized collaborative environment of the platform. More than half of the participants agreed that the collaborative MR platform involving the interactive digital pump modules was essential for studying and understanding the complexity and intricacy of the digital pump’s mechanical structure. They also agree that the MR platform permitted visualization of the digital pump’s internal structure and conducting the required assembly–disassembly processes. Therefore, the study findings show that such an MR platform could assist in validating and proving the adequacy of the mechanical design by visualizing the internal structure, interacting with the highly coupled sub-systems, and performing the assembly processes. Thus, MR technology is an effective tool that could be implemented before the manufacturing and production phase due to its multi-model and multi-touch interaction capabilities. Such findings will contribute to future efforts to enhance engineering design decisions through digital reality technologies.
6. Conclusions
Digital pumps can potentially improve fluid power systems’ performance and efficiency. Thus, a digital pump utilizing mechanically actuated on/off valves was designed and presented. The designed pump is a variable displacement inline three-piston pump incorporating complex, with highly coupled mechanical and hydraulic sub-systems. The complexity of the utilized technology made understanding the pump’s mechanical design and the associated mechanisms intricate, which required an efficient design tool to assist throughout the design validation process and examine the associated mechanical actuation. Therefore, MR technology was used to design, develop, and deploy a collaborative MR platform involving an interactive module on the internal structure of the digital pump and its mechanical actuation in a synchronized MR setting to study and understand the complexity of the design. After the development of the MR platform, a research study was undertaken with 71 participants at Purdue University who fully experienced the MR platform and completed two sets of surveys. The study aimed to explore the impact of the collaborative MR environment on comprehending the intricacies associated with the pump’s design and mechanical actuation.
The results revealed that more than 70% of the participants showed positive attitudes toward the overall experience. They claimed that the synchronized immersive nature of the MR platform had a positive effect on understanding and studying the pump’s design.
Furthermore, the participants stated that the collaborative MR platform, incorporating an interactive digital pump module, was indispensable for gaining insights into the complexity and intricacy of the mechanical structure of digital pumps. The research findings also demonstrate that the MR platform allowed for a human–machine interface, enabling multiple users to collaborate in a synchronized MR environment to interact with the physical model of the pump using multi-model and multi-touch interaction. The platform enabled individuals to visualize the internal structure of the digital pump and conduct the required assembly–disassembly processes, all of which permitted testing the applicability of complex mechanisms.
Author Contributions
Conceptualization, F.B., C.M. and I.A.; Investigation, C.M. and F.B.; Methodology, C.M. and M.C.; Supervision, F.B. and C.M.; Validation, I.A.; Visualization, I.A., F.B., C.M., M.C. and Y.J.; Writing—original draft, I.A.; Writing—review and editing, I.A., K.P., F.B. and C.M. All authors have read and agreed to the published version of the manuscript.
Funding
This research received no external funding.
Data Availability Statement
The data that support the findings of this study are available upon request from the corresponding author, F.B.
Acknowledgments
Publication of this article was funded in part by Purdue University Libraries Open Access Publishing Fund.
Conflicts of Interest
The authors declare no conflict of interest.
References
- Azzam, I.; Pate, K.; Garcia-Bravo, J.; Breidi, F. Energy Savings in Hydraulic Hybrid Transmissions through Digital Hydraulics Technology. Energies 2022, 15, 1348. [Google Scholar] [CrossRef]
- McCloy, D.; Martin, H.R. Control of Fluid Power: Analysis and Design, 2nd (revised) ed.; Ellis Horwood: Chichester, UK, 1980; Available online: https://ui.adsabs.harvard.edu/abs/1980ehlh.book.....M/abstract (accessed on 23 November 2021).
- Akers, A.; Gassman, M.; Smith, R. Hydraulic Power System Analysis; CRC Press: Boca Raton, FL, USA, 2006; pp. 1–366. [Google Scholar] [CrossRef]
- Backe, W. Eightieth Thomas Hawksley Memorial Lecture The present and future of fluid power. Proc. Inst. Mech. Eng. Part I J. Syst. Control. Eng. 1993, 207, 193–212. [Google Scholar]
- Durfee, W.; Sun, Z. Fluid Power System. Natl. Sci. Found. Eng. Res. Cent. 2009, 1–48. [Google Scholar]
- Fabis-Domagala, J.; Domagala, M.; Momeni, H. A Concept of Risk Prioritization in FMEA Analysis for Fluid Power Systems. Energies 2021, 14, 6482. [Google Scholar] [CrossRef]
- Vacca, A. Energy Efficiency and Controllability of Fluid Power Systems. Energies 2018, 11, 1169. [Google Scholar] [CrossRef]
- Love, L.; Lanke, E.; Alles, P. Estimating the Impact (Energy, Emissions and Economics) of the US Fluid Power Industry, no. December. 2012. Available online: http://www.osti.gov/servlets/purl/1061537/ (accessed on 2 October 2023).
- Karpenko, M.; Bogdevičius, M. Investigation of Hydrodynamic Processes in the System—“Pipeline-Fittings”. In International Conference TRANSBALTICA: Transportation Science and Technology; Springer: Berlin/Heidelberg, Germany, 2020; pp. 331–340. [Google Scholar] [CrossRef]
- Karpenko, M.; Stosiak, M.; Šukevičius, Š.; Skačkauskas, P.; Urbanowicz, K.; Deptuła, A. Hydrodynamic Processes in Angular Fitting Connections of a Transport Machine’s Hydraulic Drive. Machines 2023, 11, 355. [Google Scholar] [CrossRef]
- Breidi, F.; Garrity, J.; Lumkes, J. Design and Testing of Novel Hydraulic Pump/Motors to Improve the Efficiency of Agricultural Equipment. Trans. ASABE 2017, 60, 1809–1817. [Google Scholar] [CrossRef]
- Chehade, A.; Breidi, F.; Pate, K.S.; Lumkes, J. Data-driven Adaptive Thresholding Model for Real-time Valve Delay Estimation in Digital Pump/Motors. Int. J. Fluid Power 2020, 20, 271–294. [Google Scholar] [CrossRef]
- Breidi, F.; Helmus, T.; Lumkes, J. The impact of peak-and-hold and reverse current solenoid driving strategies on the dynamic performance of commercial cartridge valves in a digital pump/motor. Int. J. Fluid Power 2015, 17, 37–47. [Google Scholar] [CrossRef]
- Wilhelm, S.R.; Van de Ven, J.D. Synthesis of a Variable Displacement Linkage for a Hydraulic Transformer. In Proceedings of the ASME Design Engineering Technical Conference, Washington, DC, USA, 28–31 August 2011; Volume 6, no. PARTS A AND B. pp. 309–316. [Google Scholar] [CrossRef]
- Yang, H.-Y.; Pan, M. Engineering research in fluid power: A review. J. Zhejiang Univ. Sci. A 2015, 16, 427–442. [Google Scholar] [CrossRef]
- El Breidi, F. Investigation of Digital Pump/Motor Control Strategies. Diss, Purdue University: West Lafayette, IN, USA, 2016. [Google Scholar]
- Zhang, Q.; Kong, X.; Yu, B.; Ba, K.; Jin, Z.; Kang, Y. Review and Development Trend of Digital Hydraulic Technology. Appl. Sci. 2020, 10, 579. [Google Scholar] [CrossRef]
- Valmet. Digital Hydraulic Concept Reduces Cost and Increases Reliability. 2021. Available online: https://www.valmet.com/media/articles/up-and-running/new-technology/FPDigHydr/ (accessed on 3 December 2021).
- Merrill, K.; Holland, M.; Batdorff, M.; Lumkes, J. Comparative Study of Digital Hydraulics and Digital Electronics. Int. J. Fluid Power 2010, 11, 45–51. [Google Scholar] [CrossRef]
- Helmus, T. Investigation and Implementation of Mechanically Actuated Valves for Digital Hydraulic Units. Doctoral Dissertation, Purdue University, West Lafayette, IN, USA, August 2017. [Google Scholar]
- Ibrahim, R.; Pour Rahimian, F. Comparison of CAD and manual sketching tools for teaching architectural design. Autom. Constr. 2010, 19, 978–987. [Google Scholar] [CrossRef]
- Craveiro, F.; Bartolo, H.; Gale, A.; Duarte, J.; Bartolo, P. A design tool for resource-efficient fabrication of 3d-graded structural building components using additive manufacturing. Autom. Constr. 2017, 82, 75–83. [Google Scholar] [CrossRef]
- Yao, A. Applications of 3D scanning and reverse engineering techniques for quality control of quick response products. Int. J. Adv. Manuf. Technol. 2005, 26, 1284–1288. [Google Scholar] [CrossRef]
- What is the 3D Printing and Scanning Design Process?—Matter and Form 3D Scanner for Education. Available online: https://matterandformedu.net/2020/03/11/what-is-the-3d-printing-and-scanning-design-process/ (accessed on 19 February 2023).
- del Amo, I.F.; Galeotti, E.; Palmarini, R.; Dini, G.; Erkoyuncu, J.; Roy, R. An innovative user-centred support tool for Augmented Reality maintenance systems design: A preliminary study. Procedia CIRP 2018, 70, 362–367. [Google Scholar] [CrossRef]
- Bin Yahya, M.Y.; Hui, Y.L.; Yassin, A.B.M.; Omar, R.; Robin, R.O.A.; Kasim, N. The Challenges of the Implementation of Construction Robotics Technologies in the Construction. MATEC Web Conf. 2019, 266, 05012. [Google Scholar] [CrossRef]
- Shahrubudin, N.; Koshy, P.; Alipal, J.; Kadir, M.; Lee, T. Challenges of 3D printing technology for manufacturing biomedical products: A case study of Malaysian manufacturing firms. Heliyon 2020, 6, e03734. [Google Scholar] [CrossRef]
- Sandström, C. Adopting 3D Printing for manufacturing-The case of the hearing aid industry. Ratio Work. Pap. 2015, 262, 20. [Google Scholar]
- Emelogu, A.; Marufuzzaman, M.; Thompson, S.M.; Shamsaei, N.; Bian, L. Additive manufacturing of biomedical implants: A feasibility assessment via supply-chain cost analysis. Addit. Manuf. 2016, 11, 97–113. [Google Scholar] [CrossRef]
- Borowski, P.F. Digitization, Digital Twins, Blockchain, and Industry 4.0 as Elements of Management Process in Enterprises in the Energy Sector. Energies 2021, 14, 1885. [Google Scholar] [CrossRef]
- Gobble, M.M. Digitalization, Digitization, and Innovation. Res. Manag. 2018, 61, 56–59. [Google Scholar] [CrossRef]
- Hui, S.; Chuah, W. Literature review, conceptual framework and future research directions. Int. J. Technol. Mark. 2019, 13, 205. [Google Scholar] [CrossRef]
- Morimoto, T.; Kobayashi, T.; Hirata, H.; Otani, K.; Sugimoto, M.; Tsukamoto, M.; Yoshihara, T.; Ueno, M.; Mawatari, M. XR (Extended Reality: Virtual Reality, Augmented Reality, Mixed Reality) Technology in Spine Medicine: Status Quo and Quo Vadis. J. Clin. Med. 2022, 11, 470. [Google Scholar] [CrossRef]
- Jayaram, S.; Vance, J.; Gadh, R.; Jayaram, U.; Srinivasan, H. Assessment of VR Technology and its Applications to Engineering Problems. J. Comput. Inf. Sci. Eng. 2001, 1, 72–83. [Google Scholar] [CrossRef]
- Yuen, S.C.-Y.; Yaoyuneyong, G.; Johnson, E. Augmented Reality: An Overview and Five Directions for AR in Education. J. Educ. Technol. Dev. Exch. 2011, 4, 11. [Google Scholar] [CrossRef]
- Lee, K. Augmented Reality in Education and Training. TechTrends 2012, 56, 13–21. [Google Scholar] [CrossRef]
- Cheng, K.H.; Tsai, C.C. Affordances of Augmented Reality in Science Learning: Suggestions for Future Research. J. Sci. Educ. Technol. 2013, 22, 449–462. [Google Scholar] [CrossRef]
- Tao, F.; Qi, Q. Make more digital twins. Nature 2019, 573, 490–491. [Google Scholar] [CrossRef]
- Collins, J.; Regenbrecht, H.; Langlotz, T. Visual Coherence in Mixed Reality: A Systematic Enquiry. Presence 2017, 26, 16–41. [Google Scholar] [CrossRef]
- Thornton, T.; Ernst, J.V.; Clark, A.C. Augmented reality as a Visual and Spatial Learning Tool in Technology education. Technol. Eng. Teach. 2012, 8, 18–21. [Google Scholar]
- Jain, S.; Werth, D. Current State of Mixed Reality Technology for Digital Retail: A Literature Review. In HCI in Business, Government and Organizations. eCommerce and Consumer Behavior: 6th International Conference, HCIBGO 2019, Held as Part of the 21st HCI International Conference, HCII 2019, Orlando, FL, USA, July 26-31, 2019, Proceedings, Part I 21; Springer International Publishing: Berlin/Heidelberg, Germany, 2019; Volume 11588, pp. 22–37. [Google Scholar]
- Hartmann, D.; Van Der Auweraer, H. Digital Twins A Preprint. 2020. Available online: https://arxiv.org/pdf/2001.09747.pdf (accessed on 28 February 2022).
- Merrill, K.J.; Breidi, F.Y.; Lumkes, J. Simulation Based Design and Optimization of Digital Pump/Motors. In Proceedings of the ASME/BATH 2013 Symposium on Fluid Power & Motion Control (FPMC2013), Sarasota, FL, USA, 6–9 October 2013. [Google Scholar]
- Ehsan, M.; Payne, G.S.; Stein, U.B.P.; Ehsan, M.; Caldwell, N.J.; Rampen, W.H.S. Potential of Digital Displacement Hydraulics For Wave Energy Conversion. In Proceedings of the 6th European Wave and Tidal Energy Conference, Glasgow, UK, 29 August–2 September 2016; Available online: www.buet.ac.bd (accessed on 27 October 2023).
- Song, X. Modeling an Active Vehicle Suspension System With Application of Digital Displacement Pump Motor. In Proceedings of the ASME Design Engineering Technical Conferences, San Diego, CA, USA, 30 August–2 September 2009; pp. 749–753. [Google Scholar]
- MRTK2-Unity Developer Documentation—MRTK 2|Microsoft Learn, Microsoft Ignite. 2022. Available online: https://learn.microsoft.com/en-us/windows/mixed-reality/mrtk-unity/mrtk2/?view=mrtkunity-2022-05 (accessed on 3 October 2022).
- Ong, S. Beginning Windows Mixed Reality Programming for HoloLens and Mixed Reality Headsets-Blending 3D Visualizations with Your Physical Environment-Sean Ong; Apress: New York City, NY, USA, 2017. [Google Scholar] [CrossRef]
- Unity Real-Time Development Platform|3D, 2D, VR & AR Engine. Available online: https://unity.com/ (accessed on 26 April 2020).
- Welcome to the Mixed Reality Feature Tool—Mixed Reality|Microsoft Learn. Available online: https://learn.microsoft.com/en-us/windows/mixed-reality/develop/unity/welcome-to-mr-feature-tool (accessed on 23 April 2023).
- blender.org—Home of the Blender Project—Free and Open 3D Creation Software. Available online: http://www.blender.org (accessed on 23 April 2023).
- Copeland, M.; Soh, J.; Puca, A.; Manning, M.; Gollob, D. Microsoft Azure and Cloud Computing. Microsoft Azur. 2015, 3–26. [Google Scholar] [CrossRef]
- Photon Cloud or Photon Server? Available online: https://doc.photonengine.com/realtime/current/getting-started/onpremises-or-saas# (accessed on 22 September 2023).
- Liu, B.; Ding, L.; Meng, L. Spatial knowledge acquisition with virtual semantic landmarks in mixed reality-based indoor navigation. Cartogr. Geogr. Inf. Sci. 2021, 48, 305–319. [Google Scholar] [CrossRef]
- Qualtrics XM: The Leading Experience Management Software. Available online: https://www.qualtrics.com (accessed on 18 September 2023).
- Types of Survey Questions—Research Methods Knowledge Base. Available online: https://conjointly.com/kb/types-of-survey-questions/ (accessed on 3 February 2022).
Disclaimer/Publisher’s Note: The statements, opinions and data contained in all publications are solely those of the individual author(s) and contributor(s) and not of MDPI and/or the editor(s). MDPI and/or the editor(s) disclaim responsibility for any injury to people or property resulting from any ideas, methods, instructions or products referred to in the content. |
© 2023 by the authors. Licensee MDPI, Basel, Switzerland. This article is an open access article distributed under the terms and conditions of the Creative Commons Attribution (CC BY) license (https://creativecommons.org/licenses/by/4.0/).