Abstract
Smartphones provide various services not only for social purposes but also for personal desires. This study aims to understand the multi-dimensional motivations of smartphone users. An extended motivational framework was developed using perceived benefits (i.e., expected benefits) and social influence (i.e., social identity achieved from mobile social media) from a social cognitive perspective, which was then expanded to incorporate the second-order construct of emotional attachment (i.e., emotional desires). This study examines the effects of motivations on value perceptions, which consequently explains current smartphone use. Structural equation modeling (SEM) was used, and data collected from 738 current smartphone users were analyzed. Regarding the results, expected benefits (i.e., information seeking, entertained activity, self-reactiveness, and immediate access), social influence (i.e., social identity achieved from mobile social media), and emotional desires (i.e., emotional attachment) explained value perceptions (i.e., social, hedonic, and utilitarian values) which positively influence the recent use of smartphones.
1. Introduction
Smartphones play a larger role in people’s daily life; their owners often treat them like body appendages. Regardless of the mass adoption and high popularity of the smartphone, unknown factors still persist regarding its use. For example, various studies have previously discussed motivational factors (e.g., to pass time, social utility, instrumentality, mobility, and accessibility) that are based on the perceived benefits of using mobile devices (Gerlich et al. 2015; Joo and Sang 2013; Park et al. 2013; Schmitz Weiss 2013). The cognitive benefit, however, cannot explain smartphone use due to the smartphone’s ubiquity and the unique relationship that users built with their devices. Smartphone usage is inclined to be more comprehensive than that of other information technology (IT) devices because the smartphone is highly personal to users and provides an always-on environment of social networking services (Counts and Fisher 2010; Hong et al. 2008; Vincent 2005). Therefore, further study is necessary with regard to possible dimensions, such as social influence (i.e., social identity) from mobile social networks, or emotional desires that motivate users to interact with the device.
The smartphone offers an opportunity to be in contact with other users through real-time interacting and to keep up to date with social activities in social groups (Nikou and Bouwman 2014); thus, the social identity formed with respect to others in the social community can be an important motivational factor to be considered with expected benefits. In addition to expected benefits and social identity, this study explores emotional desires. Since mobile device users often consider their device to be an extension of themselves (Vincent et al. 2005; Wehmeyer 2007), emotional attachment leads to an emotional need to use the smartphone. Emotion is acknowledged as a driving force behind human action (Izard 1984; Dolan 2002); however, emotional factors remain, to a large extent, unexplored in the studies on IT device usage. Smartphone users, in particular, consider their device to be indispensable and become emotionally attached to the device (Larsen 2004; Vincent and Harper 2003; Vincent 2005, 2006). Mobile device users often consider their device to be an extension of themselves (Vincent et al. 2005; Wehmeyer 2007).
Accordingly, this study suggests a motivational framework that is explained through the lens of social cognitive (Bandura 1986) and attachment (Bowlby 1979) theories. The social cognitive theory explains how individual experiences and behaviors are partially shaped and controlled by individual cognitions (i.e., expected benefits) and social influence (i.e., social identity) (Bandura 1986). Emotional attachment theory explains that there is a persistent emotional desire created between users and their devices (Bowlby 1979), which contributes to the need for building a unique device that is highly personal to the user (Vincent 2005). Finally, the proposed multi-dimensional framework includes three dimensions of motivation (i.e., expected benefits, social identity, and emotional desires) that explain the smartphone users’ experience of value perceptions (i.e., social, hedonic, and utilitarian values) and behaviors. Additionally, this study identifies the influence of demographic variables on smartphone-use behaviors by utilizing the research model.
2. Literature Review
2.1. Social Cognitive Theory
According to social cognitive theory, a cognitive mechanism controls individual experiences and behaviors based on expected benefits that provide incentives for its performance. The theory explains different types of expected future benefits as incentive motivators: novel sensory, social, enjoyable activity, and self-reactive incentives (Bandura 1986, pp. 232–40). Novel sensory incentives theoretically refer to motivations related to new sights and sounds that can be new information. This can be applied to understanding the user motive of smartphones because of its frequent interplay with internet connections to transform the delivery of information (Wei 2008; White 2010). Social contact can be the strongest motive for smartphone users with a greater prevalence of the device (Leung and Wei 2000; Palen et al. 2000). As smartphone users consider using the phone to be enjoyable and fun (Kwon and Chidambaram 2000), entertainment activity is an important motive for its users. Self-reactiveness functions lead to behavioral rewards for improving one’s inner state (Bandura 1986). Self-reactiveness is relevant in understanding the motivations of using a smartphone since users rely on the device to forget problems or to relax (LaRose et al. 2001). In addition, smartphone users are more motivated to use their device due to its immediate accessibility. Accessibility has been identified as an important motive in early studies of the mobile phone (Claisse and Rowe 1987; Leung and Wei 2000). Therefore, the current study considers that immediate access to services explains the use of smartphones as well.
In addition to expected benefits, social influences control individual experiences and behaviors (Bandura 1991). Chiu et al. (2006) found that social influences explain knowledge sharing behavior online and that the resultant social influence should be considered with a cognitive dimension in social cognitive theory. In particular, social identity occurs when people in a group accept social influence as a means of maintaining relationships with others in the group (Kelman 1958). Social identity can be characterized by self-defining social identity since it refers to self-awareness related to group membership and its evaluative importance in the group (Tajfel 1978). The popularity of social networking services (SNSs) (e.g., Facebook, Twitter, or Instagram) on smartphones continues to increase, and mobile social networking enables people to be highly involved with use-experiences (Counts and Fisher 2010). Therefore, the present study maintains the social influence achieved from SNSs in the motivational framework of smartphone users.
2.2. Emotional Attachment Theory
According to an early study (Bowlby 1979), an attachment is an emotion-laden and target-specific bond between a person and a specific object. Understanding smartphone use is more complex than understanding the use of other technologies (e.g., personal digital assistants, personal stereos, and laptops) because there is a persistent emotional bond created between users and their device (Vincent 2005). For example, some owners describe being away from the device or losing the device as terrible (Vincent and Harper 2003) and as viscerally akin to the loss of a limb (Kolsaker and Drakatos 2009, p. 268). The mobile phone increases a tension between needing the device and concerns about losing it, which is not a matter of losing lists of phone numbers or personal messages stored on the mobile phone but a potential concern about losing possible relationships that the mobile phone facilitates (Kopomaa 2000; Taylor and Harper 2003).
According to the emotional attachment theory, four attachment-related behaviors define how attachment is regarded across the lifespan: proximity maintenance, a safe haven, emotional security, and separation distress (Ainsworth et al. 1978; Hazan and Shaver 1994; Segrin and Flora 2005). Proximity maintenance is a desire to be near the attachment object. A safe haven is an emotional status that represents a desire to return to the attachment object for comfort and safety, particularly when people experience feeling down or stressed. Emotional security refers to feelings of security. With regard to an attachment object, people feel emotionally secure from the surrounding environment, and they feel better when they can be with the object. Separation distress refers to anxiety or concerns that occur in the absence of the attachment object.
These four attachment styles are theoretically based on the single higher concept of emotional attachment (Ainsworth et al. 1978; Hazan and Shaver 1994; Hazan and Zeifman 1999; Segrin and Flora 2005). In particular, the concept of emotional attachment has been considered as a second-order conceptualized construct and adopted by many other studies. Thomson et al. (2005) proposed a second-order structural model that conceptualized emotional attachment as a higher-order construct. Park et al. (2010) also suggested that the construct of emotional attachment could consist of sub-concepts (e.g., feelings of being personally connected, or feelings that automatically come to mind). Therefore, this study adopts four types of feelings (i.e., proximity maintenance, a safe haven, emotional security, separation distress) into the second-order construct for a higher concept of emotional attachment.
2.3. Consumer Value and Behavior
Consumer value refers to consumer evaluation of products or services that can be achieved from consumer experience of using the product or service (Holbrook 1999). Such experience, consequently, leads to resultant consumer behaviors (to use the service or not; Sheth et al. 1991). The consumer value and behavioral model has been adopted in diverse topics, such as mobile services (Jung et al. 2018), mobile advertisements (Lu et al. 2019), and mobile learning (Baydas and Yilmaz 2018). Most studies, however, have focused on the functional aspects of information technology. In the smartphone market, a consumer not only evaluates the functional and social aspects of the smartphone but also the emotional aspect of using a device (i.e., hedonic values). This study considers three different types of perceived values that can independently contribute to consumer behavior (Sheth et al. 1991; Sweeney et al. 1996). Social value refers to consumer experience related to a smartphone’s ability to enhance social relationships. Hedonic value refers to consumer experiences derived from the feelings or affective states that smartphones generate. Utilitarian value refers to consumer evaluation related to the perceived quality or performance of using a smartphone. Thus, this study suggests a research model (see Figure 1) that incorporates an extended motivational framework (i.e., expected benefits, SNS social identity, and emotional desire) and consumer experiences with value perceptions (i.e., functional, social, and emotional value) for understanding the actual use of smartphones.
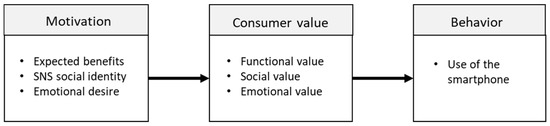
Figure 1.
Research framework.
3. Hypotheses Development
In this section, hypotheses for budiling a final research model are suggested. Hypotheses that explain the effects of motivational factors on perceived values are developed, and then, hypotheses associated with effects of perceived values on the use of the smartphone are explained.
3.1. Effects of Expected Benefits on Experience of Consumer Value
Users who seek information using a mobile device perceives a utilitarian value from using the device (Pandey et al. 2013). Mobile information seekers are more likely to share information within mobile social networks, especially for a common goal (e.g., shared interests) of the network (Heinemann et al. 2003). Therefore, mobile users, who obtain information from their smartphone, perceive not only the functional usefulness of a smartphone but also the social value of using the smartphone. People obtain benefits related to building and enhancing social networks while using mobile devices, and they identify social interaction as an important motive for users (Leung and Wei 2000; Palen et al. 2000). Since users can make frequent and immediate social contacts using a smartphone, they are more likely to experience relational benefits from using the device.
Hypothesis 1 (H1).
People who expect to seek information using a smartphone are more likely to perceive (a) social and (b) utilitarian values from using a smartphone.
Hypothesis 2 (H2).
People who expect to have social contact by using a smartphone are more likely to perceive social value from using a smartphone.
People are more likely to experience enjoyment when they are expected to have enjoyment from IT-related behaviors such as searching the internet (Teo et al. 1999), watching a movie on a website (Van der Heijden 2004), or using m-commerce (Alalwan et al. 2018). With regard to various smartphone services, the expectation of entertainment activity from using smartphone services motivates users to participate in enjoyable activities and perceive affective experiences (Ha et al. 2007; Nysveen et al. 2005). In addition, as LaRose et al. (2001) have suggested, IT users use the service to relax or forget their problems. Such expectations lead smartphone users to experience the hedonic value of a smartphone.
Hypothesis 3 (H3).
People who expect to have entertainment activity from using a smartphone are more likely to perceive the hedonic value of using a smartphone.
Hypothesis 4 (H4).
People who expect to have self-reactiveness from using a smartphone are more likely to perceive the hedonic value of using a smartphone.
The high technicality of convergent media, such as ubiquitous connectivity, should be regarded as being associated with utilitarian attitude toward frequent adoption and use of the device (Chun et al. 2012). In addition, smartphone users gain social benefits from the ubiquitous and immediate connectivity to a mobile network (Papacharissi and Rubin 2000).
Hypothesis 5 (H5).
People who expect to have immediate access to a smartphone are more likely to perceive (a) social and (b) utilitarian values from using a smartphone.
3.2. Effects of SNSs Social Identity on Experience of Consumer Value
Chun et al. (2012) found that when mobile device users have a positive social identity, they were more likely to perceive various values related to using the device. Therefore, this study assumes that people who perceive social influence (i.e., social identity) within a social group connected through mobile SNSs will achieve not only social values from using the smartphone but also hedonic and utilitarian values when interacting with peers.
Hypothesis 6 (H6).
People who have a social identity within a social group, connected through mobile social networks, are more likely to perceive (a) social, (b) hedonic, and (c) utilitarian values from using a smartphone.
3.3. Effects of Emotional Desire on Experience of Consumer Value
Read et al. (2011) studied the effects of emotional attachment on using behaviors of digital books. Their research found that emotional attachment has an effect on the emotional experience of reading books (e.g., a hedonic experience). Also, emotional attachment explains not only hedonic experiences but also experiences of various value perceptions. For example, in a study on attachment and consumer behavior, Park et al. (2006) explained that consumers developed an attachment to products (e.g., brands) in a way as to satisfy their needs, which led to various consumption experiences (e.g., experiential, functional, and symbolic). Therefore, the current study suggests that emotional attachment explains consumer experiences of value perceptions from using a smartphone.
Hypothesis 7 (H7).
People, who feel emotionally attached toward using a smartphone, are more likely to perceived (a) social, (b) hedonic, and (c) utilitarian values.
3.4. Effects of Consumer Value on Behaviors
The effects of perceived values of smartphones provide services that are closer to personal needs for entertainment experiences rather than for workplace purposes (Ha et al. 2007). Their research found that the perceived hedonic value had a greater potential to explain use-behavior. Similar results were found in other studies of hedonic information systems (Van der Heijden 2004) and mobile services (Kim and Han 2009). The smartphone also provides several useful services such as mobile banking and location-based services (Kim and Han 2009). By utilizing such services, smartphone users can achieve certain task-related goals. Also, Ha et al. (2007) explained that using a smartphone enhanced social relationships, which influenced the resultant behavior of mobile phone use.
Hypothesis 8 (H8).
People who perceive social value from using a smartphone are more likely to use a smartphone.
Hypothesis 9 (H9).
People who perceive hedonic value from using a smartphone are more likely to use a smartphone.
Hypothesis 10 (H10).
People who perceive utilitarian value from using a smartphone are more likely to use a smartphone.
Finally, this study suggests a structural equation model. Figure 2 includes all hypotheses developed in this section.
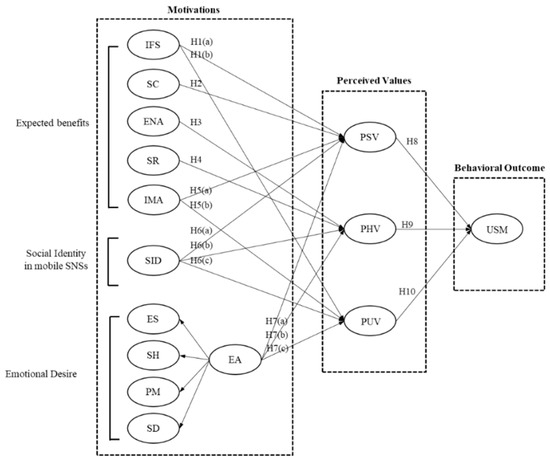
Figure 2.
Proposed structural equation model.
4. Method
4.1. Data Collecting Procedure
A self-administered questionnaire was used to collect samples. All survey questions were approved by the IRB (Institutional Review Board). The survey link was created using Qualtrics (www.qualtrics.com) and posted on MTurk. The Amazon’s Mechanical Tuck (MTurk) is a diverse workforce where requesters can provide online tasks to many individual workers (Pontin 2007). Participants (aged from 18 to 64) living in the United States were able to participate in the survey. The consent form was provided to participants before starting the survey. The participants took about 20 min to answer questionnaires and were paid $1 if they completed the survey. The first question asked participants if they were current users of smartphones and had recent experience with using mobile social media services (e.g., Facebook, Twitter, and Instagram). Using a dichotomous scale (i.e., yes or no), participants who answered yes were allowed to continue the survey. A sample size of 779 people completed the survey. A dataset of 738 was used after deleting incomplete data and data from the same IP address. To test hypotheses, this study used structural equation modeling (SEM), and IBM SPSS and AMOS 25 were used to analyze the final dataset.
4.2. Measurements
Scales to measure cognitive benefits were adopted from a previous study conducted by LaRose and Eastin (2004). Scales for information-seeking were additionally adopted from Wei’s 2008 study. Scales to measure social identity were adopted from previous studies (Charng et al. 1988; Kim et al. 2014). To measure social identity from SNSs connected through the smartphone, respondents were asked to name one of the social groups (e.g., school, company, or peer groups) on social network sites that they access via their smartphone. Scales to measure four emotional attachment variables—proximity maintenance, emotional security, safe haven, and separation distress—were adopted from previous studies (Fraley and Davis 1997; Hazan and Zeifman 1999; VanMeter and Grisaffe 2013; Vincent 2005). Scales to measure perceived values—perceived social, hedonic, and utilitarian values—were adopted from previous studies (Choi and Chung 2013; Sweeney and Soutar 2001). Scales to measure the recent use of a smartphone were adopted from a previous study (LaRose and Eastin 2004) of internet use and applied to smartphone use. Scales are presented in the Appendix A. In addition, participants were asked about the amount of time spent recently on a smartphone and their frequency of device-use on a recent day. To measure demographic characteristics, respondents were asked questions related to themselves. Demographic questions included age, sex, education, household income, and race.
5. Results
5.1. Participant Characteristics
Forty-four percent of all participants were males, and 56% were females. The average age of the participants was 34.73 (SD = 10.37). The majority of the participants were aged between 20 and 30, 73% of the participants were aged 19 to 39, while only 27% were aged 40 to 64. About 68% of participants were Caucasian Americans. Approximately 67% of participants spent 10 min to two hours on mobile SNS services per day, and half of the participants received 10 to 50 text messages in a day.
5.2. Multicollinearity Test
Before testing the structural equation model, this study tested the main assumption of no or less multicollinearity among variables. According to Kline (2011), multicollinearity can be detected when latent variables are highly correlated (e.g., correlation coefficients of 0.85 or greater). Thus, a bivariate correlation analysis was conducted among all latent variables (see Table 2). The correlation coefficients ranged from 0.27 to 0.80. This result shows that all variables are distinct from each other and the research model consists of different concepts of variables.
5.3. Model Fit Indicators
To examine the overall model fit, multiple fit statistics should be considered (Bollen 1989). This study examined six indices—chi-square (χ2), ratio of chi-square to degree of freedom (CMIN/DF), comparative fit index (CFI), goodness of fit index (GFI), root mean squared error of approximation (RMSEA), and standardized root mean squared residual (SRMR). Usually, SEM models generate significant chi-square (p < 0.00), which means that the proposed model does not adequately present the entire set of relationships. However, this result is due to the large sample size. Since χ2 is sensitive to sample size, the chi-square values can be inflated with large sample sizes (e.g., n = 200 or more), which can erroneously suggest a poor data-to-model fit (Schumacker and Lomax 2004). For this reason, CMIN/DF (chi-square/degree of freedom ratio) is recommended by previous researchers because CMIN/DF is less dependent on sample size (Marsh and Hocevar 1985). They have suggested that CMIN/DF ranging from 2 to 5 indicates a reasonable fit. In addition, CFI indicates the extent to which the proposed model is better than the independent model that assumes variables are not correlated. Researchers have suggested that CFI should be greater than 0.90 or close to 0.95 (Anderson and Gerbing 1988). In complex models, however, 0.80 could be the lowest acceptable level for the CFI (Hart 1994). GFI indicates the proposition of variance in the proposed model by the observed covariance (Tabachnick and Fidell 1996). The GFI should be greater than 0.80, and the lowest acceptable level is 0.70 in the case of complex models (Judge and Hulin 1993). RMSEA and SRMR indicate the square root of the difference between the residuals of the sample covariance matrix and the covariance in the proposed model. The RMSEA and SRMR should respectively have values close to (or lower than) 0.06 and 0.08 (Hu and Bentler 1999).
5.4. Measurement Model
The data analysis of structural equation modeling follows a two-step approach, as recommended by Anderson and Gerbing (1988). The first step is to analyze a measurement model using confirmatory factor analysis (CFA), and the second step is to analyze a structural path model. The purpose of testing the measurement model is to assess the reliability and validity of the measures before using them in a full model. Further, the purpose of conducting the path model is to test the hypotheses proposed in the model.
Confirmatory factor analysis (CFA) was used to measure the reliability of constructs (i.e., construct validity). In the measurement model, each construct was correlated freely with other construct. The model generated an acceptable model fit (CFI = 0.90, GFI = 0.78, RMR = 0.06, RMSEA = 0.06, χ2 = 4203.53, df = 1204, p < 0.00, CMIN/DF = 3.49). To test the reliability of constructs, convergent validity and discriminant validity were tested. Convergent validity was tested by examining values of composite reliability (CR) above 0.7 and average variance extracted (AVE) above 0.5 (Anderson and Gerbing 1988).
The AVE statistics ranged from 0.51 to 0.84, and the CR statistics range from 0.75 to 0.94, which indicates convergent validity (see Table 1). In addition, values of AVE are greater than squared correlation coefficients (see Table 2), which indicate a discriminate validity among the constructs (Fornell and Larcker 1981).

Table 1.
Results of a measurement model.
Table 2.
Discriminant validity: correlation matrix and average variance extracted (AVE) statistics.
5.5. Structural Equation Model
Finally, proposed measures were used as indicators of latent variables in the structural equation model (Figure 3). The structural model generated a reasonably acceptable model fit (CFI = 0.92, GFI = 0.82, SRMR = 0.06, RMSEA = 0.05, χ2 = 3027.66, df = 948, p < 0.00, CMIN/DF = 3.19).
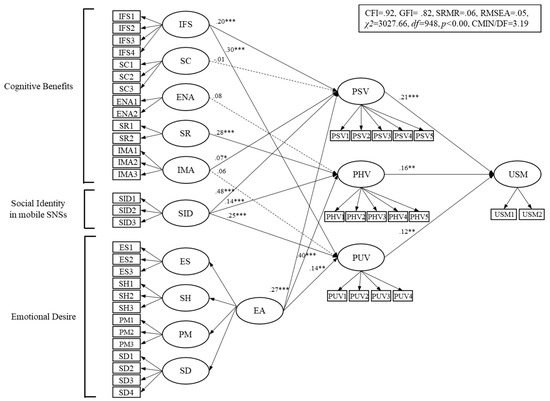
Figure 3.
Structural equation model for testing H1 to H10.
Results of the date are presented in Table 3. Information-seeking (γ = 0.20, p < 0.001) and immediate access (γ = 0.08, p < 0.05) showed positive effects on perceived social value while social contact (γ = −0.01, p > 0.05) did not have an effect on perceived social value. This indicates that the information search function and high accessibility of smartphones help users experience the social value of a smartphone. Information-seeking (γ = 0.31, p < 0.001) also had a positive effect on perceived utilitarian value while immediate access (γ = 0.07, p > 0.05) did not influence perceived utilitarian value. Entertainment activity (γ = 0.08, p > 0.05) did not have an effect on perceived hedonic value while self-reactiveness (γ = 0.28, p < 0.001) had a positive effect on hedonic value. These results indicate that the effect of self-reactive behaviors for inner relaxation has a greater power to lead smartphone users’ hedonic experiences than that of fun activities using a smartphone.
Table 3.
Path results for H1~H10.
Social identity showed positive effects on perceived social (γ = 0.49, p < 0.001), hedonic (γ = 0.14, p < 0.001), and utilitarian (γ = 0.25, p < 0.001) values. This result indicates that when people perceive social identity in mobile social networks by using a smartphone, they positively experience various values (i.e., social, hedonic, and utilitarian values) that the smartphone provides through such networks. In addition, emotional attachment had positive effects on perceived social (γ = 0.28, p < 0.001), hedonic (γ = 0.41, p < 0.001), and utilitarian (γ = 0.14, p < 0.01) values. This indicates that people who are emotionally attached to their smartphones perceive not only relational enhancement, but also hedonic and utilitarian experiences from using the smartphone. The perceived social value indicated a positive effect on the use of smartphones (β = 0.22, p < 0.001). Also, the perceived hedonic (β = 0.17, p < 0.05) and utilitarian (β = 0.13, p < 0.05) values had a positive effect on the use of smartphones.
5.6. Effects of Control Variables on Perceived Value and Use of the Smartphone
Demographic differences apparently influence different perceptions of interactive services that mobile devices provide (Mundorf and Bryant 2002). Demographic factors (age, sex, socioeconomic status, and race) were found to be key differentiators in the behaviors of using smartphone services (Barutçu 2007; Jackson et al. 2008; Kim and Hwang 2012; Leung and Wei 2000; Wei 2008). Thus, this study also examined the effect of demographic variables (as control variables) in the hypothesized model, and a path analysis was conducted. Demographic variables—age (AGE), sex (SEX), socio-economic status (SES), and race (RACE)—were recorded as binary variables. Age was divided into two groups (e.g., young and old). Participants in their 20s to 39 years of age were categorized into the younger group (n = 538, 72.9%) and participants aged 40 to 64 were categorized into the older group (n = 200, 27.1%). Sex was categorized into male (n = 325, 44%) and female (n = 413, 56%) groups. Socioeconomic status was also divided into two groups (e.g., low and high) based on education and income. People who were relatively more educated (e.g., postgraduate work or postgraduate degree) and with a higher household income (e.g., more than USD50,000 per year) were categorized as having a higher socioeconomic status (n = 363, 49.2%). The others, who were relatively less educated and with a lower household income, were categorized as having a lower socioeconomic status (n = 375, 50.8%). Due to the limited sample size, RACE was only categorized as two groups: Not-Caucasian (n = 237, 32.1%) and Caucasian (n = 501, 67.9%) groups.
The model including demographic variables as controls, generated an acceptable model fit (CFI = 0.92, GFI = 0.83, SRMR = 0.05, RMSEA = 0.05, χ2 = 3230.91, df = 1088, p = 0.00, CMIN/DF = 2.97). The model fit was slightly better when compared to the model fit for the model without control variables (see Table 4). Regarding the effects of controls (see Table 5), male participants are less likely to perceive hedonic (γ = −0.08, p < 0.05) and utilitarian (γ = −0.11, p < 0.001) values than female participants. Participants who have a higher socioeconomic status were more likely to perceive hedonic value (γ = 0.07, p < 0.05) than those who had a lower socioeconomic status. Caucasian participants were more likely to perceive social value (γ = 0.06, p < 0.05) from using a smartphone. Results of demographic variables’ effects on the use of smartphones showed that only age has a significant effect on the use of smartphones. Younger users (γ = −0.12, p < 0.01) were more likely to use a smartphone compared to relatively older participants.
Table 4.
Model fits of the final model and the model including control variables.
Table 5.
Effects of control variables on endogenous variables.
6. Discussion
A smartphone is highly personal to users and provides an always-on environment of social networking services, which makes its usage more comprehensive compared to those of other IT devices (Counts and Fisher 2010). In addition, mobile device users often feel emotionally attached to their smartphones and the feelings lead to an emotional need to use the smartphone (Vincent et al. 2005; Wehmeyer 2007). This study proposed the multi-dimensional motivational framework to understand smartphone user experience of value perceptions and behaviors. The motivational framework was theoretically developed through the integration of three domains (i.e., expected benefits, social identity, and emotional desires) by adopting the social cognitive (Bandura 1986) and attachment (Bowlby 1979) theories.
We predicted that the expected benefits would positively explain consumer experience with value perceptions. However, this study found unexpected results. For example, the expected benefits of having social contact did not explain the social value perception of using smartphones. These findings contradict with previous studies indicating that making a call to be part of a social group was one of the most important motivators to cell-phone users (Leung and Wei 2000; Palen et al. 2000). Since conventional cell-phones had limited internet connectivity and services compared to smartphones, it is required to redefine the expected benefits of having social contact for smartphone users. Using a smartphone solely for social contact might not be the primary benefit to users. Participants may have scant expectations for making social contact (e.g., for belonging to a group) since there are many other services that they can expect to have from using their smartphones. Another unexpected result indicates that consumer expectation of entertainment activity does not influence hedonic value perceptions, while the self-reactiveness expectation positively explains hedonic value perceptions. Self-reactiveness benefits are related to activities (e.g., to forget problems or relax) that smartphone users can have just for themselves in order to have their own quiet time (LaRose et al. 2001). Otherwise, entertainment activities are related to fun activities that users can enjoy by using mobile apps. Smartphone users might expect to have self-reactiveness benefits by using the device, which leads their experiences with the hedonic value of using the device. From this finding, we assume that smartphones are not an ideal tool for entertainment activities for users. Drake et al. (2012) also mentioned that the most important hidden motivator of using smartphones was identified as “me time”, namely, for seeking relaxation and not for gaining entertainment or other activities.
Along with the expected benefits, this study found that social identity derived from mobile SNSs positively influenced experiences of social, hedonic, and utilitarian values. The results indicate that perceptions of SNS social identity could be important social influence that motivates smartphone users’ overall experiences. This result is supported by previous studies explaining that people perceive social influence through their social image within their reference group (Dickinger et al. 2008; Hsu and Lu 2004), and their perceived social identity within the social group explains consumer values of using the mobile device (Chun et al. 2012).
This study also found that emotional attachment had positive effects on social, hedonic, and utilitarian value perceptions. This result implies that emotional desire is a salient factor that explains various experiences of consumer value from using a smartphone. The finding in this study can be supported by other studies (Vincent 2006; Vincent et al. 2005) that highlighted the importance of emotional attachment for understanding consumer experience with using mobile devices. More importantly, results show that emotional attachment should be considered an important motivator with other social cognitive factors.
Finally, this study examined how the experience of value perceptions explains the actual use of a smartphone (e.g., actual time spent on the smartphone). The social, hedonic, and utilitarian value perceptions positively influenced the use of the smartphone. Among these three value perceptions, social value had the greatest effect on the use of the smartphone. Although the smartphone provides various services that motivate users to experience value perceptions (Chun et al. 2012), the results address that experiences of social enhancement from using the smartphone is the most influential factor that predicts the actual use of the smartphone.
7. Conclusions
The present research has two important implications. First, the model explains how social cognitive theory can be utilized for to understand smartphone consumer motivations. Although diverse research on the motivational factors of using mobile phones or smartphones (Gerlich et al. 2015; Joo and Sang 2013; Leung and Wei 2000; Özcan and Koçak 2003; Park et al. 2013; Reid and Reid 2007; Wei 2008; Wei and Lo 2006; Schmitz Weiss 2013) have adopted the traditional uses and gratifications theory, this study applied social cognitive perspectives in order to understand the motivational factors of smartphone users. A problem related to the uses and gratifications theory, in expecting IT-device user-experience and user-behavior, has been consistently reported (Ferguson and Perse 2000; LaRose et al. 2001; Papacharissi and Rubin 2000; Parker and Plank 2000). For example, traditional gratifications with less than 10% variance explains consumer experience and behavior of using IT devices. Therefore, we asked respondents to indicate the gratifications that they expect from using a device in the future (e.g., expected benefits), which is distinct from their traditional motivations obtained in the past. The attempt to understand motivational factors from a social cognitive perspective has an implication to future researchers who may focus on the motivational factors of IT device users or mobile service use. Moreover, the present study presents the importance of SNS social identity, achieved through social relations (i.e., social influence), which is based on social cognitive perspectives that explain a relational influence on human behavior (Bandura 1986). These findings supply evidence that social cognitive theory can be applied to new technology research such as educational (e.g., brain-training games) or medical apps (Rhea et al. 2018). In addition to adopting social cognitive theory, this study suggests an extended motivations framework that also explains the emotional desires of IT device users. The extended motivational framework was validated by using the dataset of over 700 current smartphone users. This suggests that smartphone user motivations can be understood from a multi-dimensional framework that includes expected benefits, social identity, and emotional desires.
Second, results in this study imply that new technologies should be used in a healthier way for society. In particular, emotional desire would be an important motivational need to examine for smartphone users in the field of consumer behavior. The proliferation of smartphones in society enables constant connectivity among users and encourages users to establish an emotional bond with their device (Vincent 2005, 2006; Vincent and Harper 2003). Although many users regard the smartphone as an extension of themselves, reflecting who they are (Vincent et al. 2005; Wehmeyer 2007), insufficient research has been conducted for the purpose of understanding the emotional attachment to smartphones among their users. Moreover, researchers (Jiménez and Voss 2014; Kim et al. 2017) focusing on emotional attachment have mentioned that there is scant literature on identifying a construct of emotional attachment and its possible impact on society. An emotional attachment connecting an individual with a specific product has been believed to be an important concept in the field of marketing (Thomson et al. 2005). At the same time, however, emotional attachment toward using technology devices may cause social problems such as addictive behavior or social isolation (Kim et al. 2017). From the findings in the current study, emotional desires are the most salient factor explaining consumers’ hedonic experiences. Therefore, further attempts to understand the impact of emotional attachment to IT devices on consumers and society are necessary. Also, when companies and policy makers develop new products or policies of industry regulations, the current or potential impact of technologies on consumers should be carefully monitored.
For future studies, the proposed model can be applied to understand behavioral outcomes related to emerging technologies (e.g., artificial intelligence, voice assistant faction, mobile visual search, or tracking location) related to mobile devices. Also, the models can be further developed by including moderating factors such as different levels of engagement to the applications. The present study has its limitations. The sample is limited to users who are already familiar with using IT devices or social networking. Because this study targeted smartphone users who were able to utilize social networking services on their phones, approximately 73% of participants were limited in the age range of the 20s and 30s. This narrowed age range among prolific users implies limited angles for understanding general smartphone user behaviors. Demographic factors have been reported as important with regard to smartphone user behavior. In particular, age differences are an important factor to be discussed further (Leung and Wei 2000; Wei 2008). Therefore, future study is necessary to identify multi-dimensional desires with more diverse samples.
Funding
This research received no extra found.
Conflicts of Interest
The author declares no conflict of interest.
Appendix A
Table A1.
Measurement of cognitive benefits.
Table A1.
Measurement of cognitive benefits.
| Variable | Coding | Measures | Source |
|---|---|---|---|
| IFS | IFS1 | Get information when I do some assignment and task | LaRose and Eastin (2004) Wei (2008) |
| IFS2 | Get immediate knowledge of big news events | ||
| IFS3 | Get information about some products | ||
| IFS4 | Find a wealth of information | ||
| SC | SC1 | Get support from others | LaRose and Eastin (2004) |
| SC2 | Find something to talk about | ||
| SC3 | Belong to a group that I value | ||
| ENA | ENA1 | Do entertained activities | LaRose and Eastin (2004) |
| ENA2 | Enjoy fun activities using applications | ||
| SR | SR1 | Forget my problems | LaRose and Eastin (2004) |
| SR2 | Have time to be relaxed | ||
| IMA | IMA1 | Be always accessible to anyone no matter where I am | Leung and Wei (2000) |
| IMA2 | Provide immediate access to others anywhere anytime | ||
| IMA3 | Be always available in case of emergency |
Table A2.
Measurement of social identity achieved from mobile social network.
Table A2.
Measurement of social identity achieved from mobile social network.
| Variable | Coding | Measures | Source |
|---|---|---|---|
| SID | SID1 | Using smartphone helps to identify myself within the group. | Kim et al. (2014) |
| SID2 | Using smartphone helps to enhance my image within the group. | ||
| SID3 | Using smartphone helps to elevate my standing within the group. |
Table A3.
Measurement of emotional attachment.
Table A3.
Measurement of emotional attachment.
| Variable | Coding | Measures | Source |
|---|---|---|---|
| ES | ES1 | I feel secure when my smartphone helps me to take on the world. | Hazan and Zeifman (1999) Fraley and Davis (1997) |
| ES2 | I feel secure because my smartphone keeps me connected. | ||
| ES3 | I feel secure when I always count on my smartphone. | ||
| SH | SH1 | When I’m feeling down, I often turn to my smartphone. | Hazan and Zeifman (1999) Fraley and Davis (1997) |
| SH2 | If something upsets me, my smartphone can help me feel better. | ||
| SH3 | When I’m feeling upset or down, I like to get on my smartphone. | ||
| PM | PM1 | I feel that I need to have my smartphone near me. | Hazan and Zeifman (1999) |
| PM2 | I feel that I like to have access my smartphone. | ||
| PM3 | I feel compelled to check my smartphone throughout the day. | ||
| SD | SD1 | I will panic if I find that I don’t have my phone with me. | VanMeter and Grisaffe (2013) |
| SD2 | I feel concerned if I might be lost without my smartphone. | ||
| SD3 | I would be sad without my smartphone. | ||
| SD4 | It’s hard for me to spend a day without my smartphone. |
Table A4.
Measurement of consumer experience with value perception.
Table A4.
Measurement of consumer experience with value perception.
| Variable | Coding | Measures | Source |
|---|---|---|---|
| PSV | PSV1 | Using a smartphone made it easier to develop social relationships. | Choi and Chung (2013) |
| PSV2 | Using a smartphone improved my social relationships. | ||
| PSV3 | Using a smartphone enhanced the building social relationships. | ||
| PSV4 | Using a smartphone helped me to build social relationships more quickly. | ||
| PSV5 | Using a smartphone was useful in my social relationships. | ||
| PHV | PHV1 | The smartphone was one that I enjoy. | Sweeney and Soutar (2001) Chun et al. (2012) |
| PHV2 | The smartphone made me want to use it. | ||
| PHV3 | The smartphone made me feel relaxed. | ||
| PHV4 | The smartphone made me feel good. | ||
| PHV5 | The smartphone gave me pleasure. | ||
| PUV | PUV1 | Using the smartphone enabled me to accomplish tasks more quickly. | Park and Chen (2007) Chun et al. (2012) |
| PUV2 | Using the smartphone improved my performance. | ||
| PUV3 | Using the smartphone increased my productivity. | ||
| PUV4 | Using the smartphone enhanced my effectiveness. |
Table A5.
Measurement of current use of the smartphone.
Table A5.
Measurement of current use of the smartphone.
| Variable | Coding | Measures | Source |
|---|---|---|---|
| USM | USM1 | In the past week, on average, how many minutes per day have you spend on your smartphone? (excluding making a voice call) | Developed based on LaRose and Eastin (2004)’ study |
| USM2 | In the past week, on average, how many times per day have you checked your smartphone? |
References
- Ainsworth, Mary D., Mary C. Blehar, Everette Waters, and Sally N. Wall. 1978. Patterns of Attachment: A Psychological Study of the Strange Situation. Oxford: Lawrence Erlbaum. [Google Scholar]
- Alalwan, A. A., A. M. Baabdullah, N. P. Rana, K. Tamilmani, and Y. K. Dwivedi. 2018. Examining adoption of mobile internet in Saudi Arabia: Extending TAM with perceived enjoyment, innovativeness and trust. Technology in Society 55: 100–10. [Google Scholar] [CrossRef]
- Anderson, James C., and David W. Gerbing. 1988. Structural equation modeling in practice: A review and recommended two-step approach. Psychological Bulletin 103: 411–23. [Google Scholar] [CrossRef]
- Bandura, Albert. 1986. Social Foundations of Thought and Action: A Social Cognitive Theory. Englewood Cliffs: Prentice Hall. [Google Scholar]
- Bandura, Albert. 1991. Social cognitive theory of self-regulation. Organizational Behavior and Human Decision Processes 50: 248–87. [Google Scholar] [CrossRef]
- Barutçu, Süleyman. 2007. Attitudes towards mobile marketing tools: A study of Turkish consumers. Journal of Targeting, Measurement and Analysis for Marketing 16: 26–38. [Google Scholar]
- Baydas, Ozlem, and Rabia M. Yilmaz. 2018. Pre-service teachers’ intention to adopt mobile learning: A motivational model. British Journal of Educational Technology 49: 137–52. [Google Scholar] [CrossRef]
- Bollen, Kenneth A. 1989. Structural Equations with Latent Variables. New York: John Wiley and Sons. [Google Scholar]
- Bowlby, John. 1979. The Making and Breaking of Affectional Bonds. London: Tavistock. [Google Scholar]
- Charng, Hong-Wen, Jane Allyn Piliavin, and Peter L. Callero. 1988. Role identity and reasoned action in the prediction of repeated behavior. Social Psychology Quarterly 51: 303–17. [Google Scholar] [CrossRef]
- Chiu, Chao-Min, Meng-Hsiang Hsu, and Eric TG Wang. 2006. Understanding knowledge sharing in virtual communities: An integration of social capital and social cognitive theories. Decision Support Systems 42: 1872–88. [Google Scholar] [CrossRef]
- Choi, Gilok, and Hyewon Chung. 2013. Applying the technology acceptance model to social networking sites (SNS): Impact of subjective norm and social capital on the acceptance of SNS. International Journal of Human-Computer Interaction 29: 619–28. [Google Scholar] [CrossRef]
- Chun, Heasun, Hyunjoo Lee, and Daejoong Kim. 2012. The integrated model of smartphone adoption: Hedonic and utilitarian value perceptions of smartphones among Korean college students. Cyberpsychology, Behavior, and Social Networking 15: 473–79. [Google Scholar] [CrossRef]
- Claisse, Gérard, and Frantz Rowe. 1987. The telephone in question: Questions on communication. Computer Networks and ISDN Systems 14: 207–19. [Google Scholar] [CrossRef]
- Counts, Scott, and Karen E. Fisher. 2010. Mobile social networking as information ground: A case study. Library & Information Science Research 32: 98–115. [Google Scholar]
- Dickinger, Astrid, Mitra Arami, and David Meyer. 2008. The role of perceived enjoyment and social norm in the adoption of technology with network externalities. European Journal of Information Systems 17: 4–11. [Google Scholar] [CrossRef]
- Dolan, Raymond J. 2002. Emotion, cognition, and behavior. Science 298: 1191–94. [Google Scholar] [CrossRef] [PubMed]
- Drake, Kelley, Roy Elvove, and Alec Maki. 2012. Seven shades of mobile: The hidden motivations of mobile users. Available online: https://www.insightsnow.com/resources/webinars/seven-shades-of-mobile-the-hidden-motivations-of-mobile-users (accessed on 15 August 2017).
- Ferguson, Douglas A., and Elizabeth M. Perse. 2000. The World Wide Web as a functional alternative to television. Journal of Broadcasting & Electronic Media 44: 155–74. [Google Scholar]
- Fornell, Claes, and David F. Larcker. 1981. Evaluating structural equation models with unobservable variables and measurement error. Journal of Marketing Research 18: 39–50. [Google Scholar] [CrossRef]
- Fraley, R. Chris, and Keith E. Davis. 1997. Attachment formation and transfer in young adults’ close friendships and romantic relationships. Personal Relationships 4: 131–44. [Google Scholar] [CrossRef]
- Gerlich, R. Nicholas, Kristina Drumheller, and Jeffry Babb. 2015. App consumption: An exploratory analysis of the uses & gratifications of mobile apps. Academy of Marketing Studies Journal 19: 69–79. [Google Scholar]
- Ha, Imsook, Youngseog Yoon, and Munkee Choi. 2007. Determinants of adoption of mobile games under mobile broadband wireless access environment. Information & Management 44: 276–86. [Google Scholar]
- Hart, Peter M. 1994. Teacher quality of work life: Integrating work experiences, psychological distress and morale. Journal of Occupational and Organizational Psychology 67: 109–32. [Google Scholar] [CrossRef]
- Hazan, Cindy, and Debra Zeifman. 1999. Pair bonds as attachments. In Handbook of Attachment. Edited by Jude Cassidy and Phillip R. Shaver. New York: Guilford, pp. 336–54. [Google Scholar]
- Hazan, Cindy, and Phillip R. Shaver. 1994. Attachment as an organizational framework for research on close relationships. Psychological Inquiry 5: 1–22. [Google Scholar] [CrossRef]
- Heinemann, Andreas, Jussi Kangasharju, Fernando Lyardet, and Max Mühlhäuser. 2003. Iclouds–peer-to-peer information sharing in mobile environments. In Euro-Par 2003 Parallel Processing. Berlin/Heidelberg: Springer, pp. 1038–45. [Google Scholar]
- Holbrook, Morris B. 1999. Introduction to consumer value. In Consumer Value. A Framework for Analysis and Research. Edited by Morris B. Holbrook. London and New York: Routledge, pp. 1–28. [Google Scholar]
- Hong, Se-Joon, James Y. L. Thong, Jae-Yun Moon, and Kar-Yan Tam. 2008. Understanding the behavior of mobile data services consumers. Information Systems Frontiers 10: 431–45. [Google Scholar] [CrossRef]
- Hsu, Chin-Lung, and Hsi-Peng Lu. 2004. Why do people play on-line games? An extended TAM with social influences and flow experience. Information & Management 41: 853–68. [Google Scholar]
- Hu, Li-tze, and Peter M. Bentler. 1999. Cutoff criteria for fit indexes in covariance structure analysis: Conventional criteria versus new alternatives. Structural Equation Modeling 6: 1–55. [Google Scholar] [CrossRef]
- Izard, Carroll E. 1984. Emotion-cognition relationships and human development. In Emotions, Cognition, and Behavior. Edited by Carroll E Izard, Jerome Kagan and Robert B. Zajonc. New York: Cambridge University Press, pp. 17–37. [Google Scholar]
- Jackson, Linda A., Yong Zhao, Anthony Kolenic, III, Hiram E. Fitzgerald, Rena Harold, and Alexander Von Eye. 2008. Race, gender, and information technology use: The new digital divide. Cyber Psychology & Behavior 11: 437–42. [Google Scholar]
- Jiménez, Fernando R., and Kevin E. Voss. 2014. An alternative approach to the measurement of emotional attachment. Psychology & Marketing 31: 360–70. [Google Scholar]
- Joo, Jihyuk, and Yoonmo Sang. 2013. Exploring Koreans’ smartphone usage: An integrated model of the technology acceptance model and uses and gratifications theory. Computers in Human Behavior 29: 2512–18. [Google Scholar] [CrossRef]
- Judge, Timothy A., and Charles L. Hulin. 1993. Job satisfaction as a reflection of disposition: A multiple source causal analysis. Organizational Behavior and Human Decision Processes 56: 388–421. [Google Scholar] [CrossRef]
- Jung, Minji, Yu Lim Lee, Chae Min Yoo, Ji Won Kim, and Jae-Eun Chung. 2018. Exploring the cognitive, affective, and behavioral responses of Korean consumers toward mobile payment services: A text mining approach. In International Conference on Human Interface and the Management of Information. Cham: Springer, pp. 624–42. [Google Scholar]
- Kelman, Herbert C. 1958. Compliance, identification, and internalization three processes of attitude change. The Journal of Conflict Resolution 2: 51–60. [Google Scholar] [CrossRef]
- Kim, Byoungsoo, and Ingoo Han. 2009. What drives the adoption of mobile data services & quest; An approach from a value perspective. Journal of Information Technology 24: 35–45. [Google Scholar]
- Kim, Dan J., and Yujong Hwang. 2012. A study of mobile internet user’s service quality perceptions from a user’s utilitarian and hedonic value tendency perspectives. Information Systems Frontiers 14: 409–21. [Google Scholar] [CrossRef]
- Daejoong, Kim, Chun Heasun, and Lee Hyunjoo. 2014. Determining the factors that influence college students’ adoption of smartphones. Journal of the Association for information Science and Technology 65: 578–88. [Google Scholar] [CrossRef]
- Kim, EunYoung, Inhyo Cho, and Eun Joo Kim. 2017. Structural equation model of smartphone addiction based on adult attachment theory: Mediating effects of loneliness and depression. Asian Nursing Research 11: 92–97. [Google Scholar] [CrossRef] [PubMed]
- Kline, Rex B. 2011. Principles and Practice of Structural Equation Modelling, 3rd ed. New York: Guildford. [Google Scholar]
- Kolsaker, Ailsa, and Nikolaos Drakatos. 2009. Mobile advertising: The influence of emotional attachment to mobile devices on consumer receptiveness. Journal of Marketing Communications 15: 267–80. [Google Scholar] [CrossRef]
- Kopomaa, Timo. 2000. The City in Your Pocket: Birth of the Mobile Information Society. Helsinki: Gaudeamus. [Google Scholar]
- Kwon, Hyosun Stella, and Laku Chidambaram. 2000. A test of the technology acceptance model: The case of cellular telephone adoption. Paper presented at the 33rd Annual Hawaii International Conference on System Sciences, Maui, HI, USA, January 6; Hoboken: IEEE, pp. 7–16. [Google Scholar]
- LaRose, Robert, and Matthew S. Eastin. 2004. A social cognitive theory of Internet uses and gratifications: Toward a new model of media attendance. Journal of Broadcasting & Electronic Media 48: 358–77. [Google Scholar]
- LaRose, Robert, Dana Mastro, and Matthew S. Eastin. 2001. Understanding Internet usage: A social-cognitive approach to uses and gratifications. Social Science Computer Review 19: 395–413. [Google Scholar] [CrossRef]
- Larsen, Amparo. 2004. Affective technologies: Emotions and mobile phones. Connecting to the Future 11: 1–8. [Google Scholar]
- Leung, Louis, and Ran Wei. 2000. More than just talk on the move: Uses and gratifications of the cellular phone. Journalism & Mass Communication Quarterly 77: 308–20. [Google Scholar]
- Lu, Chih-Cheng, Long Wu, and Wei-Hung Hsiao. 2019. Developing customer product loyalty through mobile advertising: Affective and cognitive perspectives. International Journal of Information Management 47: 101–11. [Google Scholar] [CrossRef]
- Marsh, Herbert W., and Dennis Hocevar. 1985. Application of confirmatory factor analysis to the study of self-concept: First-and higher order factor models and their invariance across groups. Psychological Bulletin 97: 562. [Google Scholar] [CrossRef]
- Mundorf, Norbert, and Jennings Bryant. 2002. Realizing the social and commercial potential of interactive technologies. Journal of Business Research 55: 665–70. [Google Scholar] [CrossRef]
- Nikou, Shahrokh, and Harry Bouwman. 2014. Ubiquitous use of mobile social network services. Telematics and Informatics 31: 422–33. [Google Scholar] [CrossRef]
- Nysveen, Herbjørn, Per E. Pedersen, and Helge Thorbjørnsen. 2005. Intentions to use mobile services: Antecedents and cross-service comparisons. Journal of the Academy of Marketing Science 33: 330–46. [Google Scholar] [CrossRef]
- Özcan, Yusuf Ziya, and Abdullah Koçak. 2003. Research note: A need or a status symbol? Use of cellular telephones in Turkey. European Journal of Communication 18: 241–54. [Google Scholar] [CrossRef]
- Palen, Leysia, Marilyn Salzman, and Ed Youngs. 2000. Going wireless: Behavior & practice of new mobile phone users. Paper presented at the 2000 ACM conference on Computer Supported Cooperative Work, Philadelphia, PA, USA, December 2–6; New York: ACM, pp. 201–10. [Google Scholar]
- Pandey, Ambarish, Sayeedul Hasan, Divyanshu Dubey, and Sasmit Sarangi. 2013. Smartphone apps as a source of cancer information: Changing trends in health information-seeking behavior. Journal of Cancer Education 28: 138–42. [Google Scholar] [CrossRef] [PubMed]
- Papacharissi, Zizi, and Alan M. Rubin. 2000. Predictors of Internet use. Journal of Broadcasting & Electronic Media 44: 175–96. [Google Scholar]
- Park, C. Whan, Deborah J. MacInnis, and Joseph R. Priester. 2006. Beyond attitudes: Attachment and consumer behavior. Seoul National Journal 12: 3–36. [Google Scholar]
- Park, C. Whan, Deborah J. MacInnis, and Joseph R. Priester. 2010. Brand attachment and brand attitude strength: Conceptual and empirical differentiation of two critical brand equity drivers. Journal of Marketing 74: 1–17. [Google Scholar] [CrossRef]
- Park, Namkee, Yong-Chan Kim, Hae Young Shon, and Hongjin Shim. 2013. Factors influencing smartphone use and dependency in South Korea. Computers in Human Behavior 29: 1763–70. [Google Scholar] [CrossRef]
- Park, Yangil, and Jengchung V. Chen. 2007. Acceptance and adoption of the innovative use of smartphone. Industrial Management & Data Systems 107: 1349–65. [Google Scholar]
- Parker, Betty J., and Richard E. Plank. 2000. A uses and gratifications perspective on the Internet as a new information source. American Business Review 18: 43–49. [Google Scholar]
- Pontin, Jason. 2007. Artificial Intelligence: With Help from the Humans. The New York Times. March 25. Available online: http://www.nytimes.com/2007/03/25/business/yourmoney/25Stream.html?_r=0 (accessed on 15 October 2019).
- Read, Wayne, Nichola Robertson, and Lisa McQuilken. 2011. A novel romance: The technology acceptance model with emotional attachment. Australasian Marketing Journal (AMJ) 19: 223–29. [Google Scholar] [CrossRef]
- Reid, Donna J., and Fraser J. M. Reid. 2007. Text or talk? Social anxiety, loneliness, and divergent preferences for cell phone use. CyberPsychology & Behavior 10: 424–35. [Google Scholar]
- Rhea, Christopher K., Danielle T. Felsberg, and Jaclyn P. Maher. 2018. Toward Evidence-Based Smartphone Apps to Enhance Human Health: Adoption of Behavior Change Techniques. American Journal of Health Education 49: 210–13. [Google Scholar] [CrossRef]
- Schmitz Weiss, Amy. 2013. Exploring news apps and location-based services on the smartphone. Journalism & Mass Communication Quarterly 90: 435–56. [Google Scholar]
- Schumacker, Randall E., and Richard G. Lomax. 2004. A Beginner’s Guide to Structural Equation Modeling. Hove: Psychology Press. [Google Scholar]
- Segrin, Chris, and Jeanne Flora. 2005. Family Communications. Mahwah: Lawrence Erlbaum. [Google Scholar]
- Sheth, Jagdish N., Bruce I. Newman, and Barbara L. Gross. 1991. Why we buy what we buy: A theory of consumption values. Journal of Business Research 22: 159–70. [Google Scholar] [CrossRef]
- Sweeney, Jillian C., and Geoffrey N. Soutar. 2001. Consumer perceived value: The development of a multiple item scale. Journal of Retailing 77: 203–20. [Google Scholar] [CrossRef]
- Sweeney, Jillian, Geoffrey Soutar, Alma Whiteley, and Lester Johnson. 1996. Generating consumption value items: A parallel interviewing process approach. Asia Pacific Advances in Consumer Research 2: 108–15. [Google Scholar]
- Tabachnick, Barbara G., and Linda S. Fidell. 1996. Using Multivariate Statistics, 3rd ed. New York: HarperCollins. [Google Scholar]
- Tajfel, Henri. 1978. Social categorization, social identity, and social comparison. In Differentiation between Social Groups: Studies in the Social Psychology of Intergroup Relations. Edited by Henri Tajfel. London: Academic Press. [Google Scholar]
- Taylor, Alex S., and Richard Harper. 2003. The gift of the gab? A design oriented sociology of young people’s use of mobiles. Computer Supported Cooperative Work 12: 267–96. [Google Scholar] [CrossRef]
- Teo, Thompson S. H., Vivien K. G. Lim, and Raye Y. C. Lai. 1999. Intrinsic and extrinsic motivation in Internet usage. Omega 27: 25–37. [Google Scholar] [CrossRef]
- Thomson, Matthew, Deborah J. MacInnis, and C. Whan Park. 2005. The ties that bind: Measuring the strength of consumers’ emotional attachments to brands. Journal of Consumer Psychology 15: 77–91. [Google Scholar] [CrossRef]
- Van der Heijden, Hans. 2004. User acceptance of hedonic information systems. MIS Quarterly 28: 695–704. [Google Scholar] [CrossRef]
- VanMeter, Rebecca A., and Douglas B. Grisaffe. 2013. Of “likes” and pins: Measuring consumers’ emotional attachment to social media. Society for Marketing Advances Proceedings 25: 209–10. [Google Scholar]
- Vincent, Jane, and Richard Harper. 2003. The Social Shaping of UMTS: Preparing the 3G Customer. UMTS Forum Report Number 26. London: UMTS Forum. [Google Scholar]
- Vincent, Jane, Leslie Haddon, and Lynne Hamill. 2005. The influence of mobile phone users on the design of 3G products and services. Journal of the Communications Network 4: 69–73. [Google Scholar]
- Vincent, Jane. 2005. Emotional Attachment to Mobile Phones: An Extraordinary Relationship. London: Springer, pp. 93–104. [Google Scholar]
- Vincent, Jane. 2006. Emotional attachment and mobile phones. In Thumb culture: The Meaning of Mobile Phones for Society. Edited by Peter Glotz, Stefan Bertschi and Chris Locke. Bielefeld: Transcript Verlag/Transaction US, pp. 117–22. [Google Scholar]
- Wehmeyer, Kai. 2007. Assessing users’ attachment to their mobile devices. Paper presented at the Sixth International Conference on the Management of Mobile Business, Toronto, ON, Canada, July 9–11; Washington, DC: IEEE Computer Society. [Google Scholar]
- Wei, Ran, and Ven-Hwei Lo. 2006. Staying connected while on the move: Cell phone use and social connectedness. New Media & Society 8: 53–72. [Google Scholar]
- Wei, Ran. 2008. Motivations for using the mobile phone for mass communications and entertainment. Telematics and Informatics 25: 36–46. [Google Scholar] [CrossRef]
- White, M. 2010. Information anywhere, any when: The role of the smartphone. Business Information Review 27: 242–47. [Google Scholar] [CrossRef]
© 2019 by the author. Licensee MDPI, Basel, Switzerland. This article is an open access article distributed under the terms and conditions of the Creative Commons Attribution (CC BY) license (http://creativecommons.org/licenses/by/4.0/).